Predictive Control of vibration
23
Prediction and Control of Cutting Tool Vibration in Cnc Lathe with Anova and Ann S. S. Abuthakeer * Department of Mechanical Engineering, PSG College of Technology, Coimbatore, 641 004, India E-mail Adres: [email protected] P.V. Mohanram Department of Mechanical Engineering, PSG College of Technology, Coimbatore, 641 004, India G. Mohan Kumar Park College of Engineering and Technology, Avinashi Road, Kaniyur, Coimbatore 641 659, India A B S T R A C T K E Y W O R D S A R T I C L E I N F O Cutting tool vibration, Passive damping pad, Data acquisition, ANOVA, ANN. Received 20 February 2011 Accepted 23 February 2011 Available online 24 February 2011 Machining is a complex process in which many variables can deleterious the desired results. Among them, cutting tool vibration is the most critical phenomenon which influences dimensional precision of the components machined, functional behavior of the machine tools and life of the cutting tool. In a machining operation, the cutting tool vibrations are mainly influenced by cutting parameters like cutting speed, depth of cut and tool feed rate. In this work, the cutting tool vibrations are controlled using a damping pad made of Neoprene. Experiments were conducted in a CNC lathe where the tool holder is supported with and without damping pad. The cutting tool vibration signals were collected through a data acquisition system supported by LabVIEW software. To increase the buoyancy and reliability of the experiments, a full factorial experimental design was used. Experimental data collected were tested with analysis of variance (ANOVA) to understand the influences of the cutting parameters. Empirical models have been developed using analysis of variance (ANOVA). Experimental studies and data analysis have been performed to validate the proposed damping system. Multilayer perceptron neural network model has been constructed with feed forward back-propagation algorithm using the acquired data. On the completion of the experimental test ANN is used to validate the results obtained and also to predict the behavior of the system under any cutting condition within the operating range. The onsite tests show that the proposed system reduces the vibration of cutting tool to a greater extend. ________________________________ * Corresponding Author
description
Predictive control method applied in vibration analysis.
Transcript of Predictive Control of vibration

International Journal of Lean Thinking Volume 2, Issue 1 (June 2011)
Lean Thinkingjournal homepage: www.thinkinglean.com/ijlt
Prediction and Control of Cutting Tool Vibration in Cnc Lathe with Anova and Ann
S. S. Abuthakeer * Department of Mechanical Engineering, PSG College of Technology, Coimbatore, 641 004, India E-mail Adres: [email protected]
P.V. Mohanram Department of Mechanical Engineering, PSG College of Technology, Coimbatore, 641 004, India
G. Mohan Kumar Park College of Engineering and Technology, Avinashi Road, Kaniyur, Coimbatore 641 659, India
A B S T R A C T K E Y W O R D S
A R T I C L E I N F O
Cutting tool vibration,
Passive damping pad,
Data acquisition,
ANOVA,
ANN.
Received 20 February 2011
Accepted 23 February 2011
Available online 24 February 2011
Machining is a complex process in which many variables can
deleterious the desired results. Among them, cutting tool
vibration is the most critical phenomenon which influences
dimensional precision of the components machined, functional
behavior of the machine tools and life of the cutting tool. In a
machining operation, the cutting tool vibrations are mainly
influenced by cutting parameters like cutting speed, depth of cut
and tool feed rate. In this work, the cutting tool vibrations are
controlled using a damping pad made of Neoprene. Experiments
were conducted in a CNC lathe where the tool holder is
supported with and without damping pad. The cutting tool
vibration signals were collected through a data acquisition system
supported by LabVIEW software. To increase the buoyancy and
reliability of the experiments, a full factorial experimental design
was used. Experimental data collected were tested with analysis
of variance (ANOVA) to understand the influences of the cutting
parameters. Empirical models have been developed using analysis
of variance (ANOVA). Experimental studies and data analysis have
been performed to validate the proposed damping system.
Multilayer perceptron neural network model has been
constructed with feed forward back-propagation algorithm using
the acquired data. On the completion of the experimental test
ANN is used to validate the results obtained and also to predict
the behavior of the system under any cutting condition within the
operating range. The onsite tests show that the proposed system
reduces the vibration of cutting tool to a greater extend.
________________________________
* Corresponding Author

1. Introduction
The modern trend of machine tool development is required to produce precise, accurate and
reliable product which are gradually becoming more prominent features. The monitoring of
manufacturing processes and equipment conditions are the essential part of a critical strategy that
drives manufacturing industries towards being leaner and more competitive (Al-Habaibeh and
Gindy, 2000; Frankowiak et al., 2005). In a machining operation, vibration is frequent problem,
which affects the machining performance and in particular, the surface finish and tool life. Severe
vibration occurs in the machining environment due to a dynamic motion between the cutting tool
and the work piece. In all the cutting operations like turning, boring and milling, vibrations are
induced due to the deformation of the work piece, machine structure and cutting tool. In a
machining operation, forced vibration and self-excited vibration are identified as machining
vibrations.
Forced vibration is a result of certain periodical forces that exist within the machine, bad gear
such as drives, misalignment, and unbalanced machine tool components, etc. Self-excited vibration
is caused by the interaction of the chip removal process and the structure of the machine tool,
which results in disturbance in the cutting zone. The self-excited vibration affects the production
capacity, reliability and machining surface quality (Luke and Joseph, 2001).
Researchers have been trying to demonstrate tool condition monitoring approach in an end-
milling operation based on the vibration signal collected through a low-cost, microcontroller-based
data acquisition system (Julie and Joseph, 2008). Today, the standard procedure adopted to avoid
vibration during machining is by careful planning of the cutting parameters and damping of cutting
tool. The methods adopted to reduce vibration are based on experience as well as trial and error to
obtain suitable cutting parameters for each cutting operation.
Many sensors were used for tool condition monitoring system namely, touch sensors, power
sensors, vibration sensors, temperature sensors, force sensors, vision sensors, flow sensors, acoustic
emission sensors and so on (Jemielniak, 1999; Dimla, 2000; Xiaoli, 2002).
Tool wear sensing techniques are broadly classified into two categories: direct and indirect as
shown in Table 1. The direct tool wear monitoring methods can be applied when cutting tools are
not in contact with the work piece. However, direct methods of measuring tool wear have not been
easily adaptable for shop floor application. Indirect tool sensing methods use relationship between
cutting conditions and response of machining process which is a measurable quantity through
S. S. ABUTHAKEER, P. V. MOHANRAM, G. MOHANKUMAR /International Journal of Lean Thinking Volume 2, Issue 1 (June 2011)
2
sensor signals output (such as force, acoustic emission, vibration, or current) and may be used to
predict the condition of the cutting tool (Kurada and Bradley, 1997).
Table 1. Tool wear sensing methods
Direct methods Indirect methods
Electrical resistance Torque and power
Optical measurements Temperature
Radio-active Vibration & acoustic emission
Contact sensing Cutting forces & strain measurements
These indirect methods are used extensively by various researchers and detailed analyses have
been carried out in the past two decades. Nowadays, availability of computational power and
reliability of electronics help in the development of a reliable condition monitoring system by using
indirect methods. However, a problem in TCM system is selection of proper sensor and its location.
The sensors have to be placed as close as possible to the target location (close to the tool tip) being
monitored.
It is interesting to note that an indirect TCM system consists of four steps: (i) collection of data
in terms of signals from sensors such as cutting force, vibration, temperature, acoustic emission
and/or motor current, (ii) extraction of features from the signals, (iii) classification or estimation of
tool wear using pattern recognition, fuzzy logic, neural networks, or regression analysis, and (iv)
development of an adaptive system to control the machining process based on information from
the sensors (Kakade et al., 1995).
The researchers determine mean amplitude of vibration using accelerations in both directions
along the axes (Kirby and Chen, 2007). A computer program was developed using Visual Basic
programming language in order to analyze one and two degree of freedom of machine tool chatter
vibrations (Choudhury et al., 1996).
On-line vibration control system for turning operation uses a closed-loop feedback circuit
which measures the relative vibration between the cutting tool and the work piece (Taskesen,
2005). There have been many investigations on vibration prediction and controlling based on
periodic measurements of various machining conditions using accelerometer and active vibration
controller. Two generic techniques used for solving these vibration control problems are modifying
stiffness or the fundamental natural frequency of the specified components/subsystems, and their
damping (Eugene, 2007).
S. S. ABUTHAKEER, P. V. MOHANRAM, G. MOHANKUMAR /International Journal of Lean Thinking Volume 2, Issue 1 (June 2011)
3
Damping is the capacity of a mechanical system to reduce the intensity of a vibratory process.
The damping capacity can be due to interactions with outside systems or due to internal
performance- related interactions. The damping effect for a vibratory process is achieved by
transforming (dissipating) mechanical energy of the vibratory motion into other types of energy,
most frequently heat, which can be evacuated from the system.
Effects of damping on performance of mechanical systems are due to reduction of intensity of
undesirable resonances; acceleration decay(settling) of transient vibration excited by abrupt
changes in motion parameters of mechanical components; prevention or alleviation of self-excited
vibrations; prevention of impacts between vibrating parts when their amplitudes are reduced by
damping; potential for reduction of heat generation, and thus for increase in efficiency due to
reduced peak vibratory velocities of components having frictional or micro impacting interactions;
reduction of noise generation and of harmful vibrations transmitted to human operators and more.
Passive damping is now the major means of suppressing unwanted vibrations. The primary
effect of increased damping in a structure is a reduction of vibration amplitudes at resonances, with
corresponding decreases in stresses, displacements, fatigue and sound radiation. Designed in-
passive damping for any structure is usually based on one of four damping mechanisms: viscoelastic
materials, viscous fluids, magnetics or passive piezoelectric (Johnson, 1995).
Based on the literature survey, approximately 85 percent of the passive damping treatments in
actual applications are based on viscoelastic materials, with viscous devices being the second most
actively used (the use of viscous devices is greater for isolation and shock). In the present work
attempt has been made to predict and suppressing the vibration level of cutting tool in CNC lathe,
by using passive damping pad of viscoelastic material of neoprene. The study is extended to analyze
the influence of cutting parameters on the tool vibration during machining. The results obtained
have shown the effectiveness of the proposed solution that have been analyzed and discussed in
detail.
S. S. ABUTHAKEER, P. V. MOHANRAM, G. MOHANKUMAR /International Journal of Lean Thinking Volume 2, Issue 1 (June 2011)
4

2. Experimentation
Figure 1. Experimental setup
The experimental setup is shown in Figure 1. It includes a CNC -Galaxy –MIDAS-0 turning
center, a CCGT-09T30FL (Taegu Tec) turning insert, tool holder SCLC L2020 K09 T3(Taegu Tec), a
work piece (Al 6063 aluminum, Diameter 38 mm x 70mm length) without any cutting fluid. The
tool is instrumented with two accelerometers (Bruel & Kjaer 9.88mV/g- type 4517). The
accelerometers signals are taken to NI PXI 1042 – Q Data Acquisition Card system using LabVIEW
software. The vibration data was captured by Data Acquisition Card system. This system included
hardware selection, circuit design and implementation, hardware interface, circuit troubleshooting,
filtering, computer software programming, system integration, and testing in real CNC turning
processes. The following three sections describe the development of the hardware system, software
system, and integrating and testing of the data acquisition system along with the vibration data
analyses.
2.1 Hardware system
Vibration signals are important for monitoring tool condition in turning process.
Accelerometers were mounted in the cutting tool, one in the tangential direction of the tool holder
and the other one was placed in the axial direction of the tool holder for measuring vibration
amplitude in terms of accelerations (g-levels). A computer code has been developed in LabVIEW for
data acquisition, data storage and display. Fast Fourier Transform (FFT) computation algorithm was
included in the computer program to extract the vibration amplitude in the time and frequency
domain, which will be explained in software development section.
Accelerometers: Converts the physical acceleration into a voltage signal.
Signal conditioning circuit: Amplifies the voltage signal and improves the resolution.
Impact hammer Tail stock
support PXI 1042 Q with
monitor
Workpiece Cutting tool
S. S. ABUTHAKEER, P. V. MOHANRAM, G. MOHANKUMAR /International Journal of Lean Thinking Volume 2, Issue 1 (June 2011)
5
Personal computer: Runs the program, stores and display at any desired instant of time.
2.2 Software system
The software in this system consists of the following components.
An NC program that directs the CNC turning machine to cut the work piece.
Vibration data analysis and Fast Fourier Transform (FFT) analysis.
Main objective of the research work is to monitor the vibration level of cutting tool. So it is assumed
that the condition of the machine and its components is good in all other aspects such as
foundation of the machine, rigidity of the machine components (such as bed, spindle, tail stock
etc.) and so on. The simplest vibration analysis is conducted through collecting the “overall”
vibration amplitude Root Mean Square (RMS) value and plotting the vibration data in time domain
and frequency domain. The “overall” signal represents the total energy content of all vibration
sources at all frequencies.
2.3 Integration and testing of the data acquisition system
The Integration and testing of the data acquisition system is shown in figure 1. When tested in a
machining work piece, the sensor was protected to prevent any interference caused due to
machining chips.
2.3.1 – Modal Analysis – With and without damping pad
Any physical system can vibrate, the frequencies at which vibration naturally occurs, and the
modal shapes which the vibrating system assumes are properties of the system, and can be
determined using modal analysis. Modal analysis is frequently utilized to abstract the modal
parameters of a system, including natural frequencies, mode shapes and modal damping ratio.
Since these parameters depend only on the system itself but dominate the response of the system to
excitations, modal analysis is the fundamental response analysis and has therefore gained increasing
attentions.
The free vibration tests were carried out for the given cutting tool without any damping pad.
In the free vibration analysis test, an impact hammer (PCB-086C03) was used to excite the cutting
tool. An accelerometer was mounted on the tool holder and interfaced with a data acquisition card
and LabVIEW software to record the response of the cutting tool in time and frequency domains.
The impact pulse indicating the magnitude of input force was generated by the impact hammer.
S. S. ABUTHAKEER, P. V. MOHANRAM, G. MOHANKUMAR /International Journal of Lean Thinking Volume 2, Issue 1 (June 2011)
6

The frequency domain response was obtained by using signal analyzer available in sound and
vibration toolkit of Lab VIEW. The response of the tool holder captured in time and frequency
domains as shown in Figure 2.
Figure. 2 Vibration signal for response of the accelerometer of free vibration test (without damping
pad)
From the Figure 2, it is evident that, the fundamental natural frequency of the tool is about 3.4
kHz, acceleration of 12.5g and it takes about 0.95 seconds to settle down. The damping ratio is
calculated using Bandwidth method and the value is obtained as 0.0149 ( = 2 -1/ 2n). The
free vibration tests were carried out for the given cutting tool using damping pad made of
neoprene. The experimental modal analysis was repeated for the damping condition. The response
of the cutting tool is shown in Figure 3, from the figure, the fundamental natural frequency of the
cutting tool were found to be about 2.150 kHz, and it takes about 0.4 seconds to settle down. The
damping ratio was calculated as 0.06976.
Figure 3. Vibration signals for response of the accelerometer of free vibration test (with damping
pad)
Time (Sec)
Acc
eler
atio
n(g
)
Frequency (Hz)
Acc
eler
atio
n(g
)
Frequency (Hz)
Time (Sec)
Acc
ele
rati
on
(g)
Acc
ele
rati
on
(g)
S. S. ABUTHAKEER, P. V. MOHANRAM, G. MOHANKUMAR /International Journal of Lean Thinking Volume 2, Issue 1 (June 2011)
7

2.3.2 Dynamic Analysis - without damping pad
The vibration analysis was done without any damping pad under actual machining conditions.
In this analysis, a set of experiments were conducted with the cutting tool held in the tool holder as
shown in Figure 4.a. The two accelerometers mounted in both the tangential and axial directions
were used to collect the vibration signals.
The LabVIEW acquires the vibration signals and stored the signals continuously frame by frame
at every stage of cutting in on-line. The vibration data given in Figure 4 b is obtained while turning
with cutting speed of 250m/min, depth of cut of 0.5mm and feed rate of 0.1mm/rev. The dynamic
response of accelerometer without any damping pad is given in table 2.
Figure 4a. Cutting tool without damping pad
Figure 4b. Cutting tool vibration signals without damping pad
2.3.3 Dynamic Analysis with damping pad
In this set of experiments, the cutting tool is clamped with damping pad made of rubber
material called neoprene is shown in Figure 5 a. Same set of experiments were repeated as given in
previous section and vibration signals were collected with the use of damping pad. The cutting tool
vibration signals with damping pad at cutting speed of 250 m/min, depth of cut of 0.5 mm and feed
rate of 0.1 mm/rev is shown in Figure 5 b. The dynamic response of accelerometer with damping
pads is given in Table 2.
Accelerometer
in tangential direction
Accelerometer in axial direction
Turning insert
S. S. ABUTHAKEER, P. V. MOHANRAM, G. MOHANKUMAR /International Journal of Lean Thinking Volume 2, Issue 1 (June 2011)
8
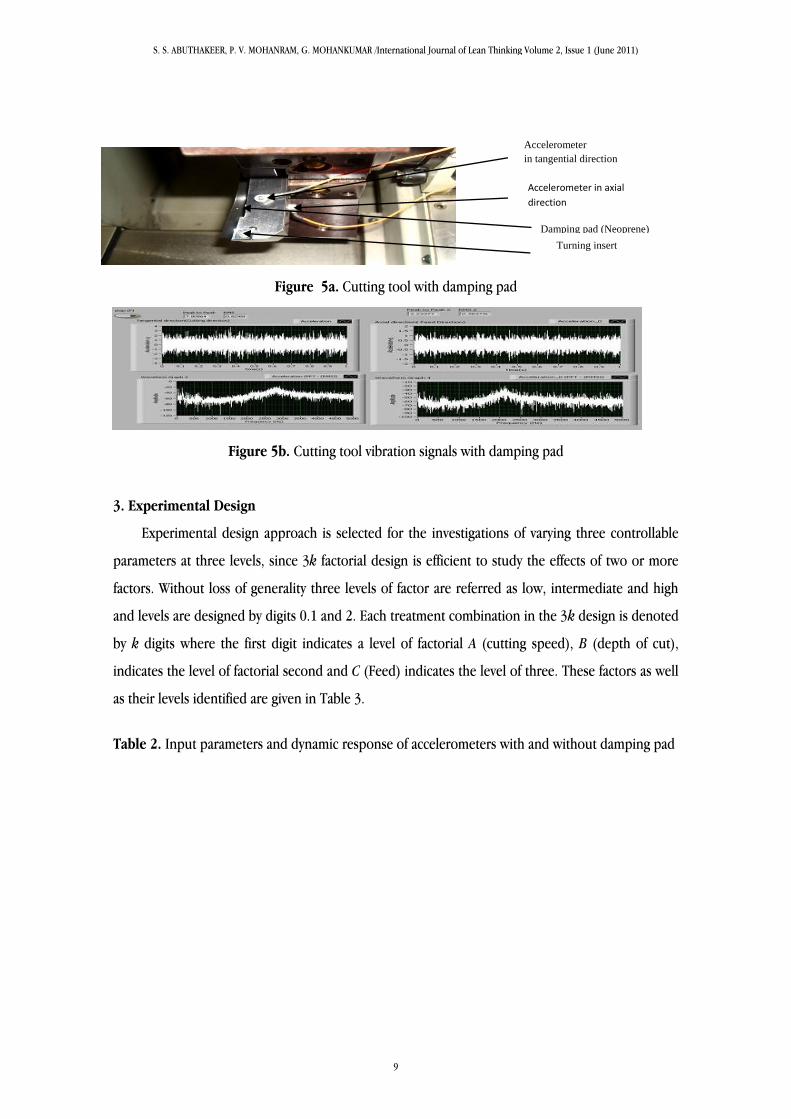
Figure 5a. Cutting tool with damping pad
Figure 5b. Cutting tool vibration signals with damping pad
3. Experimental Design
Experimental design approach is selected for the investigations of varying three controllable
parameters at three levels, since 3k factorial design is efficient to study the effects of two or more
factors. Without loss of generality three levels of factor are referred as low, intermediate and high
and levels are designed by digits 0.1 and 2. Each treatment combination in the 3k design is denoted
by k digits where the first digit indicates a level of factorial A (cutting speed), B (depth of cut),
indicates the level of factorial second and C (Feed) indicates the level of three. These factors as well
as their levels identified are given in Table 3.
Table 2. Input parameters and dynamic response of accelerometers with and without damping pad
Damping pad (Neoprene)
Accelerometer
in tangential direction
Turning insert
Accelerometer in axial
direction
S. S. ABUTHAKEER, P. V. MOHANRAM, G. MOHANKUMAR /International Journal of Lean Thinking Volume 2, Issue 1 (June 2011)
9

Table 3. Identified control factors and their levels
Variables or parameter Parameter designation Level 1 Level 2 Level 3
Cutting speed(m/min) A 150 200 250
Depth of cut(mm) B 0.5 0.75 1
Feed(mm/rev) C 0.1 0.2 0.3
S. S. ABUTHAKEER, P. V. MOHANRAM, G. MOHANKUMAR /International Journal of Lean Thinking Volume 2, Issue 1 (June 2011)
10

4. Results and Discussion
The vibration phenomenon for various cutting condition has been analyzed using LabVIEW
software. The plan of the experiment was developed to assess the effect of cutting speed, feed rate
and depth of the cut on the cutting tool vibration. Table 2 illustrates the experimental result of
vibration in both tangential and axial cutting direction. After analysis of the vibration, passive
damping pad is provided below the cutting tool elements. Now the same experiment was carried
out for various cutting condition and cutting tool vibration is measured and tabulated in Table 2.
Figure 6 displays the comparison of vibration of cutting tool at various cutting condition in
tangential direction without damping pad and with damping pad. Figure 7 displays the comparison
of vibration of cutting tool at various cutting condition in axial direction without damping pad and
with damping pad.
Legend: The upper curve shows vibration signal without damping and lower curve is with
damping.
Figure 6. Vibration of tool holder in Tangential-direction (RMS)
Figure 7. Vibration of tool holder in Axial-direction (RMS)
This passive damping pad dissipates energy at various cutting conditions. Due to this addition
of damping material in this experiment, the vibration level is reduced to 29.3129%. One of the
objectives of this study is to find the important factors and combination of factors influencing the
vibration level of cutting tool using the lower the better characteristics. The experimental results
were analyzed using analysis of variance (ANOVA), which is used for identifying the factors
significantly affecting the performance measures. The results are analyzed with MINITAB software.
The result of ANOVA analysis indicates that the depth of cut is the most influencing factor on the
vibration. The percentage of contribution shows that depth of cut 38%, cutting speed contributes
35% and feed rate contributes 27% only when amplitude of acceleration level of vibration is
measured. Therefore for the cutting tool vibration depth of cut was found to be the more significant
S. S. ABUTHAKEER, P. V. MOHANRAM, G. MOHANKUMAR /International Journal of Lean Thinking Volume 2, Issue 1 (June 2011)
11

parameter. According to the ANOVA response the best regression equation (1 & 2) obtained for
cutting tool vibration for both tangential and axial direction:
Vibration Level (VT) = - 3.50 + 0.0184 x1 + 3.92 x2 + 7.32 x3 (1)
Vibration Level (VA) = - 3.34 + 0.0217 x1 + 1.40 x2 + 5.48 x3 (2)
Where x1 = Cutting Speed , x2 = Depth of cut , x3 = Feed rate, VT = Vibration level in terms of
acceleration, g in tangential direction, VA = Vibration level in terms of acceleration, g in axial
direction. To perform the parametric study using these regression models, the relationships have
been drawn between the machining conditions and responses like Acceleration vs. Cutting speed,
Acceleration vs. Depth of cut, Acceleration vs. Feed rate (Figures 8a, 8b and 8c and 9a, 9b, and 9c).
Figure 8a. Variation of vibration level 1; Figure 8b. Variation of vibration levels 14; Figure 8c.
Variation of vibration levels 27
Figure 9a. Variation of vibration levels 1; Figure 9b. Variation of vibration levels 14; Figure 9c.
Variation of vibration levels 27
The error between the regression model values and experimental values are calculated as
follows:
(3)
E error between experimental data and regression model data
Ae the experimentally measured acceleration, g by using LabVIEW software
Ar the predicted acceleration, g, from regression equations
Acc
ele
rati
on
, g
Cutting speed, m/min
Experimental results
Regressionresults A
cce
lera
tio
n ,
g
Depth of cut , mm
Experimental results
Regressionresults A
cce
lera
tio
n, g
Feed rate, mm/rev
Experimental results
Regressionresults
Acc
ele
rati
on
, g
Cutting speed, m/min
Experrimentalresults
Regressionmodel results
Acc
ele
rati
on
, g
Depth of cut, mm
Experimentalresults
Regressionmodel results
Acc
ele
rati
on
, g
Feed rate, mm/rev
Experimentalresults
Regressionmodel results
S. S. ABUTHAKEER, P. V. MOHANRAM, G. MOHANKUMAR /International Journal of Lean Thinking Volume 2, Issue 1 (June 2011)
12

The error rate of tangential and axial direction of this model is calculated by using equation
number 3. The percentage error associated with each experiment is observed to be lower and is
well with the limit within a reasonable degree of approximation.
4.1 Main Effect, Interaction plot and Contour plot–Tangential direction
The main effect plot and the interaction plots (between Depth of cut, Cutting speed, and Feed
rate and Vibration level) have been shown in Figure 8 to 10 for tangential direction. Figure 8
shows the main effect plot for vibration level of cutting tool for various depth of cut, cutting speed
and feed rate, where the left side is for the cutting speed. It indicates that with increase in cutting
speed, there is a continuous increase in cutting tool vibration value. Cutting speed of 150 m/min
produces the lowest amplitude of vibration and 250 m/min produces the highest amplitude of
vibration. In figure 10, the right hand side is for the depth of cut and it shows that there is an
increase in depth of cut when there is a continuous increase in cutting tool vibration. Depth of cut
0.5 mm produces the lowest vibration and 1 mm produces the highest amplitude of vibration. At
the bottom of left hand side is for the feed rate and it shows that there is an increase in feed rate
there is a continuous increase in cutting tool vibration. Feed rate 0.1 mm/rev produces the lowest
vibration and 0.3 mm/rev produces the highest amplitude of vibration.
250200150
5.5
5.0
4.5
4.0
3.5
1.000.750.50
0.30.20.1
5.5
5.0
4.5
4.0
3.5
CS
Mean
of M
eans
DOC
FR
Main Effects Plot for MeansData Means
Figure 10. Main effect plot between cutting speed, depth of cut, feed rate and cutting tool vibration
in tangential direction
Figure 11.a. shows the interaction plot again shows a vibration level at 1mm DOC, Feed rate of
0.3 mm/rev. In this plot, the parallel trends of the lines clearly show very little interaction between
the factors. Figure 11.b. shows the interaction plot for amplitude level at 250 m/min CS, DOC 1mm.
In this plot, the parallel trends of the lines clearly shows very little or no interaction between the
two parameters. Figure 11.c. shows the interaction plot for amplitude level at 250 m/min CS, Feed
S. S. ABUTHAKEER, P. V. MOHANRAM, G. MOHANKUMAR /International Journal of Lean Thinking Volume 2, Issue 1 (June 2011)
13
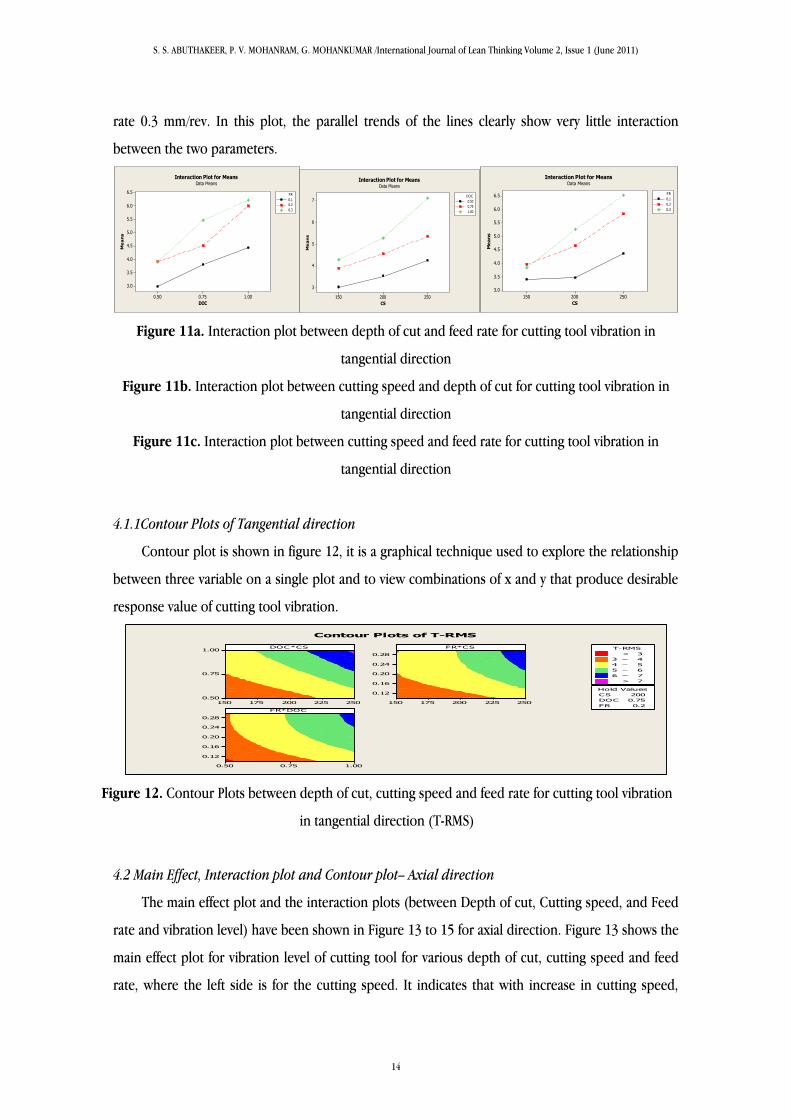
rate 0.3 mm/rev. In this plot, the parallel trends of the lines clearly show very little interaction
between the two parameters.
1.000.750.50
6.5
6.0
5.5
5.0
4.5
4.0
3.5
3.0
DOC
Me
an
s
0.1
0.2
0.3
FR
Interaction Plot for MeansData Means
250200150
7
6
5
4
3
CSM
ea
ns
0.50
0.75
1.00
DOC
Interaction Plot for MeansData Means
250200150
6.5
6.0
5.5
5.0
4.5
4.0
3.5
3.0
CS
Me
an
s
0.1
0.2
0.3
FR
Interaction Plot for MeansData Means
Figure 11a. Interaction plot between depth of cut and feed rate for cutting tool vibration in
tangential direction
Figure 11b. Interaction plot between cutting speed and depth of cut for cutting tool vibration in
tangential direction
Figure 11c. Interaction plot between cutting speed and feed rate for cutting tool vibration in
tangential direction
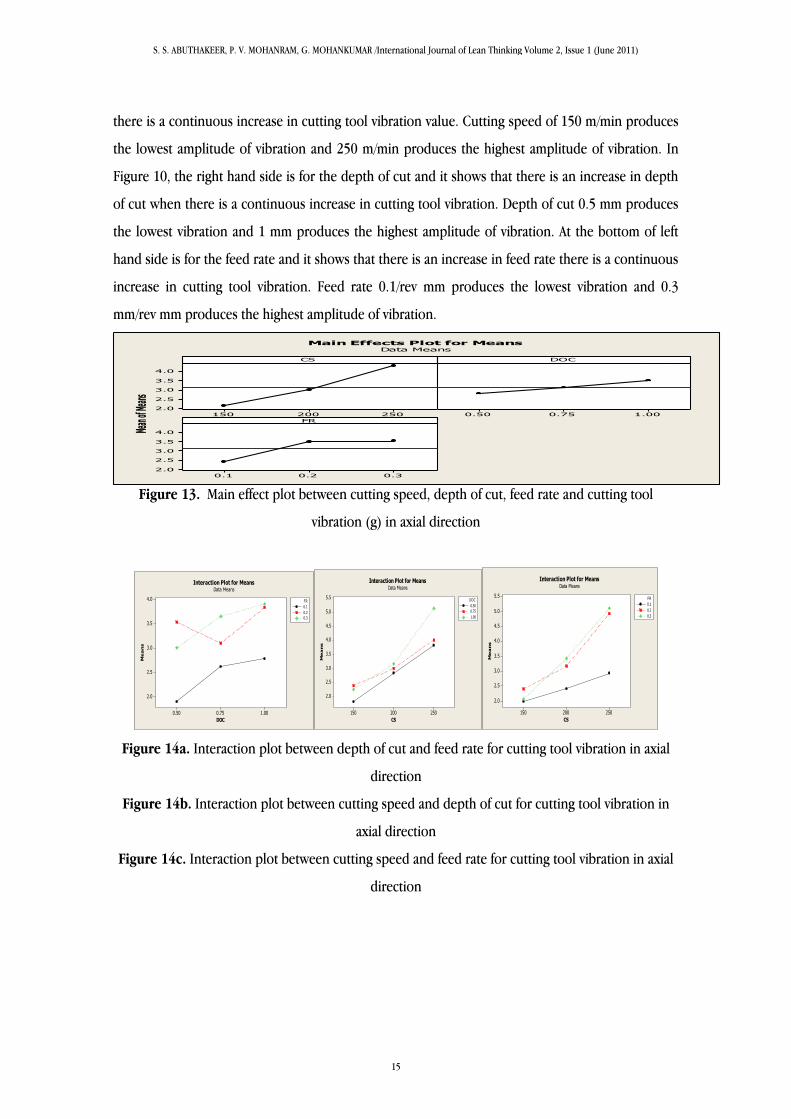
4.1.1Contour Plots of Tangential direction
Contour plot is shown in figure 12, it is a graphical technique used to explore the relationship
between three variable on a single plot and to view combinations of x and y that produce desirable
response value of cutting tool vibration.
DOC*CS
250225200175150
1.00
0.75
0.50
FR*CS
250225200175150
0.28
0.24
0.20
0.16
0.12
FR*DOC
1.000.750.50
0.28
0.24
0.20
0.16
0.12
CS 200
DOC 0.75
FR 0.2
Hold Values
>
–
–
–
–
< 3
3 4
4 5
5 6
6 7
7
T-RMS
Contour Plots of T-RMS
Figure 12. Contour Plots between depth of cut, cutting speed and feed rate for cutting tool vibration
in tangential direction (T-RMS)
4.2 Main Effect, Interaction plot and Contour plot– Axial direction
The main effect plot and the interaction plots (between Depth of cut, Cutting speed, and Feed
rate and vibration level) have been shown in Figure 13 to 15 for axial direction. Figure 13 shows the
main effect plot for vibration level of cutting tool for various depth of cut, cutting speed and feed
rate, where the left side is for the cutting speed. It indicates that with increase in cutting speed,
S. S. ABUTHAKEER, P. V. MOHANRAM, G. MOHANKUMAR /International Journal of Lean Thinking Volume 2, Issue 1 (June 2011)
14
there is a continuous increase in cutting tool vibration value. Cutting speed of 150 m/min produces
the lowest amplitude of vibration and 250 m/min produces the highest amplitude of vibration. In
Figure 10, the right hand side is for the depth of cut and it shows that there is an increase in depth
of cut when there is a continuous increase in cutting tool vibration. Depth of cut 0.5 mm produces
the lowest vibration and 1 mm produces the highest amplitude of vibration. At the bottom of left
hand side is for the feed rate and it shows that there is an increase in feed rate there is a continuous
increase in cutting tool vibration. Feed rate 0.1/rev mm produces the lowest vibration and 0.3
mm/rev mm produces the highest amplitude of vibration.
250200150
4.0
3.5
3.0
2.5
2.0
1.000.750.50
0.30.20.1
4.0
3.5
3.0
2.5
2.0
CS
Mean
of Me
ans
DOC
FR
Main Effects Plot for MeansData Means
Figure 13. Main effect plot between cutting speed, depth of cut, feed rate and cutting tool
vibration (g) in axial direction
1.000.750.50
4.0
3.5
3.0
2.5
2.0
DOC
Me
an
s
0.1
0.2
0.3
FR
Interaction Plot for MeansData Means
250200150
5.5
5.0
4.5
4.0
3.5
3.0
2.5
2.0
CS
Me
an
s
0.50
0.75
1.00
DOC
Interaction Plot for MeansData Means
250200150
5.5
5.0
4.5
4.0
3.5
3.0
2.5
2.0
CS
Me
an
s
0.1
0.2
0.3
FR
Interaction Plot for MeansData Means
Figure 14a. Interaction plot between depth of cut and feed rate for cutting tool vibration in axial
direction
Figure 14b. Interaction plot between cutting speed and depth of cut for cutting tool vibration in
axial direction
Figure 14c. Interaction plot between cutting speed and feed rate for cutting tool vibration in axial
direction
S. S. ABUTHAKEER, P. V. MOHANRAM, G. MOHANKUMAR /International Journal of Lean Thinking Volume 2, Issue 1 (June 2011)
15
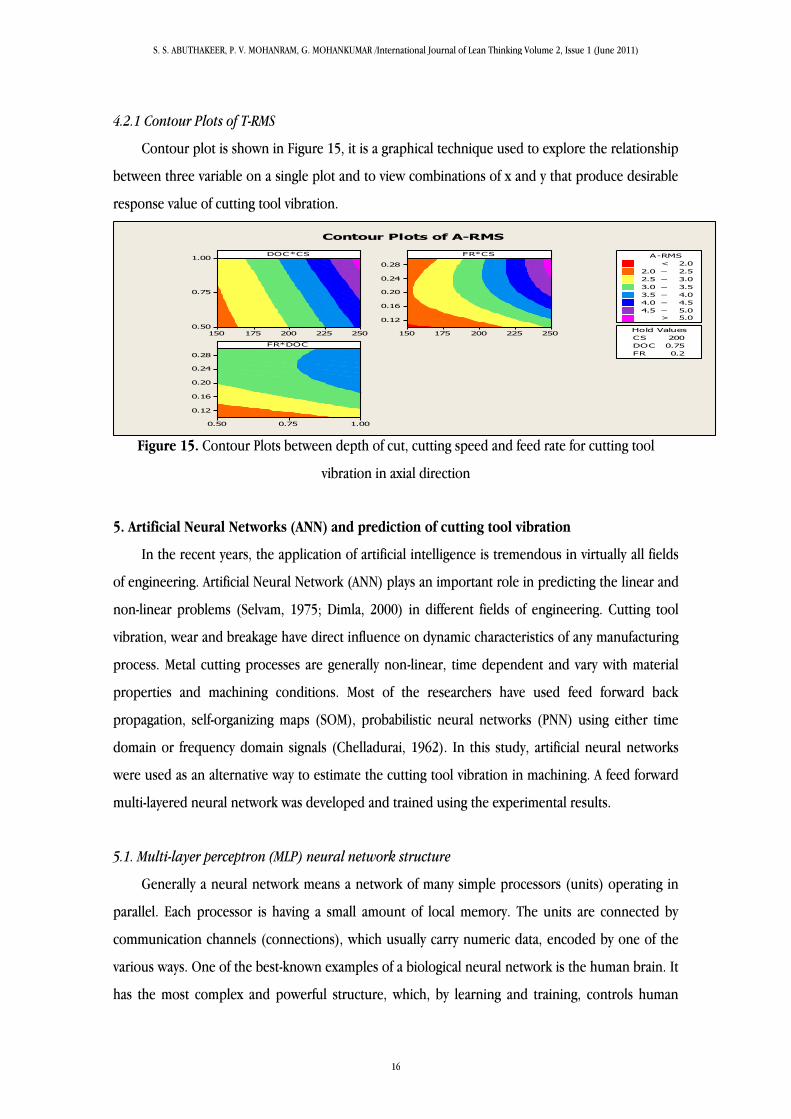
4.2.1 Contour Plots of T-RMS
Contour plot is shown in Figure 15, it is a graphical technique used to explore the relationship
between three variable on a single plot and to view combinations of x and y that produce desirable
response value of cutting tool vibration.
DOC*CS
250225200175150
1.00
0.75
0.50
FR*CS
250225200175150
0.28
0.24
0.20
0.16
0.12
FR*DOC
1.000.750.50
0.28
0.24
0.20
0.16
0.12
CS 200
DOC 0.75
FR 0.2
Hold Values
>
–
–
–
–
–
–
< 2.0
2.0 2.5
2.5 3.0
3.0 3.5
3.5 4.0
4.0 4.5
4.5 5.0
5.0
A-RMS
Contour Plots of A-RMS
Figure 15. Contour Plots between depth of cut, cutting speed and feed rate for cutting tool
vibration in axial direction
5. Artificial Neural Networks (ANN) and prediction of cutting tool vibration
In the recent years, the application of artificial intelligence is tremendous in virtually all fields
of engineering. Artificial Neural Network (ANN) plays an important role in predicting the linear and
non-linear problems (Selvam, 1975; Dimla, 2000) in different fields of engineering. Cutting tool
vibration, wear and breakage have direct influence on dynamic characteristics of any manufacturing
process. Metal cutting processes are generally non-linear, time dependent and vary with material
properties and machining conditions. Most of the researchers have used feed forward back
propagation, self-organizing maps (SOM), probabilistic neural networks (PNN) using either time
domain or frequency domain signals (Chelladurai, 1962). In this study, artificial neural networks
were used as an alternative way to estimate the cutting tool vibration in machining. A feed forward
multi-layered neural network was developed and trained using the experimental results.
5.1. Multi-layer perceptron (MLP) neural network structure
Generally a neural network means a network of many simple processors (units) operating in
parallel. Each processor is having a small amount of local memory. The units are connected by
communication channels (connections), which usually carry numeric data, encoded by one of the
various ways. One of the best-known examples of a biological neural network is the human brain. It
has the most complex and powerful structure, which, by learning and training, controls human
S. S. ABUTHAKEER, P. V. MOHANRAM, G. MOHANKUMAR /International Journal of Lean Thinking Volume 2, Issue 1 (June 2011)
16

behavior towards responding any problem encountered in everyday life. As for the ANN, they have
been developed to try to emulate this biological network for the purpose of learning the solution to
a physical problem from a given set of data.
In this study, an attempt has been made to estimate the vibration level using Multi-layer
perceptron’s (MLP) architecture. The feed forward back propagation algorithm is chosen for
training and testing the experimental data. Additionally, training algorithms, number of nodes,
transfer functions and number of layers are varied to study the behaviors of networks and to arrive
at an optimum configuration.
A multi-layer perceptron (MLP) is a feed forward network consisting of neurons in an input
layer, one or more hidden layers and an output layer. The different layers are fully interconnected
such that each neuron in one layer is connected to all neurons in the next layer. The input layer,
which is also called the “buffer” layer, performs no information processing. Each of its neurons has
only one input, and it simply transmits the value at its input to its output. Actual information
processing is performed by the neurons in the hidden and output layers. Signals are transmitted
unit directionally from the input layer through the hidden layers to the output layer. Information is
stored in the inter-neuron connections. Learning consists of adapting the strengths (or weights)of
the connections so that the network produces desired output patterns corresponding to given
input patterns. In other words, we can train a neural network to perform a particular function by
adjusting the values of the connections (weights) between neurons. As each input is applied to the
network, the network output is compared to the target. The error is calculated as the difference
between the target output and the network output. We want to minimize the average of the sum of
these errors. Each hidden or output neuron receives a number of weighted input signals from each
of the units of the preceding layer and generates only one output value.
The mathematical model of an artificial neuron’s behavior is the simplification of the biological
brain neuron shown in Figure 16. Typically, a neuron has more than one input. A neuron with R
inputs. The individual inputs p1, p2, p3 ………pR are each weighted by corresponding elements w1, w2,
w3 ……w1,R of the weight matrix W.
S. S. ABUTHAKEER, P. V. MOHANRAM, G. MOHANKUMAR /International Journal of Lean Thinking Volume 2, Issue 1 (June 2011)
17
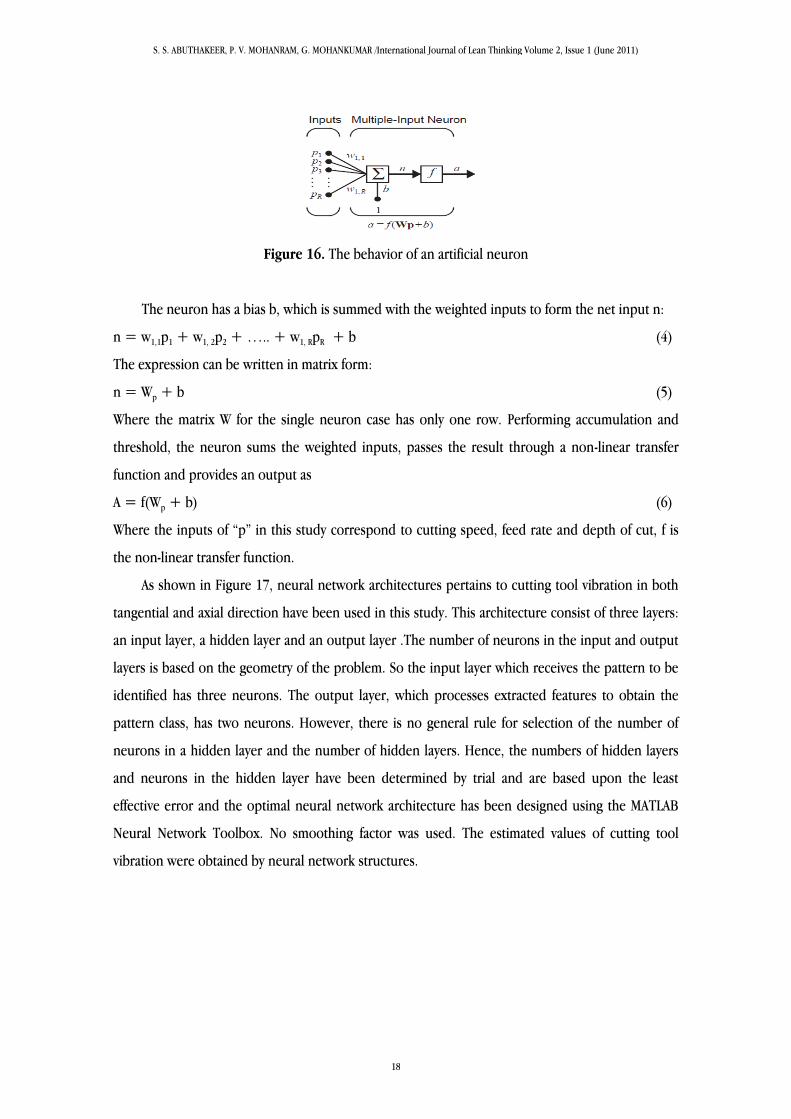
Figure 16. The behavior of an artificial neuron
The neuron has a bias b, which is summed with the weighted inputs to form the net input n:
n = w1,1p1 + w1, 2p2 + ….. + w1, RpR + b (4)
The expression can be written in matrix form:
n = Wp + b (5)
Where the matrix W for the single neuron case has only one row. Performing accumulation and
threshold, the neuron sums the weighted inputs, passes the result through a non-linear transfer
function and provides an output as
A = f(Wp + b) (6)
Where the inputs of “p” in this study correspond to cutting speed, feed rate and depth of cut, f is
the non-linear transfer function.
As shown in Figure 17, neural network architectures pertains to cutting tool vibration in both
tangential and axial direction have been used in this study. This architecture consist of three layers:
an input layer, a hidden layer and an output layer .The number of neurons in the input and output
layers is based on the geometry of the problem. So the input layer which receives the pattern to be
identified has three neurons. The output layer, which processes extracted features to obtain the
pattern class, has two neurons. However, there is no general rule for selection of the number of
neurons in a hidden layer and the number of hidden layers. Hence, the numbers of hidden layers
and neurons in the hidden layer have been determined by trial and are based upon the least
effective error and the optimal neural network architecture has been designed using the MATLAB
Neural Network Toolbox. No smoothing factor was used. The estimated values of cutting tool
vibration were obtained by neural network structures.
S. S. ABUTHAKEER, P. V. MOHANRAM, G. MOHANKUMAR /International Journal of Lean Thinking Volume 2, Issue 1 (June 2011)
18
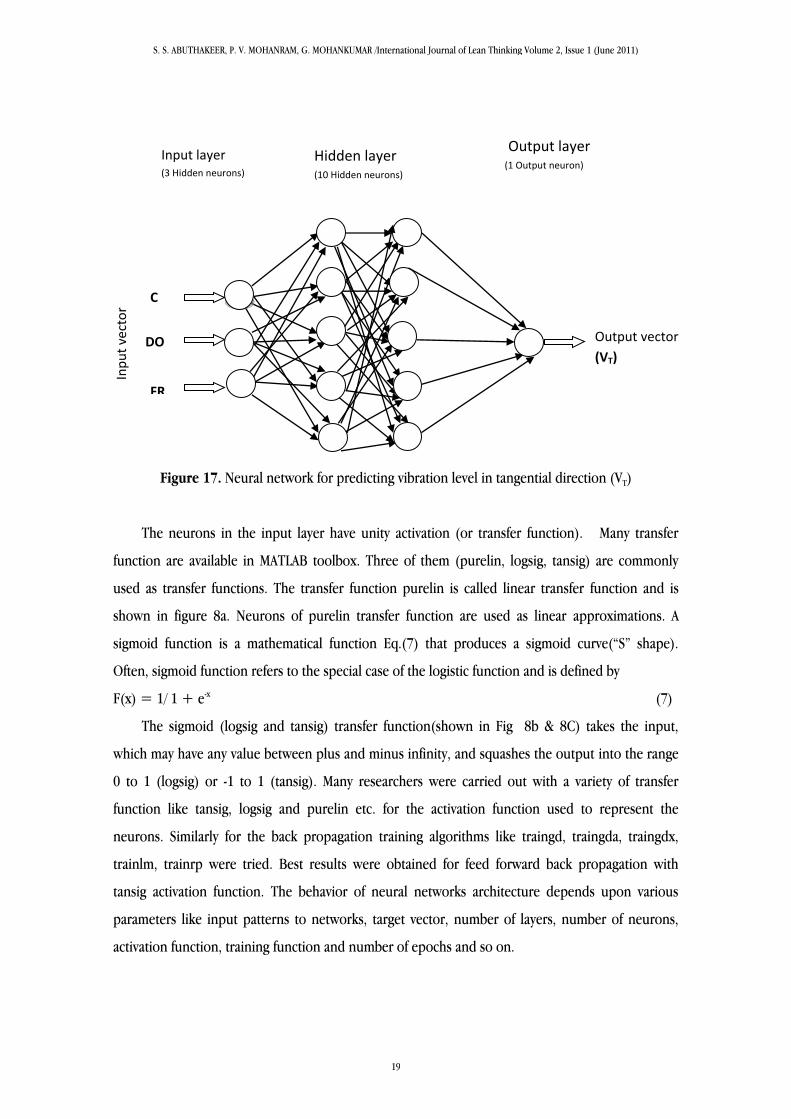
Figure 17. Neural network for predicting vibration level in tangential direction (VT)
The neurons in the input layer have unity activation (or transfer function). Many transfer
function are available in MATLAB toolbox. Three of them (purelin, logsig, tansig) are commonly
used as transfer functions. The transfer function purelin is called linear transfer function and is
shown in figure 8a. Neurons of purelin transfer function are used as linear approximations. A
sigmoid function is a mathematical function Eq.(7) that produces a sigmoid curve(“S” shape).
Often, sigmoid function refers to the special case of the logistic function and is defined by
F(x) = 1/ 1 + e-x (7)
The sigmoid (logsig and tansig) transfer function(shown in Fig 8b & 8C) takes the input,
which may have any value between plus and minus infinity, and squashes the output into the range
0 to 1 (logsig) or -1 to 1 (tansig). Many researchers were carried out with a variety of transfer
function like tansig, logsig and purelin etc. for the activation function used to represent the
neurons. Similarly for the back propagation training algorithms like traingd, traingda, traingdx,
trainlm, trainrp were tried. Best results were obtained for feed forward back propagation with
tansig activation function. The behavior of neural networks architecture depends upon various
parameters like input patterns to networks, target vector, number of layers, number of neurons,
activation function, training function and number of epochs and so on.
Output vector
(VT) DO
C
C
S
Inp
ut
vect
or
Input layer (3 Hidden neurons)
Hidden layer (10 Hidden neurons)
Output layer
(1 Output neuron)
FR
S. S. ABUTHAKEER, P. V. MOHANRAM, G. MOHANKUMAR /International Journal of Lean Thinking Volume 2, Issue 1 (June 2011)
19
In this study, for development of the model, 81% data were used for the training and the 19%
data for the testing. The boldfaced values of parameters in Table 2 were not used for developing the
model but were reserved for verification of the model. Several networks have been tried and the
parameter values presented in Table 4 have been found to yield sufficiently accurate results.
Table 4. The optimum values of network parameters
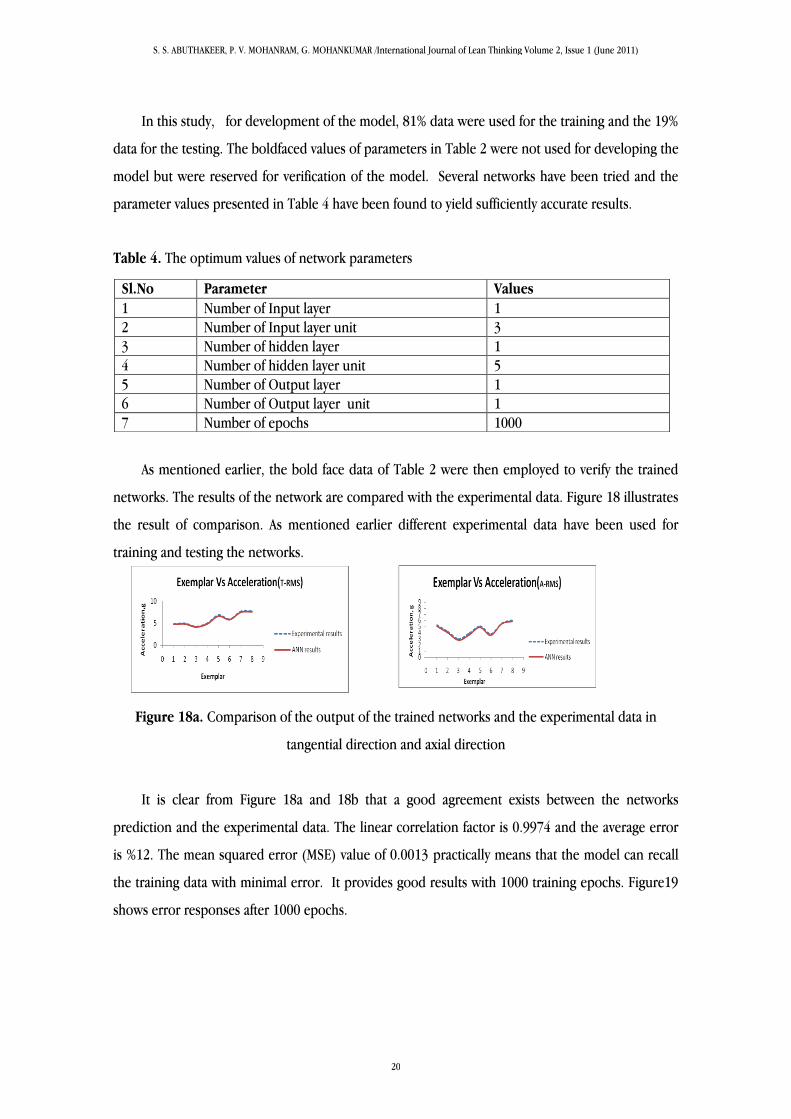
As mentioned earlier, the bold face data of Table 2 were then employed to verify the trained
networks. The results of the network are compared with the experimental data. Figure 18 illustrates
the result of comparison. As mentioned earlier different experimental data have been used for
training and testing the networks.
Figure 18a. Comparison of the output of the trained networks and the experimental data in
tangential direction and axial direction
It is clear from Figure 18a and 18b that a good agreement exists between the networks
prediction and the experimental data. The linear correlation factor is 0.9974 and the average error
is %12. The mean squared error (MSE) value of 0.0013 practically means that the model can recall
the training data with minimal error. It provides good results with 1000 training epochs. Figure19
shows error responses after 1000 epochs.
Sl.No Parameter Values
1 Number of Input layer 1
2 Number of Input layer unit 3
3 Number of hidden layer 1
4 Number of hidden layer unit 5
5 Number of Output layer 1
6 Number of Output layer unit 1
7 Number of epochs 1000
S. S. ABUTHAKEER, P. V. MOHANRAM, G. MOHANKUMAR /International Journal of Lean Thinking Volume 2, Issue 1 (June 2011)
20

Figure 19. MSE versus epochs during training step
6. Conclusions
In this course of study, Experiments were conducted on CNC lathe using CCGT-0930FL
carbide turning insert, machining variables such as cutting tool vibration in tangential and axial
direction were measured in CNC machining processes based on the vibration signal collected
through a LabVIEW data acquisition system and controlled by using Viscoelastic material (VEM)
neoprene. The effect of cutting parameters such as cutting speed, depth of cut and feed rate on
machining variables is evaluated. The testing result showed that the developed method was
successful. Based on the current study, the following conclusions can be drawn:
From the modal analysis the signals peaks exhibit response in a particular natural frequency
range 3400 Hz without any damping pad. The natural frequencies were shifted to 2150 Hz
with neoprene damping pad.
It is observed that the natural frequency shifts away from the operating frequency thereby
avoiding the resonance condition of cutting tool.
The cutting tool damping ratio is improved from 0.0149 to 0.06976 with neoprene pad which
indicates that the use of cutting tool pad helps to improve the cutting tool life.
The vibration level in tangential and axial direction were found to be reduced by 60 % and
78.5% with neoprene damping pad
The Fast Fourier Transform (FFT) function and its graphic display were integrated in to the
software program developed by LabVIEW. Data were visualized in real-time.
Passive damping can provide substantial performance benefits in many kinds of structures and
machines, often without significant weight or cost penalties. In all aspects of the studies
performed, a significant reduction in tool vibration during machining was achieved for a CNC
machining operations.
S. S. ABUTHAKEER, P. V. MOHANRAM, G. MOHANKUMAR /International Journal of Lean Thinking Volume 2, Issue 1 (June 2011)
21

The method presented effectively measure and control cutting tool vibration. The goal of this
research is successfully met.
A multiple regression model has been developed and validated with experimental results.
An analysis of variance (ANOVA) was made and it was found that the depth of cut (38%
contribution), cutting speed (35% contribution) and Feed rate (27% contribution) has greater
influence on cutting tool vibration. From the experimental results demonstrate that the depth
of cut and cutting speed are the main parameters among the three controllable factors (depth
of cut, cutting speed and feed rate) that influence the vibration of cutting tool in turning Al
6063 aluminum.
Contour plot shows the relationship between three variables on a single plot. It also helps in
viewing combinations of x and y that produce desirable response values of vibration level.
ANN has been used to learn the collected data. Neural network configuration was (3-10-1)
was trained. The results of neural network model showed close matching between the model
output and the directly measured cutting tool vibration. This method seems to have prediction
potentials for non-experimental pattern additionally. ANN methodology consumes lesser time
giving higher accuracy. It is also found that a large number of hidden layers did not help boost
classification accuracy and MLP neural network models have been quite sensitive to the
training parameter settings; to optimize the classification performance.
Hence, this study helps to promote the operational use of neural networks for land cover
classification.
Further study could consider more cutting parameters, tool geometries and different work
piece materials, lubricant and cooling strategy in the research to see how the factors would affect
vibration level.
References
Al-Habaibeh A. and Gindy N. A new approach for systematic design of condition monitoring systems
for milling operation. Journal of Material Processing Technology, 2000; 107: 243-251.
Chelladurai C.W.G. Cox GM Experimental Designs. Wiley, 1962; New York.
Choudhury S.K., Goudimenko N.N. and Kudinov V.A. On-Line control of machine tool vibration in
turning. International Journal of Machine Tools & Manufacturing, 1996; 37 (6): 801-811.
S. S. ABUTHAKEER, P. V. MOHANRAM, G. MOHANKUMAR /International Journal of Lean Thinking Volume 2, Issue 1 (June 2011)
22
Dimla D.E. Sensors signals for tool-wear monitoring in metal cutting operations - A Review of
methods. International Journal of Machine tools and Manufacture, 2000; 40: 1073–
1098.
Eugene I. Stiffness and damping in mechanical design. 2007; 494.
Frankowiak M., Grosvenor R. and Prickett P. A review of the evolution of microcontroller-based
machine and process monitoring. International Journal of Machine Tools & Manufacturing,
2005; 45: 578-582.
Jemielniak K. Commercial tool condition monitoring systems. International Journal of Advanced
Manufacturing Technology, 1999, 15 (4): 711–721.
Johnson C.D. Design of Passive Damping Systems. Journal of Mechanical Design. 1995, 117: 171-
177.
Julie Z.Z. and Joseph C.C. Tool condition monitoring in an end-milling operation based on the
vibration signal collected through a microcontroller-based data acquisition system.
International Journal of Advanced Manufacturing Technology, 2008; 39: 118-128.
Kakade S., Vijayaraghavan L. and Krishnamurthy R. Monitoring of tool status using intelligent
acoustic emission sensing and decision based neural network. IEEE: 1995, 25–29.
Kirby E.D. and Chen J.C. Development of a fuzzy-net based surface roughness prediction system in
turning operations. International Journal of Computer & Industrial Engineering, 2007, 53:
30–42.
Kurada S. and Bradley C. A review of machine vision sensors for tool condition monitoring.
Computers in Industry, 1997; 34: 55–72.
Luke H.H. and Joseph C.C. A Multiple Regression Model to predict In-process surface roughness in
turning operation via Accelerometer. Journal of Industrial Technology, (Internet”(
www.nait.org)., 2001; 17 (2): 2-7.
Selvam M.S. Tool vibration and its influence on surface roughness in turning. Wear, 1975; 35: 149-
157.
Taskesen A. Computer aided nonlinear analysis of machine tool vibrations and developed computer
software. Mathematical and computation Applications, 2005; 3: 377-385.
Xiaoli Li. A brief review: acoustic emission method for tool wears monitoring during turning.
International Journal of Machine tools and Manufacture, 2002; 42:157–165.
S. S. ABUTHAKEER, P. V. MOHANRAM, G. MOHANKUMAR /International Journal of Lean Thinking Volume 2, Issue 1 (June 2011)
23