Report as of September 30, 2009 - centrotherm.de & Wafer Solar cell & Module ... (23% by 2020)...
37
Report as of September 30, 2009 November 11, 2009 Silicon & Wafer Solar Cell & Module Thin Film Semiconductor
Transcript of Report as of September 30, 2009 - centrotherm.de & Wafer Solar cell & Module ... (23% by 2020)...

Silicon & Wafer
Solar cell & Module
Thin film module
Semiconductor
Report as of September 30, 2009November 11, 2009
Silicon & Wafer
Solar Cell & Module
Thin Film
Semiconductor

2© centrotherm photov oltaics AG Report as of September 30, 2009
Disclaimer
We have exercised utmost care in the preparation of this presentation. It contains
forecasts and/or information relating to forecasts. Forecasts are based on facts,
expectations, and/or past figures. As with all forward-looking statements, forecasts are
connected with known and unknown uncertainties, which may mean the actual result
deviates significantly from the forecast. Forecasts prepared by third parties, or data or
evaluations used by third parties and mentioned in this communication, may be
inappropriate, incomplete, or falsified. We cannot assess whether information,
evaluations, or forecasts made by third parties are appropriate, complete, and not
misleading. To the extent that information in this presentation has been taken from third
parties, or these provide the basis of our own evaluations, such use is made known in this
report. As a result of the above-mentioned circumstances, we can provide no warranty
regarding the correctness, completeness, and up-to-date nature of information taken, and
declared as being taken, from third parties, as well as for forward-looking statements,
irrespective of whether these derive from third parties or ourselves.
Rounding differences may arise.

3© centrotherm photov oltaics AG Report as of September 30, 2009
Contents
2. Highlights
3. Financial Results
4. Outlook
5. Appendix
1. centrotherm photovoltaics at a Glance

4© centrotherm photov oltaics AG Report as of September 30, 2009
centrotherm photovoltaics at a Glance
Silicon & Wafer Solar cell & Module Thin film
� Technology and equipment supplier for PV industry
� Market-leading player of turnkey crystalline solar cell production lines
� Competitive advantages:
� Leading in technology
� Unique offering over full PV value chain
� Lowest cost of ownership solutions
Technology &
Equipment
Key Figures 2007 2008
Employees: 178 1,050
Sales: € 166 million € 375 million
EBIT: € 21 million € 43 million
Business
Divisions
Semiconductor &
Microelectronics
Turnkey Production Plants - Turnkey Lines - Key Equipment - Services

5© centrotherm photov oltaics AG Report as of September 30, 2009
PV Markets
USA:
� Biggest mid-term PV market
potential
� Strong support of renewable energy and PV market & industry
by President Obama
Germany:
� Biggest PV market 2009 >2GW
� New government will keep EEG
and further support PV� Most established PV market
India:
� 20GW installation till 2020� Strong PV support by
government
� Huge emerging PV market
China:
� Biggest PV production
� Strong PV subsidy programs
(Golden Sun, Solar Roofs Program,…)
� 2 GW PV installation till 2011
Japan:
� Longest PV market history
� New PV roof-top program
France:
� Strong support of BIPV (highest PV subsidies with 0.60 €/kWh)
� Further support of renewable
energy generation (23% by 2020)
Spain:
� Biggest market 2008 with 2.5 GW
� Introduction of 500 MW cap has
reduced global PV-market
significantly, but good long term outlook and established PV-
market
Italy:
� Potential of fast growing PV
market (strong public support)
� More governmental support and
less bureaucracy for PV approval needed

6© centrotherm photov oltaics AG Report as of September 30, 2009
Strategy 2010+ - Silicon & Wafer
� Silicon prices stabilizing -> Target production costs: < 20 €/kg by end 2011
� CTN assumption: Future demand coming from countries with new subsidy PV programs -> They will install polysilicon production (e.g. Ukraine)
� centrotherm photovoltaics has aligned product portfolio to new Chinese polysiliconmanufacturer requirements
� Expansion investments as future growth driver
� Focus on sustainable products and technology (e.g. VGR)
� Focus on expansion business by cost reduction of 10-20%:
� Extended basic engineering concept
� Single equipment with highest performance parameters
� Fully integrated factory
� Upgrade of existing facilities
Market Trends
Product / Technology Strategy

7© centrotherm photov oltaics AG Report as of September 30, 2009
Strategic Focus: Cost Reduction and Sustainability
Polysilicon Ingoting Wafering
Interface Optimization
~ 12…..15 %
Interface Optimization
~ 5…..10 %
Saving potential
OpEx (€/kg)
Scope of
performance
TCS synthesis unitReactor & Converter
Vent gas recovery
Crystallization
furnaceWire saw
Up to 30%
(relative)
in process section saving
Saving
potential ~ 40-50% in
3-5 years
~ 20 % ~ 10 %

8© centrotherm photov oltaics AG Report as of September 30, 2009
Market Focus: Chinese Polysilicon Regulations
� Output more than 3.000 t/a yes
� Limited area / factory site <6ha/kt yes (Basic engineering)
yes, modified reactor
� Vent gas recovery ratio: yes
Efficiency of the total recovery system
� 98,5% (SiCl4)
� 99% (HCl, H2)
New Chinese requirements for polysilicon projects centrotherm Technology / Equipment
� Maximal power consumption for solar grade deposition < 60 kWh/kg

9© centrotherm photov oltaics AG Report as of September 30, 2009
Strategy 2010+ - Solar Cell & Module
� Increasing investments in solar parks
� Increasing capacity utilization rates of solar cell & wafer producers
� First signs of price stabilization
� Increasing demand since exhibition in Hamburg in September 2009
� centrotherm photovoltaics working at full capacity until spring 2010
� Shorter order cycles
� Focus on highest efficiency
� Selective emitter technology
� Direct plasma process
� Focus on De-Engineering (“Minimal concept”)
� Interdependency between solar cell & module
� Module technology with customized modules
� M&A analysis on wet chemistry & automation equipment (Europe, Asia, USA)
Market Trends
Product / Technology Strategy

10© centrotherm photov oltaics AG Report as of September 30, 2009
- Guaranteed performance parameters like in all centrotherm turnkey
factories (Yield, throughput, certified module, project schedule)
- Guaranteed, very competitive module power, in combination with FlexLine + cell technology (Selective emitter)
- Cell structure and process flow optimized for high module power
- Low CoO, e.g. by optimization of consumables (Pastes, etc.)
Integrated Solar Cell & Module Approach
Integrated solar cell and module factory

11© centrotherm photov oltaics AG Report as of September 30, 2009
Strategy 2010+ - Thin film
� Future demand for thin film modules coming from solar parks and buildings
� Thin film technology under price pressure
� Only high efficiency thin film is competitive on the market
� Focus on sustainable products and technology
� Focus on highest efficiency -> CIGS with highest potential
� In general production costs must come below level
of solar cell module production costs
Market Trends
Product / Technology Strategy

12© centrotherm photov oltaics AG Report as of September 30, 2009
Contents
2. Highlights
3. Financial Results
4. Outlook
5. Appendix
1. centrotherm photovoltaics at a Glance

13© centrotherm photov oltaics AG Report as of September 30, 2009
Highlights
Continuing sales and earnings growth
� Sales: € 374.7 million (+ 58.1%)
� EBITDA: € 50.7 million (+62.3%)
� EBIT: € 35.5 million (+16.8%)
New offices in Blaubeuren are near completion
Shanghai – Registered office of third Asian sales & service company

14© centrotherm photov oltaics AG Report as of September 30, 2009
Crystallization furnace
Product Updates
New version of crystallization
furnace
� Higher performance output
(7.5 MWp per year)
� Shorter process cycles
(average: ~56 hours)
� Substantial less process
variations
POCl3Diffusion furnace Thin film module from own R&D production line
New generation of tube furnaces for
diffusion and oxidation
� 25% greater capacity
� Simplified automation
� More streamlined design
New Turnkey-Line FlexLine Plus with
patented selective emitter technology
Efficiencies:
� Mono-Si:18%
� Multi-Si: 16.6%
Silicon & Wafer Solar cell & Module Thin film
Achievement of 13% efficiency
at pilot line
� Patented production
process translates to
competitive advantages
� Pilot line enables efficient
technology transfer to
production
� Efficiencies of up to 12% for
turnkey lines expected

15© centrotherm photov oltaics AG Report as of September 30, 2009
Research and Development
Research and development expenses 9M 2009: € 19.4 million R&D ratio: 5.2%
Intensifying our R&D activities in Constance
Silicon & Wafer Solar cell & Module Thin film
R&D Expenses:
R&D Activities:
€ 6.1 million € 7.8 million(including semiconductors of € 0.4 million)
€ 5.5 million
� Further productivity
improvements of
crystallization furnace
� Design of new CVD
reactors and high pressure converter completed
� FlexLine Plus with
selective emitter front side
technology shows efficiency of >18%
� Development of new back side technology started
� Development of CVD
equipment with higher
throughput
� Development of new
analytics “in situ XRD”
� Efficient process transfer
from pilot line to production
line
� Cell efficiency of 13% realized in laboratory

16© centrotherm photov oltaics AG Report as of September 30, 2009
Project Status - Abstract (1)
Silicon & Wafer:
Delivery completed
Preparation of installationChinaConfidential
Move in / EquipmentTaiwanTaiwan Polysilicon
Corporation
Ramp-upChinaShaanxi
Project executed (FAT)ChinaAsia Silicon
Preparation of deliveryChinaConfidential
Preparation of deliveryUkraineConfidential
Preparation of deliveryChinaConfidential
StatusCountryProject

17© centrotherm photov oltaics AG Report as of September 30, 2009
Project Status - Abstract (2)
Hyundai Heavy Industries Co., Ltd. in South Korea
Solar cell & Module:
� Solar cell turnkey production plant up and running
� Capacity: 250 MW
� Enabling industrial entry into photovoltaics market
Thin film:
� Commissioning of first CIGS turnkey production
line at Asian customer in progress
� New CIGS module manufacturing process
established
� “First Module Out” expected by the end of 2009Sunshine PV in Taiwan
18© centrotherm photov oltaics AG Report as of September 30, 2009
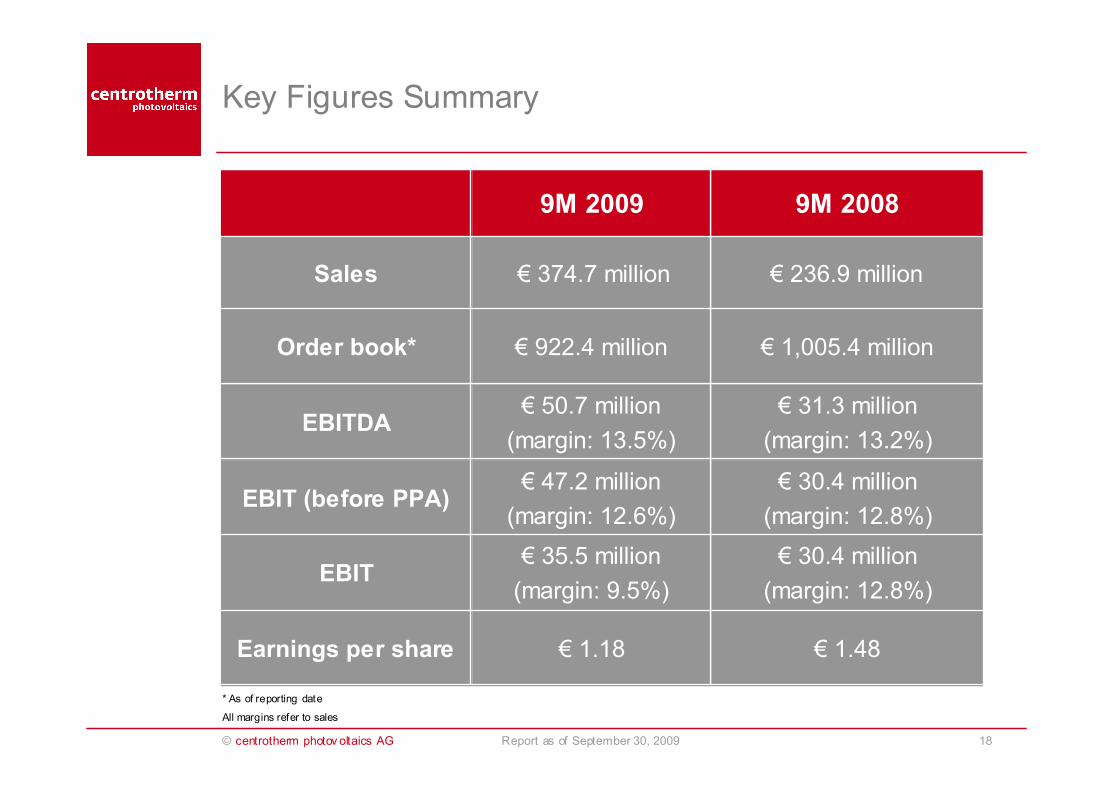
Key Figures Summary
€ 30.4 million
(margin: 12.8%)
€ 47.2 million
(margin: 12.6%)EBIT (before PPA)
€ 31.3 million
(margin: 13.2%)
€ 50.7 million
(margin: 13.5%)EBITDA
€ 1.48€ 1.18Earnings per share
€ 30.4 million
(margin: 12.8%)
€ 35.5 million
(margin: 9.5%)EBIT
€ 1,005.4 million€ 922.4 millionOrder book*
€ 236.9 million€ 374.7 millionSales
9M 20089M 2009
* As of reporting date
All margins refer to sales

19© centrotherm photov oltaics AG Report as of September 30, 2009
Contents
2. Highlights
3. Financial Results
4. Outlook
5. Appendix
1. centrotherm photovoltaics at a Glance

20© centrotherm photov oltaics AG Report as of September 30, 2009
Update on Order Book as of September 30, 2009
1,005 990
1,256
1,010922
0
200
400
600
800
1,000
1,200
1,400
Development of Order Book
in m
illion €
Order book contains:
� Silicon & Wafer: 8 orders
(capacity: 21,700 tonnes)
� Solar cell & Module: 22 turnkey lines
(capacity: 905 MWp)
� Thin film: 2 turnkey lines
(capacity: 80 MWp)
09/08 12/08 03/09 06/09 09/09
Split by Business Segments
Order intake Q3 2009: € 41.2 million, thereof:
� Solar cell & Module: € 28.9 million
� Silicon & Wafer: € 6.6 million
� Thin film: € 5.7 million
Total:
€ 922 million
Silicon & Wafer:€ 661 million (71.6%)
Thin film:
€ 92 million (10.0%) Solar cell & Module:
€ 169 million (18.4%)

21© centrotherm photov oltaics AG Report as of September 30, 2009
Stability of Order Book as of September 30, 2009
Split by Project Classification
A-projects: Orders under transaction
B-projects: Secured by prepayments / LC‘s
C-projects: Firm orders
Total:
€ 922 million
B-projects
€ 95 million
A-projects
€ 455 million
C-projects
€ 372 million
13
59
61
7972
370
36
232
0
100
200
300
400
500
600
700
Solar cell Thin film Silicon
C-projects
B-projects
A-projects
169
661
92
Split by Project Classification Per Segment
in m
illion €
Solar cell &
Module
Thin film Silicon &
Wafer

22© centrotherm photov oltaics AG Report as of September 30, 2009
Sales and Total Output
133.1
110.596.8
72.567.7
131.0
0
40
80
120
160
200
Q1 Q2 Q3
236.9
374.7
0
50
100
150
200
250
300
350
400
450
9M 2008 9M 2009
397.0
243.7
0
50
100
150
200
250
300
350
400
450
9M 2008 9M 2009
Sales
+58.1%
in m
illion €
Total Output
+ 62.9%
2008 2009
136.8 134.5125.7
97.6
78.168.0
0
40
80
120
160
200
Q1 Q2 Q3
2008 2009
in m
illion €
in m
illion €
in m
illion €
+28.8%
+14.2%

23© centrotherm photov oltaics AG Report as of September 30, 2009
Sales Breakdown by Region
Asia
301.8 (80.5%)
Germany
31.6 (8.4%)
Rest of Europe
24.4 (6.5%)
Rest of World
16.9 (4.6%)
Total:
374.7
in mill ion €
Export Quota: 91.6%
Asia
98.4 (89.0%)
Germany
3.1 (2.8%)
Rest of Europe
3.0 (2.7%)
Rest of World
6.0 (5.5%)
Total:
110.5
in mill ion €
Export Quota: 97.2%
9M 2009 Q3 2009
Trend: Increasing share of Asian market

24© centrotherm photov oltaics AG Report as of September 30, 2009
Sales Breakdown by Product
9M 2009
Turnkey Production
Lines
169.1 (45.1%)Single
Equipment
172.3 (46.0%)
Service & Replacement
15.7 (4.2%)
Other
2.7 (0.7%)
Total:
374.7
Consulting & Engineering
14.9 (4.0%)
Q3 2009
Turnkey Production
Lines
54.3 (49.1%)
Single Equipment
46.5 (42.1%)
Service & Replacement
6.0 (5.4%)
Other
0.4 (0.4%)
Total:
110.5
Consulting & Engineering
3.3 (3.0%)
in mill ion € in mill ion €
25© centrotherm photov oltaics AG Report as of September 30, 2009
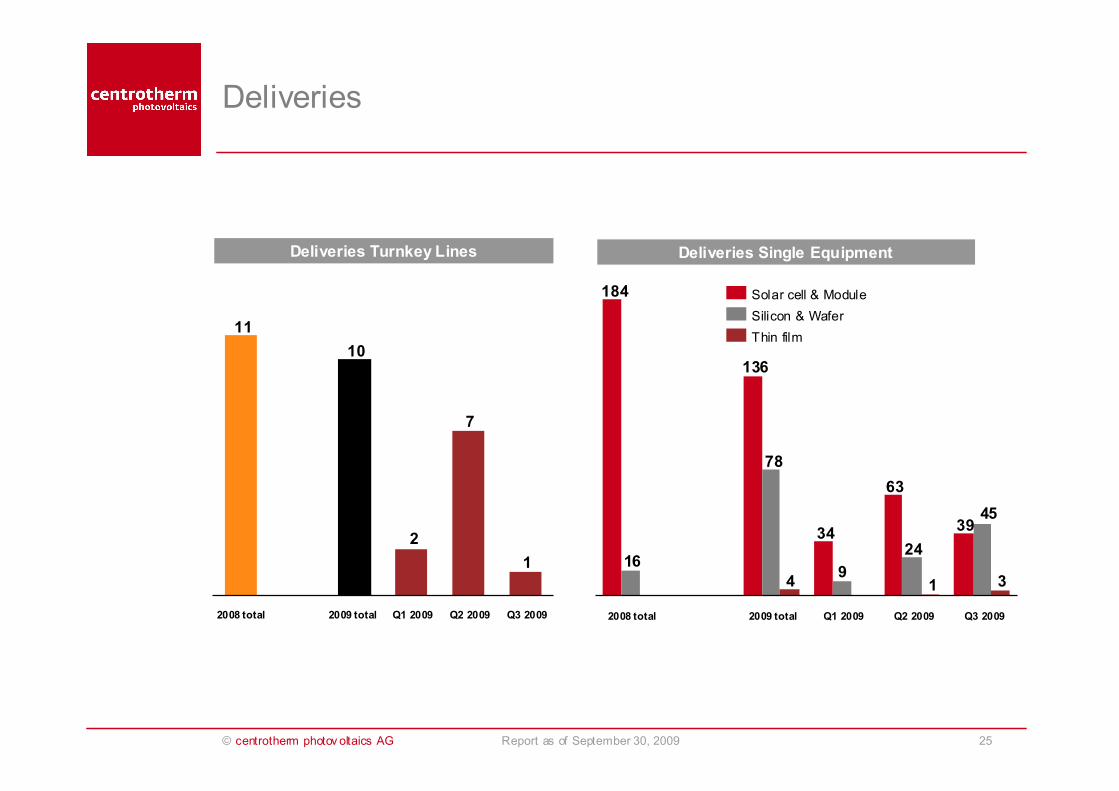
Deliveries
Deliveries Turnkey Lines Deliveries Single Equipment
1
7
2
10
11
Q3 2009Q2 2009Q1 20092008 total
39
63
34
136
184
45
24
9
78
16
314
Q3 2009Q2 2009Q1 20092009 total2008 total
Silicon & Wafer
Solar cell & Module
Thin film
2009 total

26© centrotherm photov oltaics AG Report as of September 30, 2009
Material and Personnel Expenses
88.9 86.578.6
49.6
73.4
59.6
0
20
40
60
80
100
Q1 Q2 Q3
182.6
254.0
67.8%
77.1%
0
40
80
120
160
200
240
280
9M 2008 9M 2009
0%
20%
40%
60%
80%
15.5
46.0
12.3%
6.6%
0
10
20
30
40
50
60
70
80
9M 2008 9M 2009
0%
2%
4%
6%
8%
10%
12%
14%
* referring to sales
Material Expensesin m
illion €
material expensesratio*
Personnel Expenses
14.516.1
15.3
3.9
6.55.1
0
4
8
12
16
20
Q1 Q2 Q3
personnel expenses ratio*
in m
illion €
in m
illion €
in m
illion €
2008 2009
2008 2009
27© centrotherm photov oltaics AG Report as of September 30, 2009
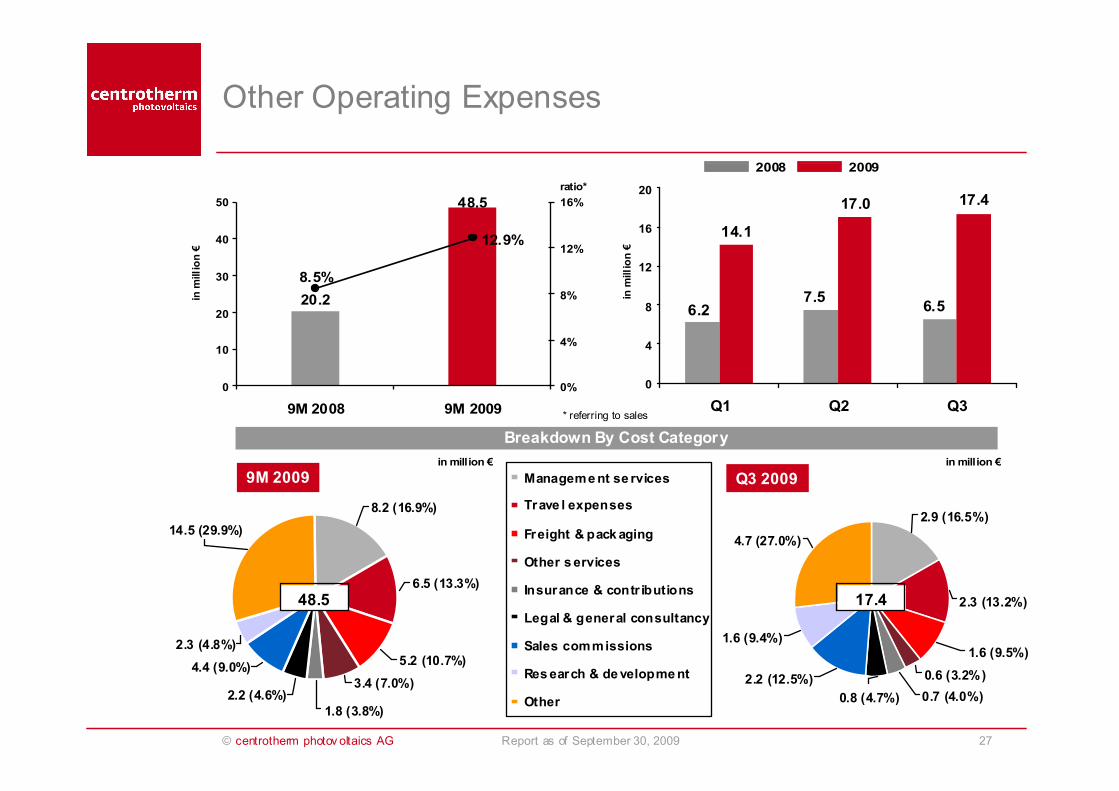
Other Operating Expenses
20.2
48.5
12.9%
8.5%
0
10
20
30
40
50
9M 2008 9M 2009
0%
4%
8%
12%
16%
14.1
17.0 17.4
7.56.56.2
0
4
8
12
16
20
Q1 Q2 Q3* referring to sales
Breakdown By Cost Category
ratio*in m
illion €
in m
illion €
2008 2009
8.2 (16.9%)
6.5 (13.3%)
5.2 (10.7%)
3.4 (7.0%)
14.5 (29.9%)
2.3 (4.8%)
4.4 (9.0%)
2.2 (4.6%)
1.8 (3.8%)
Management se rvices
Trave l expenses
Freight & packaging
Other services
Insurance & contr ibutions
Legal & general consultancy
Sales commissions
Research & development
Other
9M 2009 Q3 2009
2.9 (16.5%)
0.8 (4.7%)
0.6 (3.2%)
2.3 (13.2%)
1.6 (9.5%)
0.7 (4.0%)
2.2 (12.5%)
1.6 (9.4%)
4.7 (27.0%)
48.5
in million €in million €
17.4

28© centrotherm photov oltaics AG Report as of September 30, 2009
EBITDA and EBIT
31.3
50.7
13.5%13.2%
0
10
20
30
40
50
60
9M 2008 9M 2009
0%
4%
8%
12%
16%
20%
19.5
16.2 15.0
8.7
12.510.1
-2
2
6
10
14
18
22
26
30
Q1 Q2 Q3
EBITDAin m
illion €
in m
illion €
EBIT m
argin
Margins refer to sales
* before purchase price allocations
2008 2009
30.4
35.5
9.5%
12.8%
0
10
20
30
40
50
9M 2008 9M 2009
0%
2%
4%
6%
8%
10%
12%
14%
14.7
11.19.7
8.5
12.0
9.9
0
4
8
12
16
20
Q1 Q2 Q3
EBIT
in m
illion €
in m
illion €
EBIT m
argin
12.6%*
2008 2009
8.8%
13.5%12.9%
12.4%

29© centrotherm photov oltaics AG Report as of September 30, 2009
Consolidated Net Income
Consolidated Net Income and Earnings Per Share
25.023.7
6.7%
10.0%
0
5
10
15
20
25
30
35
40
9M 2008 9M 2009
0%
2%
4%
6%
8%
10%
12%
10.5
7.3 7.26.2
9.28.4
0
4
8
12
16
Q1 Q2 Q3
in m
illion €
in m
illion €
net income margin
Margin refers to sales
2008 2009
1.48
1.18
0.0
0.4
0.8
1.2
1.6
9M 2008 9M 2009
Earnings Per Share
in €
in €
2008 2009
0.50
0.34
0.520.57
0.390.34
0.0
0.2
0.4
0.6
0.8
1.0
Q1 Q2 Q3
9.5%6.5%

30© centrotherm photov oltaics AG Report as of September 30, 2009
Segmental Information (in Million €)
18.0 12.8
136.3
0
20
40
60
80
100
120
140
160
Sales EBITDA EBIT
2.9
48.0
-1.1
-10
0
10
20
30
40
50
Sales EBITDA EBIT
9.2 7.5
56.5
0
10
20
30
40
50
60
Sales EBITDA EBIT
Silicon & Wafer Solar cell & Module* Thin film
1.8
21.2
-10
-5
0
5
10
15
20
25
Sales EBITDA EBIT
2.20.5
32.9
0
10
20
30
40
Sales EBITDA EBIT
29.9 23.9
190.4
0
40
80
120
160
200
Sales EBITDA EBIT
Margin refers to sales
* Including other
3.5
13.2% 13.2%9.4%
16.4% 13.3%
15.7% 12.5%
6.7% 1.4%16.6% 8.4%
6.0% -2.3%
9M 2009 9M 2009 9M 2009
Q3 2009 Q3 2009 Q3 2009

31© centrotherm photov oltaics AG Report as of September 30, 2009
Balance Sheet
� Equity Ratio: 44.2%
� Liquidity: € 165.2 million
776.7
Total Assets
776.7
Total Equity and Liabilities
296.3
Non-current Assets
ther eof:
Securities
88 .0
343.2
Equity
370.9
Current Liabilities
62.6
Non-current Liabilities480.4
Current Assets
thereof:
Advanced payments
received
162 .3
Balance Sheet as of September 30, 2009 Balance Sheet as of December 31, 2008
665.8
Total Assets
665.8
Total Equity and Liabilities
273.0
Non-current Assets
thereof:
Securities
93.9
318.2
Equity
278.8
Current Liabilities
68.8
Non-current Liabilities392.7
Current Assets
thereof:
Advanced payments
received
158.9

32© centrotherm photov oltaics AG Report as of September 30, 2009
Cash Flow
33.2 35.8
-5.0
68.7
-20
0
20
40
60
80
100
120
-9.7
-3.7
-12
-10
-8
-6
-4
-2
0
Total Cash Flow
101.9
Cash Flow from Operating Activities
30.8
-105.6
-40.6
-120
-100
-80
-60
-40
-20
0
Cash Flow from Investment Activities
9M 2008
0.00.00
20
40
60
80
100
120
140
9M 2008 9M 2009
Cash Flow from Financing Activities
9M 2009NWC = Changes in Net Wor king Capital
EBT = Earnings Befor e Taxes
9M 20099M 2008
in m
illion €
In m
illion €
in m
illion €
in m
illion €
9M 2008 9M 2009

33© centrotherm photov oltaics AG Report as of September 30, 2009
Contents
2. Highlights
3. Financial Results
4. Outlook
5. Appendix
1. centrotherm photovoltaics at a Glance

34© centrotherm photov oltaics AG Report as of September 30, 2009
Outlook 2009 and Objectives 2010
2009 Outlook - confirmed
� Double-digit growth
� Sales: EUR 500 - 550 million
� Further increase in EBITDA
Objectives 2010
� Gaining further market shares
� Market launch of new, innovative products
� Strong focus on R&D activities
� Intensifying “Performance Plus”- Program

35© centrotherm photov oltaics AG Report as of September 30, 2009
Contents
2. Highlights
3. Financial Results
4. Outlook
5. Appendix
1. centrotherm photovoltaics at a Glance
36© centrotherm photov oltaics AG Report as of September 30, 2009
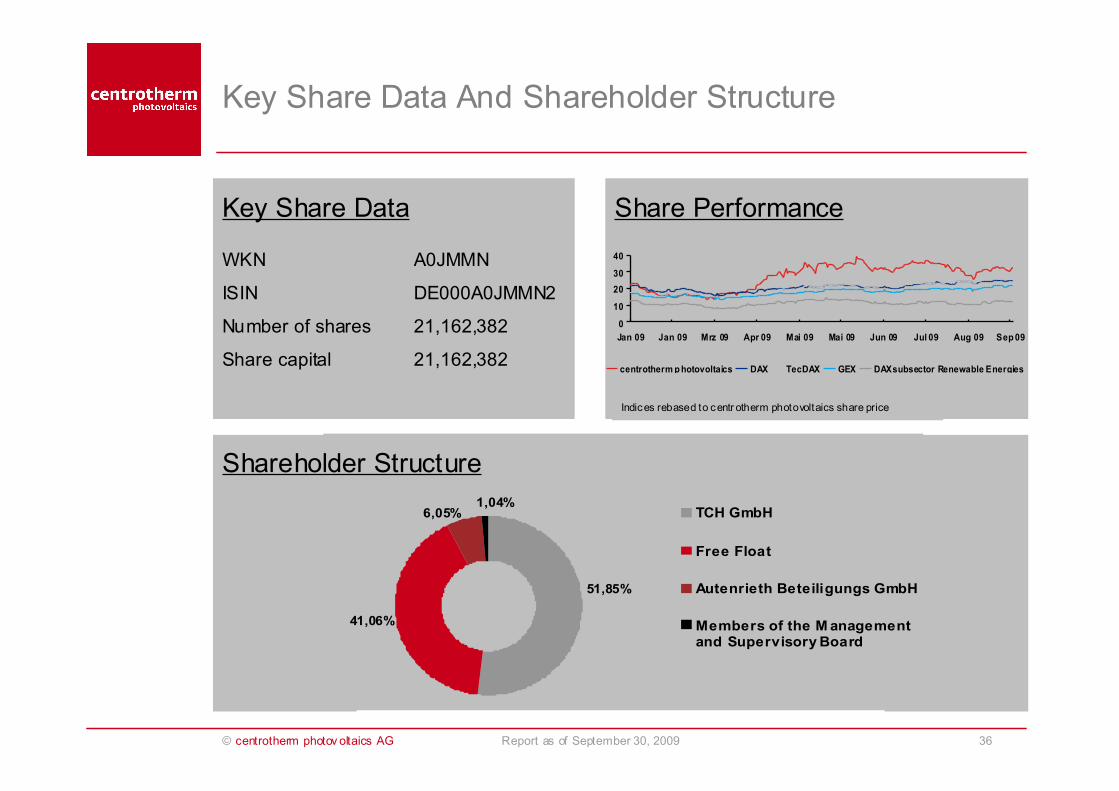
Key Share Data And Shareholder Structure
6,05%
41,06%
51,85%
1,04%TCH GmbH
Free Float
Autenrieth Beteiligungs GmbH
Members of the Managementand Supervisory Board
Key Share Data
WKN A0JMMN
ISIN DE000A0JMMN2
Number of shares 21,162,382
Share capital 21,162,382
0
10
20
30
40
Jan 09 Jan 09 Mrz 09 Apr 09 Mai 09 Mai 09 Jun 09 Jul 09 Aug 09 Sep 09
centrotherm photovoltaics DAX TecDAX GEX DAXsubsector Renewable Energies
Shareholder Structure
Share Performance
Indices rebased to centr otherm photovoltaics share price

37© centrotherm photov oltaics AG Report as of September 30, 2009
Contact
centrotherm - continuing innovations
Contact: Saskia Schultz-Ebert
Investor Relations
centrotherm photovoltaics AG
Johannes-Schmid-Strasse 8
89143 Blaubeuren
Tel +49 (0)7344 9188-890
Fax +49 (0)7344 9189-389