
Report 6602 – Impact assessment of global megatrends – Two case ...
88
Impact assessment of global megatrends Two case studies connecting global megatrends to regional topics ULLRICH LORENZ AND HÖRDUR V. HARALDSSON REPORT 6602 • february 2014
Transcript of Report 6602 – Impact assessment of global megatrends – Two case ...

Swedish EPA SE-106 48 Stockholm. Visiting address: Stockholm – Valhallavägen 195, Östersund – Forskarens väg 5 hus Ub. Tel: +46 10-698 10 00, fax: +46 10-698 10 99, e-mail: [email protected] Internet: www.swedishepa.se Orders Ordertel: +46 8-505 933 40, orderfax: +46 8-505 933 99, e-post: [email protected] Adress: Arkitektkopia AB, Box 110 93, SE-161 11 Bromma. Internet: www.naturvardsverket.se/publikationer
Impact assessment of global megatrends
Two case studies connecting global megatrends to regional topics
UllrIch lorenz and hördUr V. haraldsson
rEport 6602 • february 2014
Swedish EpA Se-106 48 Stockholm. Visit ing address: Stockholm - Valhallavägen 195, Östersund - forskarens väg 5 hus ub, . Tel: +46 10 698 10 00, fax: +46 10 698 10 99, e-mail: [email protected] Internet: www.swedishepa.se orders Ordertel: +46 8 505 933 40, orderfax: +46 8 505 933 99, e-mail: [email protected] address: CM Gruppen, box 110 93, Se-161 11 bromma. Internet: www.swedishepa.se/publications
The authors assume sole responsibility for the con-tents of this report, which therefore cannot be cited as representing the views
of the Swedish ePa.
Impact assessment of global megatrendsTwo case studies connecting global megatrends to regional topics
This report gives an overview how global megatrends
can influence topics on resource scarcity on EU regional
and local level.
The report demonstrates in two case studies how
qualitative modelling (Causal Loop Diagrams) and
system thinking approach can be applied to analyse the
possible impact of global megatrends upon resource
scarcity in an EU perspective and how they impact the
Swedish environmental objectives on a local level.
rEport 6602
SWeDISH ePa
ISbn 978-91-620-6602-4
ISSn 0282-7298

SWEDISH ENVIRONMENTAL PROTECTION AGENCY
Impact assessment of global megatrends
Two case studies connecting global megatrends to regional topics
Ullrich Lorenz Hördur V. Haraldsson

OrderPhone: + 46 (0)8-505 933 40
Fax: + 46 (0)8-505 933 99 E-mail: [email protected]
Address: Arkitektkopia AB, Box 110 93, SE-161 11 Bromma, Sweden Internet: www.naturvardsverket.se/publikationer
The Swedish Environmental Protection AgencyPhone: + 46 (0)10-698 10 00, Fax: + 46 (0)10-698 10 99
E-mail: [email protected] Address: Naturvårdsverket, SE-106 48 Stockholm, Sweden
Internet: www.naturvardsverket.se
ISBN 978-91-620-6602-4 ISSN 0282-7298
© Naturvårdsverket 2014
Print: Arkitektkopia AB, Bromma 2014Cover photo: Hördur Haraldsson
N
ORDIC ECOLABEL
Printed Matter

SWEDISH ENVIRONMENTAL PROTECTION AGENCY REPORT 6602Impact assessment of global megatrends
3
AcknowledgementsWe would like to thank Owen White (Collingwood Environmental Planning Ltd) for the texts he contributed and the good discussions we had with him about alternative ways of thinking about economic systems; Jens Günther (UBA, Federal Environment Agency) for contributing to the overview of European resource efficiency policy; Jan Kosmol (UBA, Federal Environment Agency) for his critical comments on the concepts of resource scarcity.
Furthermore, we would like to thank Harald Sverdrup, Deniz Kozca and Salim Belyazid from Lund University for the great discussions we had with them about model architecture and Kai Neumann for advising us on how to use the Consideo Modeler and iModeler in our assessment.
We would also like to thank our Swedish colleagues at SEPA for critically reviewing the manuscript.
Last, but not least, we would also like to thank the EEA (Teresa Ribeiro and Anita Pirc Velkavrh) as well as Jan Bakkes (PBL NL), Alexander Storch and Günther Pfaff (Umweltbundesamt AU), Mirek Havranek (Cenia, CZ), Marleen Van Steertegem (Flemish Environment Agency, Anabelle Berger (Ministère du Développement durable)and Barbara Bernard Vukadin (Slovenian Environment Agency) for the stimulating discussions during the Article 5 Project and the EIONET FLIS-Network.
This publication is available as a download at:https://www.umweltbundesamt.de/publikationen/an-assessment-of-the- possible-impacts-that-globalorwww.naturvardsverket.de/publikationer
The views expressed in this report are those of the authors and do not neces-sarily represent the views of the Federal Environment Agency Germany or the Swedish Environmental Protection Agency.
Federal Environment Agency Germany – Umweltbundesamt
Wörlitzer Platz 1 06844 Dessau-Roßlau Germany Phone: +49-340-2103-0 Fax: +49-340-2103-2285 E-Mail: buergerservice[at]uba.de
The Swedish Environment Protection Agency
NaturvardsverketSE-10648 StockholmSwedenPhone: +46 (0)10-698 10 00Fax: +46 (0) 10-69810 99E-Mail: registrator[at]naturvardsverket.se
Main Authors: Ullrich Lorenz (UBA GE) and Hördur V. Haraldsson (SEPA)Proof reading: Ms Gunilla Zedigh, [email protected]
SWEDISH ENVIRONMENTAL PROTECTION AGENCY REPORT 6602Impact assessment of global megatrends
4
PrefaceOctober 2013
Dear reader,
In today’s world, the ever-increasing speed of technological, economic, social and environmental change is a challenge to policymakers and society at large. At the same time, the complexity of the systems in which we live is also expanding. And this means that in order to make effective decisions and to learn insightfully about the complexity that surrounds us, we should or even must become systems thinkers – we must push the boundaries of our mental models and develop approaches that make the complexity at hand more com-prehensible – and our policy more effective.
Taking a closer look at global megatrends – as described in the State of the Environment Report issued by the European Environment Agency – is a good starting point, as these trends can serve to sensitise and alert us about both the future developments and the challenges that we will one day face. However, as useful as such a foresight analysis might be, the question remains: What does this kind of global development mean for regions or even for local towns and villages? How do these developments interact?
In order to be able to answer this kind of question it is necessary to get a systemic understanding how the global megatrends are connected and how they influence each other. Such an assessment allows us to understand a part of the complexity of our interconnected world. And this will help us to find the right anchors to attach the most effective policy measures.
This report is a contribution to that kind of analysis and addresses this very question: How is it possible to assess the impacts of global megatrends on a regional or local scale? This report was created jointly by two European Environment agencies and is the first of its kind.
This report presents the findings of two case studies that are based on the same kind of systemic thinking and the same methodology. And it incor-porates what is known about global megatrends. Although the case studies and the underlying models are quite different from each other, the results can easily be compared and the message is quite clear: global megatrends may have a different impact on various regional issues such as resource use and resource scarcity. Nearly all global developments will put additional pressure on our ecosystems and society – also on a regional scale.
SWEDISH ENVIRONMENTAL PROTECTION AGENCY REPORT 6602Impact assessment of global megatrends
5
It is our hope that this fruitful international cooperation is just the beginning of many more rewarding exchanges and collaborations between the different European Environment agencies.
Dr Harry Lehmann Eva Thörnelöf
Head of the Environmental Planning and Sustainability Strategies Department
Head of the Research and Assessment Department
Federal Environment Agency, Germany
Swedish Environmental Protection Agency, Sweden
Foreword by the authorsThis report was inspired by the work we did on a project funded by the EEA that ran between June 2011 and March 2012i. One of the main aims of the EEA project was to provide examples of how the evaluation of global megatrends presented in the State of the Environment Report (SOER) 2010 could be applied to regional issues such as resource scarcity and environmental goals. We, the authors, have extensive experience in systems thinking and systems dynamic modelling techniques, and thus immediately saw the huge potential for applying qualitative modelling (causal loop analysis).
When the EEA’s GMT Report was released, we immediately recognised that there were similarities, overlaps and connections between the different GMTs. So, for us, it was only logical to begin building an initial system designed especially for the GMTs by identifying common drivers and variables. However, this turned out to be a rather complex project. Nevertheless, the mini project encouraged us to apply the same methodology to this joint project. While the main focus of the project funded by the EEA was on capacity build-ing and how to use systems thinking, there was an intensive exchange of ideas between the two agencies (UBA, the German Federal Environment Agency and SEPA, the Swedish Environment Protection Agency) to delve deeper into quali-tative modelling in order to analyse the challenges posited by resource scarcity from different perspectives. Taking an additional general perspective, we ana-lysed how the GMTs might influence scarcities and from yet another perspec-tive, we looked at how the GMTs would influence the system of sustainability indicators in Sweden. Both projects were run independently from the EEA project, but despite the fact that they were continued individually, there was a great deal of exchange. While some results were presented in the final report of the EEA project1, the insights and results have been far more extensive – and to a certain extent – quite complex. We therefore decided to elaborate on the joint report in order to share more of the details of the respective models and the insights we gained.
Finally, we would like to thank the entire team and the EEA for making the fruitful and lively exchange possible.
Ullrich Lorenz and Hördur V. Haraldsson
i European Environment Agency Service Contract 3534/b2011/EEA54586, based on Article 5 EEA Regulation

SWEDISH ENVIRONMENTAL PROTECTION AGENCY REPORT 6602Impact assessment of global megatrends
7
AbstractThis report gives an overview how global megatrends can influence topics on regional and local level. The report demonstrates how qualitative modelling and system thinking approach can be applied to analyse the possible impact of global megatrends to the regional topic of resource scarcity, demonstrated in two case studies.
In the first case study, a generic qualitative model is developed to explain a general pattern of resource scarcity on a EU regional scale. Typical entry points of political measures are shown as well as how the eleven global meg-atrends – described by the European Environment Agency – can be connected to such a model. Potentially, some of the global megatrends will increase the problem of resource scarcity while others will put relieve on the challenge. A third group of megatrends has apparently now impact on the resource scarcity pattern. In the same way, the possible impact of the policy measure can be compared.
In the second case study, a qualitative model is built to explain the impact of the global megatrends upon the Swedish environmental goals. The case study illustrates how the different scales: local, EU regional and the global scale connect through the megatrends, and how they impact the possibility of fulfilling the Swedish environmental goals.
In conclusion, we are able to demonstrate that the global megatrends put in nearly all cases more burden to environmental challenges respectively the environmental goals. The potential impact of global megatrends differs in time and spatial scale. Generally, the methodology of qualitative modelling has proven to be a powerful approach to assess the potential impact of global megatrends to regional or concrete topics as well as to assess the potential impact of policy measures in terms of goal reaching.
Svenskt sammanfattningDenna rapport ger en översikt hur globala megatrender kan påverka ämnes-området resursbrist på EU:s regionala och lokala nivå. Rapporten visar hur kvalitativ modellering och systemtänkande/systemanalys som tillvägagångssätt kan tillämpas för att analysera möjliga effekter av globala megatrender inom ämnesområdet resursbrist i ett EU perspektiv och hur det påverkar förut-sättningarna för att uppfylla de svenska miljömålen. Rapporten demonstrerar tillämpningen i två fallstudier.

Deutsche KurzfassungDieser Bericht gibt einen Überblick darüber, wie der mögliche Einfluss von globalen Megatrends auf regionale und lokale Themen bewertet werden kann. Hierfür wird die Methode der qualitativen Modellierung basierend auf „systemischem Denken“ in zwei Fallstudien angewendet.
In der ersten Fallstudie ist ein qualitatives Modell entwickelt worden, um das Grundmuster von Ressourcenknappheit in einem Wirtschaftsraum wie Europa zu erklären. Hiermit können sowohl Ansatzpunkte für mögliche Politikmaßnahmen gezeigt als auch demonstriert werden, wie die globalen Megatrends – beschrieben von der Europäischen Umweltagentur – ein solches System beeinflussen können. Dabei wird deutlich, dass einige der Megatrends die Knappheit von Ressourcen eher verstärken, während andere das Problem eher verringern (scheinbar) und schließlich eine dritte Gruppe kaum Einfluss auf die Frage der Ressourcenknappheit entwickelt. In gleicher Art kann der potentielle Einfluss von Politikmaßnahmen verglichen werden.
In der zweiten Fallstudie geht es darum, den potentiellen Einfluss der globalen Megatrends auf die Schwedischen Umweltziele zu bewerten. Dabei wird deutlich, wie die verschiedenen Skalen, lokal, EU regional und die globale Skala miteinander interagieren und dabei in unterschiedlicher Weise die Erreichung der schwedischen Umweltziele beeinflussen.
In beiden Fallstudien kann gezeigt werden, wie die globalen Megatrends die Erreichung der umweltpolitischen Ziele erschweren und zentrale Umweltprobleme tendenziell verschärfen. Dabei kommt die Wirkung der globalen Megatrends in unterschiedlichen zeitlichen und räumlichen Skalen zum Tragen. Insgesamt hat sich gezeigt, dass die hier angewandte Methode der qualitativen Modellierung sehr gut dafür geeignet ist, den möglichen Einfluss von globalen Megatrends auf lokale bzw. regionale Themen zu bestimmen.
SWEDISH ENVIRONMENTAL PROTECTION AGENCY REPORT 6602Impact assessment of global megatrends
9
Contents
FOrEwOrd by ThE AuThOrS 6
1 InTrOducTIOn 151.1 Global megatrend analysis by the EEA 161.2 Basic aspects of systems thinking 181.2.1 Basic approach 181.2.2 Some more theoretical background 211.2.3 The use of software tools 22
2 cASE STudy I: “POSSIblE ImPAcTS OF glObAl mEgATrEndS On rESOurcES ScArcITy (gEnErAl cOncEPT FrOm ThE PErSPEcTIvE OF nOrThErn EurOPE)” 24
2.1 Introduction 242.1.1 Purpose of the study 242.1.2 Resources and resource efficiency policy in the EU 242.1.3 Overview of the model on resource scarcity 27
2.2 Understanding the system: resource use, types of scarcity and common approaches 28
2.2.1 Scarcity – identifying the problem 282.2.2 Increasing efficiency 312.2.3 Balancing effects – a key to understanding rebound effects 322.2.4 Ambivalence of impacts and effects 35
2.3 Possible impacts of global trends 352.3.1 GMTs possibly increase resource scarcity 382.3.2 GMTs may possibly decrease resource scarcity 392.3.3 GMTs with apparently no impact 402.3.4 GMTs change their impact over time 40
2.4 Assessment of the impacts of measures that prevent resource scarcity 412.4.1 General measures and strategies to deal with resource scarcity –
a look at EU strategies 412.4.2 Measures in the model 432.4.3 Understanding the special role of recycling and resource efficiency 442.4.4 Understanding decreasing impacts 442.4.5 Understanding the counterintuitive impact of renewable energy 45
2.5 First conclusions and reflections 45
3 cASE STudy 2: lInkIng glObAl mEgATrEndS TO SwEdISh EnvIrOnmEnTAl ObjEcTIvES 48
3.1 Purpose and goals of Case Study II 483.2 The Swedish environmental objectives 493.3 Scope of the study and structure of the model 50
SWEDISH ENVIRONMENTAL PROTECTION AGENCY REPORT 6602Impact assessment of global megatrends
10
3.4 Drivers and feedback regarding resource scarcity and the focus points of the Generation Goals (GGs) 51
3.4.1 Resource scarcity 523.4.2 Generation Goals 52
3.5 Results and analysis 563.5.1 The analysis of the possible impacts of GMTs on resource scarcity 563.5.2 Ecosystems have recovered 583.5.3 Biodiversity and the natural and cultural environment are conserved 593.5.4 Human health 603.5.5 Material cycles 613.5.6 Natural resources are managed sustainably 623.5.7 Consumption 633.5.8 Renewable Energy 643.5.9 Summing up the impact that the GMTs have on the Swedish GGs’
focus points 653.6 Using GMTs for assessing the Generation Goals’ focus points 663.7 Recommendations for the further development of GMT analysis 68
4 OvErAll cOncluSIOnS/rEcOmmEndATIOnS 694.1 Comparing the two case studies – understanding commonalities
and differences 694.1.1 Comparing models 694.1.2 Comparing some key results 70
4.2 Lessons learned, limitations and potential 714.2.1 Some words on qualitative modelling 714.2.2 Some words on GMTs 72
4.3 Final recommendations and conclusions: 73
5 AnnEX: mOdEl dOcumEnTATIOnS 745.1 Case Study 1: generic model on resource scarcity 745.2 Case Study II: basic modules 805.2.1 The building module: 805.2.2 The energy module:. 805.2.3 The food production module: 815.2.4 The forest module: 825.2.5 The basic mineral module: 835.2.6 The basic mobility module: 84
6 lIST OF rEFErEncES 85

SWEDISH ENVIRONMENTAL PROTECTION AGENCY REPORT 6602Impact assessment of global megatrends
11
List of figuresFigure 1. An example of making causal relations visible with a CLD. 19Figure 2. An illustrative example of a balancing feedback loop on the left side
and a reinforcing loop on the right side; excerpt from the model. 20Figure 3. An Insight Matrix of the possible positive or negative impacts of
GMTs on resource scarcity. 21Figure 4. An example of how an Insight Matrix can be transformed into a bar
chart. 22Figure 5. An overview of the qualitative model on resource scarcity. 28Figure 6. An excerpt from the model showing the central factor resource
scarcity in northern Europe and the first levels of the model. 29Figure 7. An excerpt from the bigger model – profit for industry/economy is
a central factor that influences the export of both resources and products. 30
Figure 8. An excerpt from the model – an example of a balancing loop. 32Figure 9. An extended basic balancing structure. 33Figure 10. Causal loop diagram showing the relationship between a rebound
effect and economic growth. 34Figure 11. A bar chart of possible impacts of the GMT on resource scarcity in
northern Europe based on the Insight Matrix. 37Figure 12. CLD of an extended archetype limit to growth with some analogy to
shifting the burden. 41Figure 13. A chart showing the possible relative impact of a measure on the
main factor resource scarcity. 43Figure 14. An illustration of three different geographical and temporal scales. 48Figure 15. An overview of the 16 Environmental Quality Objectives – ill. by
Tobias Flygar. 50Figure 16. The subsystems of the model for Case Study II. 51Figure 17. Factors that have a direct impact on resource scarcity. Grey areas
indicate variables that belong to the EU regional level. 52Figure 18. Factors that have a direct impact on the GG ecosystems have reco-
vered. 53Figure 19. Factors that have a direct impact on the GG biodiversity and cul-
tural environment. 53Figure 20. Factors that have a direct impact on the GG human health. 54Figure 21. Factors that have a direct impact on the GG material cycles. 54Figure 22. Factors that have a direct impact on the GG natural resources. 55Figure 23. Factors that have a direct impact on the GG share of renewable
energy. 55Figure 24. Factors that have a direct impact on the GG patterns of consumption. 56Figure 25. An Impact Matrix of the GMTs on resource scarcity in northern
Europe. 57Figure 26. The impact of the GMTs on resources scarcity in northern Europe
with a focus on Sweden (national level). 58
SWEDISH ENVIRONMENTAL PROTECTION AGENCY REPORT 6602Impact assessment of global megatrends
12
Figure 27. The impact of the GMTs on the Swedish Generation Goals’ focus point ecosystems have recovered shows that environmental trends have an overwhelmingly negative impact. 59
Figure 28. The impact of the GMTs on the Swedish Generation Goals’ focus point biodiversity and the natural and cultural environment are con-served shows that all of the megatrends, except for GMT 3, GMT 4 and GMT 11 have an overwhelmingly negative impact. 60
Figure 29. The impact of the GMTs on the Swedish Generation Goals’ focus point human health shows that all of the megatrends except for GMT 11 have an overwhelmingly negative impact. 61
Figure 30. The impact of the GMTs on the Swedish Generation Goals’ focus point material cycles shows that most of the megatrends have a generally positive impact. 62
Figure 31. The impact of the GMTs on the Swedish Generation Goals’ focus point natural resources shows that the economic trend GMT 5 as well as the population trend GMT 2 have a strong negative impact. 63
Figure 32. The impact of the GMTs on the Swedish Generation Goals’ focus point patterns of consumption of goods and services cause the least possible problems for the environment and human health shows that GMT 7 has a strong positive effect. 64
Figure 33. The impact of the GMTs on the Swedish Generation Goals’ focus point the share of renewable energy increases and use of energy is efficient, with minimal impact on the environment shows that the political trend GMT 11, the economic trend GMT 7 and the techno-logical trend GMT 4 all have a strongpositive impact. 65
Figure 34. The influence of the megatrends over geographic scales and short, medium and long-term perspectives on the Generation Goals’ focus points. 67
Figure 35. An example of how GMTs are connected in the different models. In Model I, the GMT is “only” linked to the model, while in Model II, the GMTs are interconnected. 69
Figure 36. An excerpt from model showing regional availability of resources. 75Figure 37. An excerpt from the model showing part of the economic system as
represented in the mode. 77Figure 38. An excerpt from the model showing production and use of resources
as the central factors. 79Figure 39. The basic feedback loops of the building module. 80Figure 40. The basic energy system module has one reinforcing feedback loop
and four balancing feedback loops (modified from Dawson 2012). 80Figure 41. The food production system consists of three balancing loops and
two reinforcing loops. 81Figure 42. The basic forest module. 82Figure 43. The basic mineral module. 83Figure 44. The basic mobility module. 84
SWEDISH ENVIRONMENTAL PROTECTION AGENCY REPORT 6602Impact assessment of global megatrends
13
List of tablesTable 1. A list of the global factors in the generic model for resource scarcity. 36Table 2. A list of factors in the generic model for resource scarcity which in-
dicate the factors’ regional particularities in relation to the specific global trend. 36
Table 3. A list of the general approaches/measures to counteract the overall challenge of resource scarcity. 43
Table 4. The weighted Impact Matrix of the GMTs’ effects on the Generation Goals’ focus points and on resource scarcity. 66
Table 6. An overview comparing metadata of the two case study models. 69Table 7. A comparison of the orientation of impacts of the GMTs in terms of
resource scarcity. 70


SWEDISH ENVIRONMENTAL PROTECTION AGENCY REPORT 6602Impact assessment of global megatrends
15
1 IntroductionIn the SOER 2010 Assessment of Global Megatrends (GMTs) Report, the European Environment Agency (EEA) describes a set of 11 GMTs on a global scale. In the SOER GMTs Report, an analysis of “why GMTs are important” can be found delineated in a small box. An equally short description is also included for each of the potential impacts (or risks) that the GMTs have on the environment in Europe.
On the whole, the environment in Europe is very broad in scope and also quite diverse, and so the analysis of what exactly has an impact on it will also be quite broad in scope and general. It was therefore agreed upon that it would be far more insightful to examine the impacts and implications on a smaller scale: hence, an examination at the regional level was proposed, which is reflected in the case studies that we developed.
One practical approach was identified to help develop an understanding of the complexity of the GMTs and their interaction with specific issues. The approach is called qualitative modelling. Through qualitative modelling, it is pos-sible, in principle, to show the causes and effects of the drivers of a particular megatrend and also to show the interconnections between different megatrends.
The introductory section of the SOER 2010 Assessment of Global Megatrends2 entitled “Why assess global megatrends?” states that “The com-plexity of interlinkages and the manifold uncertainties inherent in megatrends require an exploratory, qualitative approach underpinned by empirical data.” The comments included in the SOER 2010 Assessment of Global Megatrends Report on how the GMTs were established and defined give a clear indication of the huge challenge that one is faced with when it comes to adequately pre-senting results. There are distinct challenges and difficulties in presenting such an assessment: How best to present all of the expert knowledge and at the same time be as comprehensive as possible? How best to show ambivalences in interpretation? How best to reflect dynamics or changes over time without carrying out complex quantitative modelling sessions?
The aim of this task was to develop a systemic understanding of resource scarcity from a regional EU perspective, defining exactly what it consists of and which role global developments (i.e. GMTs, as described in the SOER 2010 Report of the EEA) might play.
This report presents two different case studies that were carried out inde-pendently from each other. One focuses on resource scarcity in relation to global megatrends from a more general perspective and on an EU level, and the other focuses on Sweden and its environmental goals. The main questions for each case were as follows:
Case Study I: What long-term impacts do the global megatrends have on regional resource scarcity in the EU with a focus on northern Europe?
Case Study II: What long-term impacts do the global megatrends have on the Swedish environmental goals and what are the implications from a local, regional and global perspective?
SWEDISH ENVIRONMENTAL PROTECTION AGENCY REPORT 6602Impact assessment of global megatrends
16
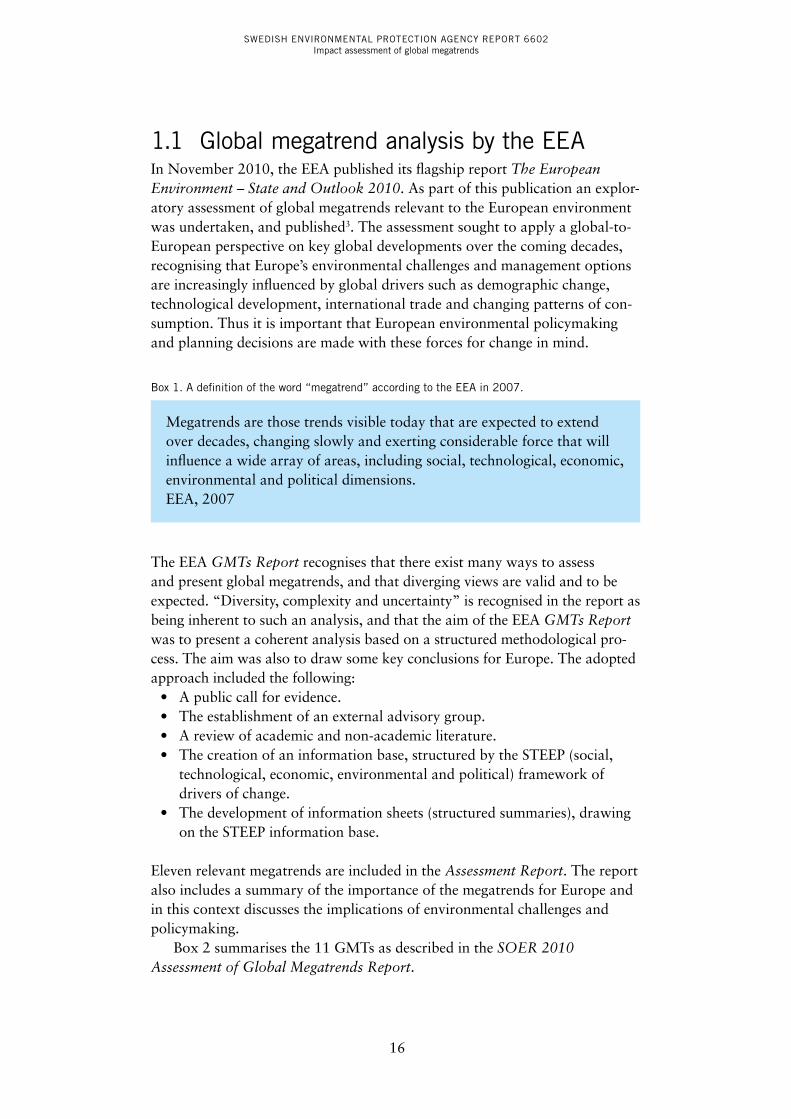
1.1 Global megatrend analysis by the EEAIn November 2010, the EEA published its flagship report The European Environment – State and Outlook 2010. As part of this publication an explor-atory assessment of global megatrends relevant to the European environment was undertaken, and published3. The assessment sought to apply a global-to-European perspective on key global developments over the coming decades, recognising that Europe’s environmental challenges and management options are increasingly influenced by global drivers such as demographic change, technological development, international trade and changing patterns of con-sumption. Thus it is important that European environmental policymaking and planning decisions are made with these forces for change in mind.
Box 1. A definition of the word “megatrend” according to the EEA in 2007.
Megatrends are those trends visible today that are expected to extend over decades, changing slowly and exerting considerable force that will influence a wide array of areas, including social, technological, economic, environmental and political dimensions.EEA, 2007
The EEA GMTs Report recognises that there exist many ways to assess and present global megatrends, and that diverging views are valid and to be expected. “Diversity, complexity and uncertainty” is recognised in the report as being inherent to such an analysis, and that the aim of the EEA GMTs Report was to present a coherent analysis based on a structured methodological pro-cess. The aim was also to draw some key conclusions for Europe. The adopted approach included the following:
• A public call for evidence.• The establishment of an external advisory group.• A review of academic and non-academic literature.• The creation of an information base, structured by the STEEP (social,
technological, economic, environmental and political) framework of drivers of change.
• The development of information sheets (structured summaries), drawing on the STEEP information base.
Eleven relevant megatrends are included in the Assessment Report. The report also includes a summary of the importance of the megatrends for Europe and in this context discusses the implications of environmental challenges and policymaking.
Box 2 summarises the 11 GMTs as described in the SOER 2010 Assessment of Global Megatrends Report.
SWEDISH ENVIRONMENTAL PROTECTION AGENCY REPORT 6602Impact assessment of global megatrends
17
Box 2. A summary of the EEA’s global megatrends (GMTs).
GMT 1: Increasing global divergence in population trendsThe global population will still be growing midway through the 21st century, but at a slower rate than in the past. People will live longer, be better educated and migrate more. Some populations will increase as others shrink. Migration is only one of the unpredictable prospects for Europe and the world.
GMT 2: Living in an urban worldAn increasingly urban world will probably mean spiralling consumption and greater affluence for many. But it also means greater poverty for the urban underprivileged. Poor urban living conditions and environmental and health risks associated with this could have an impact on all parts of the world, including Europe.
GMT 3: Disease burdens and the risk of new pandemicsThe risk of exposure to new, emerging and re-emerging diseases, to accidents and new pandemics, will grow with the increasing mobility of people and goods, climate change and poverty. Vulnerable Europeans could be severely affected.
GMT 4: Accelerating technological change – racing into the unknownThe breakneck pace of technological change brings risks and opportuni-ties, not least for developed regions such as Europe. These include, in particular, the emerging cluster of nanotechnology, biotechnology, and information and communication technology. Innovations offer immense opportunities for the environment, but can also cause enormous problems if risks are not regulated adequately.
GMT 5: Continued economic growth?Rapid growth accelerates consumption and resource use. But it also cre-ates economic dynamism that fuels technological innovation, potentially offering new approaches to addressing environmental problems and increasing resource efficiency.
GMT 6: From a unipolar to a multipolar worldGlobal power is shifting. One superpower no longer holds sway and regional power blocs are increasingly important, both economically and diplomatically. As global interdependence and trade expands, Europe may benefit from improving its resource efficiency and knowledge-based economy.
GMT 7: Intensified global competition for resourcesHow will Europe survive in the intensifying scramble for scarce resources? The answer may lie in more efficient production and resource use, new technologies, innovation and increasing cooperation with foreign partners.
SWEDISH ENVIRONMENTAL PROTECTION AGENCY REPORT 6602Impact assessment of global megatrends
18
GMT 8: Decreasing stocks of natural resourcesA larger and richer global population with expanding consumption needs will place growing demands on natural systems for food, water and energy. European resource stocks may likewise face increasing pressures.
GMT 9: Increasingly severe consequences of climate changeThe speed at which climate change has an impact on the environment will threaten food and water supplies, human health, and terrestrial and marine life. Europe may also see more human migration and aggravated pressure on resources supplies.
GMT 10: Increasing environmental pollution loadAn increasingly complex mix of pollutants threatens the Earth’s regulatory mechanisms. Particulates, nitrogen and ground-level ozone merit particular attention because of their complex and potentially far-reaching effects on ecosystem functioning, climate regulation and human health. In addition, many other chemical substances are released into the environment, with effects – in isolation or combined – that are still poorly understood.
GMT 11: Environmental regulation and governance – increasing fragmentation and convergenceThe world is devising new governance models, including multilateral agreements, on numerous issues and public-private ventures. In the absence of global regulations, high European standards and procedures are often adopted worldwide. But will this also be the case in the future?
1.2 Basic aspects of systems thinking1.2.1 basic approachOne of the main characteristics of the “complexity of interlinkages” are feed-back effects and causal networks instead of “simple” linear causal relationships. In systems thinking, causal-loop-analysis and causal loop diagrams (CLDs) are applied, representing a form of conceptual modelling to help grasp these kinds of complex causal relations. Qualitative conceptual modelling is often used to represent highly complex systems as a step towards detailed quantita-tive modelling.
The basic principle behind the approach that we applied is to formulate a clear question about a given problem and to then systematically ask what causal relationships exist between the different factors or concepts, in order to visualise them graphically, and finally, to evaluate these networks with a computer-based tool. When connecting two or more factors with arrows you add more information, while you ask, “Is one factor causing the other to increase or decrease?” “How strong is this effect?” “And is this an immediate or delayed effect?” Figure 1 shows an example of how to make these causal relationships visible in a CLD.
SWEDISH ENVIRONMENTAL PROTECTION AGENCY REPORT 6602Impact assessment of global megatrends
19
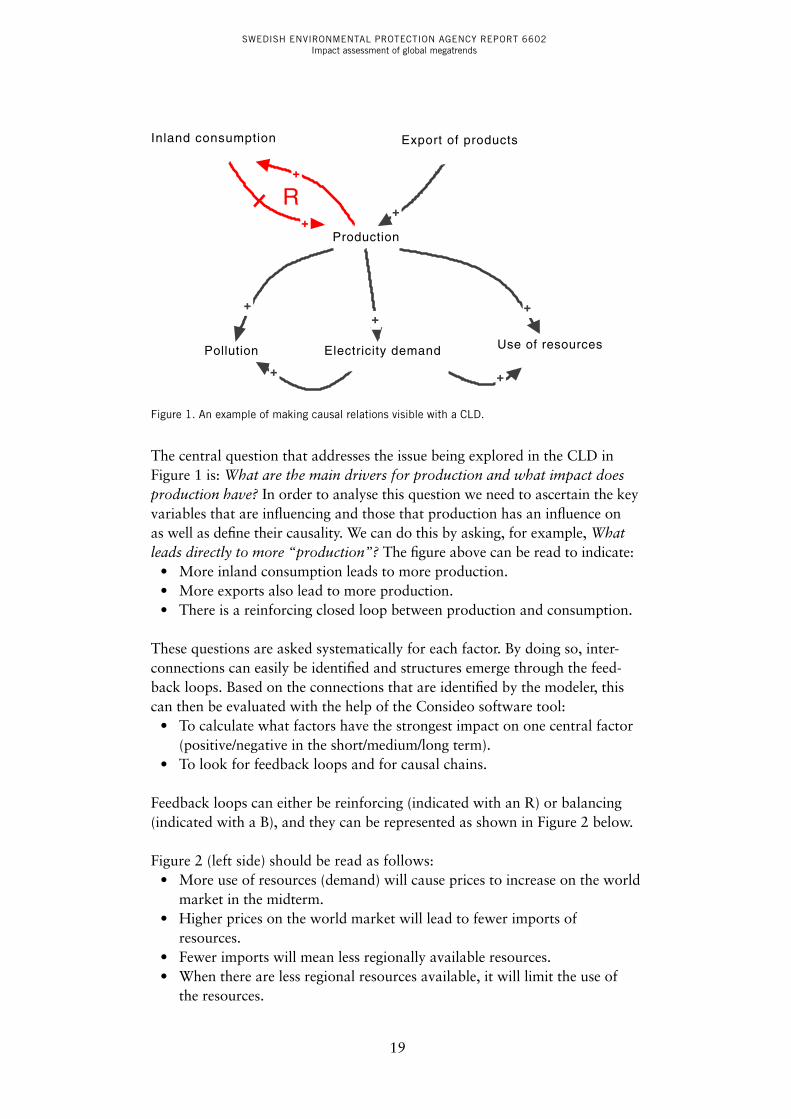
Figure 1. An example of making causal relations visible with a CLD.
The central question that addresses the issue being explored in the CLD in Figure 1 is: What are the main drivers for production and what impact does production have? In order to analyse this question we need to ascertain the key variables that are influencing and those that production has an influence on as well as define their causality. We can do this by asking, for example, What leads directly to more “production”? The figure above can be read to indicate:
• More inland consumption leads to more production.• More exports also lead to more production.• There is a reinforcing closed loop between production and consumption.
These questions are asked systematically for each factor. By doing so, inter-connections can easily be identified and structures emerge through the feed-back loops. Based on the connections that are identified by the modeler, this can then be evaluated with the help of the Consideo software tool:
• To calculate what factors have the strongest impact on one central factor (positive/negative in the short/medium/long term).
• To look for feedback loops and for causal chains.
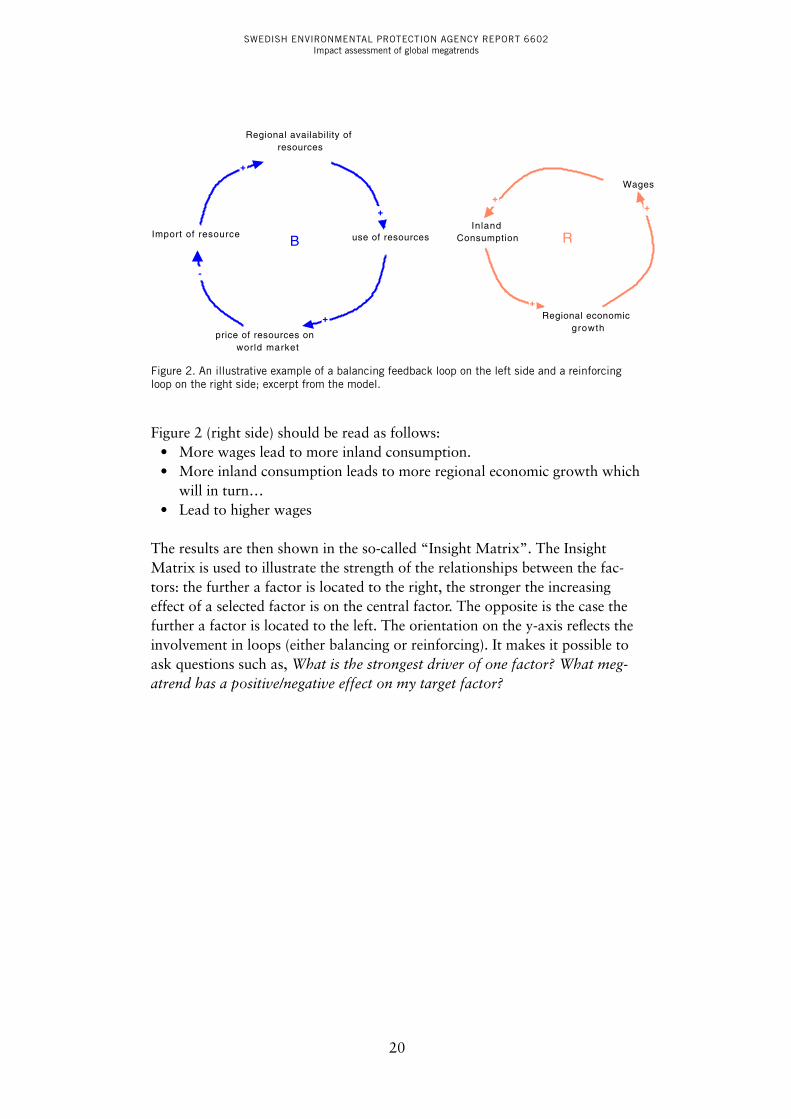
Feedback loops can either be reinforcing (indicated with an R) or balancing (indicated with a B), and they can be represented as shown in Figure 2 below.
Figure 2 (left side) should be read as follows:• More use of resources (demand) will cause prices to increase on the world
market in the midterm.• Higher prices on the world market will lead to fewer imports of
resources.• Fewer imports will mean less regionally available resources.• When there are less regional resources available, it will limit the use of
the resources.
R
+ +
++
+
+
+ +
Use of resources Pollution
Production
Export of products
Electricity demand
Inland consumption
SWEDISH ENVIRONMENTAL PROTECTION AGENCY REPORT 6602Impact assessment of global megatrends
20
Figure 2 (right side) should be read as follows:• More wages lead to more inland consumption.• More inland consumption leads to more regional economic growth which
will in turn…• Lead to higher wages
The results are then shown in the so-called “Insight Matrix”. The Insight Matrix is used to illustrate the strength of the relationships between the fac-tors: the further a factor is located to the right, the stronger the increasing effect of a selected factor is on the central factor. The opposite is the case the further a factor is located to the left. The orientation on the y-axis reflects the involvement in loops (either balancing or reinforcing). It makes it possible to ask questions such as, What is the strongest driver of one factor? What meg-atrend has a positive/negative effect on my target factor?
Figure 2. An illustrative example of a balancing feedback loop on the left side and a reinforcing loop on the right side; excerpt from the model.
B R
+
++
+
+
-
+
Regional availability of resources
InlandConsumptionuse of resourcesImport of resource
Regional economic growth
Wages
price of resources on world market
SWEDISH ENVIRONMENTAL PROTECTION AGENCY REPORT 6602Impact assessment of global megatrends
21
Neg
ativ
e fe
edb
acks
Po
sitiv
e fe
edb
acks
Negative/decreasing impact Positive/increasing impacts
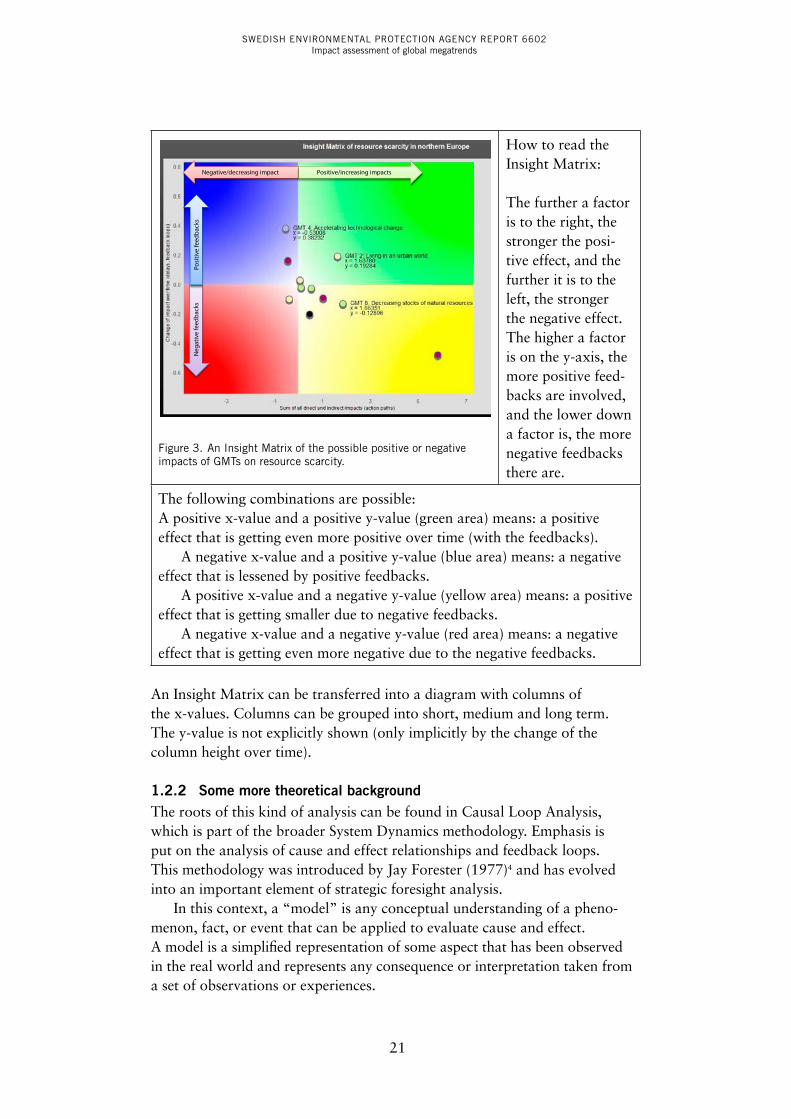
Figure 3. An Insight Matrix of the possible positive or negative impacts of GMTs on resource scarcity.
How to read the Insight Matrix:
The further a factor is to the right, the stronger the posi-tive effect, and the further it is to the left, the stronger the negative effect.The higher a factor is on the y-axis, the more positive feed-backs are involved, and the lower down a factor is, the more negative feedbacks there are.
The following combinations are possible:A positive x-value and a positive y-value (green area) means: a positive effect that is getting even more positive over time (with the feedbacks).
A negative x-value and a positive y-value (blue area) means: a negative effect that is lessened by positive feedbacks.
A positive x-value and a negative y-value (yellow area) means: a positive effect that is getting smaller due to negative feedbacks.
A negative x-value and a negative y-value (red area) means: a negative effect that is getting even more negative due to the negative feedbacks.
An Insight Matrix can be transferred into a diagram with columns of the x-values. Columns can be grouped into short, medium and long term. The y-value is not explicitly shown (only implicitly by the change of the column height over time).
1.2.2 Some more theoretical backgroundThe roots of this kind of analysis can be found in Causal Loop Analysis, which is part of the broader System Dynamics methodology. Emphasis is put on the analysis of cause and effect relationships and feedback loops. This methodology was introduced by Jay Forester (1977)4 and has evolved into an important element of strategic foresight analysis.
In this context, a “model” is any conceptual understanding of a pheno-menon, fact, or event that can be applied to evaluate cause and effect. A model is a simplified representation of some aspect that has been observed in the real world and represents any consequence or interpretation taken from a set of observations or experiences.

SWEDISH ENVIRONMENTAL PROTECTION AGENCY REPORT 6602Impact assessment of global megatrends
22
Studies have shown that there is a tendency to reach a mental barrier when trying to grasp the interconnections between more than four factors with-out the assistance of a computer or pen/pencil and paper. In such cases, there is a tendency to listen to “gut feelings” and follow best practices, e.g. those which have been applied under other circumstances in the past. This can sig-nificantly limit the analytical value and credibility of decisions or outcomes made under the circumstances. Hence, the application of a tool such as quali-tative modelling is an important asset towards understanding complexity.
1.2.3 The use of software toolsIn principal, any conceptual model can be developed and drawn on a piece of paper. However, to identify, interpret and analyse loops, causal chains and potential impacts of factors, the classical pen and paper method reaches its limits. Having the support of computer tools becomes essential at a certain point. There are quite a few visualisation tools available on the market, mainly in the area of system dynamics and the preparation/visualisation of SD models5. In the case of qualitative modelling, there are only very few visualisation and assessment tools available. Worth mentioning are so-called “fuzzy cognitive maps”, which can be drawn as simple block diagrams, assessed with Excel tools and evaluated with network theory6. Another tool worth mentioning for quali-tative modelling and simulation is “Garp3”7.
Figure 4. An example of how an Insight Matrix can be transformed into a bar chart. The y-axis shows the relative impact of the respective global megatrend on the central factor (here: resource scarcity in northern Europe) standardised to 100% (highest impact). The short, medium and long term impacts are shown for each global megatrend (GMT).
GMT 1 GMT 2 GMT 3 GMT 4 GMT 5 GMT 6 GMT 7 GMT 8 GMT 9 GMT 10 GMT 11-20
0
20
40
60
80
100
Possible impact of GMT on resource scarcity in northern Europe
shortmediumlong
Sca
led
rela
tive
impa
ct [%
]

SWEDISH ENVIRONMENTAL PROTECTION AGENCY REPORT 6602Impact assessment of global megatrends
23
In this study we used the Consideo Modeler and iModeler. Qualitative model-ling with the use of Consideo is a further development bringing together ele-ments of CLD (system dynamics) and fuzzy cognitive maps. During the course of the study, we switched from the Modeler 7.5 to the iModeler. Although the algorithms are the same, the iModeler is web oriented and allows for cloud computing and collaborative modelling. Hence, the layout of the screenshots is different. This can also be seen in this report as not all screenshots have been reworked to the Modeler 7.5 or the iModeler. More information about the tool and concept can be found online8.
SWEDISH ENVIRONMENTAL PROTECTION AGENCY REPORT 6602Impact assessment of global megatrends
24
2 Case Study I: “Possible impacts of global megatrends on resources scarcity (general concept from the perspective of northern Europe)”
2.1 Introduction2.1.1 Purpose of the studyThe study examines the general mechanism of resource scarcity. The global megatrends – as described in the SOER 2010 – are included in the model as well as some measures from the EU Roadmap on Resource Efficiency. By taking this approach the model is able to answer the following main questions:
What exactly are the mechanisms of resource use and scarcity, respectively? ->Section 2.2
Which of the GMTs most greatly promotes (or hinders) the problem of resource scarcity (and how)? -> Section 2.3
Which of the principal approaches of the EU roadmap possibly has the greatest potential to reduce the challenge of resource scarcity? -> Section 2.4
Before answering these central questions, some definitions of the term “resources” will be presented in light of European Resource Efficiency Policy, including a brief overview of policy approaches to address the topic of “resource efficiency”. A short overview of the model design will be provided before we present a more detailed analysis of how to interpret the model.
2.1.2 resources and resource efficiency policy in the EuA resource is a source or supply from which benefit is produced. Typically, resources are materials or other assets that are transformed to produce benefit, and in the process, they may be consumed or made unavailable. From a human perspective, a natural resource is anything obtained from the environment to satisfy human needs and wants. From a broader biological or ecological per-spective, a resource satisfies the needs of a living organism. Resources such as raw materials, energy, food, water and land are directly used as the basis of our economyii. In addition, other natural resources such as clean air, biodiversity and ecosystems provide environmental and social services and are therefore fundamental to our wealth and quality of life. But we live in a finite system in which the supply of natural resources is by definition limited, and growing global demand puts even more pressure on the environment. Resource use,
ii The EU has a broad understanding of resources, defined e.g. in the Thematic Strategy on Sustainable Use of Natural Resources or the Roadmap for a Resource-efficient Europe
SWEDISH ENVIRONMENTAL PROTECTION AGENCY REPORT 6602Impact assessment of global megatrends
25
especially unsustainable use, changes our ecosystem: land use, soil depletion, water consumption and many other human interventions, among other things, all lead to climate change and biodiversity loss. In the EU, we currently use 16 tonnes of materials per capita every year. In total, this is eight billion tonnes per year. Globally, raw materials production will increase from its level of 53 billion tonnes in 2005 to 80 billion tonnes by 2020 according to an estimation by the OECD9.
The need to address the challenge of the unsustainable use of natural resources has been recognised in several high-level EU policy documents. In 2001, the EU Sustainable Development Strategy10 identified seven unsus-tainable trends hindering the sustainable development of the EU, and defined the need for more efficient use of resources to ensure sustainable growth in the future. In 2005, the EU Commission adopted its Thematic Strategy on the Sustainable Use of Natural Resources11 in response to the growing evidence that the intensive use of natural resources is taking an increasing toll on the planet. The overall objective of the strategy was to reduce the negative environmen-tal impacts generated by the use of natural resources in generating economic growth. Therefore, the strategy introduced the concept of double decoupling, which refers to the decoupling of resource use from economic growth as well as the decoupling of environmental impacts from the related resource use. Furthermore, the strategy recognised the need for a life cycle perspective when tackling unsustainable resource use, as the environmental impacts are often distributed along the entire production chain of products. With its Action Plan on Sustainable Consumption and Production and Sustainable Industrial Policy12 the EU Commission intends to reduce the environmental impacts that stem from the retail sector and foster sustainable products.
Further recognition of its strategic importance is indicated by the inclu-sion of sustainable resource use as a topic addressed in the Europe 2020 strat-egy13. The sustainable and efficient use of natural resources was recognised as crucial for the further economic development in the EU and became a focus of one of the seven flagship initiatives within the strategy. The flagship initia-tive A Resource Efficient Europe14 sets out a framework to ensure that policies in all relevant areas produce results on resource efficiency. It explains how the focus on resource efficiency in policymaking is both a necessity and an oppor-tunity for the EU. One of the major elements of the flagship initiative is the Roadmap for a Resource Efficient Europe15, which was published in September 2011. This roadmap describes the EU’s vision for a resource efficient and sus-tainable European economy and proposes ways to increase resource produc-tivity and decouple economic growth from resource use and its environmental impact. It illustrates how policies interrelate and build on each other. It sets out milestones until 2020 and suggests policy measures and instruments on the way to making Europe the most resource-efficient economy worldwide.
Modern societies depend on a secure supply of a variety of raw materials to a very high degree. Many industries such as construction, chemicals, auto-motive, aerospace, machinery and equipment manufacturing, which provide
SWEDISH ENVIRONMENTAL PROTECTION AGENCY REPORT 6602Impact assessment of global megatrends
26
a total value added of €1,324 billion and employment for some 30 million people, all depend on access to raw materials. Many of these are imported into the EU as they are not available or cannot be extracted in an adequate amount within Europe. Especially metallic minerals need to be imported as the domestic production is limited to about 3% of the world production. Based on the assumption that the success of the EU economy is vulnerable to increasing price volatility, price increases and insecurity of raw material supply, the EU Commission published The Raw Material Initiative – Meeting our Critical Needs for Growth and Jobs in Europe16. This initiative proposes to develop a European policy safeguarding the EU raw material supply to ensure that the EU has sufficient access to raw materials at fair and undis-torted prices. This strategy is based on three pillars, (i) access to raw materi-als on world markets at undistorted conditions, (ii) foster sustainable supply of raw materials from European sources and (iii) reduce the EU’s consump-tion of primary raw materials. In 2011, the EU published a strategy entitled Tackling the Challenges in Commodity Markets and on Raw Materials17. This strategy incorporated the three pillars and proposed a variety of instruments and policy measures such as bilateral raw material partnerships with material-rich countries, the improvement of framework conditions for exploration and extraction of raw materials within the EU, the increase of material specific recycling rates and the intensification of circular flow economy. To underpin the second pillar, the sustainable supply with raw materials from within the EU, the European Commission set up the European Innovation Partnership (EIP) on Raw Materials18 in February 2012. With this partnership, non-ener-getic and non-agricultural raw materials are addressed. With the clear focus on innovations along the entire value chain of raw materials it also provides a direct link to the lead initiative “Innovation Union” under the Europe 2020 strategy. The EIP on raw materials brings together several EU member states, companies and research teams who will jointly promote innovations – from exploration to extraction processing to recycling, but also the substitution of raw materials. Although the focus is on technologically driven solutions, the use of instruments on the demand side, e.g. non-technological options are taken into account. Expected results of the EIP on raw materials are quite practical such as building up ten innovative pilot/demonstration plants and substituting at least three key applications of critical and scarce raw materials by 2020.
The Roadmap for a Resource Efficient Europe, the raw material strategy as well as the European Innovation Partnership on Raw Materials all three attempt to address several of the global megatrends described above (e.g. GMT 5, GMT 7, GMT 8 and GMT 10), and can be viewed as the EU Commission’s answer to the different forms of resource scarcity as described below.

SWEDISH ENVIRONMENTAL PROTECTION AGENCY REPORT 6602Impact assessment of global megatrends
27
Any resource that comes from a source is used and goes to a sinkiii. Basically, what we mean by this are material natural resources, which are derived from the environment and not from other resources (production factors) such as “work force” or “capital”. Many of these natural resources are essential for human survival, while others are used for satisfying human desires. Natural resources may be further classified in different ways:
• Abiotic – biotic resources: abiotic resources comprise non-living things (e.g. land, water, air and minerals such as gold, iron, copper and silver) while biotic resources are obtained from the biosphere, e.g. wood or fish. Minerals such as coal and petroleum are sometimes included in this cate-gory because they were formed from fossilised organic matter, albeit over long periods of time.
Natural resources can be categorised on the basis of renewability:• Non-renewable resources are formed over very long geological periods.
Minerals and fossils are included in this category. Since their rate of forma-tion is extremely slow, they cannot be replenished once they are depleted. Out of these, the metallic minerals can be re-used by recycling them, but many resources including fossil fuels (e.g. coal, gas) and petroleum based by-products cannot be recycled.
• Renewable resources, such as forests and fisheries, can be replenished or reproduced relatively quickly. However, overexploitation beyond replenishment rates or resource use which damages the conditions for reproduction may lead the source to run dry (or collapse in the case of a population or ecosystem).
2.1.3 Overview of the model on resource scarcityAny scarcity is a function of a mismatch between offer (supply) and demand.
The model is a generic model which means that the goal of the model is to understand and explain the principal mechanism of resource scarcity. Of course there would be differences in the model when talking about finite resources such as e.g. crude oil or renewable resources like wood. With respect to minerals and metals it is not the intention of this report to discuss whether these resources are scarce per se or if there are unlimited (but undis-covered) reserves in the crust of the earth.
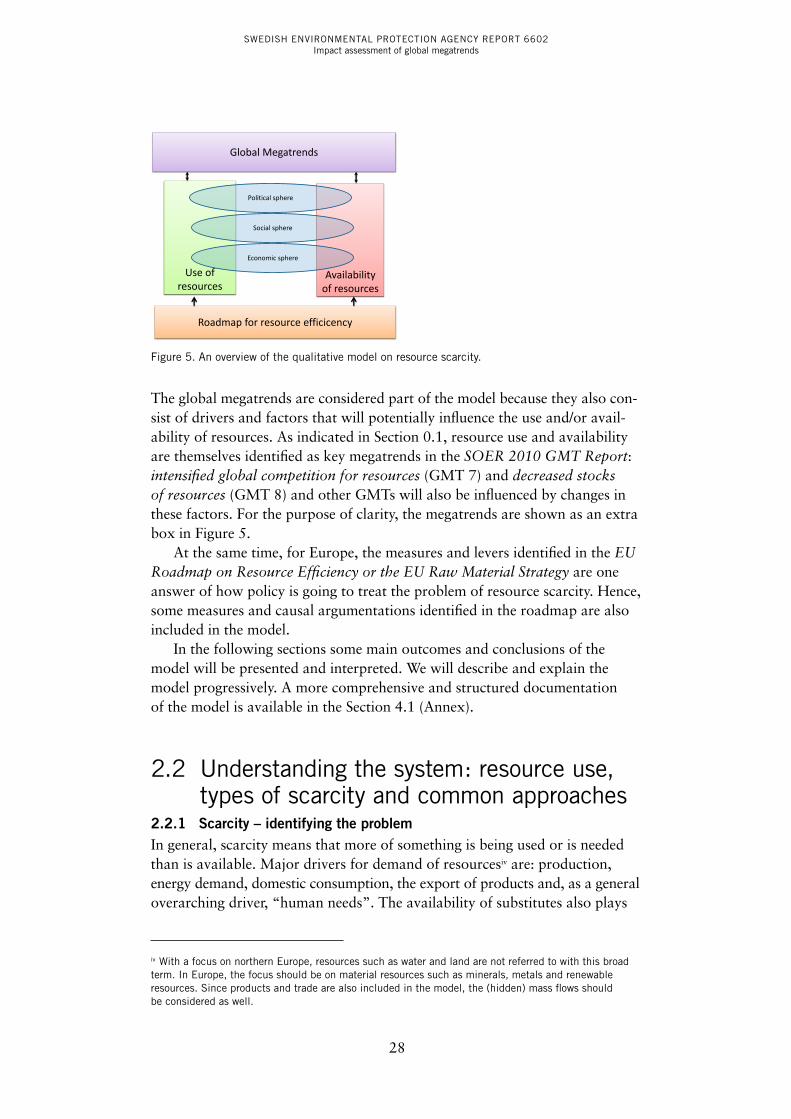
Figure 5 gives a broad overview of the model that we developed. It shows two main boxes, the use of resources and the availability of resources (offer/supply). These two boxes are determined (mainly) by activities and outcomes within different subsystems or spheres, like the social sphere, the economic sphere and the political sphere. For each, the use and the availability of resources is determined and driven by various factors from these interacting spheres. Of course, the availability of resources is determined by the physical world around us.
iii Applies only to material resources, not to the natural resources, land, ecosystem services, biodiversity etc. mentioned above
SWEDISH ENVIRONMENTAL PROTECTION AGENCY REPORT 6602Impact assessment of global megatrends
28
Figure 5. An overview of the qualitative model on resource scarcity.
The global megatrends are considered part of the model because they also con-sist of drivers and factors that will potentially influence the use and/or avail-ability of resources. As indicated in Section 0.1, resource use and availability are themselves identified as key megatrends in the SOER 2010 GMT Report: intensified global competition for resources (GMT 7) and decreased stocks of resources (GMT 8) and other GMTs will also be influenced by changes in these factors. For the purpose of clarity, the megatrends are shown as an extra box in Figure 5.
At the same time, for Europe, the measures and levers identified in the EU Roadmap on Resource Efficiency or the EU Raw Material Strategy are one answer of how policy is going to treat the problem of resource scarcity. Hence, some measures and causal argumentations identified in the roadmap are also included in the model.
In the following sections some main outcomes and conclusions of the model will be presented and interpreted. We will describe and explain the model progressively. A more comprehensive and structured documentation of the model is available in the Section 4.1 (Annex).
2.2 Understanding the system: resource use, types of scarcity and common approaches
2.2.1 Scarcity – identifying the problemIn general, scarcity means that more of something is being used or is needed than is available. Major drivers for demand of resourcesiv are: production, energy demand, domestic consumption, the export of products and, as a general overarching driver, “human needs”. The availability of substitutes also plays
iv With a focus on northern Europe, resources such as water and land are not referred to with this broad term. In Europe, the focus should be on material resources such as minerals, metals and renewable resources. Since products and trade are also included in the model, the (hidden) mass flows should be considered as well.
Global Megatrends
Use of resources
Availability of resources
Roadmap for resource efficicency
Political sphere
Social sphere
Economic sphere
SWEDISH ENVIRONMENTAL PROTECTION AGENCY REPORT 6602Impact assessment of global megatrends
29
a role. Major determinants of regional availability are the stocks of natural resources, geological reserves, imports from global stocks and the adoption and success of the circular economy (recycling, reusing).
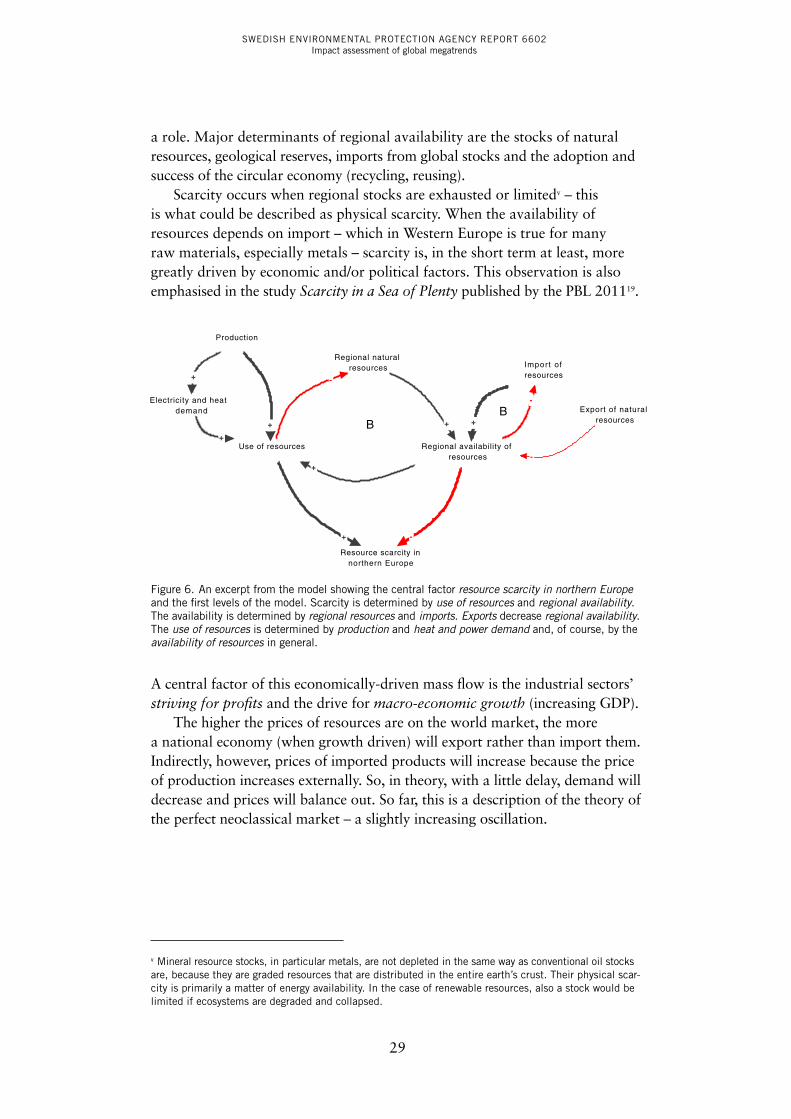
Scarcity occurs when regional stocks are exhausted or limitedv – this is what could be described as physical scarcity. When the availability of resources depends on import – which in Western Europe is true for many raw materials, especially metals – scarcity is, in the short term at least, more greatly driven by economic and/or political factors. This observation is also emphasised in the study Scarcity in a Sea of Plenty published by the PBL 201119.
v Mineral resource stocks, in particular metals, are not depleted in the same way as conventional oil stocks are, because they are graded resources that are distributed in the entire earth’s crust. Their physical scar-city is primarily a matter of energy availability. In the case of renewable resources, also a stock would be limited if ecosystems are degraded and collapsed.
Figure 6. An excerpt from the model showing the central factor resource scarcity in northern Europe and the first levels of the model. Scarcity is determined by use of resources and regional availability. The availability is determined by regional resources and imports. Exports decrease regional availability. The use of resources is determined by production and heat and power demand and, of course, by the availability of resources in general.
A central factor of this economically-driven mass flow is the industrial sectors’ striving for profits and the drive for macro-economic growth (increasing GDP).
The higher the prices of resources are on the world market, the more a national economy (when growth driven) will export rather than import them. Indirectly, however, prices of imported products will increase because the price of production increases externally. So, in theory, with a little delay, demand will decrease and prices will balance out. So far, this is a description of the theory of the perfect neoclassical market – a slightly increasing oscillation.
BB
+
-
+
+
+
-
-
+
+
-
+
Resource scarcity in northern Europe
Export of natural resources
Regional availability of resources
Regional natural resources
Use of resources
Electricity and heatdemand
Import of resources
Production
SWEDISH ENVIRONMENTAL PROTECTION AGENCY REPORT 6602Impact assessment of global megatrends
30
There are at least two possible (and critical) matters that disturb this self-regu-lation: artificially altered prices of resources on the world market and reaching the natural limit of a carrying capacity (extensively described in D. Meadows et al.20; Rockström21). In addition to this, prices of natural resources, in gen-eral, do not reflect their “true” cost. This applies to the environmental and social externalities of the resource extraction, processing and use that are not reflected in the cost (price) of that resource at all stages in the value chain. This is a key factor in the depletion of natural resources and the extensive damage caused to ecosystems as a result.
Surpassing natural limits in the form of carrying capacities is the more detrimental problem, and is – incidentally – also driven by population growth and rising living standards (“overshot and collapse”). Some studies surmise that on a global scale we are already exceeding our carrying capacity for some of the earth’s systems, e.g. the WWF (2012) used ecological footprinting to calculate that in 2008, the footprint of global consumption and production exceeded the world’s biocapacity (defined as the area of land and productive oceans actually available to produce renewable resources and absorb CO2
emissions) by more than 50%22.However, in the context of our model, the artificially altered prices of
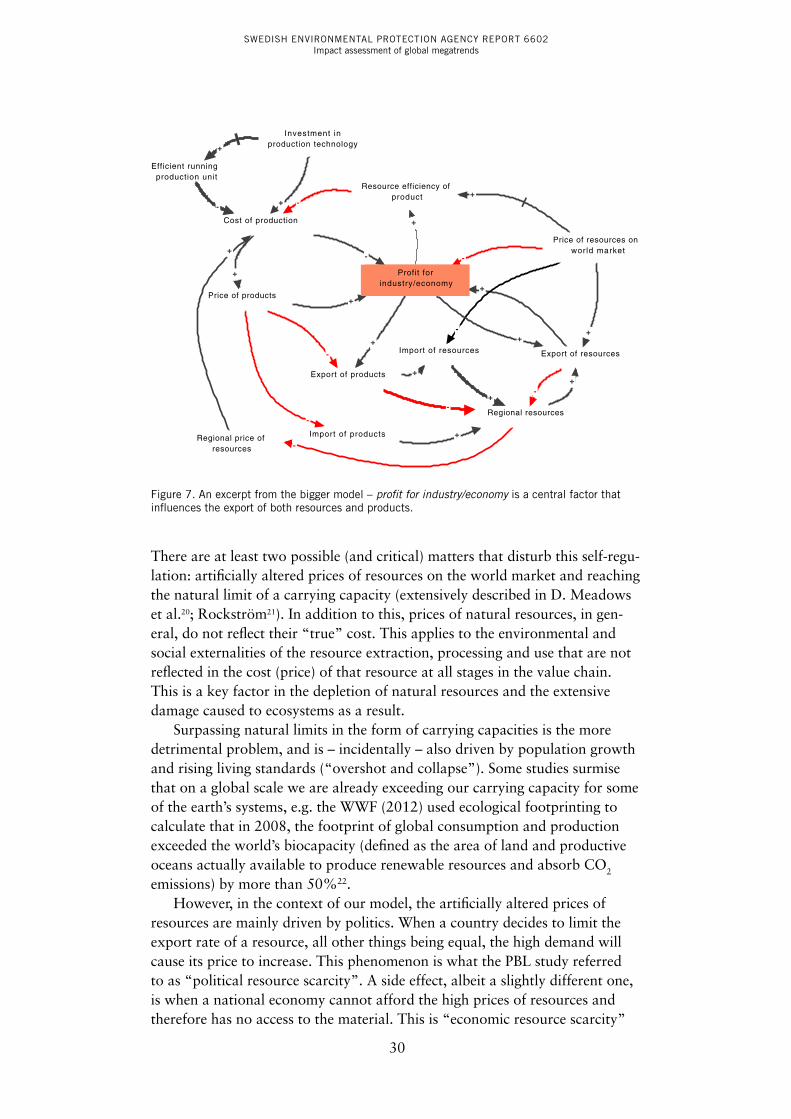
resources are mainly driven by politics. When a country decides to limit the export rate of a resource, all other things being equal, the high demand will cause its price to increase. This phenomenon is what the PBL study referred to as “political resource scarcity”. A side effect, albeit a slightly different one, is when a national economy cannot afford the high prices of resources and therefore has no access to the material. This is “economic resource scarcity”
Figure 7. An excerpt from the bigger model – profit for industry/economy is a central factor that influences the export of both resources and products.
+
-
-
+
-
+
-
+
+
+
+
-
-
+
+-
-
+
+ +
+
+
+
-
-
Profit for industry/economy
Price of resources on world market
Efficient runningproduction unit
Investment in production technology
Import of resources
Export of products
Resource efficiency of product
Regional price of resources
Export of resources
Price of products
Regional resources
Cost of production
Import of products
SWEDISH ENVIRONMENTAL PROTECTION AGENCY REPORT 6602Impact assessment of global megatrends
31
(which could be influenced by political decisions elsewhere). While the political resource scarcity can be dealt with through negotiations and agreements, the “economic resource scarcity”, when prompted by limited global reserves of the respective resource, will be a serious problem and a question of global equity and hence possible conflicts. Recent events in relation to the trading of commodities in global financial markets, and the subsequent impact on food prices, have raised awareness about artificially high food prices23.
These general principles can be applied differently to, for example, the scarcity of drinking water in various regions.
From an environmental perspective, an additional issue is that higher prices for resources can make alternative sources of these resources more attractive. And this may potentially have significant consequences. For example, as oil and gas prices increase, the additional cost associated with hugely damaging extraction methods, such as tar sands and “fracking”, become economically attractive to producers. Likewise, global food prices may make the destruction of natural ecosystems for agricultural production a more attractive proposition economically, as can be seen in the conversion of vast areas of rainforest to palm oil plantations and cattle grazing to meet increased global demands for vegetable oils and meat (especially beef).
2.2.2 Increasing efficiencyIt seems counterintuitive, but the world market prices of resources mentioned above can also play a key role in increasing resource efficiency as well as have an effect on technological innovation. This becomes clear when taking into account that the high prices of resources encourage the better use of available resources and result in less wastage. However, this benefit is limited to the extent that a given resource is still being used and access to new resources might be limited. Another problem might arise when the national economy is so stressed that investment in technological innovation is no longer possi-ble. Interestingly enough, trade barriers have a comparable effect: a national economy cut off from some resources must be as efficient as possible until the resources (financially, intellectually, materials) are gone before it will continue developing technological innovation and the entire economy starts shifting or collapsing.
The contrary effect occurs when there is a huge abundance of resources. No real necessity is there to increase efficiency (e.g. less fuel-demanding cars).
In summary, increasing efficiency is a key measure, but it will not prevent the scarcity of resources in the long run; the problem will only be shifted until the future24, vi. This also applies to the other key measures such as recycling and substitution. On account of the fact that 100% recycling is thermody-namically impossible, recycling, too, can only shift scarcity to the future (in a steady or growing economy).
vi As Georgescu-Roegen postulated, from a thermodynamic point of view, physical scarcity of primary resources is inevitable (in the very long term). We have no other option than to shift physical scarcity to the future.
SWEDISH ENVIRONMENTAL PROTECTION AGENCY REPORT 6602Impact assessment of global megatrends
32
Substitution on a material level will only replace one resource with another and thus also only shift scarcity to the future. Another factor is that efficiency has been shown to lead to consumption elsewhere: through the “re-bound effect”, which means that efficiency savings in one form of consumption (e.g. a more efficient boiler) will often be, at least partially, offset by increased con-sumption elsewhere (e.g. by using the more efficient boiler to keep your house warmer!)25. In the next section (“Balancing effects”) rebound effects will be discussed in more detail.
Accompanying measures should be directly linked to domestic consump-tion, production and exports, i.e. the current model of economy and growth.
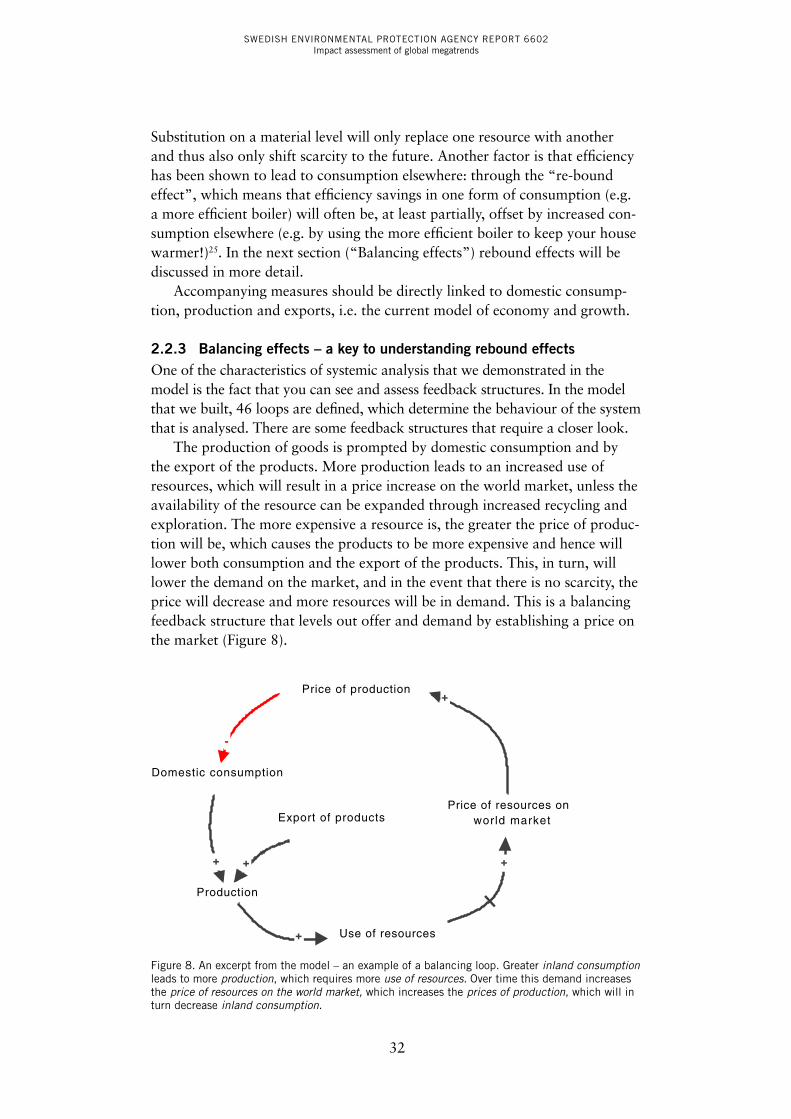
2.2.3 balancing effects – a key to understanding rebound effectsOne of the characteristics of systemic analysis that we demonstrated in the model is the fact that you can see and assess feedback structures. In the model that we built, 46 loops are defined, which determine the behaviour of the system that is analysed. There are some feedback structures that require a closer look.
The production of goods is prompted by domestic consumption and by the export of the products. More production leads to an increased use of resources, which will result in a price increase on the world market, unless the availability of the resource can be expanded through increased recycling and exploration. The more expensive a resource is, the greater the price of produc-tion will be, which causes the products to be more expensive and hence will lower both consumption and the export of the products. This, in turn, will lower the demand on the market, and in the event that there is no scarcity, the price will decrease and more resources will be in demand. This is a balancing feedback structure that levels out offer and demand by establishing a price on the market (Figure 8).
Figure 8. An excerpt from the model – an example of a balancing loop. Greater inland consumption leads to more production, which requires more use of resources. Over time this demand increases the price of resources on the world market, which increases the prices of production, which will in turn decrease inland consumption.
+ +
-
+
+
+
Export of products
Production
Price of production
Use of resources
Domestic consumption
Price of resources on world market
SWEDISH ENVIRONMENTAL PROTECTION AGENCY REPORT 6602Impact assessment of global megatrends
33
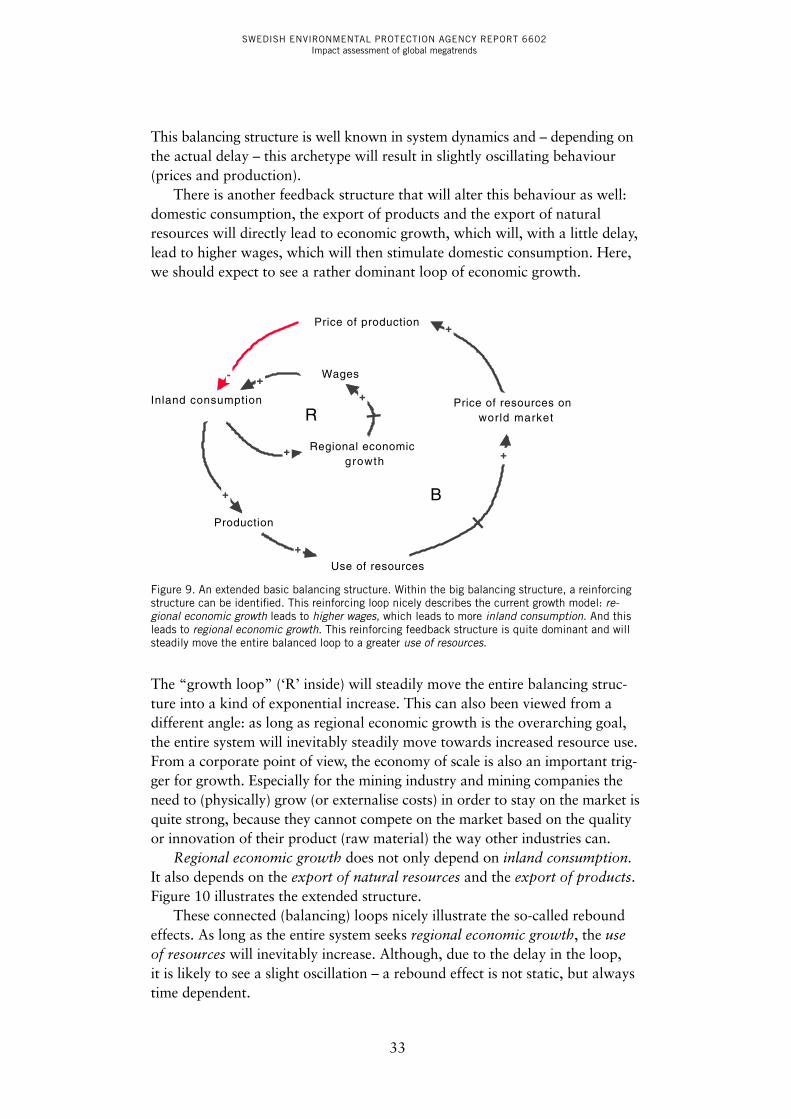
This balancing structure is well known in system dynamics and – depending on the actual delay – this archetype will result in slightly oscillating behaviour (prices and production).
There is another feedback structure that will alter this behaviour as well: domestic consumption, the export of products and the export of natural resources will directly lead to economic growth, which will, with a little delay, lead to higher wages, which will then stimulate domestic consumption. Here, we should expect to see a rather dominant loop of economic growth.
Figure 9. An extended basic balancing structure. Within the big balancing structure, a reinforcing structure can be identified. This reinforcing loop nicely describes the current growth model: re-gional economic growth leads to higher wages, which leads to more inland consumption. And this leads to regional economic growth. This reinforcing feedback structure is quite dominant and will steadily move the entire balanced loop to a greater use of resources.
The “growth loop” (‘R’ inside) will steadily move the entire balancing struc-ture into a kind of exponential increase. This can also been viewed from a different angle: as long as regional economic growth is the overarching goal, the entire system will inevitably steadily move towards increased resource use. From a corporate point of view, the economy of scale is also an important trig-ger for growth. Especially for the mining industry and mining companies the need to (physically) grow (or externalise costs) in order to stay on the market is quite strong, because they cannot compete on the market based on the quality or innovation of their product (raw material) the way other industries can.
Regional economic growth does not only depend on inland consumption. It also depends on the export of natural resources and the export of products. Figure 10 illustrates the extended structure.
These connected (balancing) loops nicely illustrate the so-called rebound effects. As long as the entire system seeks regional economic growth, the use of resources will inevitably increase. Although, due to the delay in the loop, it is likely to see a slight oscillation – a rebound effect is not static, but always time dependent.
B
R
+
+
-
+
+
+
+
+
Production
Wages
Inland consumption Price of resources on world market
Regional economic growth
Price of production
Use of resources
SWEDISH ENVIRONMENTAL PROTECTION AGENCY REPORT 6602Impact assessment of global megatrends
34
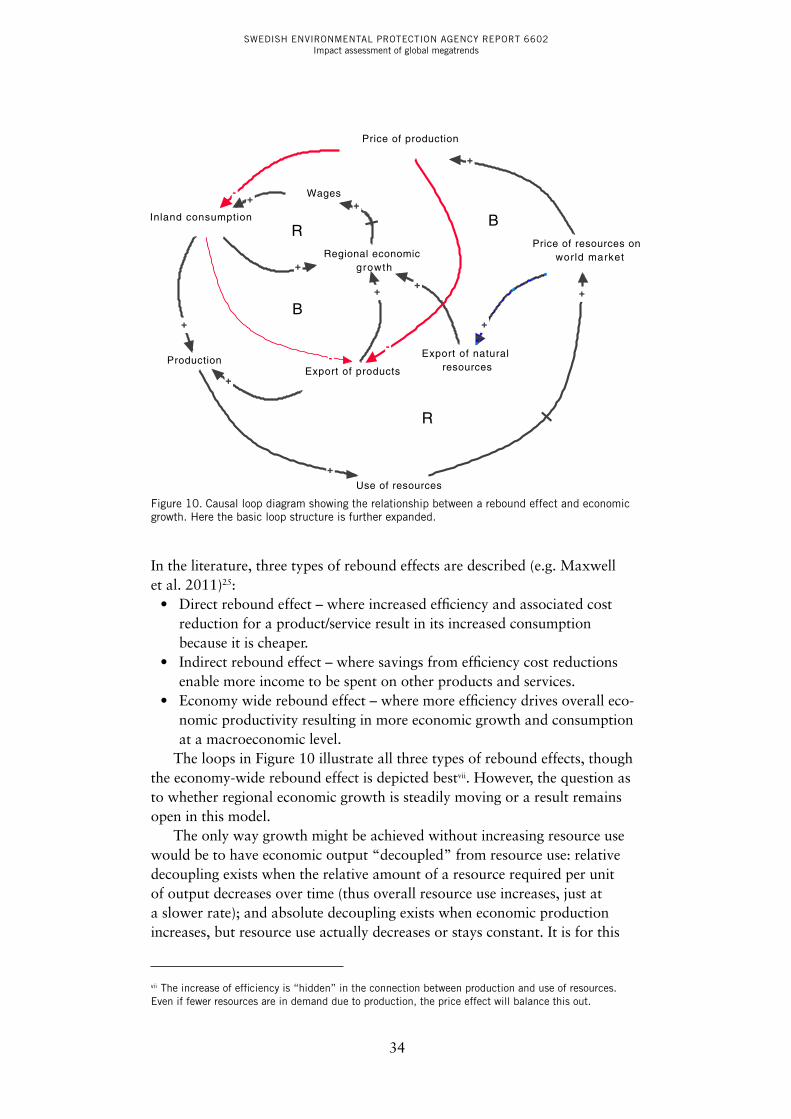
In the literature, three types of rebound effects are described (e.g. Maxwell et al. 2011)25:
• Direct rebound effect – where increased efficiency and associated cost reduction for a product/service result in its increased consumption because it is cheaper.
• Indirect rebound effect – where savings from efficiency cost reductions enable more income to be spent on other products and services.
• Economy wide rebound effect – where more efficiency drives overall eco-nomic productivity resulting in more economic growth and consumption at a macroeconomic level.
The loops in Figure 10 illustrate all three types of rebound effects, though the economy-wide rebound effect is depicted bestvii. However, the question as to whether regional economic growth is steadily moving or a result remains open in this model.
The only way growth might be achieved without increasing resource use would be to have economic output “decoupled” from resource use: relative decoupling exists when the relative amount of a resource required per unit of output decreases over time (thus overall resource use increases, just at a slower rate); and absolute decoupling exists when economic production increases, but resource use actually decreases or stays constant. It is for this
vii The increase of efficiency is “hidden” in the connection between production and use of resources. Even if fewer resources are in demand due to production, the price effect will balance this out.
Figure 10. Causal loop diagram showing the relationship between a rebound effect and economic growth. Here the basic loop structure is further expanded.
B
B
R
R
+
+
+
-
+
+
-
-
+
+
+
+
+
+
Regional economic growth
Use of resources
Export of products
Price of production
Inland consumption
Price of resources on world market
Export of natural resources
Production
Wages
SWEDISH ENVIRONMENTAL PROTECTION AGENCY REPORT 6602Impact assessment of global megatrends
35
reason that resource use will only decrease (or stay constant) where absolute decoupling has been achieved. However, a recent major study by UNEP has concluded that absolute decoupling is rareviii and is only to be expected in ambitious scenarios in which significant changes are made in economic and consumption policy and practice.
2.2.4 Ambivalence of impacts and effectsOne of the particularities of systemic models is that it is possible to overcome purely singular linear thinking, where one effect is being caused mainly for one reason only. Normally, causal chains or feedback loops of various factors or even combinations of loops and chains determine the overall effect.
These ambivalent relationships could, for example, be identified between the factors economic growth and the use of resources. There is evidence that GDP and the use of resources (domestic material consumption) is coupled. Recent developments have, however, shown that a sort of decoupling has taken place.
The model indicates that there are approximately 135 causal connections between continued economic growth (GMT 5) and the use of resources (and use of resources is involved in 240 feedback loops). Some of these 135 causal chains show that GMT 5 has an increasing effect on the use of resources, but others have a decreasing effect. Together, all of these 135 partly ambivalent effects have an increasing effect on the use of resources.
The main ambivalence that ensues regarding the possible impact of eco-nomic growth can be explained by the fact that economic growth is also cor-related with technological innovations. On the one hand economic growth leads to an increased use of resources while the growth in GDP is currently correlated with the investments made in innovations that lead to improved resource efficiency26. The role of “services” and other factors that increase GDP are not included in the model. Therefore, a more comprehensive analysis of the decoupling of resource use and growth of GDP is not possible with the present model.
2.3 Possible impacts of global trendsOne of the main purposes of this model was to assess and evaluate the pos-sible impact that global megatrends have on a regional topic such as resource scarcity. A challenge in this context is the fact that a global megatrend is per definition made up of various trends. It therefore requires cautious reflection on how to integrate the various global megatrends into a causal loop model.
viii UNEP International Resource Panel (2011) Decoupling Natural Resource Use and Environmental Im-pacts from Economic Growth: http://www.unep.org/resourcepanel/Publications/Decoupling/tabid/56048/Default.aspx (accessed 6 September 2012)

SWEDISH ENVIRONMENTAL PROTECTION AGENCY REPORT 6602Impact assessment of global megatrends
36
The core model was developed without explicitly incorporating any megatrends into it. The model was developed in an exploratory way, i.e. questions were asked to identify both the promoting and hindering factors based on the cen-tral factor. In due course, global factors were then included that related to the global megatrends as described by the EEA. The following table shows the factors that relate to the GMTs as they appear in the model:
Table 1. A list of the global factors in the generic model for resource scarcity.
global factor in the model Short description
Growing world population Overall world population is still growing and will be growing in the coming years. Models suggest a population peak around 2030.
Urbanisation The general fact that more and more people all over the world will be living in cities is referred to here. Urban sprawl and the emptying of rural areas in northern Europe are not represented by this factor.
Climate change Climate change is a slow process. However, this factor clearly indicates that we have to expect changes such as rising sea levels, an increase in the average temperature (causing extreme weather events, like droughts, flooding and heat waves).
Long range transboundary air pollution (LRTAP)
The problem of the long range transport of acidifying and eutro-phying substances has still not been solved. Precursors to ground level ozone are also still omnipresent in the atmosphere.
Global economy This is a rather fuzzy factor, which summarises the world’s eco-nomic activities. Since certain countries such as Brazil, China, India and others have strong growth rates, the average world economy is growing in terms of GDP. Hence, we assume that the use of resources and that of wealth (as well as affluence) are increasing, too.
The following table lists the factors in the model that are not global per se, but rather regional particularities of the global trends.
Table 2. A list of factors in the generic model for resource scarcity which indicate the factors’ regional particularities in relation to the specific global trend.
Factor in the model Short description
Ageing population Especially in the northern parts of industrialised Europe the population is getting older and older. Reasons for this are longer life expectancy, on average fewer children per woman, higher average age when women have their first child, and generally less woman at a childbearing age.
An ageing population creates huge challenges in terms of pension funds, infrastructure (also technology) and care services.
Migration In the northern countries more people are immigrating than emigrating. Pressure rises in crisis countries such as northern Africa, the Middle East and eastern Europe. Within the northern regions, Scandinavian countries have even more immigration than Germany does.
Decreasing population Population in northern Europe is decreasing on average. However, this may not be the case regionally, mainly due to the trend of urbanisation.
The factors in the model that were identified as belonging to a GMT (as described in the SOER) have been linked to a factor called GMTXX. We applied the rule that every GMT carries the same strength of impact when “entering” the model. Differences in impact come about on account

SWEDISH ENVIRONMENTAL PROTECTION AGENCY REPORT 6602Impact assessment of global megatrends
37
of the different lengths of the chains, ambivalent effects and feedback loops. Taking this approach enables us to actually compare the different megatrends with respect to the “relative potential impact” they have on the central factor resource scarcity (Figure 11) and analyse how the differences between them can be explained.
It is important to be cautious when reading the graphs: the columns do not represent absolute values or probabilities; they show their potential impact in relation to each other, i.e. the potentially strongest impact (GMT 5 short term) is scaled to 100 and all the other GMTs must be viewed in relation to this.
Figure 11. A bar chart of possible impacts of the GMT on resource scarcity in northern Europe based on the Insight Matrix.
The following key observations can be drawn from the figure above:• Most GMTs are potentially increasing resource scarcity such as GMT 2
(urbanisation), GMT 5 (global economic development), GMT 6 (from unipolar to multipolar world), GMT 8 (decrease of stocks of natural resources), GMT 9 (increasingly severe consequences of climate change) and GMT 11 (environmental regulation).
• Some GMTs are potentially decreasing resource scarcity such as GMT 3 (disease burdens and risk of new pandemics), GMT 4 (accelerating technological change) and to a certain extent GMT 7 (intensified global competition for resources), which changes from having a potentially increasing impact to having a decreasing impact.
• Some GMTs play only a minor role such as GMT 1 (divergence of popu-lation trends) and GMT 10 (increasing environmental pollution load).
The potential impact – be it positive or negative – changes in nearly all cases when considered in the short, medium and long term.
GMT 1 GMT 2 GMT 3 GMT 4 GMT 5 GMT 6 GMT 7 GMT 8 GMT 9 GMT 10 GMT 11-20
0
20
40
60
80
100
Possible impact of GMT on resource scarcity in northern Europe
shortmediumlong
Sca
led
rela
tive
impa
ct [%
]
SWEDISH ENVIRONMENTAL PROTECTION AGENCY REPORT 6602Impact assessment of global megatrends
38
2.3.1 gmTs possibly increase resource scarcityThe GMT with the highest potential to increase resource scarcity is, with-out a doubt, GMT 5 (continued global economic growth). This comes as no surprise as long as economy (and welfare) is still mainly based on the use of resources. Especially from a global view, countries with emerging economies will in the medium to long term influence the system. As described earlier, resource scarcity can be physically, economically and politically motivated. Nevertheless, the price of resources on the world market is a key factor here. When prices of resources are high, it is economically more reasonable to export the resources – especially when production costs are high. When external demand drops, inland consumption cannot compensate for this and an export-based regional economy will get caught in a vicious circle downwards (see also Figure 10). GMT 6 (from a unipolar to a multipolar world) is also likely to increase resource scarcity. This GMT is very closely related to the global devel-opment of the economy. This GMT mainly describes the shifts in trade flows and exports. This is explained on account of the growing markets in different regions. From a global perspective, the turnover of resources will increase. For Europe, this might imply higher prices for raw materials and other resources and also more imports of products (and therefore possibly less production, also due to higher production cost). The analysis in the model shows that both GMT 5 and GMT 6 have an ambivalent connection to resource scarcity. On the one hand, the economic activity increases the usage of resources and there-fore also the potential scarcity. On the other hand, the economic system is regulated via the prices. A third aspect that can explain the ambivalence is that technological innovation is either influenced by economic activity or the neces-sity to innovate, i.e. when resources are scarce. In the SOER, GMT 2 (living in an urban world) is mainly based on the trend that by 2050 more than 70% of the world population is expected to be city dwellers. Such a development will likely mean an escalation in consumption and greater affluence for many, but also greater poverty for the underprivileged. Nevertheless, GMT 2 mainly leads to human needs and domestic consumption and therefore to resource use. There are some particularities about urban living:
• Life is less self-sufficient, but gaining access to many resources is easier. This implies (although, e.g. heat production and local transport can be more efficient) that resources will definitely be used more.
• There is greater access to education and in the long run more potential for technological innovations.
• Density of population is higher. Also discrepancies in wealth are likely. Therefore, the potential for conflict is higher.
• Cities depend on their surroundings for resources (food, water, energy, etc.).• Automatically, more of the human workforce is concentrated together
and therefore cheap; this means higher productivity (mainly in emerging economies) and generally more economic activity (also due to the depend-ence on the surroundings and the transport that results from it).
SWEDISH ENVIRONMENTAL PROTECTION AGENCY REPORT 6602Impact assessment of global megatrends
39
GMT 8 (decreased stocks of natural resources) is mainly related to agricultural land, resources such as fish, soil, and, more generally, to biodiversity. It is quite obvious that decreasing stocks of natural resources will directly lead to greater scarcity of these resources. There is, understandably, no direct connection to abiotic resourcesix. However, it is important to mention that global population growth will be limited by these resources and it might therefore balance itself out in the long run (despite the fact that youth bulges can be found in regions with strong constraints in terms of resources and that growth rates are lower in wealthy urban settings). It may, however, also take the form of a catastrophic “collapse” rather than a gradual decline, so it is not necessarily a desirable outcome (see also the archetype in Figure 12). The increasingly severe conse-quences of climate change (GMT 9) have a causal structure that is rather simi-lar to that of GMT 8. The impacts of climate change have a direct influence on natural resources, the quality of ecosystems and the availability of differ-ent soils and arable land. One major difference between GMT 8 and GMT 9, however, becomes apparent in the time scales: while GMT 8 is likely to have an impact in the short term, GMT 9 has several long-term impacts. On the whole, climate change will amplify the impact of GMT 8.
GMT 11 (environmental regulation) describes a development, where more multilateral and public-private-partnership agreements will be made. This means that re-regionalisation and multilateral and global agreements will both increase. There will also be a close link to the economic system. Hence, it comes as no surprise that this GMT is serving to potentially increase resource scarcity, despite the fact that its potential is decreasing over time. This decrease can be explained by two ambivalent effects: in the model we described two major pathways (entry points) between GMT 11 and resource scarcity. In the first case, global economic growth is stimulated, which increases the use of resources on a global scale. The second contrary entry point is trade barriers, which might increase scarcity regionally in Europe (i.e. political scarcity).
2.3.2 gmTs may possibly decrease resource scarcityTechnological innovation (a component of GMT 4) is the key element to increasing resource efficiency, which is also one of the main approaches that can be taken to minimise resource scarcity (i.e. reducing the use of resources). Then again, technological innovation is a key driver of economic growth and has a high potential of increasing environmental pollution. Taking all of these ambivalent potential impacts into account, GMT 4 still helps to decrease resource scarcity in the model. However, there will be a natural limit: when resources are simply not available, there will be no technological innova-tion because of the lack of the needed resources. Some initial observations have been made regarding rare earth metals, which are essential for renew-able energy technology. As long as innovations depend on “limited resources” these solutions will not be applicable on a big scale and in the long run. But in
ix See definition of a “generic model”
SWEDISH ENVIRONMENTAL PROTECTION AGENCY REPORT 6602Impact assessment of global megatrends
40
the same context, research and innovation will continue. Hence, resource scarcity can have a great effect on research and innovation. The model results show this: GMT 4 “jumps to the upper left square”, which means that its pos-sibly decreasing impact on resource scarcity will be decreasing in the future, i.e. is limited.
GMT 3 (disease burdens and risk of new pandemics) has a huge potential to cause a decrease in resource scarcity. This would be achieved by having a direct impact on population growth and on regional economic activities. Depending on the severity and incidence of the diseases, the effect may not be reversible. The direct impact on regional activities is a rather direct and quick impact, while the impact on the changes to the demographic structure is more midterm oriented.
2.3.3 gmTs with apparently no impactIn comparison to other GMTs, GMT 1 (divergence of population trends) has a very small effect on resource scarcity in Europe. The analysis of the models shows that there are approx. 400 different connections between GMT 1 and the main factor resource scarcity in Europe, which gives a first hint of the manifold impacts at hand. The apparently small potential impact that the GMT might have should not be misinterpreted to mean that demographic development might not be important to resource scarcity in Europe. When we look closer at the causal chains and feedbacks, we can make the following observations:
• Global population growth has a greater increasing effect than the ageing and decreasing population in Europe do.
• Regional consumption is mainly influenced by national demographic developments.
• Regional economy is mainly influenced by exports and these are driven by increases in global population.
The possible impacts of GMT 10 (increasing environmental pollution load) are ambivalent. On the one hand, ecosystems (and therefore also renewable resources) are directly affected by increasing pollutions. On the other hand, environmental pollution load will affect the demographic structure, i.e. the average life expectancy will be shortened. The two effects balance out, how-ever, so that, effectively, no possible relative impact can be determined.
2.3.4 gmTs change their impact over timeGMT 7 (intensified global competition for resources) exhibits a rather specific behaviour over time in the Insight Matrix. In the short term, this GMT causes scarcity to increase significantly. Already in the midterm, the factor will change its behaviour and cause scarcity to decrease. This decreasing effect decreases in the long term. The development is quite logical: strong demand (and com-petition) increases the scarcity. A limited availability of resources leads to less economic activity and to increased innovation to search for alternatives (substitu-tions), which in turn make the initial competition for the resource less important.

SWEDISH ENVIRONMENTAL PROTECTION AGENCY REPORT 6602Impact assessment of global megatrends
41
Figure 12. CLD of an extended archetype limit to growth with some analogy to shifting the burden.
It is important to note that using an alternative resource does not resolve the general problem of resource scarcity. It only delays the collapse as shown in Figure 12, which represents the well-knows systems behaviour archetype “shifting the burden”27.
2.4 Assessment of the impacts of measures that prevent resource scarcity
2.4.1 general measures and strategies to deal with resource scarcity – a look at Eu strategies
The EU Commission has been addressing the unsustainable use of natural resources and the different types of resource scarcity in several high-level doc-uments since 2001 (see section 2.1).
Resource scarcity is spoken about directly in the so-called Raw material initiative28, with the strategy “Tackling the challenges in commodity markets and on raw materials”29 and through the European Innovation Partnership (EIP) on Raw Materials30, which proposes instruments and policy measures to secure the EU raw material supply based on three pillars. The first pillar can be summarised under the term “raw material diplomacy” and includes meas-ures to incorporate issues regarding raw material supply into development policy (e.g. increasing transparency of supply chains, using the best available techniques offered by EU companies abroad, investing into infrastructure and fostering good governance) and to reinforce the raw materials trade strategy (e.g. creating bilateral raw material partnerships, tackling trade barriers such as export restrictions). The second pillar addresses the sustainable supply of raw materials within the EU. It focuses on raw material extraction inside the EU with measures such as national mineral strategies and setting up a land use planning policy for raw materials. With the EIP on raw materials, the EU is promoting innovations along the entire value chain of raw materials. The third pillar deals with the use of raw materials in the production chain and addresses resource efficiency and recycling with a special focus on policy measures to increase the waste collection rate and to tackle the illegal shipment
B R
-
-
+ +
+
-
+-
- +
Economic growthUse of resources
Search for alternative resources
Available alternative resources
Use of alternative resources
Available resources

SWEDISH ENVIRONMENTAL PROTECTION AGENCY REPORT 6602Impact assessment of global megatrends
42
of waste to third countries. Here, also a direct link to the second main strategy, the EU Roadmap to a Resource-Efficient Europe31 is set.
The EU roadmap describes resource efficiency as one of the main instru-ments to secure raw material supply. In the context of this paper, the main section “Transforming the economy” (Section 3 of the EU roadmap) is of special interest. In this section, the EU Commission describes four clusters of measures, which will serve to make the European economy the most resource-efficient worldwide.
The first cluster summarises policy measures for sustainable production and consumption. The main measures are:
• Provide appropriate price signals and environmental information as the right incentives for citizens and public authorities to choose the most resource-efficient products.
• Set minimum environmental standards to remove the least resource-effi-cient products from the market.
• Extend producer responsibility to the full life cycle of products that are produced.
• Create incentives to stimulate a large majority of companies to systemati-cally measure, benchmark and improve their resource efficiency.
The second cluster focuses on the broad topic of recycling and turning waste into a resource. The main measures are:
• Create economic incentives to stimulate the secondary materials market and the demand for recycled materials.
• Calculate the introduction of minimum recycled material rates, durability and reusability criteria and the extension of producer responsibility for key products.
• Develop national waste prevention and waste management strategies.
In the third cluster, the EU Commission proposes policy measures to support research and innovation in the field of resource-efficiency such as innovation partnerships and joint technology initiatives of public-private partnerships. Furthermore, public research funding should focus on key resource-efficient objectives.
Environmentally harmful subsidies and correct pricing are the main focus points of the fourth cluster. The main policy measures address the continuous identification and phase out of environmentally harmful subsidies, the regular exchange of best practices in relation to this between the member countries and shifting taxation from labour to environmental impacts.
All of the measures clustered in Section 3 of the EU roadmap “Transforming the economy” will have an impact on the use of resources, either through increasing resource efficiency or a higher recycling rate and the use of secondary materials. And through this, when looking at primary raw materials, it will influence resource scarcity.
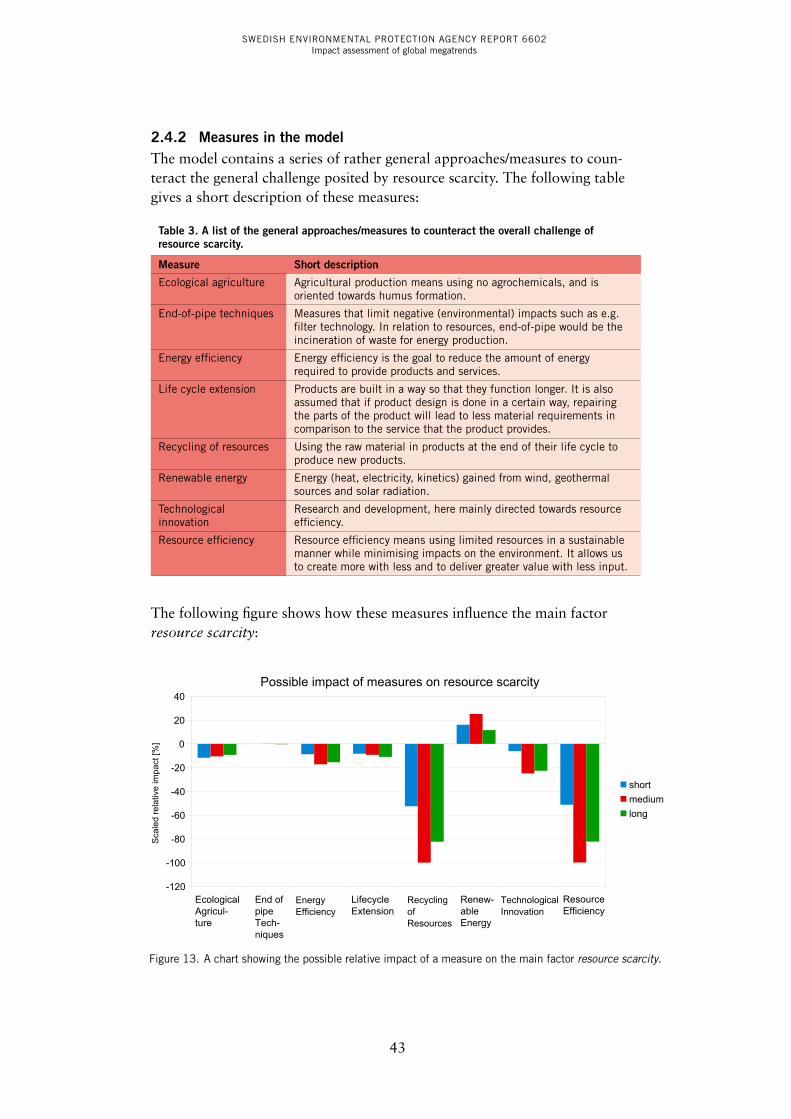
SWEDISH ENVIRONMENTAL PROTECTION AGENCY REPORT 6602Impact assessment of global megatrends
43
2.4.2 measures in the modelThe model contains a series of rather general approaches/measures to coun-teract the general challenge posited by resource scarcity. The following table gives a short description of these measures:
Table 3. A list of the general approaches/measures to counteract the overall challenge of resource scarcity.
measure Short description
Ecological agriculture Agricultural production means using no agrochemicals, and is oriented towards humus formation.
End-of-pipe techniques Measures that limit negative (environmental) impacts such as e.g. filter technology. In relation to resources, end-of-pipe would be the incineration of waste for energy production.
Energy efficiency Energy efficiency is the goal to reduce the amount of energy required to provide products and services.
Life cycle extension Products are built in a way so that they function longer. It is also assumed that if product design is done in a certain way, repairing the parts of the product will lead to less material requirements in comparison to the service that the product provides.
Recycling of resources Using the raw material in products at the end of their life cycle to produce new products.
Renewable energy Energy (heat, electricity, kinetics) gained from wind, geothermal sources and solar radiation.
Technological innovation
Research and development, here mainly directed towards resource efficiency.
Resource efficiency Resource efficiency means using limited resources in a sustainable manner while minimising impacts on the environment. It allows us to create more with less and to deliver greater value with less input.
The following figure shows how these measures influence the main factor resource scarcity:
Figure 13. A chart showing the possible relative impact of a measure on the main factor resource scarcity.
EcologicalAgricul-ture
End ofpipeTech-niques
LifecycleExtension
Renew-ableEnergy
ResourceEfficiency
-120
-100
-80
-60
-40
-20
0
20
40Possible impact of measures on resource scarcity
shortmediumlong
Sca
led
rela
tive
impa
ct [%
]
EnergyEfficiency
Recycling ofResources
TechnologicalInnovation
SWEDISH ENVIRONMENTAL PROTECTION AGENCY REPORT 6602Impact assessment of global megatrends
44
2.4.3 understanding the special role of recycling and resource efficiencyThe two measures recycling and resource efficiency appear to have a strong impact in the model. Recycling and resource efficiency are directly connected to the use of resources.
In the case of recycling, it means that the more resources are recycled the less need to be extracted, although energy demand is likely to increase. In this context, it is important to mention one assumption that is made in the model: the factor use of resources is a composite factor, meaning that it also the extraction of materials. It would have been more precise to have included factors such as exploitation and exploration and e.g. national reserves, but the general message remains the same: recycling directly decreases the need for new resources and the resources remain in a material cycle. Here “resources” refers only to raw materials, because complete recycling (closed material cycles) requires the use of other resources – primarily energy. The raw material remains in the material cycle, while keeping up the cycle requires other natu-ral resources.x There are many balancing feedback connections that limit (and ultimately decrease) the positive (i.e. reducing) impact on resource scarcity.
In the case of resource efficiency the direct use of resources would be decreased as well. A rebound effect limits the success of this measure. Nevertheless, the factor is one of the key measures.
More detailed modelling would be necessary depending on the details of each single activity related to the applicable general measure.
2.4.4 understanding decreasing impactsThere are some measures such as ecological agriculture, energy efficiency and life cycle extension that definitely reduce the problem of resource scarcity:
• The practice of ecological agriculture relieves the natural ecosystems. One must acknowledge that the efficiency in terms of “tons yield per hectare” is higher in industrial manufacturing. But the demand for energy, chemicals, water and the health risk involved in relation to eco-systems (and humans) is lower.
• Increasing energy efficiency mainly limits the absolute heat and energy demand. The related rebound effect is already described in Section 2.3 and is also true for energy and resource efficiency. A clear hint that these are balancing effects (i.e. rebound) is the long-term decrease of the possi-ble impact (after the mid-term increase).
• Technological innovation (TI) also points in the right direction. Additionally, it is a sort of key variable because nearly all other measures are driven by this factor. Apparently, without technological innovations many measures (Table 3) would be impossible.
x Of course dissipative losses, e.g. very small fractions of rare metals in ICT also play an important role.
SWEDISH ENVIRONMENTAL PROTECTION AGENCY REPORT 6602Impact assessment of global megatrends
45
2.4.5 understanding the counterintuitive impact of renewable energySurprisingly enough, the factor renewable energy exhibits a counterintuitive and counterproductive behaviour: it increases resource scarcity. Also, in this case a more disaggregated factor shows a more differentiated picture depend-ing on the source of the renewable energy: wind and solar energy increase the demand for resources32, and also the renewable energy gained from biotic sources significantly increases the demand for resources. Compared to fossil fuels, the mass flows would be less, but, nevertheless, the use and transforma-tion of energy is always related to mass flow. There is no power unit instal-lation (be it solar panels, wind power, heat pumps or batteries, etc.) involved in energy transformation that does not need resources or would “free up” resources. Hence, resource use always increases based on renewable energy and hence scarcity is likely to also increase based on the use of renewable energyxi. If fossil fuels had been included in the model, the comparison would be in favour of renewable energy (in terms of relieving resource scarcity).
2.5 First conclusions and reflectionsGMTs are meant to be those trends visible today that are expected to extend over decades, changing slowly and exerting considerable force (...)4. This is something that needs to be taken seriously. We would like to emphasise here that we will have a serious problem in the future. However, despite the fact that some GMTs might relieve resource scarcity, this does not necessarily mean that it will be positive for humans. Even the “best” solution in a fairly technocratic and economically-oriented world, the “technological innovation” will not resolve the problem of resource scarcities. As long as the economic system is built around economic growth, the generation of GDP will be cou-pled to resource use. In a future project, it might be interesting to analyse the potential role of services in more detail.
In the long run, it is more sustainable to consider not using GDP as the main source of orientation and to instead reconsider the role that economy has in the social system – and that it is embedded in a limited ecological system.
xi See Georgescu-Roegen: Any economic activity transforming material will always cause material losses by dissipation.

SWEDISH ENVIRONMENTAL PROTECTION AGENCY REPORT 6602Impact assessment of global megatrends
46
Box 3. Rethinking the economy to overcome the risks of resource scarcity?
Could an alternative model for our national and global economies change the problem of scarcity?
Our economy is designed for growth. At the individual level, the accu-mulation of new and better goods and experiences is fundamental to being an active citizen of the world. However, social norms and a vast market-ing industry have created significant psychological pressure: consuming more has turned into a path to happiness and a measure of success. At the national level, government policies and spending plans, funded through public-sector borrowing, are justified and made possible through long-term expectations of growth. GDP will rise, tax revenues will increase and returns on investments will be higher in the future: thus we can spend now because future economic growth will resolve the debts. At least this is the theory. And continued economic growth throughout the latter part of the 20th century has provided sufficient confidence in the idea that this will remain the case – which is also the reason that this is now globally the dominant model of economic thought.
However, the financial crisis has challenged this model, and there is increasing evidence that the global environment is suffering extreme and irreversible damage (e.g. climate change, water scarcity and ecosystem damage). In addition to this, the negative impact that environmental damage (and the economic inequality resulting from rapid growth) has on human health and wellbeing is significant, and there is enough data available that suggests that an alternative way thinking may be needed.
The analysis and model developed in this case study support this view. We live in a finite system – the supply of resources is by definition finite – so scarcity is inevitable. Various strategic initiatives (particu-larly at the EU level) promote resource efficiency. But resource efficiency simply slows the rate of resource use, and thus scarcity. In a model of continued economic growth, driven by the consumption of resources, increased resource use is inevitable. Decoupling resource use from eco-nomic activity is seen as a Holy Grail of an environmentally sustainable economy, but relative decoupling simply reduces the rate of resource use, and absolute decoupling where resource use falls as productivity increases is not currently being achieved in more than a few isolated cases. It is only foreseen in ambitious scenarios where significant changes are seen in economic and consumption policy and practice.
SWEDISH ENVIRONMENTAL PROTECTION AGENCY REPORT 6602Impact assessment of global megatrends
47
What might the alternative be?It is crucial to fully take into account the natural environment and
resource loss/damage within manufacturing and consumption decisions. The idea that natural capital should be accounted for is one that has been around for more than 20 years, and it has recently become popular again with many initiatives promoting an ecosystem services approach. However, there is as of yet little evidence that we have the ability to include these factors successfully in decision making: values are contested, evidence is partial and there is no regulatory framework to support this.
Large scale absolute decoupling, whereby economic activity no longer inevitably increases resource use would require a fundamental change in the way we produce goods and services, backed up by strong policy and global standards.
A change of focus in our local, national and global economies would lead to personal aims being for sufficiency not “more” and the creation of largely self-supportive local economies with skill-sharing and local trade in goods and services. In this model, national economies would be mandated to target improved quality of life rather than GDP growth and stepwise overcome their dependency on economic growth. Manu-facturing would maximise the closing of material loops, and industrial areas would be required to develop an industrial ecology model where the flow of materials is managed within a coordinated system. The fiscal system would reflect environmental constraints and ecological bounda-ries. Emerging economies around the globe would be helped to manage development that seeks social and economic equality and rapid adoption of technologies, with the developmental goal that reflects the changed global economic focus.
Such visions of a different way of thinking may appear far-fetched, or a distant dream. However, the building blocks for such approaches already exist, and as the analysis in this report indicates: scarcity is a problem that is not going to go away. And resource efficiency is, in the end, not enough.
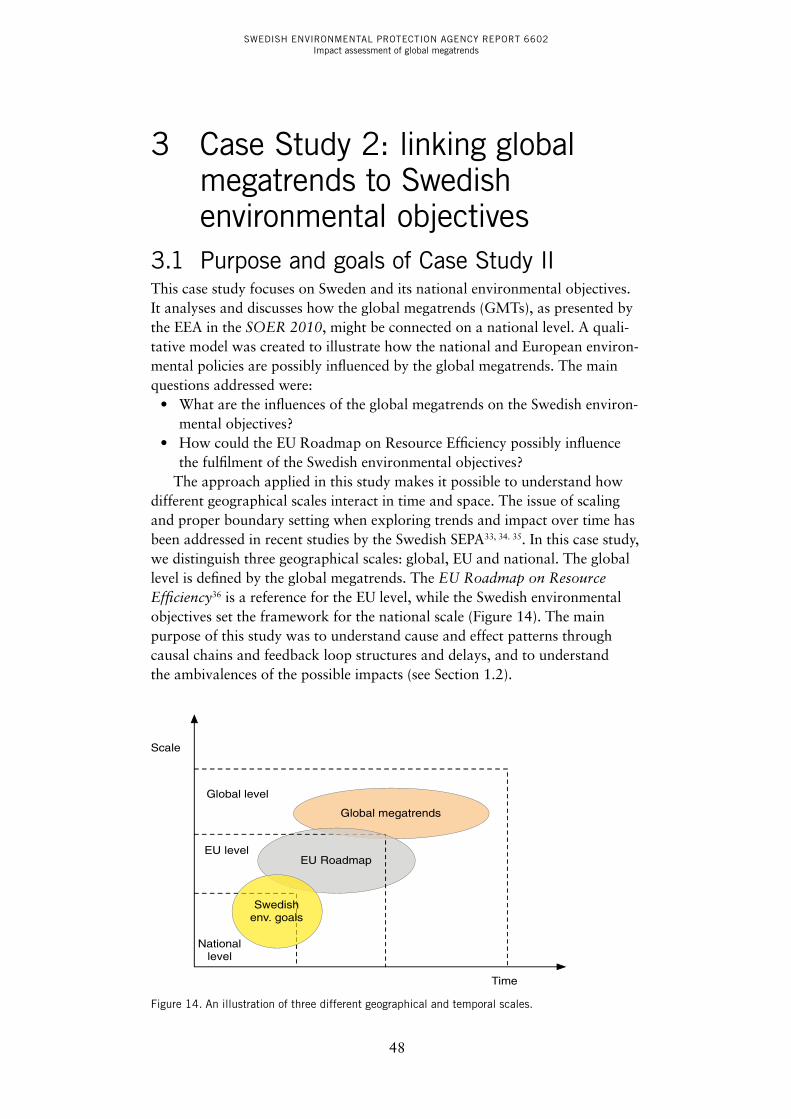
SWEDISH ENVIRONMENTAL PROTECTION AGENCY REPORT 6602Impact assessment of global megatrends
48
3 Case Study 2: linking global megatrends to Swedish environmental objectives
3.1 Purpose and goals of Case Study IIThis case study focuses on Sweden and its national environmental objectives. It analyses and discusses how the global megatrends (GMTs), as presented by the EEA in the SOER 2010, might be connected on a national level. A quali-tative model was created to illustrate how the national and European environ-mental policies are possibly influenced by the global megatrends. The main questions addressed were:
• What are the influences of the global megatrends on the Swedish environ-mental objectives?
• How could the EU Roadmap on Resource Efficiency possibly influence the fulfilment of the Swedish environmental objectives?
The approach applied in this study makes it possible to understand how different geographical scales interact in time and space. The issue of scaling and proper boundary setting when exploring trends and impact over time has been addressed in recent studies by the Swedish SEPA33, 34. 35. In this case study, we distinguish three geographical scales: global, EU and national. The global level is defined by the global megatrends. The EU Roadmap on Resource Efficiency36 is a reference for the EU level, while the Swedish environmental objectives set the framework for the national scale (Figure 14). The main purpose of this study was to understand cause and effect patterns through causal chains and feedback loop structures and delays, and to understand the ambivalences of the possible impacts (see Section 1.2).
National level
EU level
Global level
Global megatrends
Time
Scale
EU Roadmap
Swedish env. goals
Figure 14. An illustration of three different geographical and temporal scales.
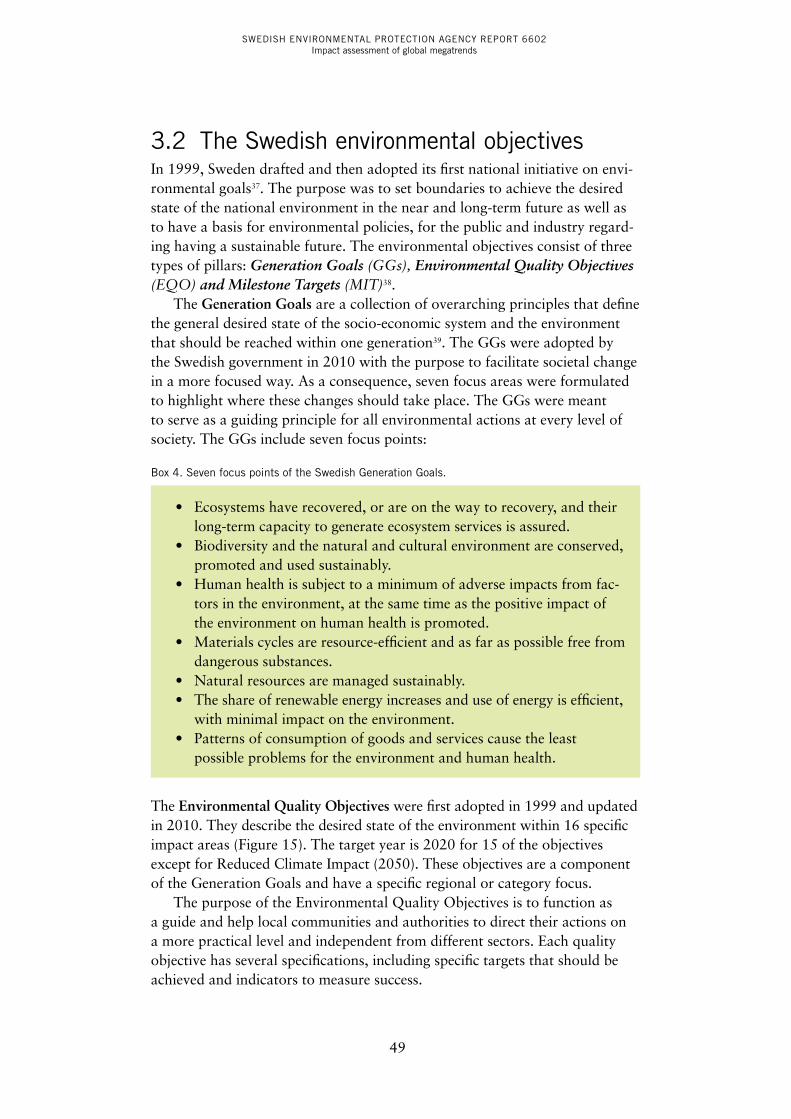
SWEDISH ENVIRONMENTAL PROTECTION AGENCY REPORT 6602Impact assessment of global megatrends
49
3.2 The Swedish environmental objectivesIn 1999, Sweden drafted and then adopted its first national initiative on envi-ronmental goals37. The purpose was to set boundaries to achieve the desired state of the national environment in the near and long-term future as well as to have a basis for environmental policies, for the public and industry regard-ing having a sustainable future. The environmental objectives consist of three types of pillars: Generation Goals (GGs), Environmental Quality Objectives (EQO) and Milestone Targets (MIT)38.
The Generation Goals are a collection of overarching principles that define the general desired state of the socio-economic system and the environment that should be reached within one generation39. The GGs were adopted by the Swedish government in 2010 with the purpose to facilitate societal change in a more focused way. As a consequence, seven focus areas were formulated to highlight where these changes should take place. The GGs were meant to serve as a guiding principle for all environmental actions at every level of society. The GGs include seven focus points:
Box 4. Seven focus points of the Swedish Generation Goals.
• Ecosystems have recovered, or are on the way to recovery, and their long-term capacity to generate ecosystem services is assured.
• Biodiversity and the natural and cultural environment are conserved, promoted and used sustainably.
• Human health is subject to a minimum of adverse impacts from fac-tors in the environment, at the same time as the positive impact of the environment on human health is promoted.
• Materials cycles are resource-efficient and as far as possible free from dangerous substances.
• Natural resources are managed sustainably.• The share of renewable energy increases and use of energy is efficient,
with minimal impact on the environment.• Patterns of consumption of goods and services cause the least
possible problems for the environment and human health.
The Environmental Quality Objectives were first adopted in 1999 and updated in 2010. They describe the desired state of the environment within 16 specific impact areas (Figure 15). The target year is 2020 for 15 of the objectives except for Reduced Climate Impact (2050). These objectives are a component of the Generation Goals and have a specific regional or category focus.
The purpose of the Environmental Quality Objectives is to function as a guide and help local communities and authorities to direct their actions on a more practical level and independent from different sectors. Each quality objective has several specifications, including specific targets that should be achieved and indicators to measure success.

SWEDISH ENVIRONMENTAL PROTECTION AGENCY REPORT 6602Impact assessment of global megatrends
50
The third element of the Swedish Environmental Goal System is the Milestone Targets. These are the priority cross-cutting areas for the government to facilitate progress towards the fulfilment of the Generation Goals and the Environmental Quality Objectives.
3.3 Scope of the study and structure of the model
This study focuses on the seven Generation Goals’ focus points. Although the GGs describe rather broad concepts, it is possible to show how the different GGs are related and how they are connected to external influences such as megatrends and even political measures.
In order to understand resource efficiency policy 6 main subsystems like infrastructure, energy, food, mobility, minerals and forests have been described with the help of causal impact analysis using the Consideo Modeler tool (see also Section 0.2). Since a model is always a simplification of reality, these items are more or less generic and represent a northern European situa-tion, i.e. Sweden. Four of these six subsystems have been taken from the EU roadmap (buildings, energy, food, mobility). In order to portray the specific situation for Sweden more accurately, two subsystems (minerals, forests) were added. In total, the model contains 211 factors.
The global megatrends describe global developments. Hence, they pre-dominantly act as external drivers. However, it must be recognised that the demographic development in Sweden, for example, is a component of the global megatrends and hence there is mutual influence in terms of both scales. Another example is climate change, which leads to national mitigation policy. National efforts in mitigation, however, play only a smaller role on a global scale. This particularity regarding how to treat the complex structure of a megatrend will be discussed later on.
Figure 15. An overview of the 16 Environmental Quality Objectives – ill. by Tobias Flygar.
Reduced Climate Impact
Clean Air
Natural Acidification Only
A Non-Toxic Environment
A Protective Ozone Layer
A Safe Radiation Environment
Zero Eutrophication
Flourishing Lakes and Streams
Good-Quality Groundwater
A Balanced Marine Environment, Flourishing Coastal Areas and Archipelagos
Thriving Wetlands
Sustainable Forests
A Varied Agricultural Landscape
A Magnificent Mountain Landscape
A Good Built Environment
A Rich Diversity of Plant and Animal Life

SWEDISH ENVIRONMENTAL PROTECTION AGENCY REPORT 6602Impact assessment of global megatrends
51
The Generation Goals are “end points” in the model. They are influenced by the GMTs and drivers of the six submodels (see Figure 16) without influenc-ing any other factor. This same logic was applied when introducing the factor resource scarcity.
B uild ings E nergy Food Mobility Minerals Forests
G lobal megatrends
Swedish environmental
goals
Figure 16. The subsystems of the model for Case Study II.
The model is based on several subsystems that are interconnected and generate driving forces for the Swedish environmental goals.
Each submodel describes the characteristics of that particular system within the EU. The general cause and effect patterns in the different submod-els are more or less transferable to other regions. It is important to note that the differentiation in several submodels is an artificial construction to make the model more comprehensible. There are, of course, strong interconnections between the different submodels.
A more detailed description of the different submodels can be found in the Annex.
3.4 Drivers and feedback regarding resource scarcity and the focus points of the Generation Goals (GGs)
As mentioned in the previous section, resource scarcity (RS) and the Generation Goals (GGs) are “only” a kind of collector of drivers. This means that each of the GGs and the factor resource scarcity (RS) receive drivers from the submodels in the sense of direct causal relation to the respective goal or RS. Following the methodological explanations in Section 1.2, one can
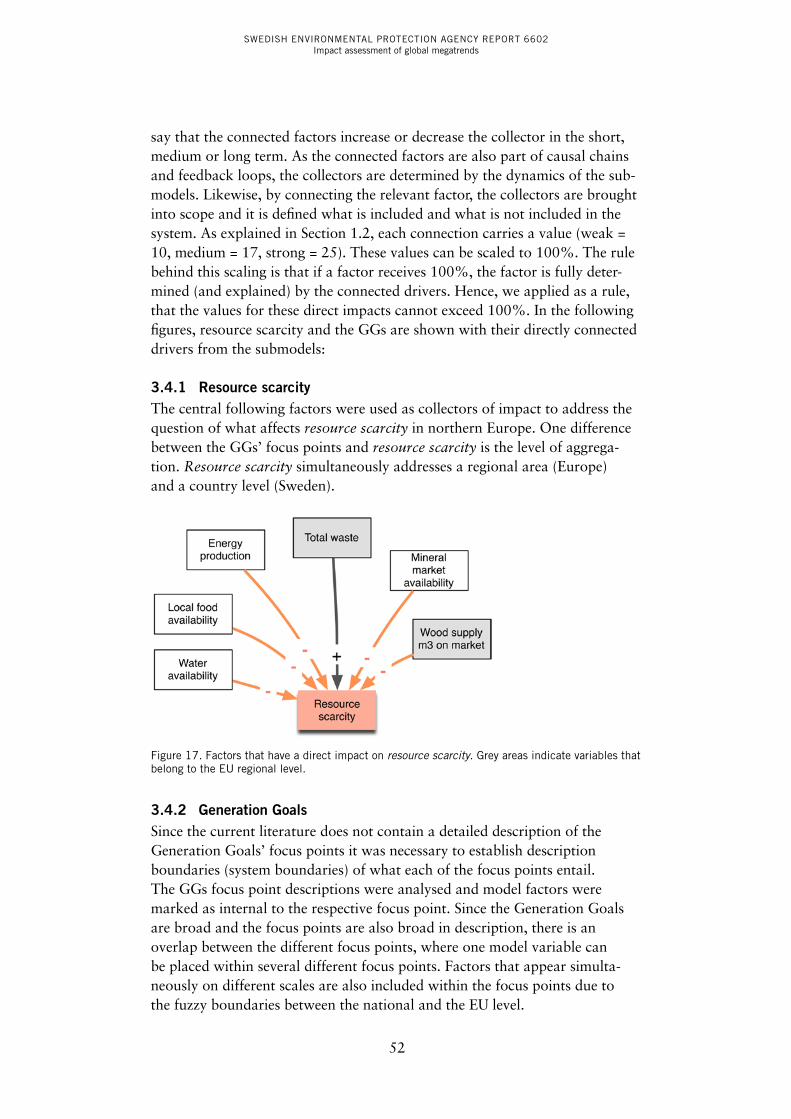
SWEDISH ENVIRONMENTAL PROTECTION AGENCY REPORT 6602Impact assessment of global megatrends
52
say that the connected factors increase or decrease the collector in the short, medium or long term. As the connected factors are also part of causal chains and feedback loops, the collectors are determined by the dynamics of the sub-models. Likewise, by connecting the relevant factor, the collectors are brought into scope and it is defined what is included and what is not included in the system. As explained in Section 1.2, each connection carries a value (weak = 10, medium = 17, strong = 25). These values can be scaled to 100%. The rule behind this scaling is that if a factor receives 100%, the factor is fully deter-mined (and explained) by the connected drivers. Hence, we applied as a rule, that the values for these direct impacts cannot exceed 100%. In the following figures, resource scarcity and the GGs are shown with their directly connected drivers from the submodels:
3.4.1 resource scarcityThe central following factors were used as collectors of impact to address the question of what affects resource scarcity in northern Europe. One difference between the GGs’ focus points and resource scarcity is the level of aggrega-tion. Resource scarcity simultaneously addresses a regional area (Europe) and a country level (Sweden).
Figure 17. Factors that have a direct impact on resource scarcity. Grey areas indicate variables that belong to the EU regional level.
3.4.2 generation goalsSince the current literature does not contain a detailed description of the Generation Goals’ focus points it was necessary to establish description boundaries (system boundaries) of what each of the focus points entail. The GGs focus point descriptions were analysed and model factors were marked as internal to the respective focus point. Since the Generation Goals are broad and the focus points are also broad in description, there is an overlap between the different focus points, where one model variable can be placed within several different focus points. Factors that appear simulta-neously on different scales are also included within the focus points due to the fuzzy boundaries between the national and the EU level.
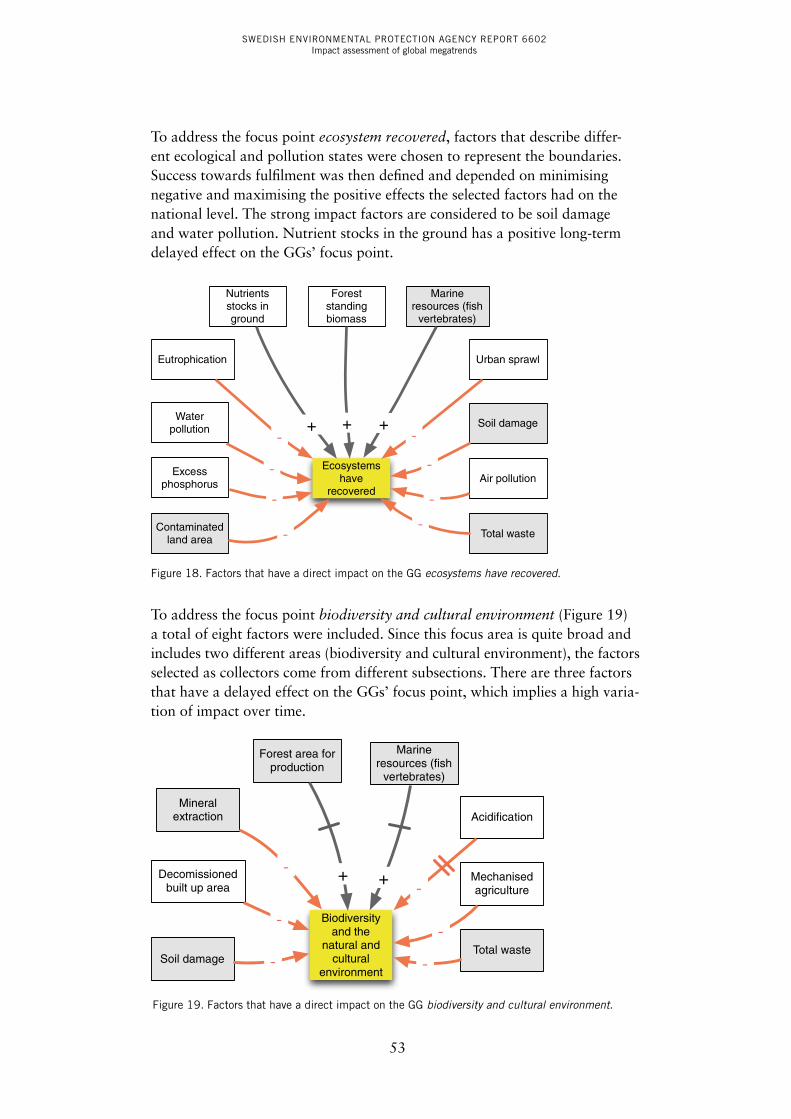
SWEDISH ENVIRONMENTAL PROTECTION AGENCY REPORT 6602Impact assessment of global megatrends
53
To address the focus point ecosystem recovered, factors that describe differ-ent ecological and pollution states were chosen to represent the boundaries. Success towards fulfilment was then defined and depended on minimising negative and maximising the positive effects the selected factors had on the national level. The strong impact factors are considered to be soil damage and water pollution. Nutrient stocks in the ground has a positive long-term delayed effect on the GGs’ focus point.
Forest standing biomass
Marine resources (fish
vertebrates)
Urban sprawlEutrophication
Water pollution Soil damage
Ecosystems have
recovered
-
+--
-Air pollution
-
Total waste-
Excess phosphorus
-
Contaminated land area -
Nutrients stocks in ground
+ +
Figure 18. Factors that have a direct impact on the GG ecosystems have recovered.
To address the focus point biodiversity and cultural environment (Figure 19) a total of eight factors were included. Since this focus area is quite broad and includes two different areas (biodiversity and cultural environment), the factors selected as collectors come from different subsections. There are three factors that have a delayed effect on the GGs’ focus point, which implies a high varia-tion of impact over time.
Marine resources (fish
vertebrates)
Acidification
Soil damage
Biodiversity and the
natural and cultural
environment-
+ -Mechanised agriculture
-Total waste
-
Decomissioned built up area
-
Mineral extraction
-
Forest area for production
+
Figure 19. Factors that have a direct impact on the GG biodiversity and cultural environment.

SWEDISH ENVIRONMENTAL PROTECTION AGENCY REPORT 6602Impact assessment of global megatrends
54
To address the focus point human health (Figure 20), a total of nine factors were selected as collectors. The positive impact factors promote human health whereas the negative factors have a direct/indirect negative impact on human health.
Ecosystem services
Contaminated land area
Human health
- Soil pollution
-
Total waste
-National parks and protected
areas
Forest area for production
+ +
Air pollution
-
Human health
+
+Water
pollution
-Figure 20. Factors that have a direct impact on the GG human health.
To address the focus point material cycles (Figure 21), there was a need to include factors that related to resources such as materials, energy and water as well as those related to health such as pesticide use. Therefore a total of 15 factors were selected as collectors.
Cost of fossil to industry Mineral
consumption
Material cycles
- Mineral extraction
rate
-
Total waste
-
Water savings technologies
++
Solid waste treatment
+
Energy efficiency in the domestic
+
Energy efficiency in
industry +
Recycling and reusing of packages
+
Energy recovery on
non-recyclables
+
Improved water infrastructure
+
Improved food packaging
+
Energy efficiency in
fossil fuel use
+
Optimise energy
infrastructure
+
Pesticides use
-
Figure 21. Factors that have a direct impact on the GG material cycles.
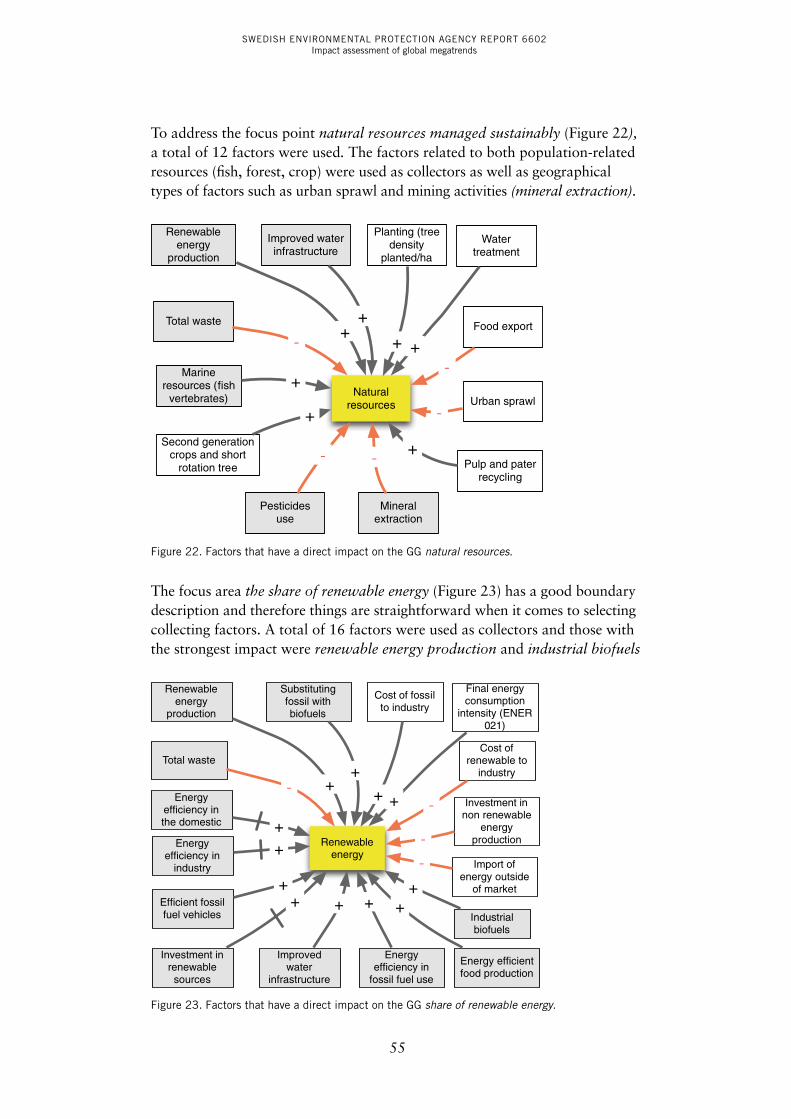
SWEDISH ENVIRONMENTAL PROTECTION AGENCY REPORT 6602Impact assessment of global megatrends
55
To address the focus point natural resources managed sustainably (Figure 22), a total of 12 factors were used. The factors related to both population-related resources (fish, forest, crop) were used as collectors as well as geographical types of factors such as urban sprawl and mining activities (mineral extraction).
Planting (tree density
planted/ha
Mineral extraction
Natural resources
-
Food export
-
Total waste
-
Renewable energy
production
++
Water treatment
+Marine
resources (fish vertebrates)
+
Improved water infrastructure
+
Pesticides use
-
Urban sprawl-
Second generation crops and short
rotation tree
+
Pulp and pater recycling
+
Figure 22. Factors that have a direct impact on the GG natural resources.
The focus area the share of renewable energy (Figure 23) has a good boundary description and therefore things are straightforward when it comes to selecting collecting factors. A total of 16 factors were used as collectors and those with the strongest impact were renewable energy production and industrial biofuels
Cost of fossil to industry
Industrial biofuels
Renewable energy
Cost of renewable to
industry
-
Total waste
-
Renewable energy
production
++
Final energy consumption
intensity (ENER 021)
+Energy efficiency in the domestic +
Substituting fossil with biofuels
+
Investment in non renewable
energy production-
Import of energy outside
of market
-
Investment in renewable sources
+
Improved water
infrastructure
+
Energy efficiency in
industry
+
Energy efficiency in
fossil fuel use
++Efficient fossil
fuel vehicles
+
Energy efficient food production
+
Figure 23. Factors that have a direct impact on the GG share of renewable energy.
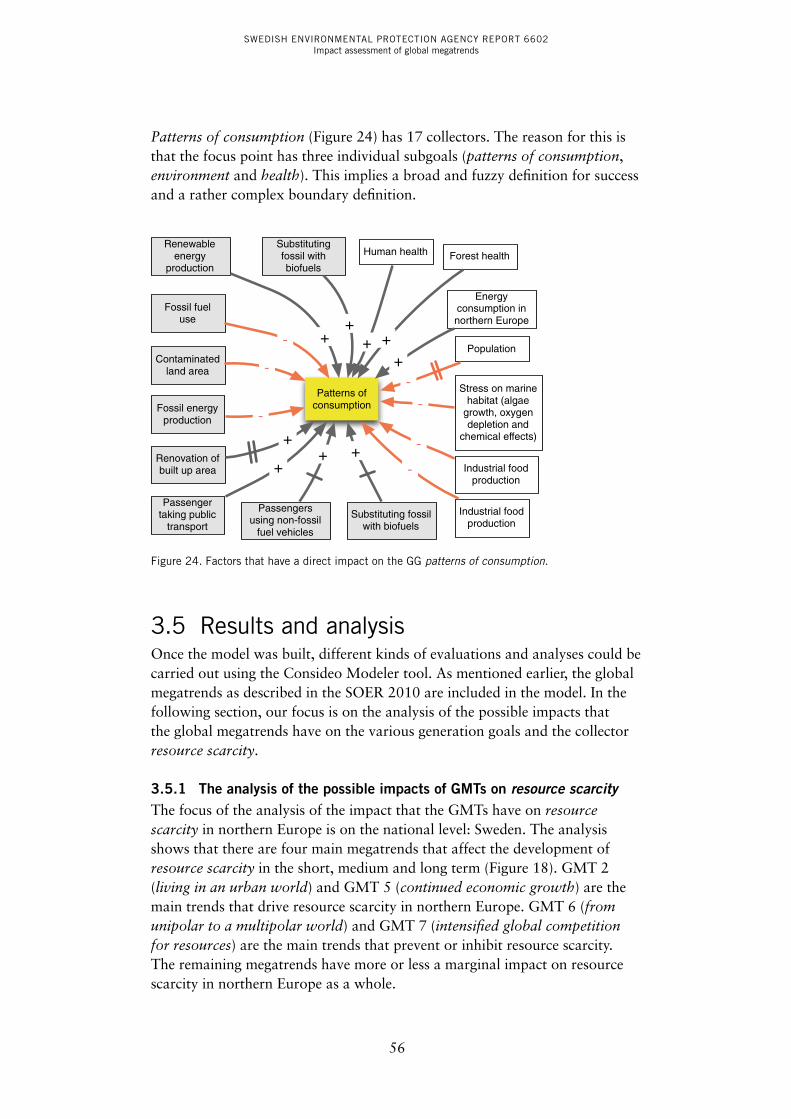
SWEDISH ENVIRONMENTAL PROTECTION AGENCY REPORT 6602Impact assessment of global megatrends
56
Patterns of consumption (Figure 24) has 17 collectors. The reason for this is that the focus point has three individual subgoals (patterns of consumption, environment and health). This implies a broad and fuzzy definition for success and a rather complex boundary definition.
Patterns of consumption
Fossil fuel use
-
Renewable energy
production
+
Substituting fossil with biofuels
+
Contaminated land area -
Industrial food production
-
Human health
+
Forest health
+
Energy consumption in northern Europe
+
Industrial food production
-
Stress on marine habitat (algae
growth, oxygen depletion and
chemical effects)
-
Population
-
Renovation of built up area
+
Fossil energy production -
Passenger taking public
transport
+
Passengers using non-fossil
fuel vehicles
+
Substituting fossil with biofuels
+
Figure 24. Factors that have a direct impact on the GG patterns of consumption.
3.5 Results and analysisOnce the model was built, different kinds of evaluations and analyses could be carried out using the Consideo Modeler tool. As mentioned earlier, the global megatrends as described in the SOER 2010 are included in the model. In the following section, our focus is on the analysis of the possible impacts that the global megatrends have on the various generation goals and the collector resource scarcity.
3.5.1 The analysis of the possible impacts of gmTs on resource scarcity The focus of the analysis of the impact that the GMTs have on resource scarcity in northern Europe is on the national level: Sweden. The analysis shows that there are four main megatrends that affect the development of resource scarcity in the short, medium and long term (Figure 18). GMT 2 (living in an urban world) and GMT 5 (continued economic growth) are the main trends that drive resource scarcity in northern Europe. GMT 6 (from unipolar to a multipolar world) and GMT 7 (intensified global competition for resources) are the main trends that prevent or inhibit resource scarcity. The remaining megatrends have more or less a marginal impact on resource scarcity in northern Europe as a whole.

SWEDISH ENVIRONMENTAL PROTECTION AGENCY REPORT 6602Impact assessment of global megatrends
57
Figure 25. An Impact Matrix of the GMTs on resource scarcity in northern Europe. In the matrix, GMT 5 and GMT 2 have a notably strong reinforcing impact to drive resource scarcity. Whereas GMT 7 and GMT 6 have a strong effect to steadily reduce resource scarcity. For an explanation of the colours in the Insight Matrix, please see Section 1.2.
It is worth noting that according to the “business as usual scenario” for the development of the GMTs, the preventing mechanism for resource scarcity lies in “unwanted” competition for resources and the polarisation of regions around the globe that seek access to those resources. Environmental regula-tion and governance (GMT 11) is only marginally effective since the driving forces for competition are much stronger than the drivers for regulation and governance are. The changes between short, medium and long term are not very large, which indicates that the drivers are strong and stable throughout the period. In the case of GMT 6 and GMT 7, which show a strong reduction in resource scarcity, the effect of those global drivers have a dampening effect on the export of mineral and natural resources, thus keeping the resource pools available within the national boundaries (Fig. 19). The national pool of mineral stock in Sweden, for example, is kept in the ground, but it is still available as an easily accessible mineral on short notice. The same goes for natural resources such as wood.
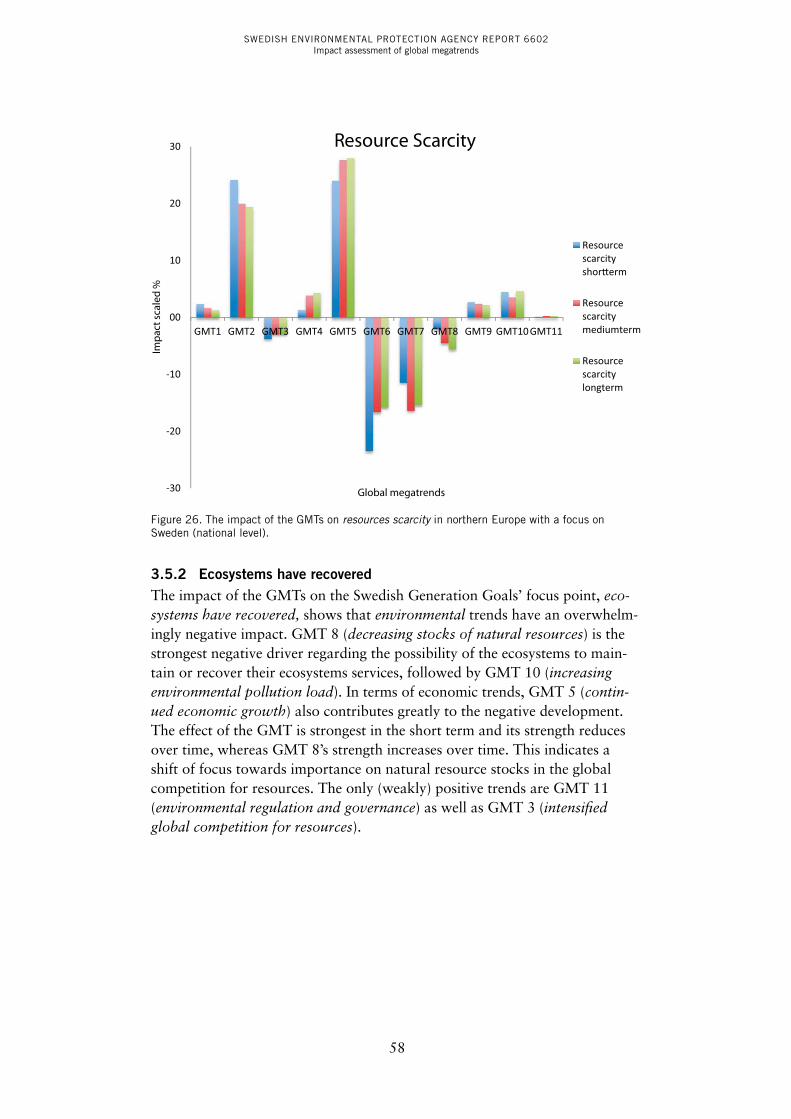
SWEDISH ENVIRONMENTAL PROTECTION AGENCY REPORT 6602Impact assessment of global megatrends
58
Figure 26. The impact of the GMTs on resources scarcity in northern Europe with a focus on Sweden (national level).
3.5.2 Ecosystems have recoveredThe impact of the GMTs on the Swedish Generation Goals’ focus point, eco-systems have recovered, shows that environmental trends have an overwhelm-ingly negative impact. GMT 8 (decreasing stocks of natural resources) is the strongest negative driver regarding the possibility of the ecosystems to main-tain or recover their ecosystems services, followed by GMT 10 (increasing environmental pollution load). In terms of economic trends, GMT 5 (contin-ued economic growth) also contributes greatly to the negative development. The effect of the GMT is strongest in the short term and its strength reduces over time, whereas GMT 8’s strength increases over time. This indicates a shift of focus towards importance on natural resource stocks in the global competition for resources. The only (weakly) positive trends are GMT 11 (environmental regulation and governance) as well as GMT 3 (intensified global competition for resources).
-30
-20
-10
00
10
20
30
GMT1 GMT2 GMT3 GMT4 GMT5 GMT6 GMT7 GMT8 GMT9 GMT10GMT11
Imp
act s
cale
d %
Global megatrends
Resource Scarcity
Resourcescarcityshor�erm
Resourcescarcitymediumterm
Resourcescarcitylongterm

SWEDISH ENVIRONMENTAL PROTECTION AGENCY REPORT 6602Impact assessment of global megatrends
59
Figure 27. The impact of the GMTs on the Swedish Generation Goals’ focus point ecosystems have recovered shows that environmental trends have an overwhelmingly negative impact.
3.5.3 biodiversity and the natural and cultural environment are conservedThe impact of the GMTs on the Swedish Generation Goals’ focus point bio-diversity and the natural and cultural environment are conserved show an overwhelmingly negative impact from all of the megatrends, except from GMT 3, GMT 4 and GMT 11 (Figure 21). The only trend that shows a posi-tive effect on the GGs’ focus point is political trend (GMT 11) and to a certain extent technological trend and social trend. The impact is more pronounced in the short term for most of the trends except for GMT 8, which intensifies its impact on the GGs’ focus point. The political trend shows an increasing effect in the long term. The reason that the biodiversity GGs’ focus point is affected in such a negative way is that on the whole biodiversity is a function that depends on several conditions that must be met in order to maintain it, such as a pollution free environment, the sustainable use of natural resources, maintaining ecosystem habitat and ecosystem services, etc.
-50
-40
-30
-20
-10
00
10Im
pac
t sca
led
%
Global megatrends
Ecosystems
Ecosystemsshor�erm
Ecosystemsmediumterm
Ecosystemslongterm

SWEDISH ENVIRONMENTAL PROTECTION AGENCY REPORT 6602Impact assessment of global megatrends
60
Figure 28. The impact of the GMTs on the Swedish Generation Goals’ focus point biodiversity and the natural and cultural environment are conserved shows that all of the megatrends, except for GMT 3, GMT 4 and GMT 11 have an overwhelmingly negative impact.
3.5.4 human healthThe impact of the GMTs on the Swedish Generation Goals’ focus point human health shows that all of the megatrends, except for GMT 11 (Figure 22) have an overwhelmingly negative impact. The strongest impact is from the environ-mental trends (strongest from GMT 10) as well as the social trends. GMT 5 also shows a strong impact in the short and long term. As is the case for the biodiversity trend, GMT 8 exhibits an increasingly negative impact in the long term. The reason that the human health focus point is so negative is that it stands in inverse relation to many of the megatrends, such as increasing pollution load (which cannot, by definition, improve health).
-30
-25
-20
-15
-10
-05
00
05
10
GMT1 GMT2 GMT3 GMT4 GMT5 GMT6 GMT7 GMT8 GMT9 GMT10GMT11
Imp
act s
cale
d %
Global megatrends
Biodiversity
Biodivers�yshor�erm
Biodiversitymediumterm
Biodiversitylongterm

SWEDISH ENVIRONMENTAL PROTECTION AGENCY REPORT 6602Impact assessment of global megatrends
61
Figure 29. The impact of the GMTs on the Swedish Generation Goals’ focus point human health shows that all of the megatrends except for GMT 11 have an overwhelmingly negative impact.
3.5.5 material cyclesThe impact of the GMTs on the Swedish Generation Goals’ focus point material cycles shows that most of the megatrends (Figure 23) have an overall positive impact. The main trends driving this focus point are the technological and the political trends. The negative trends with regard to the focus point are the population trends, although in comparison to the strength of the positive impacts the effect is slight. The reason for such a strong technological and political impact on the focus point is that material cycles are influenced by the socio-economic decisions more than by the environmental conditions.
-60
-50
-40
-30
-20
-10
00
10
GMT1 GMT2 GMT3 GMT4 GMT5 GMT6 GMT7 GMT8 GMT9 GMT10GMT11
Imp
act s
cale
d %
Global megatrends
Human health
Humanhealthshor�erm
HumanhealthmediumtermHumanhealthlongterm
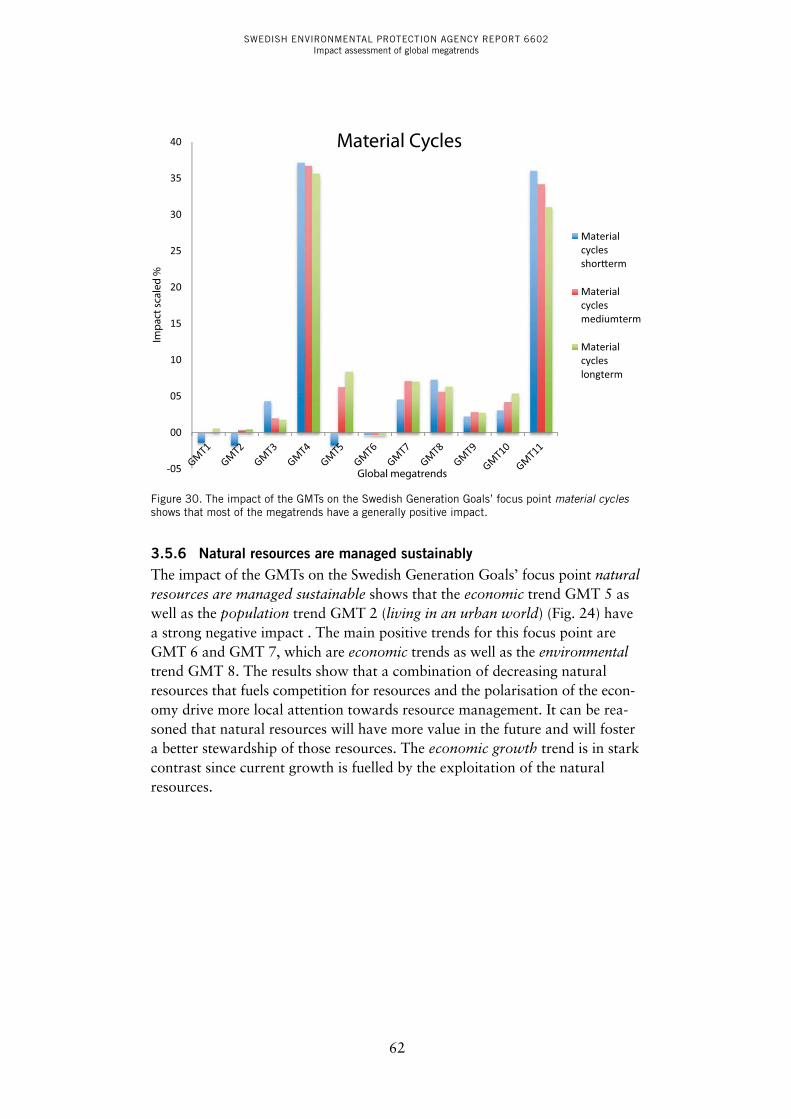
SWEDISH ENVIRONMENTAL PROTECTION AGENCY REPORT 6602Impact assessment of global megatrends
62
Figure 30. The impact of the GMTs on the Swedish Generation Goals’ focus point material cycles shows that most of the megatrends have a generally positive impact.
3.5.6 natural resources are managed sustainablyThe impact of the GMTs on the Swedish Generation Goals’ focus point natural resources are managed sustainable shows that the economic trend GMT 5 as well as the population trend GMT 2 (living in an urban world) (Fig. 24) have a strong negative impact . The main positive trends for this focus point are GMT 6 and GMT 7, which are economic trends as well as the environmental trend GMT 8. The results show that a combination of decreasing natural resources that fuels competition for resources and the polarisation of the econ-omy drive more local attention towards resource management. It can be rea-soned that natural resources will have more value in the future and will foster a better stewardship of those resources. The economic growth trend is in stark contrast since current growth is fuelled by the exploitation of the natural resources.
-05
00
05
10
15
20
25
30
35
40Im
pac
t sca
led
%
Global megatrends
Material Cycles
Materialcyclesshor�erm
Materialcyclesmediumterm
Materialcycleslongterm
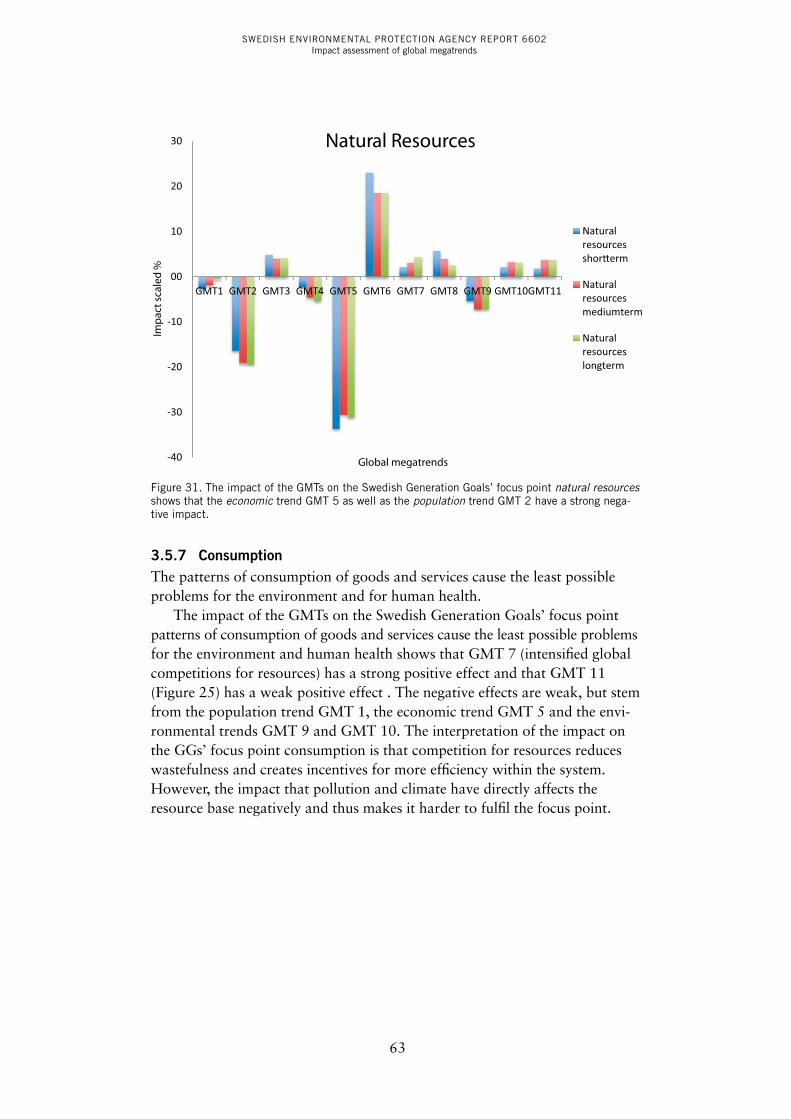
SWEDISH ENVIRONMENTAL PROTECTION AGENCY REPORT 6602Impact assessment of global megatrends
63
Figure 31. The impact of the GMTs on the Swedish Generation Goals’ focus point natural resources shows that the economic trend GMT 5 as well as the population trend GMT 2 have a strong nega-tive impact.
3.5.7 consumptionThe patterns of consumption of goods and services cause the least possible problems for the environment and for human health.
The impact of the GMTs on the Swedish Generation Goals’ focus point patterns of consumption of goods and services cause the least possible problems for the environment and human health shows that GMT 7 (intensified global competitions for resources) has a strong positive effect and that GMT 11 (Figure 25) has a weak positive effect . The negative effects are weak, but stem from the population trend GMT 1, the economic trend GMT 5 and the envi-ronmental trends GMT 9 and GMT 10. The interpretation of the impact on the GGs’ focus point consumption is that competition for resources reduces wastefulness and creates incentives for more efficiency within the system. However, the impact that pollution and climate have directly affects the resource base negatively and thus makes it harder to fulfil the focus point.
-40
-30
-20
-10
00
10
20
30
GMT1 GMT2 GMT3 GMT4 GMT5 GMT6 GMT7 GMT8 GMT9 GMT10GMT11
Imp
act s
cale
d %
Global megatrends
Natural Resources
Naturalresourcesshor�erm
Naturalresourcesmediumterm
Naturalresourceslongterm

SWEDISH ENVIRONMENTAL PROTECTION AGENCY REPORT 6602Impact assessment of global megatrends
64
Figure 32. The impact of the GMTs on the Swedish Generation Goals’ focus point patterns of con-sumption of goods and services cause the least possible problems for the environment and human health shows that GMT 7 has a strong positive effect.
3.5.8 renewable EnergyThe impact of the GMTs on the Swedish Generation Goals’ focus point the share of renewable energy increases and use of energy is efficient, with minimal impact on the environment shows that the political trend GMT 11, the eco-nomic trend GMT 7 and the technological trend GMT 4 (Figure 26) all have a strong positive impact. Other impacts are slight. This focus point is policy driven locally, i.e. it does not primarily depend on external environmental con-ditions. The competition for resources means energy will be more expensive in the future and thus there will be more incentives for developing local/regional solutions. As indicated, strong economic growth might hold back the success of the focus point as well as the reduced resource base from the impact of the environmental trends.
-30
-20
-10
00
10
20
30
40
50Im
pac
t sca
led
%
Global megatrends
Consumption
Consump�onshor�erm
Consump�onmediumterm
Consump�onlongterm
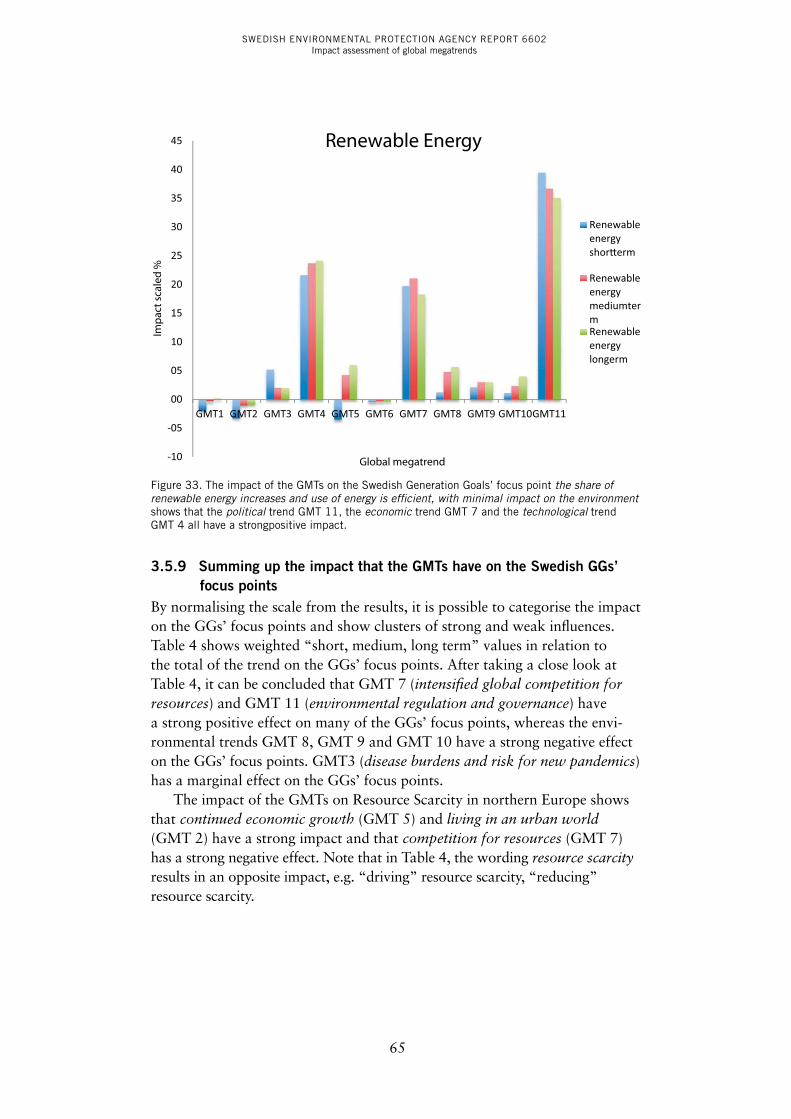
SWEDISH ENVIRONMENTAL PROTECTION AGENCY REPORT 6602Impact assessment of global megatrends
65
Figure 33. The impact of the GMTs on the Swedish Generation Goals’ focus point the share of renewable energy increases and use of energy is efficient, with minimal impact on the environment shows that the political trend GMT 11, the economic trend GMT 7 and the technological trend GMT 4 all have a strongpositive impact.
3.5.9 Summing up the impact that the gmTs have on the Swedish ggs’ focus points
By normalising the scale from the results, it is possible to categorise the impact on the GGs’ focus points and show clusters of strong and weak influences. Table 4 shows weighted “short, medium, long term” values in relation to the total of the trend on the GGs’ focus points. After taking a close look at Table 4, it can be concluded that GMT 7 (intensified global competition for resources) and GMT 11 (environmental regulation and governance) have a strong positive effect on many of the GGs’ focus points, whereas the envi-ronmental trends GMT 8, GMT 9 and GMT 10 have a strong negative effect on the GGs’ focus points. GMT3 (disease burdens and risk for new pandemics) has a marginal effect on the GGs’ focus points.
The impact of the GMTs on Resource Scarcity in northern Europe shows that continued economic growth (GMT 5) and living in an urban world (GMT 2) have a strong impact and that competition for resources (GMT 7) has a strong negative effect. Note that in Table 4, the wording resource scarcity results in an opposite impact, e.g. “driving” resource scarcity, “reducing” resource scarcity.
-10
-05
00
05
10
15
20
25
30
35
40
45
GMT1 GMT2 GMT3 GMT4 GMT5 GMT6 GMT7 GMT8 GMT9 GMT10GMT11
Imp
act s
cale
d %
Global megatrend
Renewable Energy
Renewableenergyshor�erm
RenewableenergymediumtermRenewableenergylongerm
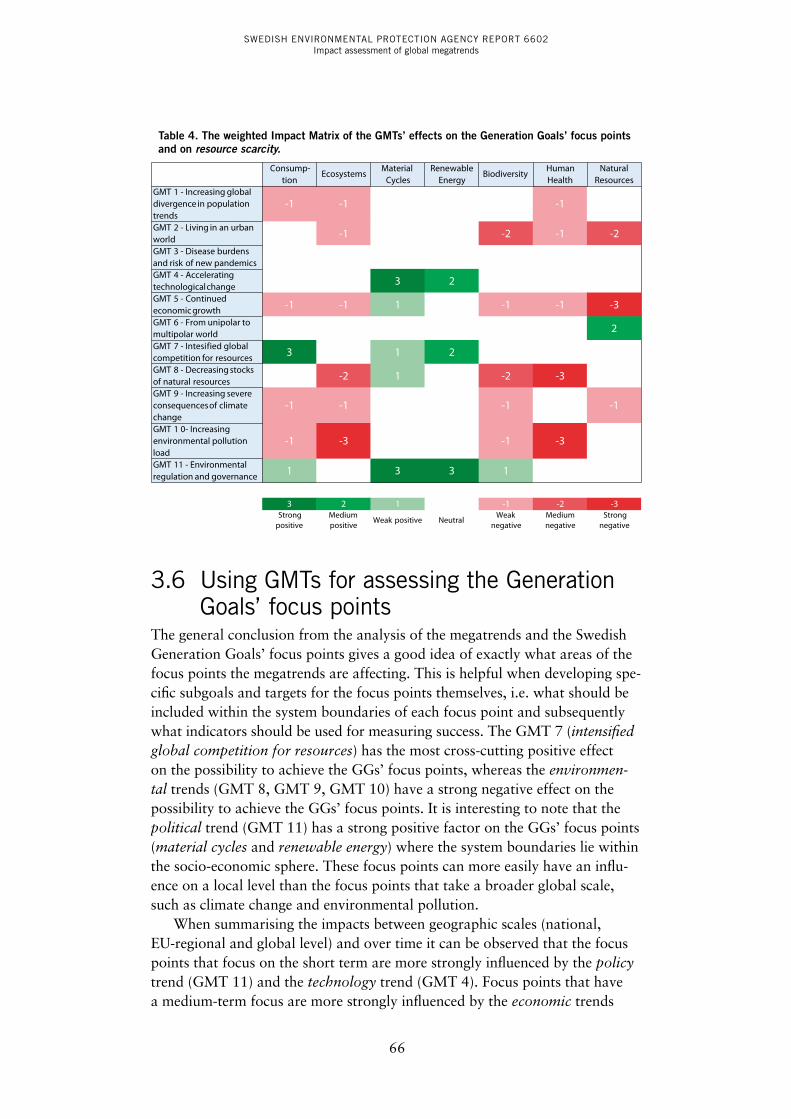
SWEDISH ENVIRONMENTAL PROTECTION AGENCY REPORT 6602Impact assessment of global megatrends
66
Table 4. The weighted Impact matrix of the gmTs’ effects on the generation goals’ focus points and on resource scarcity.
Consump-tion
EcosystemsMaterial
CyclesRenewable
EnergyBiodiversity
Human Health
Natural Resources
GMT 1 - Increasing global divergence in population trends
-1 -1 -1
GMT 2 - Living in an urban world -1 -2 -1 -2
GMT 3 - Disease burdens and risk of new pandemics GMT 4 - Accelerating technological change 3 2 GMT 5 - Continued economic growth -1 -1 1 -1 -1 -3
GMT 6 - From unipolar to multipolar world 2
GMT 7 - Intesified global competition for resources 3 1 2 GMT 8 - Decreasing stocks of natural resources -2 1 -2 -3
GMT 9 - Increasing severe consequences of climate change
-1 -1 -1 -1
GMT 1 0- Increasing environmental pollution load
-1 -3 -1 -3
GMT 11 - Environmental regulation and governance 1 3 3 1
3 2 1 -1 -2 -3Strong
positiveMedium positive
Weak positive NeutralWeak
negativeMedium negative
Strongnegative
3.6 Using GMTs for assessing the Generation Goals’ focus points
The general conclusion from the analysis of the megatrends and the Swedish Generation Goals’ focus points gives a good idea of exactly what areas of the focus points the megatrends are affecting. This is helpful when developing spe-cific subgoals and targets for the focus points themselves, i.e. what should be included within the system boundaries of each focus point and subsequently what indicators should be used for measuring success. The GMT 7 (intensified global competition for resources) has the most cross-cutting positive effect on the possibility to achieve the GGs’ focus points, whereas the environmen-tal trends (GMT 8, GMT 9, GMT 10) have a strong negative effect on the possibility to achieve the GGs’ focus points. It is interesting to note that the political trend (GMT 11) has a strong positive factor on the GGs’ focus points (material cycles and renewable energy) where the system boundaries lie within the socio-economic sphere. These focus points can more easily have an influ-ence on a local level than the focus points that take a broader global scale, such as climate change and environmental pollution.
When summarising the impacts between geographic scales (national, EU-regional and global level) and over time it can be observed that the focus points that focus on the short term are more strongly influenced by the policy trend (GMT 11) and the technology trend (GMT 4). Focus points that have a medium-term focus are more strongly influenced by the economic trends
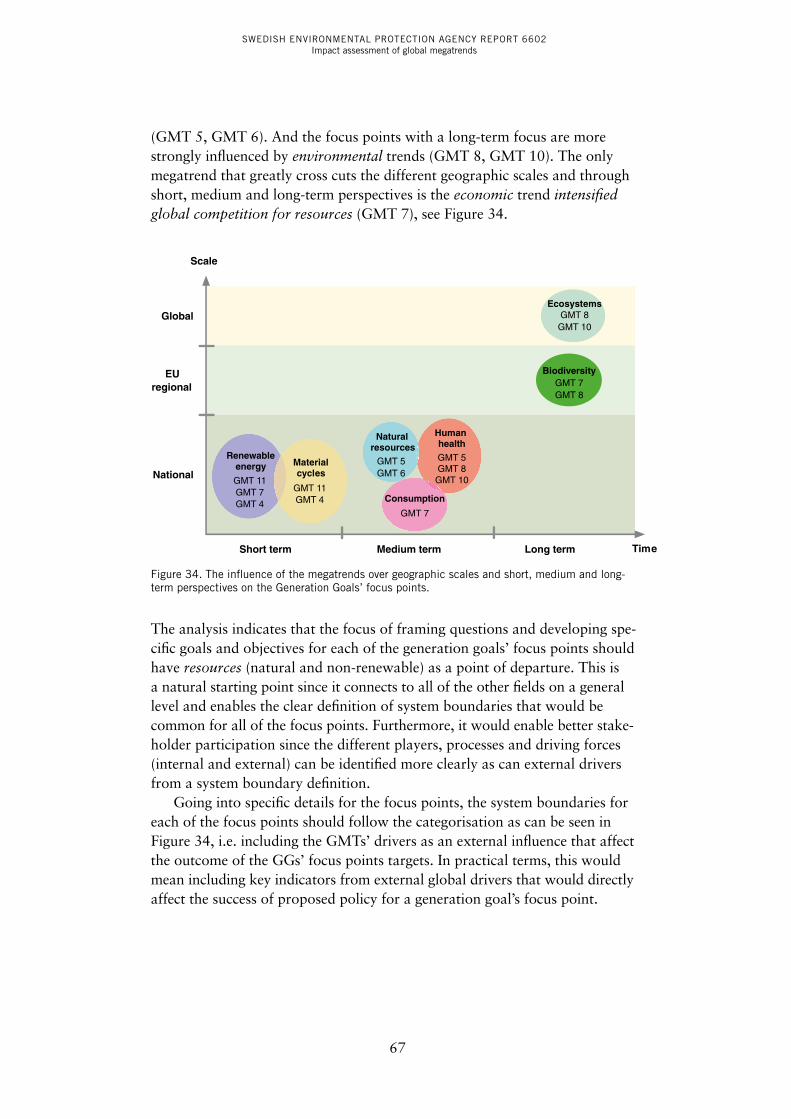
SWEDISH ENVIRONMENTAL PROTECTION AGENCY REPORT 6602Impact assessment of global megatrends
67
(GMT 5, GMT 6). And the focus points with a long-term focus are more strongly influenced by environmental trends (GMT 8, GMT 10). The only megatrend that greatly cross cuts the different geographic scales and through short, medium and long-term perspectives is the economic trend intensified global competition for resources (GMT 7), see Figure 34.
Global
National
TimeShort term Medium term Long term
EU regional
Scale
Renewable energy
GMT 11GMT 7GMT 4 GMT 4
GMT 11
Material cycles GMT 6
GMT 5
Natural resources
GMT 8GMT 5
Human health
GMT 10
GMT 8GMT 7
Biodiversity
GMT 10GMT 8
Ecosystems
GMT 7
Consumption
Figure 34. The influence of the megatrends over geographic scales and short, medium and long-term perspectives on the Generation Goals’ focus points.
The analysis indicates that the focus of framing questions and developing spe-cific goals and objectives for each of the generation goals’ focus points should have resources (natural and non-renewable) as a point of departure. This is a natural starting point since it connects to all of the other fields on a general level and enables the clear definition of system boundaries that would be common for all of the focus points. Furthermore, it would enable better stake-holder participation since the different players, processes and driving forces (internal and external) can be identified more clearly as can external drivers from a system boundary definition.
Going into specific details for the focus points, the system boundaries for each of the focus points should follow the categorisation as can be seen in Figure 34, i.e. including the GMTs’ drivers as an external influence that affect the outcome of the GGs’ focus points targets. In practical terms, this would mean including key indicators from external global drivers that would directly affect the success of proposed policy for a generation goal’s focus point.
SWEDISH ENVIRONMENTAL PROTECTION AGENCY REPORT 6602Impact assessment of global megatrends
68
3.7 Recommendations for the further development of GMT analysis
The experience from the GMT analysis shows that there is an advantage to linking different scales together to observe overall behaviour. Although only a small part of the analysis of the model is presented here, there is large potential to do explorative analyses of what-if scenarios. The generic nature of the model structure means that different types of questions can be posited and answered with some reworking. From a broader perspective, the global megatrends can only be used as a general external influence but without the details of what exact aspects of the trends are causing the impact. This is due to the fact that the megatrends are a system of different players and dynamic processes that need to be thoroughly analysed separately. In order to continue to use the megatrends as factors in future analyses, it is recommended to look more specifically into each trend and develop a thorough system of analytically mapping out all of its actors and driving forces.
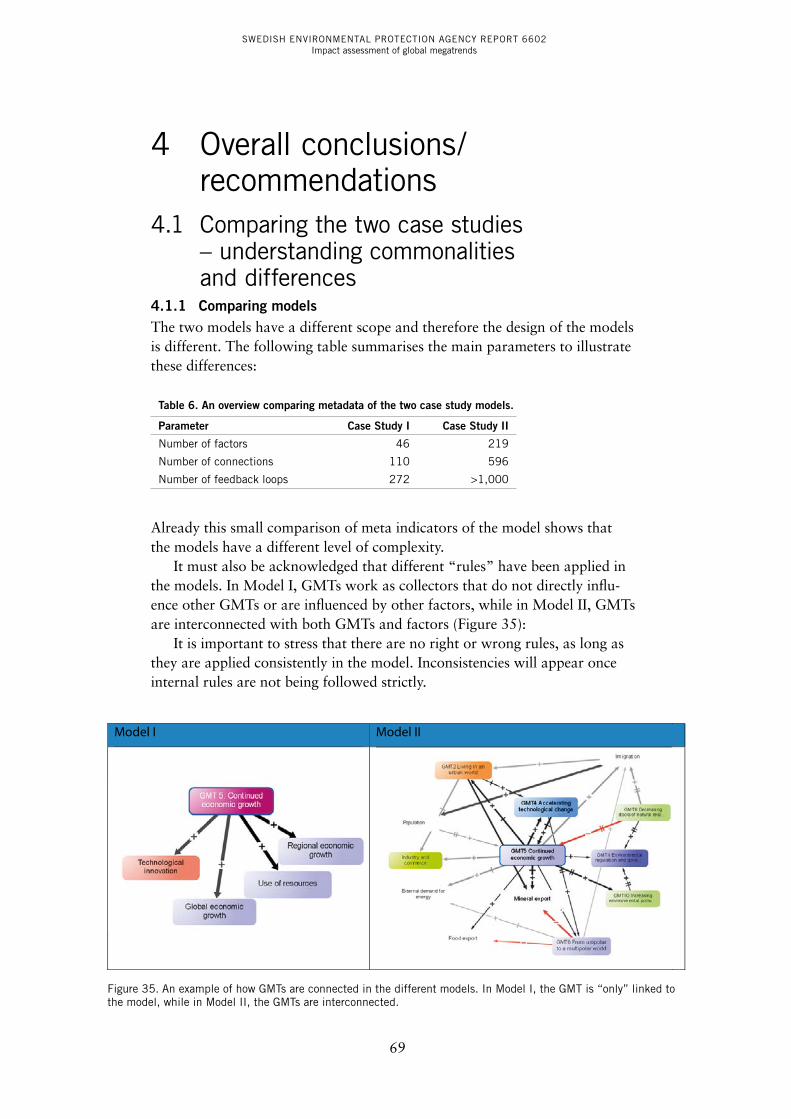
SWEDISH ENVIRONMENTAL PROTECTION AGENCY REPORT 6602Impact assessment of global megatrends
69
4 Overall conclusions/recommendations
4.1 Comparing the two case studies – understanding commonalities and differences
4.1.1 comparing modelsThe two models have a different scope and therefore the design of the models is different. The following table summarises the main parameters to illustrate these differences:
Table 6. An overview comparing metadata of the two case study models.
Parameter case Study I case Study II
Number of factors 46 219
Number of connections 110 596
Number of feedback loops 272 >1,000
Already this small comparison of meta indicators of the model shows that the models have a different level of complexity.
It must also be acknowledged that different “rules” have been applied in the models. In Model I, GMTs work as collectors that do not directly influ-ence other GMTs or are influenced by other factors, while in Model II, GMTs are interconnected with both GMTs and factors (Figure 35):
It is important to stress that there are no right or wrong rules, as long as they are applied consistently in the model. Inconsistencies will appear once internal rules are not being followed strictly.
Model I Model II
Figure 35. An example of how GMTs are connected in the different models. In Model I, the GMT is “only” linked to the model, while in Model II, the GMTs are interconnected.
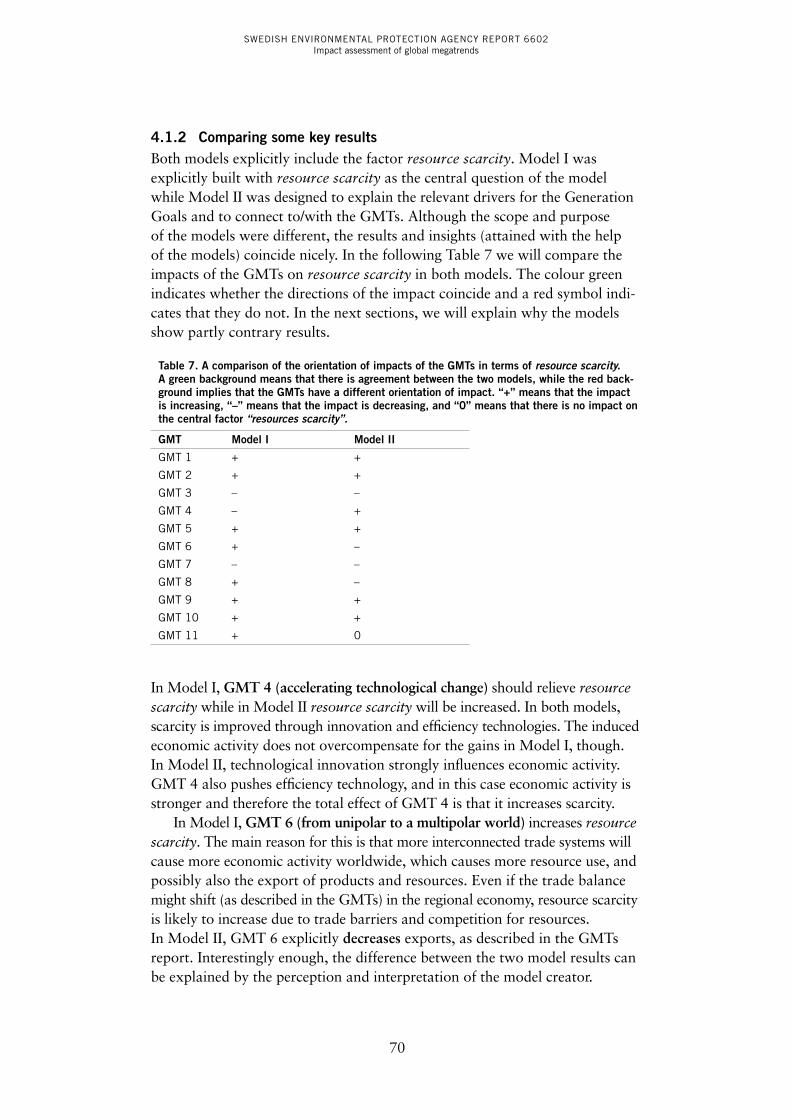
SWEDISH ENVIRONMENTAL PROTECTION AGENCY REPORT 6602Impact assessment of global megatrends
70
4.1.2 comparing some key resultsBoth models explicitly include the factor resource scarcity. Model I was explicitly built with resource scarcity as the central question of the model while Model II was designed to explain the relevant drivers for the Generation Goals and to connect to/with the GMTs. Although the scope and purpose of the models were different, the results and insights (attained with the help of the models) coincide nicely. In the following Table 7 we will compare the impacts of the GMTs on resource scarcity in both models. The colour green indicates whether the directions of the impact coincide and a red symbol indi-cates that they do not. In the next sections, we will explain why the models show partly contrary results.
Table 7. A comparison of the orientation of impacts of the gmTs in terms of resource scarcity. A green background means that there is agreement between the two models, while the red back-ground implies that the gmTs have a different orientation of impact. “+” means that the impact is increasing, “–” means that the impact is decreasing, and “0” means that there is no impact on the central factor “resources scarcity”.
gmT model I model II
GMT 1 + +
GMT 2 + +
GMT 3 – –
GMT 4 – +
GMT 5 + +
GMT 6 + –
GMT 7 – –
GMT 8 + –
GMT 9 + +
GMT 10 + +
GMT 11 + 0
In Model I, GMT 4 (accelerating technological change) should relieve resource scarcity while in Model II resource scarcity will be increased. In both models, scarcity is improved through innovation and efficiency technologies. The induced economic activity does not overcompensate for the gains in Model I, though. In Model II, technological innovation strongly influences economic activity. GMT 4 also pushes efficiency technology, and in this case economic activity is stronger and therefore the total effect of GMT 4 is that it increases scarcity.
In Model I, GMT 6 (from unipolar to a multipolar world) increases resource scarcity. The main reason for this is that more interconnected trade systems will cause more economic activity worldwide, which causes more resource use, and possibly also the export of products and resources. Even if the trade balance might shift (as described in the GMTs) in the regional economy, resource scarcity is likely to increase due to trade barriers and competition for resources. In Model II, GMT 6 explicitly decreases exports, as described in the GMTs report. Interestingly enough, the difference between the two model results can be explained by the perception and interpretation of the model creator.
SWEDISH ENVIRONMENTAL PROTECTION AGENCY REPORT 6602Impact assessment of global megatrends
71
In Model I, GMT 8 (decreasing stocks of natural resources) causes resource scarcity to increase, while in Model II, GMT 8 causes scarcity to decrease. Interestingly enough, the basic mechanism, i.e. the competition for resources, is apparent in both models. In Model II, there is also a direct connection to GMT 5 (economic growth) overcompensating the effect of the competition.
Finally, in Model II, GMT 11 (environmental regulation and governance) has nearly no effect on resource scarcity, while in Model I, the increasing effect is more obvious. The increasing effect on resource scarcity in Model I can be explained by the potential increase in the political scarcity of resources (i.e. trade barriers) and by a potentially stronger global economy (i.e. more demand worldwide). In Model II, GMT 11 has a greater connection to energy efficiency and emission control, which is only indirectly connected to the factor resource scarcity. Nevertheless, also in Model II, the effect is very small but still increasing.
4.2 Lessons learned, limitations and potential4.2.1 Some words on qualitative modellingThe potential of qualitative modelling is huge. The approach is easy to use and yields transparent results. However, the ease of use of the approach does not imply that it is easy to automatically get good models as well. There are different styles and rules when it comes to qualitative modelling and there are always different tools that can be used, e.g. everything from paper and pen to using drawing software, system dynamics platforms or tools designed to support qualitative modelling. There are, in fact, various platforms and approaches on the market. All tools use the same general rules, which we presented in Section 1.2.
One should be aware of what the purpose of making a model is. We generally distinguish between descriptive and explorative modelling:
• When taking the descriptive modelling approach, you (and your experts) already have a rather good overview of the system and are trying to explain the potential behaviour of the model with as few factors as pos-sible. General feedback loops are more or less known and visualised and assessed according to the central question posed. The complexity of the model depends on how accurate the answer should be and additional explaining factors added to reflect this need. This approach is commonly applied as a preparatory step towards stock and flow modelling in system dynamics.
• When taking the explorative modelling approach, you (and your group) are using questioning techniques to expand and develop the model by fol-lowing basic rules of questioning. Linear chains and feedback loops are “discovered” through the process and sorted afterwards in the analysis process. Whenever you focus on one factor and you and your group can say “all connections are correct”, the entire model will be correct.
SWEDISH ENVIRONMENTAL PROTECTION AGENCY REPORT 6602Impact assessment of global megatrends
72
Both approaches require a thorough group modelling process with relevant stakeholder and/or experts in order to succeed, but depending upon the level of understanding of the question and the system at hand, both descriptive and explorative modelling approaches have their advantages.
As an intermediate conclusion: when you “know” your system, e.g. a global megatrend, you already are aware of the important basic variables, flows and conditions. Here, a descriptive approach is useful to explain the functioning and the potential behaviour of the system with the least number of variables. After the basic system is known and described, cross connec-tions and extensions to other factors or drivers can be set. If your question is not very precise or the boundaries of your system are not well defined, the explorative approach may be more appropriate to use. If you, for example, do not know what a megatrend is or what the most important trends that might influence European environmental policy might be, you should begin by asking these questions and brainstorm with your group of experts to ascertain what the most relevant factors and developments that could have an influence on the central question might be.
4.2.2 Some words on gmTsOne of the main conclusions of this small modelling exercise is that global megatrends are a quite useful instrument to sensitise ourselves about future developments. However, GMT analysis has some limitations:
• Fuzzy system boundaries of GMTs. A (mega)trend describes the move-ment of “something” in a “certain direction”. In many cases, it is not clear what exactly moves where. The key to understanding global meg-atrends isunderstanding the basic questions they pose. If a question is clearly formulated, it is much easier to understand what is moving and where. The more complex and “composite” a megatrend is the more dif-ficult it will be to estimate and evaluate possible impacts. For example, in the case of GMT 1 (increasing divergences of population trends), the vari-able that changes over time, is the “number of different trends all over the world that show how population is developing”. The phrase number of different population trends all over the world is vague. In order to under-stand the divergence of population trends one must look at the core being described, namely the number of people in different geographical regions and how their numbers will evolve over time. In this sense, subtrends become important (or what they describe). Population development in Africa is described as a different trend than the one in Europe, thus from the perspective of GMT 1, the two regions must be described by inde-pendent subtrends but still describe the same variable: “people over time”. Having said that, it becomes clear, that any usage of GMT presentation requires careful attention in terms of what is being compared to what.
SWEDISH ENVIRONMENTAL PROTECTION AGENCY REPORT 6602Impact assessment of global megatrends
73
• GMTs are artificial behaviour. When using the GMTs, a common statement might be GMT X will have an impact on my specific question. Looking closer we would have to ask which of the trends’ details (i.e. the variables) are causing the impact. Megatrends themselves exhibit the complex sys-tem behaviour of different players, stocks and dynamic processes that need to be thoroughly analysed separately. Some authors, see e.g. Tomas Ries (2010)40 chose a different approach to assess global developments that might have an impact on European or national environmental policy.
• The GMTs are presented unconnected to each other. It is quite apparent that some of the GMTs are very closely linked, e.g. urbanisation and changes in demographics. Currently, however, it is unclear, how exactly the GMTs are connected or even causally related.
• Unidentified common drivers. Clearly, there are factors in the background that are “pushing and pulling” and acting as driving forces within and between different megatrends. Once identified, these common drivers might be the connectors between the GMTs.
• Scales between GMTs are not harmonised. When reading through the dif-ferent GMTs one can see that although the temporal and spatial coverage is global, each GMT is different.
In summary, all of the above mentioned limitations are closely related. GMT analysis is a highly complex venture. When trying to connect the GMTs in a qualitative model these limitations become apparent. However, this does not automatically mean that GMT analysis is not of high value.
The EEA has done great work so far. The next step should be to gain more systemic insight into the megatrends by identifying common drivers, key vari-ables, indicators and connections to other GMTs.
4.3 Final recommendations and conclusions:• GMTs alone do not give a coherent picture of the future. Therefore,
the next logical step is to develop qualitative scenarios that can help us to handle the problem of “consistency”.
• GMTs should not be taken as fixed over time but dynamic; a grow-ing number of studies available present different kind of megatrends from a different starting points. A continuous process of “renewing” the selection of relevant megatrends should be done.
• GMTs should be based on a more comprehensive conceptual (quali-tative) model. Understanding the mechanisms in the background ena-bles us to apply the GMTs to specific problems or fields of analysis.
• An additional step would be a connected quantification of the meg-atrends. This would be an integrated “world” model, e.g. presented by Meadows et al.
• The experience from the GMT analysis shows that qualitative model-ling can help us to overcome problems of scale (spatial and temporal).

SWEDISH ENVIRONMENTAL PROTECTION AGENCY REPORT 6602Impact assessment of global megatrends
74
5 ANNEX: Model documentations5.1 Case Study 1: generic model on
resource scarcityThe main purpose of this model was to identify the impact of the GMTs – as described in the SOER 2010 xii – on a regional topic: in this case “resource scarcity in Northern Europe”. Northern Europe is characterised as a region that has a great deal of biotic and renewable resources (forest, agriculture) with a strong dependence on fossil resources and raw materials, especially metals, rare metals, etc.
Scarcity depends on both, the availability of resources and on the use of resources. Generally, there are differences between rare resources, scarce resources and critical resources, depending on geological abundance and access as well as economic and political access. In the context of the model, we use the term scarcity more to describe the abstract result of high usage than to describe limited availability. This does not automatically mean that stocks of resources are exhausted forever – but there is a discrepancy in terms of offer and demand. Both demand and offer are determined by various fac-tors and drivers. Just how these two branches are represented in the model will be described in more detail in the following sections.
The availability of resources is determined by regional abiotic reserves and natural and biotic/renewable resources, e.g. forest and life stocks and/or by the trade (import/export) of resources – be it in the form of raw materials or in the form of goods.
xii http://www.eea.europa.eu/soer/europe-and-the-world/megatrends (visited on 28.08.2013).
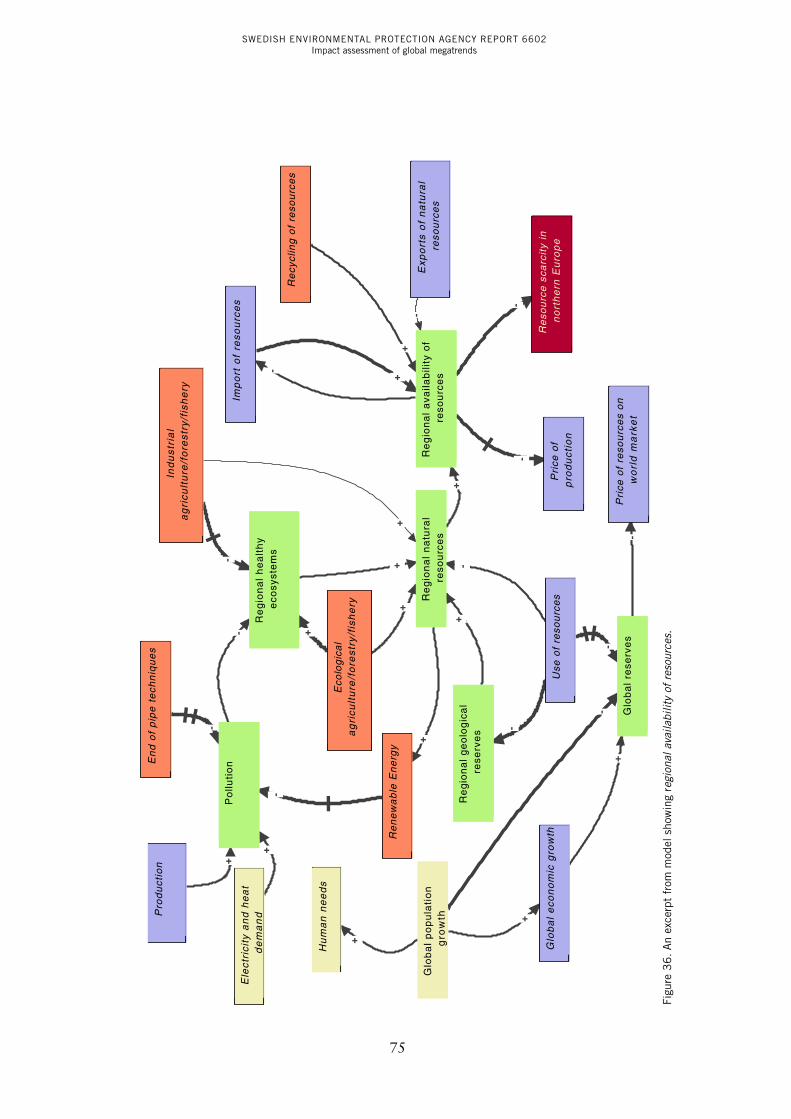
SWEDISH ENVIRONMENTAL PROTECTION AGENCY REPORT 6602Impact assessment of global megatrends
75
-
++
+
-
--
+
-
-++
+
+
- +
-
-
+
-+
-+
-
-
+
+
Re
gio
na
l h
ea
lth
y e
cosy
ste
ms
Glo
ba
l e
con
om
ic g
row
thP
rice
of
pro
du
ctio
nU
se o
f re
sou
rce
s
Imp
ort
of
reso
urc
es
Re
gio
na
l a
vaila
bili
ty o
f re
sou
rce
s
Ind
us
tria
la
gri
cult
ure
/fo
rest
ry/f
ish
ery
Re
sou
rce
sca
rcit
y in
n
ort
he
rn E
uro
pe
Po
lluti
on
Pro
du
ctio
n
Pri
ce o
f re
sou
rce
s o
n
wo
rld
ma
rke
tG
lob
al
rese
rve
s
Re
ne
wa
ble
En
erg
y
Eco
log
ica
la
gri
cult
ure
/fo
rest
ry/f
ish
ery
Exp
ort
s o
f n
atu
ral
reso
urc
es
En
d o
f p
ipe
te
chn
iqu
es
Ele
ctri
city
an
d h
ea
td
em
an
d
Re
cycl
ing
of
reso
urc
es
Glo
ba
l p
op
ula
tio
n
gro
wth
Hu
ma
n n
ee
ds
Re
gio
na
l n
atu
ral
reso
urc
es
Re
gio
na
l g
eo
log
ica
l re
serv
es
Figu
re 3
6. A
n ex
cerp
t fr
om m
odel
sho
win
g re
gion
al a
vaila
bilit
y of
res
ourc
es.

SWEDISH ENVIRONMENTAL PROTECTION AGENCY REPORT 6602Impact assessment of global megatrends
76
The import and export of resources is very closely related to the economic sphere in the form of trade. Figure 37 shows the economic system as an excerpt of total model. The price of resources depends on offer (global reserves, regional availability, trade barriers) and on demand (use of resources, recycling = reduced use). The price regulates imports and exports and also influences the price of production. If prices of resources are high this will encourage us to be more resource efficient. We introduced trade barriers to the model, which can be politically or economically effective. In any case, import is hindered by them and prices are affected. However, there is an ambivalent effect: when prices are high on the world market, more resources will be exported – this has an effect on regional economic growth. The more resources are exported, though, the less are regionally available. There is close relationship between regional and global market. This connection is important in order to link global megatrends to regional developments. We assume (with the exception of the trade barriers) that there is the possibility to exchange resources globally. So, the global availability of resources has a direct impact on the prices of the resources.
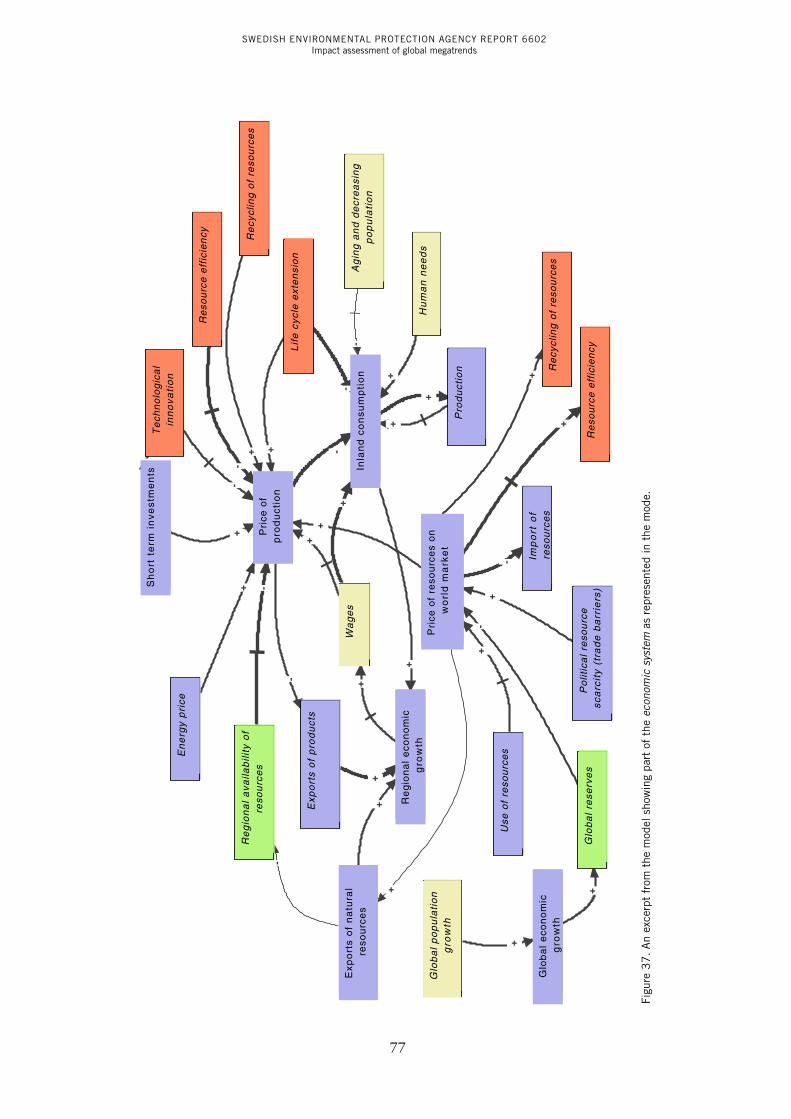
SWEDISH ENVIRONMENTAL PROTECTION AGENCY REPORT 6602Impact assessment of global megatrends
77
Figu
re 3
7. A
n ex
cerp
t fr
om t
he m
odel
sho
win
g pa
rt o
f th
e ec
onom
ic s
yste
m a
s re
pres
ente
d in
the
mod
e.
-
+
++
+
+
-
+
-
-+-
-
+
+
-+
+
+
+
-
+
+
+
-+
+
++
+
+
-
Exp
ort
s o
f p
rod
uct
s
Lif
e c
ycle
ext
en
sio
n
Imp
ort
of
reso
urc
es
Exp
ort
s o
f n
atu
ral
reso
urc
es
En
erg
y p
rice
Glo
ba
l p
op
ula
tio
n
gro
wth
Po
litic
al
reso
urc
e
sca
rcit
y (t
rad
e b
arr
iers
)
Re
sou
rce
eff
icie
ncy
Wa
ge
s
Hu
ma
n n
ee
ds
Pri
ce o
f p
rod
uct
ion
Glo
ba
l re
serv
es
Use
of
reso
urc
es
Re
sou
rce
eff
icie
ncy
Pro
du
ctio
n
Pri
ce o
f re
sou
rce
s o
n
wo
rld
ma
rke
t
Inla
nd
co
nsu
mp
tio
n
Re
gio
na
l a
vaila
bili
ty o
f re
sou
rce
sR
ecy
clin
g o
f re
sou
rce
s
Te
chn
olo
gic
al
inn
ova
tio
n
Sh
ort
te
rm i
nv
es
tme
nts
Re
cycl
ing
of
reso
urc
es
Glo
ba
l e
con
om
ic
gro
wth
Ag
ing
an
d d
ecr
ea
sin
g
po
pu
lati
on
Re
gio
na
l e
con
om
ic
gro
wth
SWEDISH ENVIRONMENTAL PROTECTION AGENCY REPORT 6602Impact assessment of global megatrends
78
As shown in the Figure 38, resources are mainly used for the production of goods. We hereby assume all kind of goods and also infrastructure. Electricity and heat demand play a special role, so this factor is named explicitly. The two main decreasing factors for the use of resources will be resource efficiency and renewable energy. The recycling of resources will keep resources in the material cycle and therefore increase the regional availability of the resources.
Production is driven by domestic consumption and exports. Domestic consumption will be determined by human needs, the money available for consumption, prices and actually also by the number of humans that are consuming. The factor ageing and decreasing population is only valid for northern Europe here, and reflects the overall net effect of the current develop-ments. The decreasing effect on domestic consumption can be explained by the fact that there will be less people in northern Europe actually consuming. Here, special effects (or wildcards) such as high migration, or military con-flicts are not included in the model.
Demographic development is one of the factors that is closely connected to the GMTs. The demographic change in northern Europe is a component of the factor increasing global divergence of population trends. And in the case of northern Europe (ageing society), it is also clear that older people are more vulnerable to diseases and threats caused by pollution and climate change. Trends of urbanisation (only partly relevant for Europe) will to a certain extent increase the density of the population, which will also increase the vul-nerability of the population to the effects of climate change and possible pan-demics. We assume that the megatrend living in an urban world (not shown in the figure) will increase the needs of the people, especially when taking elec-tronics, household goods, transportation and (industrial) food into account. Human needs also trigger the demand for electricity.
The complete model is available free as an online iModeler version: https://imodeler.info/ro?key=AfWQaiAq_l5cabnl4HgBrHg
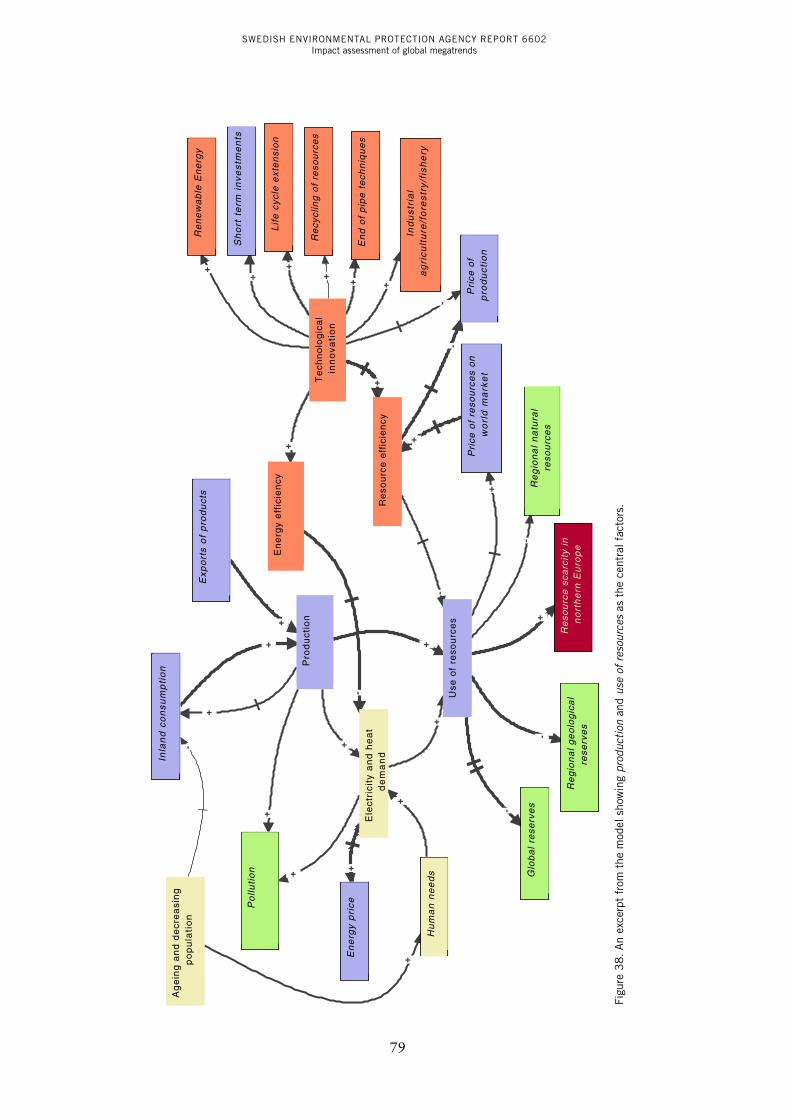
SWEDISH ENVIRONMENTAL PROTECTION AGENCY REPORT 6602Impact assessment of global megatrends
79
Figu
re 3
8. A
n ex
cerp
t fr
om t
he m
odel
sho
win
g pr
oduc
tion
and
use
of
reso
urce
s as
the
cen
tral
fac
tors
.
-
-
+
-
+
+
+
-
+
+
+
+
+
+
+
+
--
+
+
+
+
-
+
+
+
+
+
-
+
Use
of
reso
urc
es
Hu
ma
n n
ee
ds
En
erg
y p
rice
Pri
ce o
f re
sou
rce
s o
n
wo
rld
ma
rke
t
En
d o
f p
ipe
te
chn
iqu
es
Pro
du
ctio
n
Po
lluti
on
Sh
ort
te
rm i
nv
es
tme
nts
En
erg
y e
ffic
ien
cy Re
gio
na
l n
atu
ral
reso
urc
es
Ind
us
tria
la
gri
cu
ltu
re/f
ore
str
y/f
ish
ery
Ele
ctri
city
an
d h
ea
td
em
an
d
Lif
e c
ycle
ext
en
sio
n
Re
sou
rce
sca
rcit
y in
n
ort
he
rn E
uro
pe
Re
gio
na
l g
eo
log
ica
l re
serv
es
Inla
nd
co
nsu
mp
tio
n
Glo
ba
l re
serv
es
Exp
ort
s o
f p
rod
uct
s
Pri
ce o
f p
rod
uct
ion
Re
cycl
ing
of
reso
urc
es
Re
sou
rce
eff
icie
ncy
Te
chn
olo
gic
al
inn
ova
tio
n
Ag
ein
g a
nd
de
cre
asi
ng
p
op
ula
tio
nR
en
ew
ab
le E
ne
rgy

SWEDISH ENVIRONMENTAL PROTECTION AGENCY REPORT 6602Impact assessment of global megatrends
80
5.2 Case Study II: basic modulesThe model has six basic modules that can be expressed in several simple feed-back loops. Although models can have a simple feedback loop structure, the many interconnections between the modules generate a multitude of loops that generate the dynamics in the analysis.
5.2.1 The building module:
Figure 39. The basic feedback loops of the building module.
5.2.2 The energy module:.
-75-
6.2 Case Study II: basic modules
The model has six basic modules that can be expressed in several simple feedback loops. Although models can have a simple feedback loop structure, the many interconnections between the modules generate a multitude of loops that generate the dynamics in the analysis.
6.2.1 The building module:
Figure 43: the basic feedback loops of the building module.
6.2.2 The energy module:.
Figure 44: the basic energy system module has one reinforcing feedback loop and four balancing feedback loops (modified from Dawson 2012).
B
R
B
B
B
B
R
B
Figure 40. The basic energy system module has one reinforcing feedback loop and four balancing feedback loops (modified from Dawson 2012).
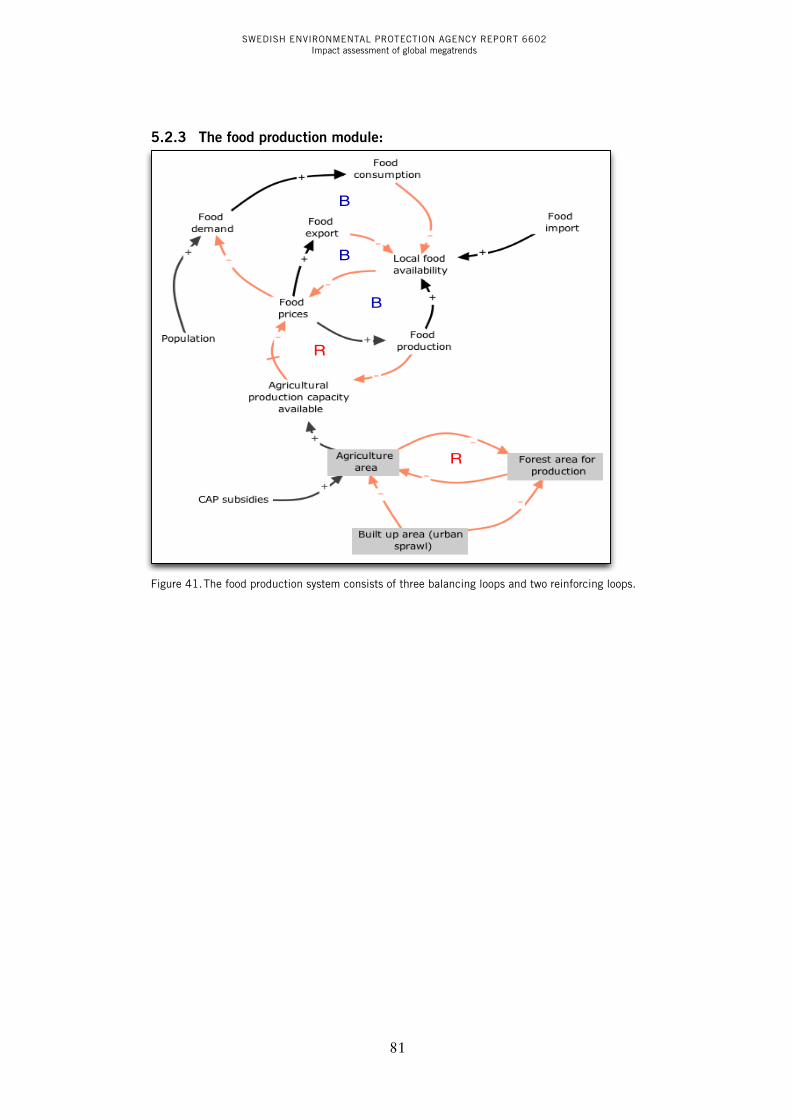
SWEDISH ENVIRONMENTAL PROTECTION AGENCY REPORT 6602Impact assessment of global megatrends
81
5.2.3 The food production module:
Figure 41. The food production system consists of three balancing loops and two reinforcing loops.
-76-
6.2.3 The food production module:
Figure 45: the food production system consists of three balancing loops and two reinforcing loops.
R
B
B
B
R
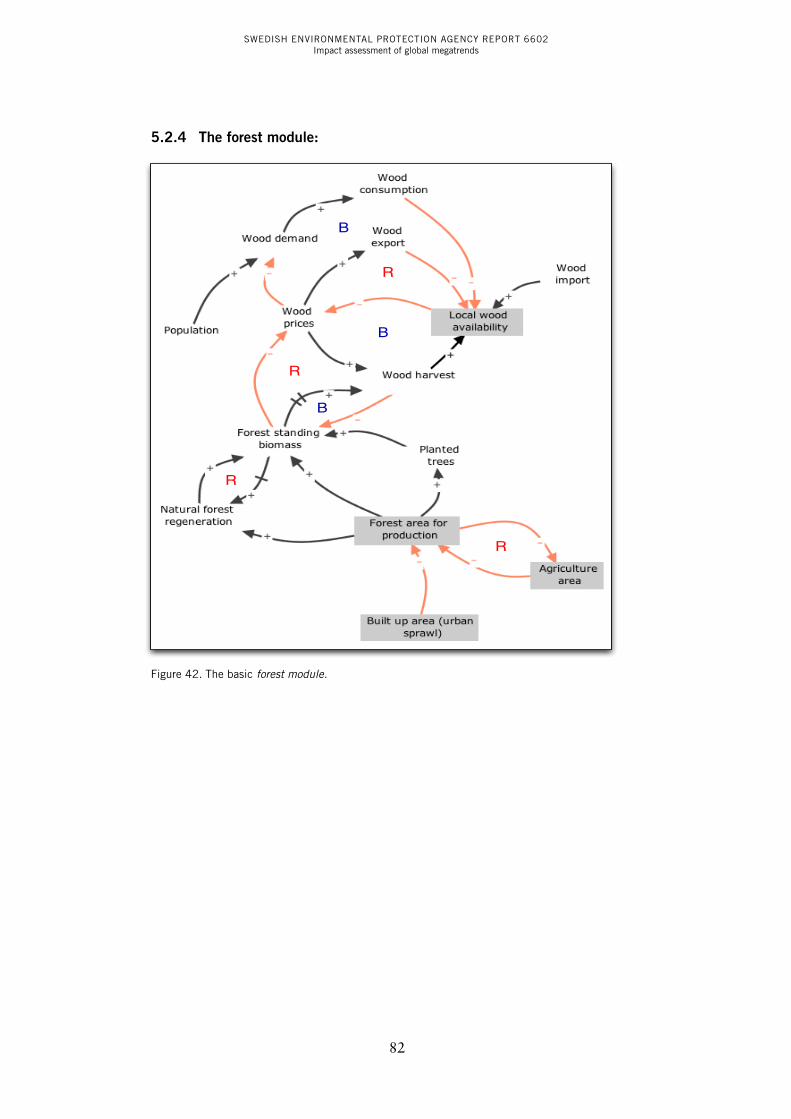
SWEDISH ENVIRONMENTAL PROTECTION AGENCY REPORT 6602Impact assessment of global megatrends
82
5.2.4 The forest module:
Figure 42. The basic forest module.
-77-
6.2.4 The forest module:
Figure 46: the basic forest module.
B
R
B
B
R
R
R
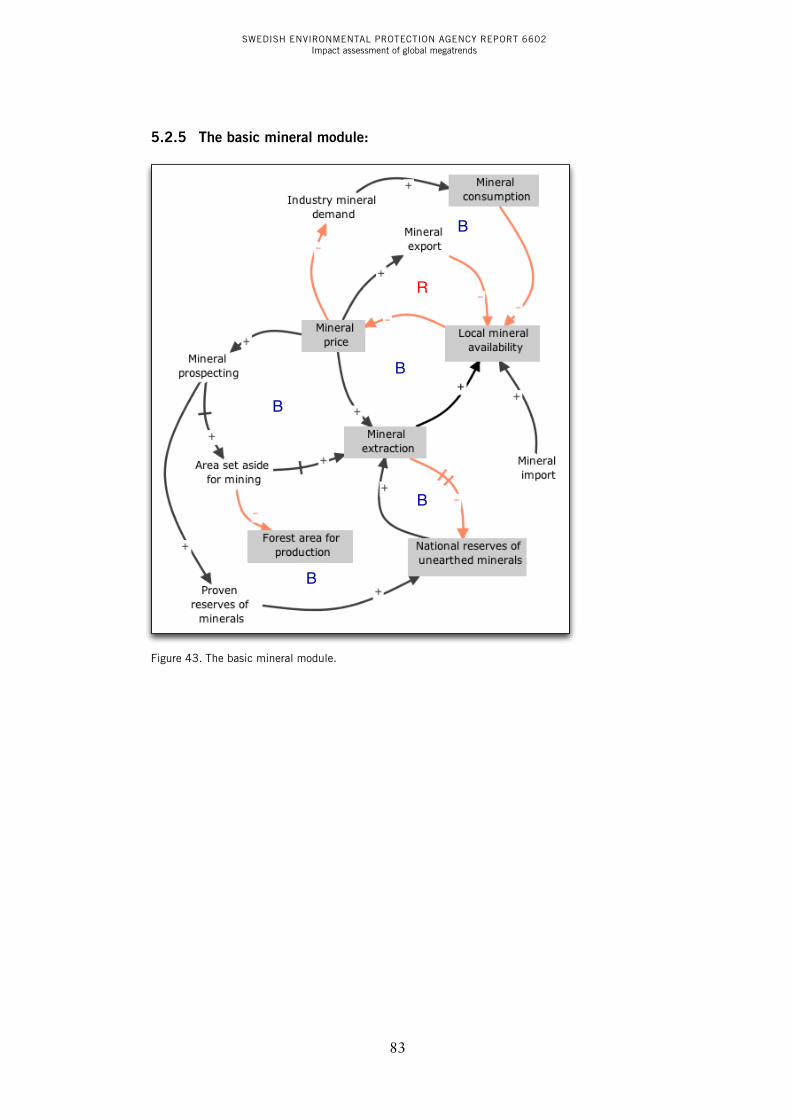
SWEDISH ENVIRONMENTAL PROTECTION AGENCY REPORT 6602Impact assessment of global megatrends
83
5.2.5 The basic mineral module:
Figure 43. The basic mineral module.
-78-
6.2.5 The basic mineral module:
Figure 47: the basic mineral module.
B
B
R
B
B
B
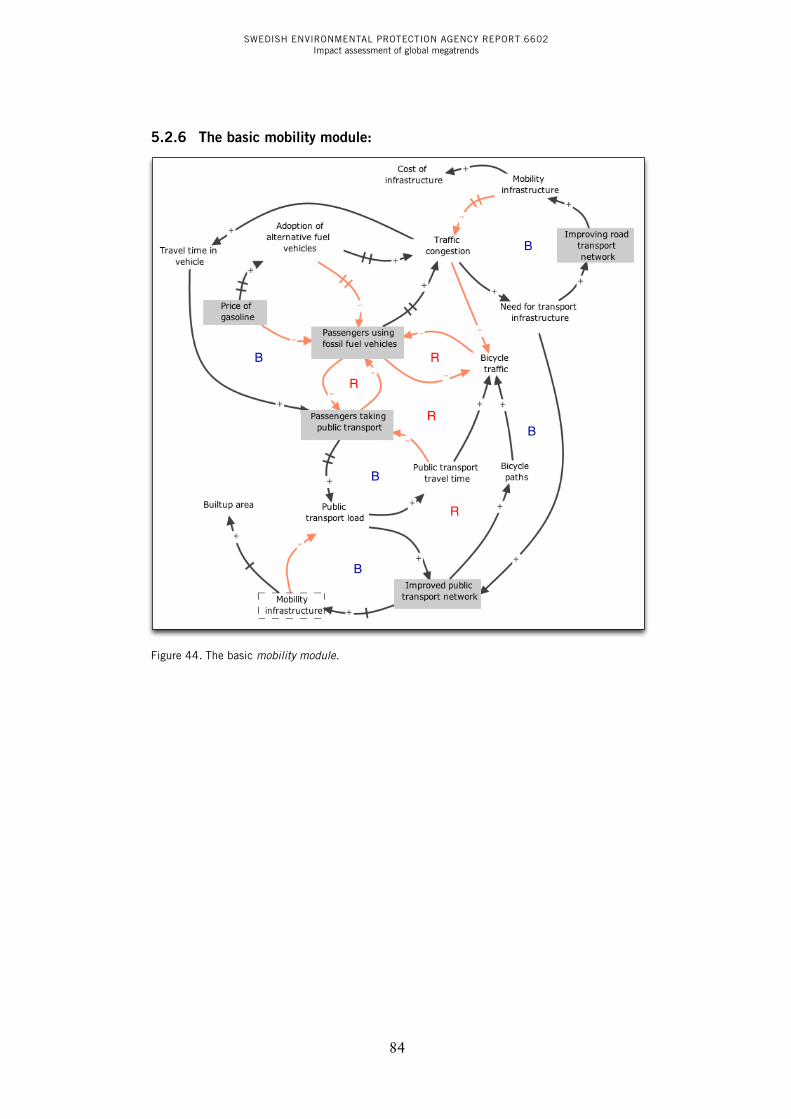
SWEDISH ENVIRONMENTAL PROTECTION AGENCY REPORT 6602Impact assessment of global megatrends
84
5.2.6 The basic mobility module:
Figure 44. The basic mobility module.
-79-
6.2.6 The basic mobility module:
Figure 48: the basic mobility module.
B
R
R
R
B
B
B
RB

SWEDISH ENVIRONMENTAL PROTECTION AGENCY REPORT 6602Impact assessment of global megatrends
85
6 List of References1 http://forum.eionet.europa.eu/nrc-flis/
2 See http://www.eea.europa.eu/soer/europe-and-the-world (accessed 13 March 2012)
3 See http://www.eea.europa.eu/soer/europe-and-the-world/megatrends (accessed 22 August 2012)
4 Jay W. Forrester: Industrial dynamics. 9th edition. Cambridge 1977.
5 https://en.wikipedia.org/wiki/List_of_system_dynamics_software
6 https://en.wikipedia.org/wiki/Fuzzy_cognitive_map
7 http://hcs.science.uva.nl/QRM/index.html
8 http://www.consideo.com/imodeler24.html
9 http://epp.eurostat.ec.europa.eu/tgm/table.do?tab=table&init=1&plugin=1&language=en&pcode= tsdpc230
10 COM(2001)264
11 COM(2005)670
12 COM(2008)397
13 COM(2010)2020
14 COM(2011)21
15 COM(2011)571
16 COM(2008)699
17 COM(2011)25
18 COM(2012) 82 final
19 http://www.pbl.nl/sites/default/files/cms/publicaties/500167001_0.pdf
20 Donella Meadows, Dennis L. Meadows & Jørgen Randers: Limits to Growth: The 30-Year Update. Chelsea Green, 2004, ISBN 1-931498-58-X.
21 Johan Rockström et al. (2009) ‘A safe operating space for humanity’, Nature 461, 472-475 (24 September 2009)
22 WWF (2012) 2010 Living Planet Report: http://awsassets.panda.org/downloads/1_lpr_2012_online_full_size_single_pages_final_120516.pdf (accessed 6 September 2012)
23 Food and the Arab spring – let them eat Baklava, The Economist (17 March 2012): http://www.economist.com/node/21550328 (accessed 6 September 2012)
SWEDISH ENVIRONMENTAL PROTECTION AGENCY REPORT 6602Impact assessment of global megatrends
86
24 Nicholas Georgescu-Roegen: The Entropy Law and the Economic Process. Harvard University Press, Cambridge, Massachusetts 1971.
25 Maxwell, D., Owen, P., McAndrew. L, Muehmel, K., Neubauer, A., Addressing the Rebound Effect, a report for the European Commission DG Environment, 26 April 2011.
26 OECD (2008), OECD Science, Technology and Industry Outlook 2008, OECD Publishing.
27 https://en.wikipedia.org/wiki/System_archetype
28 COM(2008) 699
29 COM(2011) 25
30 COM(2012) 82 final
31 COM(2011) 571
32 UNEP-IRP report on “Environmental Risk and Challenges of Anthropogenic Metal Flows”.
33 Naturvårdsverket, 2010. Environmental objectives in the mountain land-scape: a synthesis of research problems connected to the management of a limited resource, Swedish EPA, Stockholm (report 6366).
34 Naturvårdsverket, 2012. The Swedish Environmental Objectives: an in-depth evaluation 2012 (Steg på vägen, fördjupad utvärdering), SEPA, Stockholm (report 6500).
35 Nykvist, B. et al., 2013. National Environmental Performance on Planetary Boundaries: a study for the Swedish Environmental Protection Agency, Swedish SEPA, Stockholm.
36 Roadmap to a resource efficient Europe 2050 (COM(2011)571)
37 http://www.regeringen.se/sb/d/2055
38 Naturvårdsverket, 2012. Uppföljning av generationmålet, underlag till den fördjupade utvärderingen av miljömålen 2012 (The Generation Goals – a follow-up), Swedish EPA, Stockholm (report 6504).
39 http://www.regeringen.se/sb/d/12166/a/142456
40 Tomas Ries, 2010, The global security environment 2030 and military missions, Department for Strategic and Security Studies, Swedish National Defence College
41 http://www.eea.europa.eu/soer/europe-and-the-world/megatrends (visited on 28.08.2013)
Swedish EPA SE-106 48 Stockholm. Visiting address: Stockholm – Valhallavägen 195, Östersund – Forskarens väg 5 hus Ub. Tel: +46 10-698 10 00, fax: +46 10-698 10 99, e-mail: [email protected] Internet: www.swedishepa.se Orders Ordertel: +46 8-505 933 40, orderfax: +46 8-505 933 99, e-post: [email protected] Adress: Arkitektkopia AB, Box 110 93, SE-161 11 Bromma. Internet: www.naturvardsverket.se/publikationer
Impact assessment of global megatrends
Two case studies connecting global megatrends to regional topics
UllrIch lorenz and hördUr V. haraldsson
rEport 6602 • february 2014
Swedish EpA Se-106 48 Stockholm. Visit ing address: Stockholm - Valhallavägen 195, Östersund - forskarens väg 5 hus ub, . Tel: +46 10 698 10 00, fax: +46 10 698 10 99, e-mail: [email protected] Internet: www.swedishepa.se orders Ordertel: +46 8 505 933 40, orderfax: +46 8 505 933 99, e-mail: [email protected] address: CM Gruppen, box 110 93, Se-161 11 bromma. Internet: www.swedishepa.se/publications
The authors assume sole responsibility for the con-tents of this report, which therefore cannot be cited as representing the views
of the Swedish ePa.
Impact assessment of global megatrendsTwo case studies connecting global megatrends to regional topics
This report gives an overview how global megatrends
can influence topics on resource scarcity on EU regional
and local level.
The report demonstrates in two case studies how
qualitative modelling (Causal Loop Diagrams) and
system thinking approach can be applied to analyse the
possible impact of global megatrends upon resource
scarcity in an EU perspective and how they impact the
Swedish environmental objectives on a local level.
rEport 6602
SWeDISH ePa
ISbn 978-91-620-6602-4
ISSn 0282-7298