
Redes Funcionales Cerebrales: Estructura y Deterioro
70
Complex Systems Group (URJC & CTB) Seminar at U.P.M., March 2011 Javier M. Buldú http://www.complex.etsit.urjc.es/jmbuldu Complex Systems Group Universidad Rey Juan Carlos (Fuenlabrada, Madrid, Spain) & Center for Biomedical Technology (Boadilla, Madrid, Spain) Redes Funcionales Cerebrales: Estructura y Deterioro
Transcript of Redes Funcionales Cerebrales: Estructura y Deterioro

Complex Systems Group (URJC & CTB)Seminar at U.P.M., March 2011
Javier M. Buldú
http://www.complex.etsit.urjc.es/jmbuldu
Complex Systems Group
Universidad Rey Juan Carlos (Fuenlabrada, Madrid, Spain)
&
Center for Biomedical Technology (Boadilla, Madrid, Spain)
Redes Funcionales Cerebrales:
Estructura y Deterioro

Complex Systems Group (URJC & CTB)Seminar at U.P.M., March 2011
Functional Brain Networks:
structure and impairment
Javier M. Buldú
http://www.complex.etsit.urjc.es/jmbuldu
Complex Systems Group
Universidad Rey Juan Carlos (Fuenlabrada, Madrid, Spain)
&
Center for Biomedical Technology (Boadilla, Madrid, Spain)

Complex Systems Group (URJC & CTB)Seminar at U.P.M., March 2011
Collaborators
1.- Complex Systems Group, (URJC) and Laboratory of Biological Networks (CTB), Madrid, Spain
2.- Laboratory of Cognitive and Computational Neuroscience, CTB , Madrid, Spain
3.- Centro MEG, Complutense University, Madrid, Spain
4.- CNR-Institute for Complex Systems, Florence, Italy
5.- Computational Systems Biology, Centre for Biomedical Technology, Madrid, Spain
Complex Systems Group (URJC & CTB)Seminar at U.P.M., March 2011
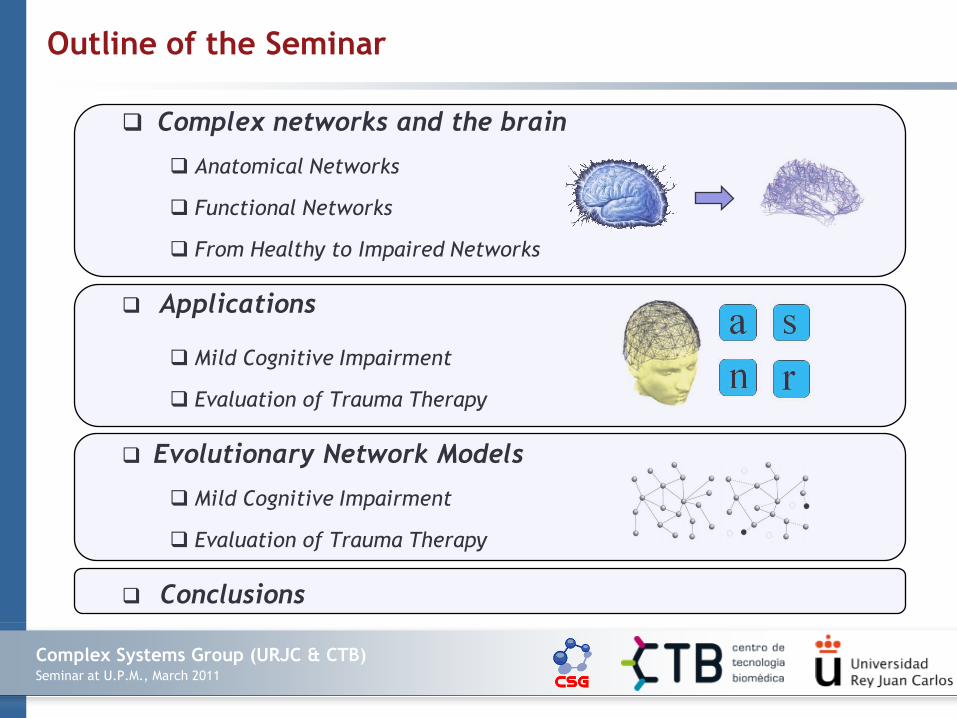
Complex networks and the brain
Anatomical Networks
Functional Networks
From Healthy to Impaired Networks
Applications
Mild Cognitive Impairment
Evaluation of Trauma Therapy
Evolutionary Network Models
Mild Cognitive Impairment
Evaluation of Trauma Therapy
Conclusions
Outline of the Seminar

Complex Systems Group (URJC & CTB)Seminar at U.P.M., March 2011
Complex Networks Analysis has been SUCCESSFULLY applied to many kinds of
different COMPLEX SYSTEMS:
Complex Networks and the Brain
From: R.V. Solé and S. Valverde,
Lecture Notes in Physics, 650, 189, 2004
Read more at:
Boccaletti et al.,
Phys. Rep., (2006)

Complex Systems Group (URJC & CTB)Seminar at U.P.M., March 2011
The brain is the most challenging complex systems that we are coping with:
Complex Networks and the Brain
Complex Systems Group (URJC & CTB)Seminar at U.P.M., March 2011
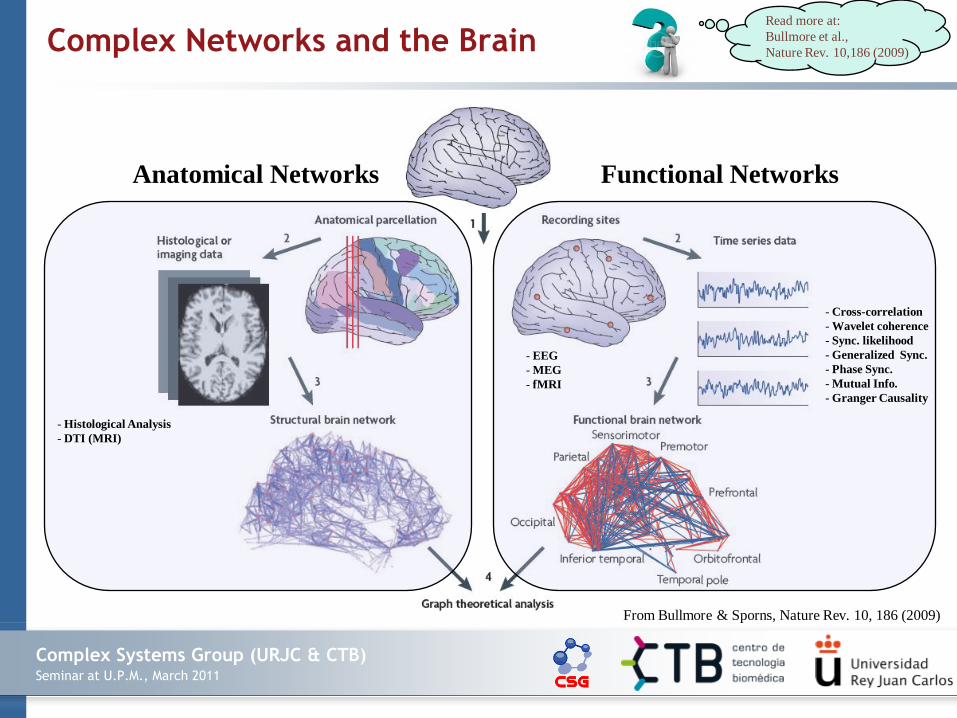
- Cross-correlation
- Wavelet coherence
- Sync. likelihood
- Generalized Sync.
- Phase Sync.
- Mutual Info.
- Granger Causality
- EEG
- MEG
- fMRI
- Histological Analysis
- DTI (MRI)
Anatomical Networks Functional Networks
From Bullmore & Sporns, Nature Rev. 10, 186 (2009)
Read more at:
Bullmore et al.,
Nature Rev. 10,186 (2009)Complex Networks and the Brain

Complex Systems Group (URJC & CTB)Seminar at U.P.M., March 2011
Anatomical Networks

Complex Systems Group (URJC & CTB)Seminar at U.P.M., March 2011
Anatomical Networks: The connectome
A connectome is a comprehensive map of neural connections in the
brain. The production and study of connectomes, known as connectomics,
may range in scale from a detailed map of the full set of neurons and
synapses of an organism to a macro scale description of the structural
connectivity between all cortical areas and subcortical structures.
Anatomical NetworksRead more at:
Sporns et al.,
PLoS Comp. Biol. 1, e42 (2005)

Complex Systems Group (URJC & CTB)Seminar at U.P.M., March 2011
Anatomical Networks:
C. Elegans: It is the only living system
that has been fully mapped. It has 302
neurons and average degree <k>≈29.
It has low shortest path and high
clustering: it is a small-world network.
Existence of network motifs.
The tail of the distribution of degrees
p(k) is power-law.
Gap juntions connections and chemical synapses of C. Elegans
neurons. From Varshney, PLoS Comp. Biol, 7, 1001066 (2011)
Anatomical Networks

Complex Systems Group (URJC & CTB)Seminar at U.P.M., March 2011
Other anatomical networks:
From Sporns et al., Neuroinformatics, 2, 145 (2004)
N=71 Brain Areas and L=746
Small-world
No power-law
N= 52 Brain Areas and L=820
Small-world
No power-law
Cat cortex: Macaque cortex:
Anatomical Networks

Complex Systems Group (URJC & CTB)Seminar at U.P.M., March 2011
The anatomical structure of Human Brain:
Hagmann et al. (2008) PLoS Biol. 6, e159
Main results are obtained
from magnetic resonanceimaging
Difussion Tensor Imaging
(DTI) and Difussion Spectrum
Imaging (DSI) allow
reconstruction of region
connectivity (white matter)
by mesuring the difussion of
water molecules.
Anatomical Networks

Complex Systems Group (URJC & CTB)Seminar at U.P.M., March 2011
The anatomical structure of Human Brain:
Hagmann et al. (2008) PLoS Biol. 6, e159
Exponential (not scale-free)
degree distribution (note that
there are 66 subregions and
998 ROIs).
Small-world attributes.
Multiple modules interlinked
by hub regions.
Positive assortativity.
Anatomical Networks

Complex Systems Group (URJC & CTB)Seminar at U.P.M., March 2011
Small-world every where!
Anatomical Networks

Complex Systems Group (URJC & CTB)Seminar at U.P.M., March 2011
Small-world every where!... so what?
One of the first contributions of the Complex Network Theory to biological
systems is the seminal paper of Watts and Strogatz
The small-world of C. Elegans neural network , with an edge joining
two neurons if they are connected by either a synapse or a gap junction
( n= 282, <k>= 14.). Table from Watts et al., 393, 440 (1998)
Anatomical Networks

Complex Systems Group (URJC & CTB)Seminar at U.P.M., March 2011
The Watts and Strogatz (WS) model:
Nevertheless, the WS model does not take into account many features of
the brain networks such as: modularity, assortativity, existence of hubs…
Anatomical Networks
Small-world region

Complex Systems Group (URJC & CTB)Seminar at U.P.M., March 2011
… in addition almost any network is small-world!
The larger the network, the higher probability to be small-world.
Figure from Barthelemy, PRL, 82,3180 (1999)
N
The rewiring of the links in
order to entre the small world-
region goes with:
p ~ 1/N
Anatomical Networks

Complex Systems Group (URJC & CTB)Seminar at U.P.M., March 2011
Are anatomical networks efficient in transmitting information?
Anatomical Networks

Complex Systems Group (URJC & CTB)Seminar at U.P.M., March 2011
Are anatomical networks efficient in transmitting information?
Macaque cortex:
C. Elegans:
real
real
optimized
optimized
Anatomical Networks

Complex Systems Group (URJC & CTB)Seminar at U.P.M., March 2011
Functional Brain Networks

Complex Systems Group (URJC & CTB)Seminar at U.P.M., March 2011
Functional brain networks
Measurement of brain activity Time series analysis Network Analysis
STEP 1 STEP 2 STEP 3
How to obtain a functional network:

Complex Systems Group (URJC & CTB)Seminar at U.P.M., March 2011
STEP 1: How to measure the brain activity
Functional MRI (fMRI). The detection of changes in regional brain activity
through their effects on blood flow and blood oxygenation (which, in turn,
affect magnetic susceptibility and tissue contrast in magnetic resonance
images). High spatial resolution (~mm3) but low temporal resolution (~ seconds).
Electroencephalography (EEG). A technique used to measure neural activity
by monitoring electrical signals from the brain, usually through scalp electrodes.
EEG has good temporal resolution but relatively poor spatial resolution.
Magnetoencephalography (MEG). A method of measuring brain activity by
detecting perturbations in the extracranial magnetic field that are generated by
the electrical activity of neuronal populations. Like EEG, it has good temporal
resolution but relatively poor spatial resolution. It has better resolution than
EEG.
Functional brain networks

Complex Systems Group (URJC & CTB)Seminar at U.P.M., March 2011
How to measure the brain activity
MEG and EEG allow the band decomposition of the signal into frequency bands
Read more at:
Basset et al.,
PNAS, 103, 19518(2006)
Corr: average correlation of the whole brain network before thresholding; τ: threshold applied to wavelet
correlation matrices; k: average degree of the network; L: average path length; C: average clustering; σ:
small-world scalar value; ζ, characteristic length scale in millimeters; S, synchronizability. (N=275)
Functional brain networks

Complex Systems Group (URJC & CTB)Seminar at U.P.M., March 2011
STEP 1: How to measure the brain activity
LIMITATIONS:
Low spatial resolution (we have ~1011 neurons)
Overlapping of measurements (not clear parcelation)
High variability in the results
Functional networks are not static
Brain is not an isolated system
Functional brain networks

Complex Systems Group (URJC & CTB)Seminar at U.P.M., March 2011
Several linear and nonlinear
techniques:
o Cross-correlation
o Wavelet coherence
o Synchronization Likelihood
o Generalized Synchronization
o Phase Synchronization
o Mutual Information
o Granger Causality
For a review read:
Pereda et al, Prog. Neurobiol, 77 (2005)
Functional brain networks
STEP 2: Time series analysis
We have to extract correlations between nodes/regions
Complex Systems Group (URJC & CTB)Seminar at U.P.M., March 2011
STEP 2: Time series analysis
LIMITATIONS:
It is difficult to evaluate causality
High variability in the results
Functional networks are not static
In EEG and MEG, we only measure cortical activity
(missing interactions)
Functional brain networks

Complex Systems Group (URJC & CTB)Seminar at U.P.M., March 2011
STEP 3: Complex Networks Analysis
We analyze the network structure and its influence in the
processes occurring in it:
For a review read:Rubinov et al., Neuroimage, 52, 1059 (2010)
Functional brain networks

Complex Systems Group (URJC & CTB)Seminar at U.P.M., March 2011
STEP 3: Complex Networks Analysis
LIMITATIONS:
Real networks are weighted and directed
High variability in the results
Functional networks are not static
In EEG and MEG, we only measure cortical activity
Functional brain networks

Complex Systems Group (URJC & CTB)Seminar at U.P.M., March 2011
Complex networks methods give useful information at 3 different levels:
Characterize the topology of brain functional networks and its influence in
the processes occurring in them:
Small-world topology -> High efficiency in information transmission.
High clustering -> Good local resilience.
Modularity -> Segregation & integration of information.
Identify differences between healthy brains and those with a certain
pathology:
Quantify evolution towards random topologies.
Evaluate the loss of modularity in the networks.
Quantify the increase of energy expenses.
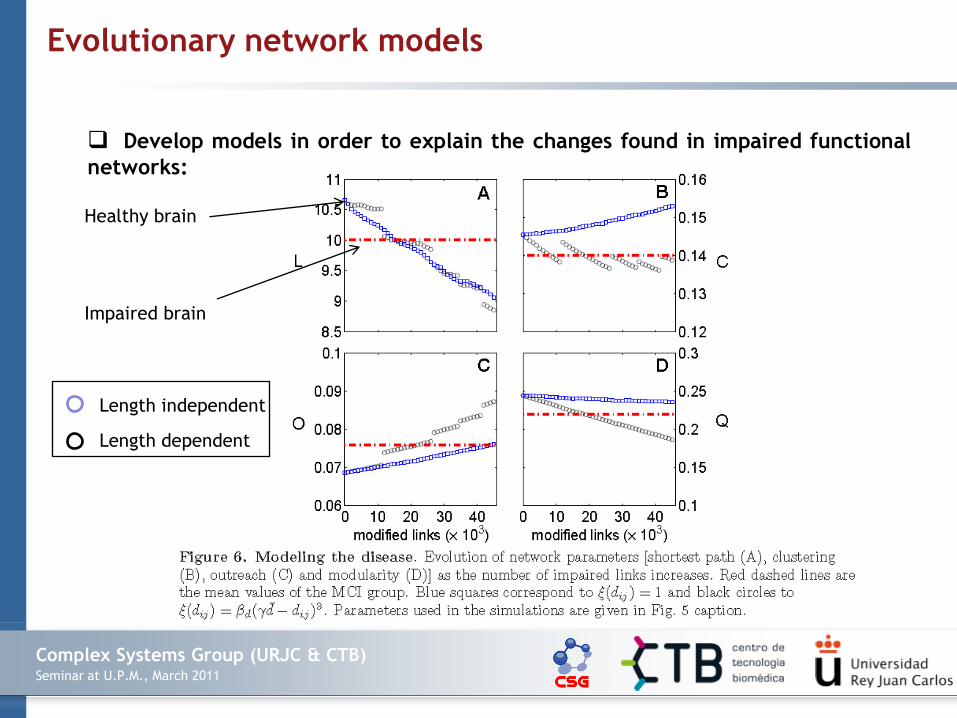
Develop models in order to explain the changes found in impaired
functional networks:
Identify what are the rules that determine the network distortion.
Functional brain networks

Complex Systems Group (URJC & CTB)Seminar at U.P.M., March 2011
What are the main characteristics of brain functional networks:
Small-world topology -> High efficiency in information transmission.
High clustering -> Good local resilience.
For a low number of nodes: power-law distribution with exponential decay
For high number of nodes: scale-free behavior
Modular networks, related with the anatomical parcelation
Assortative networks: hubs are linked together
Functional brain networks
Complex Systems Group (URJC & CTB)Seminar at U.P.M., March 2011
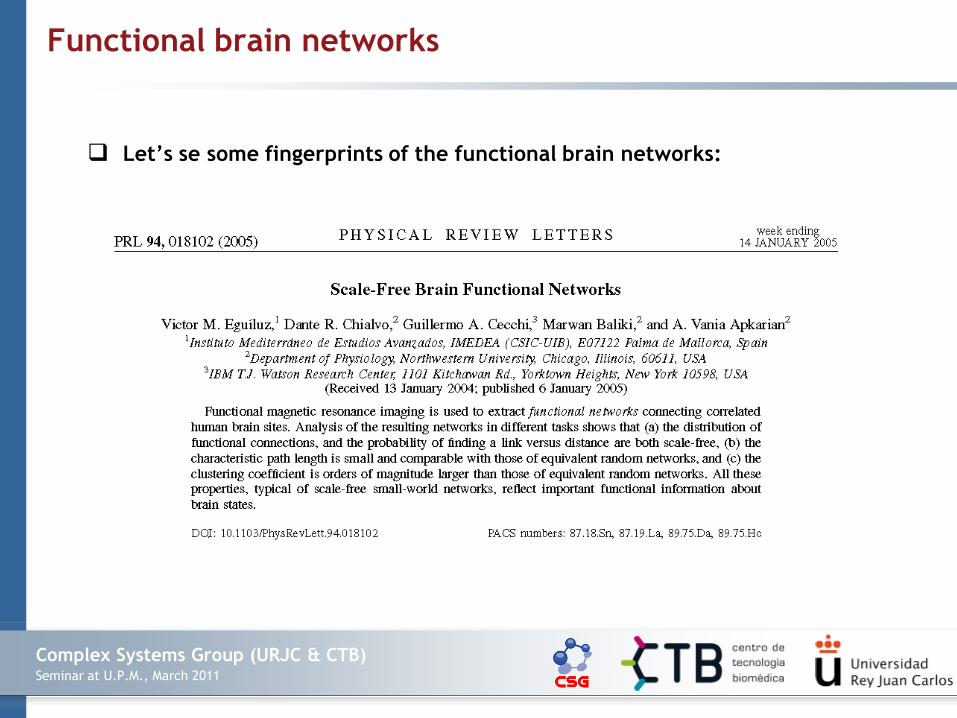
Let’s se some fingerprints of the functional brain networks:
Functional brain networks

Complex Systems Group (URJC & CTB)Seminar at U.P.M., March 2011
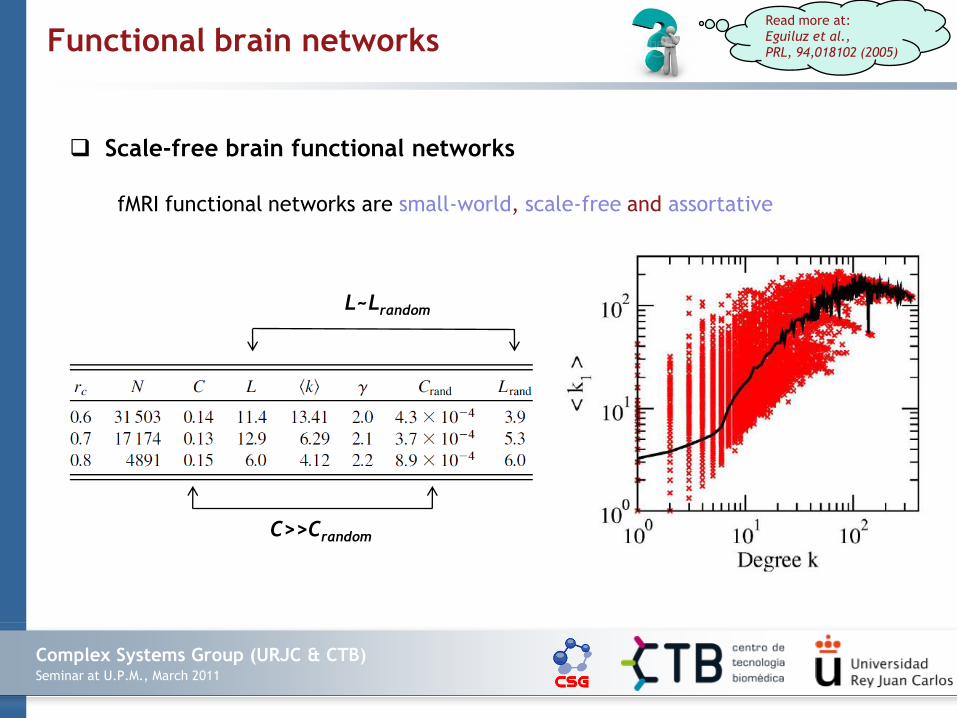
Scale-free brain functional networks
Two activities: finger tapping and listening to music
~ 400 events every 2.5 seconds (fMRI)
36 x 64 x 64 brain sites (147456 voxels)
The linear cross-correlation is measured
Several thresholds are considered in order
to obtain the adjacency matrix.
Music Finger tapping
Functional brain networks

Complex Systems Group (URJC & CTB)Seminar at U.P.M., March 2011
Scale-free brain functional networks
Finger tapping
Functional brain networks
Scale-free distribution
Complex Systems Group (URJC & CTB)Seminar at U.P.M., March 2011
Scale-free brain functional networks
fMRI functional networks are small-world, scale-free and assortative
Read more at:
Eguiluz et al.,
PRL, 94,018102 (2005)
L~Lrandom
C>>Crandom
Functional brain networks

Complex Systems Group (URJC & CTB)Seminar at U.P.M., March 2011
Defining the role of nodes with regard to the community structure
Guimerà et al., investigated the role of the nodes inside the community
Read more at:
Guimerà et al.,
Nature 433, 895 (2005)Functional brain networks

Complex Systems Group (URJC & CTB)Seminar at U.P.M., March 2011
Defining the role of nodes with regard to the community structure
It is possible to evaluate the functionality of t he nodes from the topological properties:
Within-module connectivity:
Participation coefficient:
(Figures from R. Guimerà et al., Nature 433, 895 2005)
Functional brain networks

Complex Systems Group (URJC & CTB)Seminar at U.P.M., March 2011
Community analysis gives information about the network characteristics and
the role played by nodes (specially hubs).
Functional brain networks

Complex Systems Group (URJC & CTB)Seminar at U.P.M., March 2011
Community analysis gives information about the network characteristics and
the role played by nodes (specially hubs).
Functional brain networks

Complex Systems Group (URJC & CTB)Seminar at U.P.M., March 2011
Community analysis gives information about the network characteristics and
the role played by nodes (specially hubs).
Functional brain networks

Complex Systems Group (URJC & CTB)Seminar at U.P.M., March 2011
From Healthy to Impaired Networks

Complex Systems Group (URJC & CTB)Seminar at U.P.M., March 2011
Complex networks methods give useful information at 3 different levels:
Characterize the topology of brain functional networks and its influence in
the processes occurring in them:
Small-world topology -> High efficiency in information transmission.
High clustering -> Good local resilience.
Modularity -> Segregation & integration of information.
Identify differences between healthy brains and those with a certain
pathology:
Quantify evolution towards random topologies.
Evaluate the loss of modularity in the networks.
Quantify the increase of energy expenses.
Develop models in order to explain the changes found in impaired
functional networks:
Identify what are the rules that determine the network distortion.
From healthy to impaired networks

Complex Systems Group (URJC & CTB)Seminar at U.P.M., March 2011
Complex Network analyses of brain diseases
Alzheimer.
The overall synchronization of the network is decreased.
The average path length increases (probably as a consequence of the reduction of the
synchronization).
The clustering coefficient is significantly reduced (the network evolves to random
topologies).
Mild Cognitive Impairment.
The average synchronization increases.
Network outreach increases as a consequence of an unbalanced increase of the
synchronization in the long-range connections.
The network becomes more random.
From healthy to impaired networks

Complex Systems Group (URJC & CTB)Seminar at U.P.M., March 2011
Complex Network analyses of brain diseases
Schizophrenia.
The small-world properties of the network are impaired (specially at low-frequency
bands).
Clustering and average path length are shifted to random configurations.
The hierarchical configuration of the network is also affected.
Epilepsia.
Synchronization increases during the epileptic episodes.
As a consequence, clustering coefficient increases and average path length decreases.
Changes are more significant at delta, theta and alpha bands.
Read more at:
Stam et al.,
NBP, 1, 3 (2007)From healthy to impaired networks

Complex Systems Group (URJC & CTB)Seminar at U.P.M., March 2011
Applications
Mild Cognitive Impairment and Traumatic Brain Injury

Complex Systems Group (URJC & CTB)Seminar at U.P.M., March 2011
We have information of the brain
as a whole and not only of its
isolated components.
We can relate the information
contained in the topology with the
dynamical processes occurring in it.
We can try to identify
differences between healthy and
impaired brains in order to
understand and prevent different
brain diseases.
Applications: Mild Cognitive Impairment
We are projecting the activity of
billions of neurons into a few nodes.
The activity at each position is
strongly influenced by its neighbors.
Experiments are expensive and it
is difficult to find volunteers.
There exists a great variability of
the recorded activity between
individuals (and even in the same
individual).
Anatomical and, specially,
functional networks are not static.
CAUTION! High risk of GIGO
(Garbage In, Garbage Out)
GOOD NEWS
Possibility of clinical applications
Advantages Drawbacks

Complex Systems Group (URJC & CTB)Seminar at U.P.M., March 2011
A brain disorder in which thinking abilities are mildly
impaired. Individuals with MCI are able to function in
everyday activities but have difficulty with memory, trouble
remembering the names of people they met recently, the flow
of a conversation, and a tendency to misplace things. Every
year, around 10% of MCI patients develop Alzheimer.
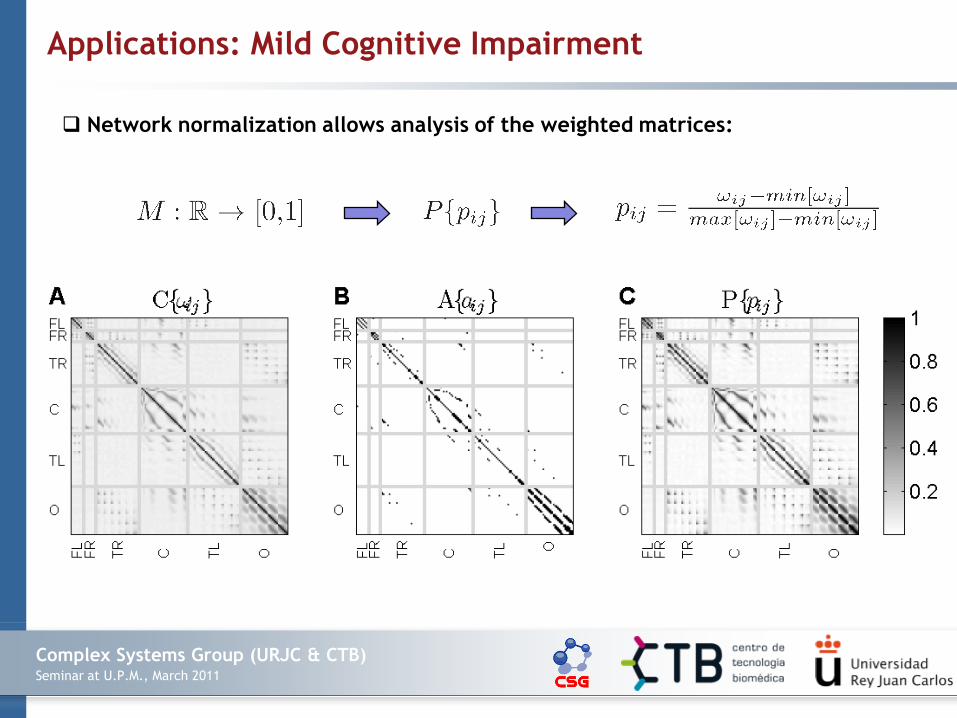
We performed magnetoencephalograms (MEG) to a group of 19 MCI's patients and 19
control subjects during a memory task. By means of the synchronization likelihood (SL) we
quantified the interaction between the 148 channels of the MEG system and we obtained
a weighted connectivity matrix between cortical areas.
What is Mild Cognitive Impairment (MCI)?
The experiment
Applications: Mild Cognitive Impairment
Complex Systems Group (URJC & CTB)Seminar at U.P.M., March 2011
Network normalization allows analysis of the weighted matrices:
Applications: Mild Cognitive Impairment

Complex Systems Group (URJC & CTB)Seminar at U.P.M., March 2011
Topological anaylisis of the functional networks of both groups (Control and MCI):
Applications: Mild Cognitive Impairment
Complex Systems Group (URJC & CTB)Seminar at U.P.M., March 2011
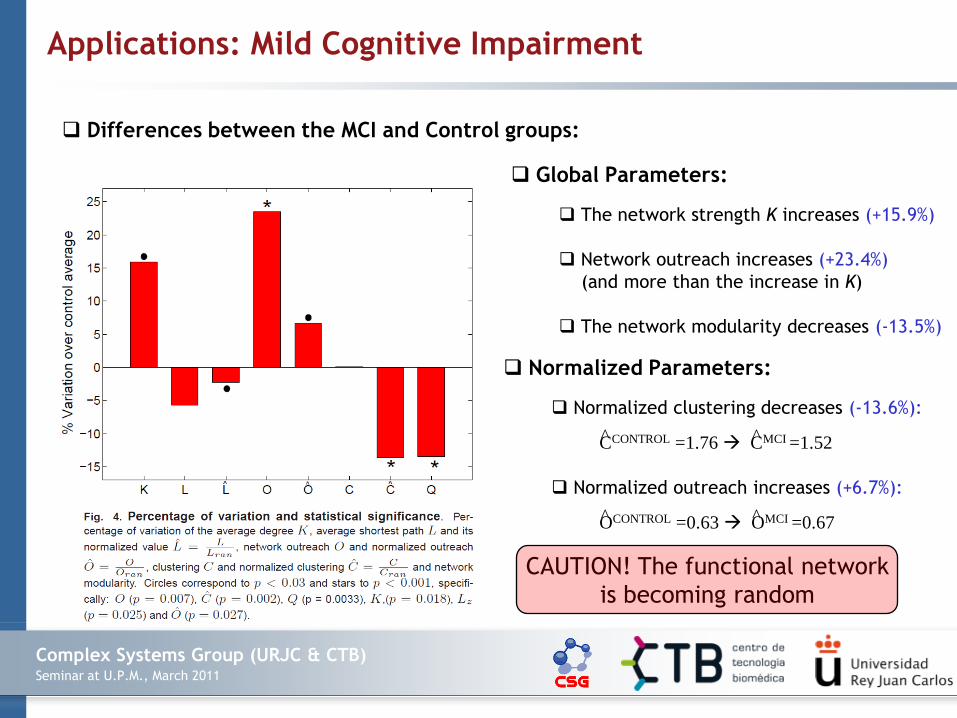
Differences between the MCI and Control groups:
Global Parameters:
The network strength K increases (+15.9%)
Network outreach increases (+23.4%)
(and more than the increase in K)
The network modularity decreases (-13.5%)
Normalized Parameters:
Normalized clustering decreases (-13.6%):
CCONTROL =1.76 CMCI =1.52
Normalized outreach increases (+6.7%):
OCONTROL =0.63 OMCI =0.67
CAUTION! The functional network
is becoming random
^ ^
^ ^
Applications: Mild Cognitive Impairment

Complex Systems Group (URJC & CTB)Seminar at U.P.M., March 2011
Differences between the MCI and Control groups at the INTER-LOBE connections:
Intra-lobe synchronization:
The intra-lobe synchronization increases
The inter-lobe synchronization increases
(more than the intra-lobe sync.)
Modularity decreases
CAUTION! The segregated operation
of the brain is decreasingIn
-strength
Out-stre
ngth
Modula
rity
Applications: Mild Cognitive Impairment

Complex Systems Group (URJC & CTB)Seminar at U.P.M., March 2011
Degree, clustering, outreach
and knn distributions:
MCI networks have nodes with
higher connectivity.
The clustering increases with the
degree (in both Control and MCI).
For the same degree, outreach is
higher at the MCI group.
Networks are assortative
Applications: Mild Cognitive Impairment

Complex Systems Group (URJC & CTB)Seminar at U.P.M., March 2011
From macroscopic (network) to microscopic (node) analysis:
Within module degree: Participation coefficient:
Applications: Mild Cognitive Impairment

Complex Systems Group (URJC & CTB)Seminar at U.P.M., March 2011
From macroscopic (network) to microscopic (node) analysis:
Nodes increase their participation
Applications: Mild Cognitive Impairment
Complex Systems Group (URJC & CTB)Seminar at U.P.M., March 2011
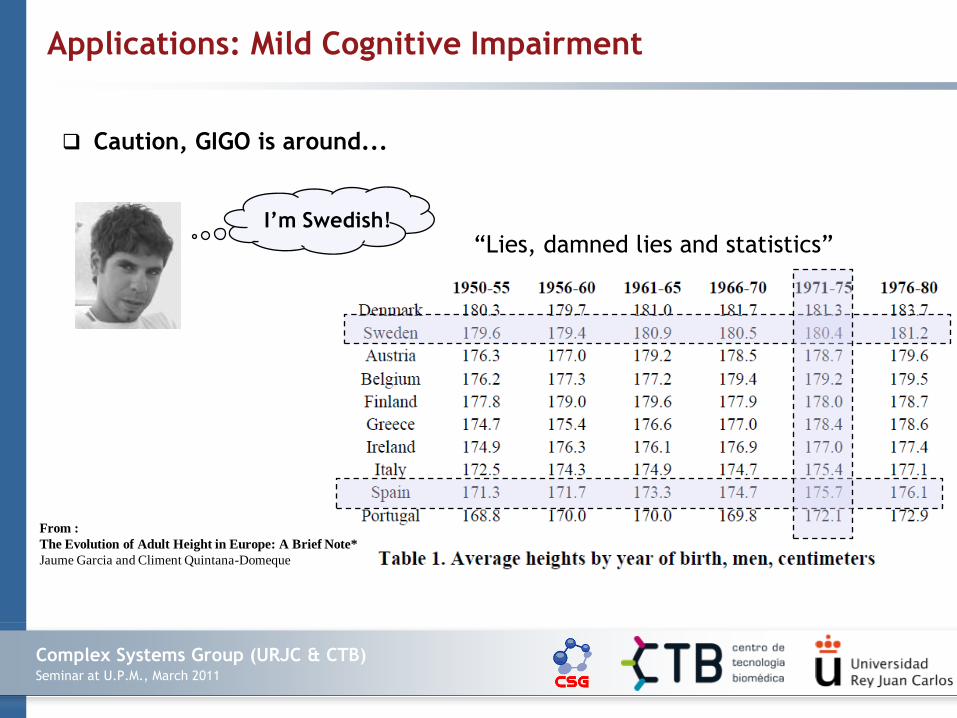
Caution, GIGO is around...
“Lies, damned lies and statistics”
From :
The Evolution of Adult Height in Europe: A Brief Note*
Jaume Garcia and Climent Quintana-Domeque
I’m Swedish!
Applications: Mild Cognitive Impairment

Complex Systems Group (URJC & CTB)Seminar at U.P.M., March 2011
Caution, GIGO is around...
MCI diagnostic must be done by analysing longitudinal recordings
Applications: Mild Cognitive Impairment

Complex Systems Group (URJC & CTB)Seminar at U.P.M., March 2011
Some conclusions
?
Randomness
Netw
ork
str
ength
Control
Alzheimer
M.C.I.
We need longitudinal
experiments in order
to understand the
emergence of MCI
The evolution of MCI to
Alzheimer is still unknown
… despite there are some
clues
High Synchronization
Low clustering
Higher outreach
Low modularity
Higher Rnadomness
Low Synchronization
Low clustering
Higher Randomness
Applications: Mild Cognitive Impairment

Complex Systems Group (URJC & CTB)Seminar at U.P.M., March 2011
A good candidate: Trauma recovering therapy
Accident Head Trauma Cognitive Therapy
MEG recording
(after the accident)
MEG recording
(9-14 months of therapy)
Comparison
of both networks
Applications: Traumatic Brain Injury (TBI)

Complex Systems Group (URJC & CTB)Seminar at U.P.M., March 2011
A good candidate: Trauma recovering therapy
Band δ [1-4 Hz]
Band α [8-13 Hz]
Network changes:
The alfa band is overconnected
The delta band is underconnected
The cognitive therapy shifts network
parameters towards control values
Applications: Traumatic Brain Injury (TBI)
Complex Systems Group (URJC & CTB)Seminar at U.P.M., March 2011
Evolutionary Network Models
Mild Cognitive Impairment and Traumatic Brain Injury

Complex Systems Group (URJC & CTB)Seminar at U.P.M., March 2011
Complex networks methods give useful information at 3 different levels:
Characterize the topology of brain functional networks and its influence in
the processes occurring in them:
Small-world topology -> High efficiency in information transmission.
High clustering -> Good local resilience.
Modularity -> Segregation & integration of information.
Identify differences between healthy brains and those with a certain
pathology:
Quantify evolution towards random topologies.
Evaluate the loss of modularity in the networks.
Quantify the increase of energy expenses.
Develop models in order to explain the changes found in impaired
functional networks:
Identify what are the rules that determine the network distortion.
Evolutionary network models

Complex Systems Group (URJC & CTB)Seminar at U.P.M., March 2011
Two specific applications of network modeling:
Mild Cognitive Impairment
Traumatic Brain Injury
Evolutionary network models

Complex Systems Group (URJC & CTB)Seminar at U.P.M., March 2011
Mild Cognitive Impairment: Real data versus evolutionary models
Real data
Models
Evolutionary network models

Complex Systems Group (URJC & CTB)Seminar at U.P.M., March 2011
Develop models in order to explain the changes found in impaired functional
networks:
1) We select a link randomly.
2) We change the weight of the link according to a certain function:
w'ij=wij [1+λ+η] ξ(dij)
3) We normalize and recalculate the network parameters.
4) We go back to step 1.w'ij= modified link weight
wij = previous link weight
λ=degradation rate (λ >0)
η= noise term
ξ(dij)= length dependence function
dij= link length
Evolutionary network models
Complex Systems Group (URJC & CTB)Seminar at U.P.M., March 2011
Develop models in order to explain the changes found in impaired functional
networks:
Healthy brain
Impaired brain
Length dependent
Length independent
Evolutionary network models
Complex Systems Group (URJC & CTB)Seminar at U.P.M., March 2011
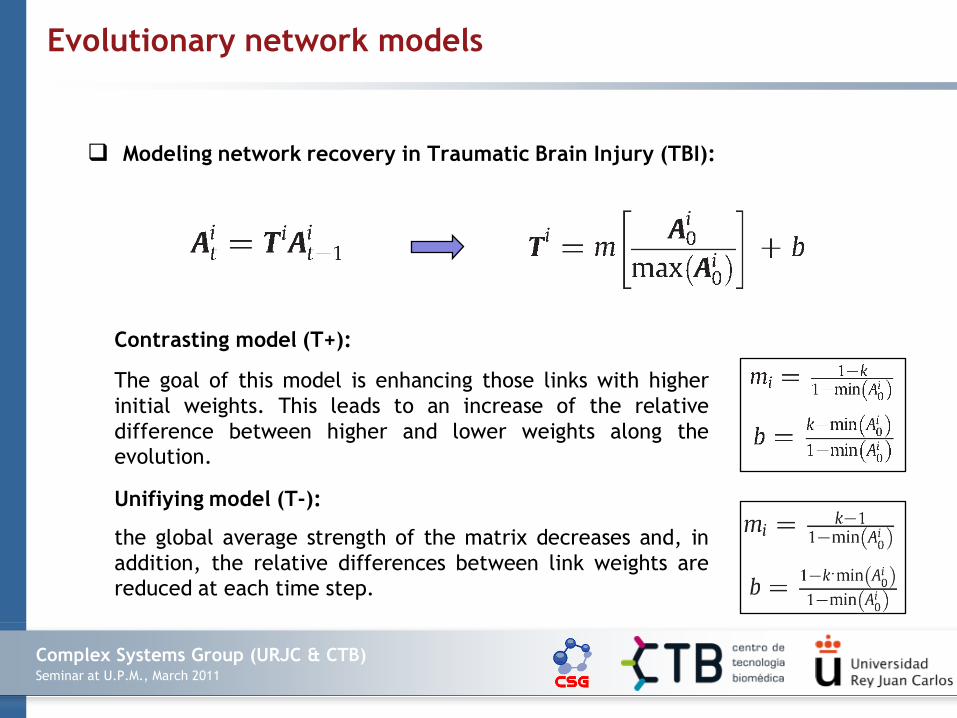
The goal of this model is enhancing those links with higher
initial weights. This leads to an increase of the relative
difference between higher and lower weights along theevolution.
Modeling network recovery in Traumatic Brain Injury (TBI):
Contrasting model (T+):
Unifiying model (T-):
the global average strength of the matrix decreases and, in
addition, the relative differences between link weights are
reduced at each time step.
Evolutionary network models

Complex Systems Group (URJC & CTB)Seminar at U.P.M., March 2011
Post (after therapy) *Pre (before therapy) Control (healthy subject)
Contrasting model
Unifying model
Evolutionary network models

Complex Systems Group (URJC & CTB)Seminar at U.P.M., March 2011
Post (after therapy) *Pre (before therapy) Control (healthy subject)
Contrasting model
Unifiying model
Alpha band
Evolutionary network models

Complex Systems Group (URJC & CTB)Seminar at U.P.M., March 2011
Complex networks methods give useful information (from another
perspective) about how functional brain networks behave.
Network parameters give hints about how brain functional connectivity is
affected by different diseases. They can be use in order to distinguish between
healthy and damaged brains.
We can develop evolutionary network models that mimic the
evolution/recovery of different diseases.
We have to be cautious since there is a high variability in the results.
Its application to the early detection of brain diseases is still missing.
Longitudinal experiments would help in order to understand the evolution of
brain impairments and its early detection.
Conclusions

Complex Systems Group (URJC & CTB)Seminar at U.P.M., March 2011
Thanks for your attention!
More information at:
http://complex.etsit.urjc.es
or


![[PPT]EVALUACION NEUROPSICOLOGICA - Instituto … · Web view1973 Luria: fundador de la neuropsicología. Describe componentes cerebrales y funcionales, y determina lesiones en función](https://static.fdocuments.in/doc/165x107/5bd69e2809d3f2fc548baab3/pptevaluacion-neuropsicologica-instituto-web-view1973-luria-fundador-de.jpg)
![Tumors Cerebrales[1]](https://static.fdocuments.in/doc/165x107/563db787550346aa9a8be431/tumors-cerebrales1.jpg)