Recovery of a temperate riverine fish assemblage from a ...
16
Recovery of a temperate riverine fish assemblage from a major diesel oil spill KEVIN M. KUBACH*, MARK C. SCOTT* AND JAMES S. BULAK † *South Carolina Department of Natural Resources, Clemson, SC, U.S.A. † South Carolina Department of Natural Resources, Eastover, SC, U.S.A. SUMMARY 1. Biological resilience is of heightened concern in increasingly anthropogenic landscapes. Quantification of faunal resilience across a wide range of spatial scales and geographical areas is necessary to understand factors influencing the rate and degree of recovery, especially in fragmented ecosystems. 2. We evaluated the recovery of a riverine fish assemblage from a major diesel oil pipeline spill and associated fish kill in 37 km of the Reedy River, South Carolina, U.S.A. The fish assemblage was monitored at four disturbed sites within the fish kill zone and one upstream, undisturbed reference site over a 112-month (9.3-year) period following the disturbance. We used non-metric multidimensional scaling (NMS) ordination to evaluate change in fish assemblage structure among sites and to determine the degree of recovery in assemblage structure. 3. NMS ordination of species relative abundance in two dimensions represented 93% of the total variation in fish assemblage structure among samples and illustrated recovery of the fish assemblage. Initial dissimilarity in assemblage structure was evident between the disturbed sites and the reference site, reflecting high mortality from the oil spill. The disturbed sites as a group increased in similarity to the reference assemblage with time, while the reference assemblage remained relatively stable. Strongest similarity in assemblage structure between the disturbed group and the reference group was achieved by October 2000 (52 months post-disturbance), indicating recovery from the oil spill. Remaining variation in assemblage structure was consistent with longitudinal site position and comparable to that of an undisturbed reference river, attributable to inherent longitudinal variation along the 37-kilometre river section. 4. Recovery rate among sites varied in relation to proximity and connectivity to recolonisation sources on a landscape scale. Recovery of the uppermost disturbed site was faster than the other disturbed sites because of its proximity to the undisturbed main stem fish assemblage, whereas the three most downstream sites were slower to recover largely because of isolation by anthropogenic barriers. These observations illustrate the influence of fragmentation on fish assemblage resilience at large spatial scales. Keywords: colonisation, disturbance, fragmentation, resilience, streams Correspondence: Kevin M. Kubach, South Carolina Department of Natural Resources, 311 Natural Resources Drive, Clemson, 29631-3253 SC, U.S.A. E-mail: [email protected] Freshwater Biology (2011) 56, 503–518 doi:10.1111/j.1365-2427.2010.02517.x Ó 2010 Blackwell Publishing Ltd 503
Transcript of Recovery of a temperate riverine fish assemblage from a ...

Recovery of a temperate riverine fish assemblage from amajor diesel oil spill
KEVIN M. KUBACH*, MARK C. SCOTT* AND JAMES S. BULAK †
*South Carolina Department of Natural Resources, Clemson, SC, U.S.A.†South Carolina Department of Natural Resources, Eastover, SC, U.S.A.
SUMMARY
1. Biological resilience is of heightened concern in increasingly anthropogenic landscapes.
Quantification of faunal resilience across a wide range of spatial scales and geographical
areas is necessary to understand factors influencing the rate and degree of recovery,
especially in fragmented ecosystems.
2. We evaluated the recovery of a riverine fish assemblage from a major diesel oil pipeline
spill and associated fish kill in 37 km of the Reedy River, South Carolina, U.S.A. The fish
assemblage was monitored at four disturbed sites within the fish kill zone and one
upstream, undisturbed reference site over a 112-month (9.3-year) period following the
disturbance. We used non-metric multidimensional scaling (NMS) ordination to evaluate
change in fish assemblage structure among sites and to determine the degree of recovery in
assemblage structure.
3. NMS ordination of species relative abundance in two dimensions represented 93% of
the total variation in fish assemblage structure among samples and illustrated recovery of
the fish assemblage. Initial dissimilarity in assemblage structure was evident between the
disturbed sites and the reference site, reflecting high mortality from the oil spill. The
disturbed sites as a group increased in similarity to the reference assemblage with time,
while the reference assemblage remained relatively stable. Strongest similarity in
assemblage structure between the disturbed group and the reference group was achieved
by October 2000 (52 months post-disturbance), indicating recovery from the oil spill.
Remaining variation in assemblage structure was consistent with longitudinal site position
and comparable to that of an undisturbed reference river, attributable to inherent
longitudinal variation along the 37-kilometre river section.
4. Recovery rate among sites varied in relation to proximity and connectivity to
recolonisation sources on a landscape scale. Recovery of the uppermost disturbed site
was faster than the other disturbed sites because of its proximity to the undisturbed
main stem fish assemblage, whereas the three most downstream sites were slower to
recover largely because of isolation by anthropogenic barriers. These observations
illustrate the influence of fragmentation on fish assemblage resilience at large spatial
scales.
Keywords: colonisation, disturbance, fragmentation, resilience, streams
Correspondence: Kevin M. Kubach, South Carolina Department of Natural Resources, 311 Natural Resources Drive, Clemson,
29631-3253 SC, U.S.A. E-mail: [email protected]
Freshwater Biology (2011) 56, 503–518 doi:10.1111/j.1365-2427.2010.02517.x
� 2010 Blackwell Publishing Ltd 503

Introduction
The recovery of aquatic biota from anthropogenic
disturbance is a fundamental concern of ecological
risk assessment and conservation in freshwaters
(Baker, 1995; Leuven & Poudevigne, 2002).
Disturbances to aquatic ecosystems can be broadly
categorised according to temporal and physical
characteristics, ranging from discrete, ‘pulse’ events
(e.g. floods, pollutant spills) to long-term, ‘press’
disturbances with changes to the catchment or stream
channel (e.g. channelisation, sedimentation; Bender,
Case & Gilpin, 1984; Niemi et al., 1990). Chronic,
widespread anthropogenic disturbances such as hab-
itat alteration clearly represent the overarching threat
to aquatic biodiversity (Allan & Flecker, 1993; Scott,
2006; Jelks et al., 2008). However, discrete disturbance
events may also cause prolonged impacts on aquatic
species and assemblages at local scales (Niemi et al.,
1990; e.g. Ensign et al., 1997; Albanese, Angermeier &
Peterson, 2009), contributing to overall decline espe-
cially in altered landscapes and in range-restricted
species. Resilience in aquatic assemblages is largely a
function of adaptation to environmental variability
(Resh et al., 1988; Schlosser, 1990), yet anthropogenic
factors may disrupt the natural zoogeographic mech-
anisms by which recovery occurs (Poff & Ward, 1990).
Fish assemblages in smaller stream reaches have
shown rapid recovery in assemblage structure from
pulse disturbances in a wide range of settings,
including the southern Atlantic coastal plain (Meffe
& Sheldon, 1990; Sheldon & Meffe, 1995), midwestern
interior valleys (Peterson & Bayley, 1993), Ouachita
Mountains (Lonzarich, Warren & Lonzarich, 1998)
and southern Appalachians (Albanese et al., 2009). In
these cases, recovery to a similar pre-disturbance
assemblage structure occurred within days to months
of experimental removal from reaches spanning 4–
426 m. At the assemblage level, recovery of fishes in
short, contiguous stream reaches may reflect near-
maximal rates of recolonisation (Sheldon & Meffe,
1995), contrary to the conditions under which many
anthropogenic disturbances are likely to occur. Frag-
mentation of aquatic ecosystems, by both habitat
degradation and erection of physical barriers to
movement, can reduce recolonisation rates of aquatic
organisms following disturbance (Niemi et al., 1990;
Pringle, 2003). Furthermore, the cumulative influence
of repeated or underlying press disturbances can
prolong or prevent the recovery of fishes from discrete
events (Niemi et al., 1990; Detenbeck et al., 1992).
Because many stream fish populations fulfil life
history processes and use refugia at scales of 1–
100 km (Schlosser, 1991; Fausch et al., 2002; Magoulick
& Kobza, 2003), connectivity may be particularly
important in facilitating recovery from disturbances of
this extent.
At larger scales, fishes can recolonise extensive
areas following natural disturbances including floods
(e.g. Matthews, 1986; Roghair & Dolloff, 2005) and
drought (Larimore, Childers & Heckrotte, 1959; Mat-
thews & Marsh-Matthews, 2003; Adams & Warren,
2005). Similar observations have accompanied large-
scale anthropogenic events, provided fishes have
access to the disturbed areas. Fish species richness
had largely recovered within about 3 months of a 1.6-
km pesticide-induced complete fish kill in a diverse
Arkansas stream (Olmsted & Cloutman, 1974). No
differences were found in fish abundance, species
richness and Index of Biotic Integrity scores between
fish kill and reference sites 7.7 months after a manure
spill in 22.3 km of a large Missouri stream (Meade,
2004). Recolonisation in these cases occurred rapidly;
however, more time may be required for assemblage
structure to recover if the anthropogenic disturbance
is extensive or occurs in fragmented systems (Niemi
et al., 1990; Detenbeck et al., 1992; e.g. Ensign et al.,
1997).
In one of the largest inland oil spills in United States
history, a petroleum pipeline ruptured and released
22 800 barrels (3 624 910 L) of No. 2 fuel oil (diesel
fuel) into the Reedy River near Fork Shoals, South
Carolina, on 26 June 1996. Early July 1996 surveys
confirmed near-complete fish and macroinvertebrate
extirpation for 37 km downstream to the headwaters
of Boyd Mill Pond, a 74-ha impoundment on the
Reedy River (Rankin, Geddings & Hayes, 1996;
Glover, 1996; Fig. 1). About 94% of the oil was
recovered within 12 days of the incident with the
remainder primarily infiltrating the ground water
near the spill site (National Transportation Safety
Board, 1998). Therefore, the event represented a pulse
disturbance in that structural habitat was not altered
and the stressor was relatively short-lived.
The Reedy River oil spill provided an opportunity
to assess fish assemblage recovery from a severe and
extensive anthropogenic disturbance. Our aim here is
to evaluate change in the Reedy River fish assemblage
504 K. M. Kubach et al.
� 2010 Blackwell Publishing Ltd, Freshwater Biology, 56, 503–518

following the disturbance and to estimate the rate of
recovery in fish assemblage structure within the
disturbed section.
Methods
Study system
The Reedy River drains a narrow catchment of about
651 km2 within the Southern Inner and Outer Pied-
mont ecoregions of the upper Santee River basin in
northwestern South Carolina (Griffith et al., 2002;
Fig. 1). Land cover within the Reedy River catchment
is about 42% forest, 28% urban, 18% agriculture, 8%
grassland ⁄shrubland and 3% wetland (Homer et al.,
2004), ranging from widespread urban land use in the
upper catchment to moderately forested and agricul-
tural land in the lower catchment. The lower Reedy
River supports at least 33 fish species (two intro-
duced), predominantly cyprinids, centrarchids and
ictalurids (Table 1). Drainage area to the oil spill site is
269 km2 with a mean annual discharge of about
6.4 m3 s)1 (base flow 4.7 m3 s)1; USGS Fork Shoals
gauge station 02164110).
By all indications, the 1996 oil spill caused a near-
complete fish kill in the Reedy River main stem from
the spill site downstream to Boyd Mill Pond (Fig. 1;
Rankin et al., 1996). For the purpose of measuring
assemblage recovery, it was assumed that all points
began the recovery process from the same original
level of disturbance. Unfortunately, the hazardous
nature of the oil spill and rapid decomposition of fish
prevented collection and identification of many of the
dead fishes, particularly smaller species. Therefore,
these fish kill data could not be used to quantify pre-
disturbance fish assemblage structure.
Fig. 1 Location of the Reedy River catch-
ment and the reference (REF) and dis-
turbed (A–D) study sites in relation to the
oil spill origin.
Fish assemblage recovery 505
� 2010 Blackwell Publishing Ltd, Freshwater Biology, 56, 503–518

Although the disturbed reach was open to the
adjacent upstream undisturbed river section, two
major barriers existed within the fish kill reach. Cedar
Falls Dam is located about 7 km downstream of the
oil spill origin (Fig. 1). This former mill dam
(height = 4.6 m) represented a physical and behavio-
ural barrier to fish movement, although some
downstream drift of ichthyoplankton was possible.
In addition to Cedar Falls Dam, Boyd Mill Pond and
dam marked the downstream end of the fish kill and
represented a barrier to fish movement between the
downstream, undisturbed section of the Reedy River
main stem and the fish kill section (Fig. 1). Thus, the
fish kill section essentially consisted of a 7-km upper
Table 1 Fish species collected from the Reedy River study sites (August 1996–October 2005) and earliest date of collection in the
disturbed river section (sites in parentheses) following the 26 June 1996 oil spill
Scientific name Common name Earliest collection
Kendall’s tau
Axis 1 Axis 2
Cyprinidae
Cyprinella chloristia (Jordan & Brayton) Greenfin shiner October 1996 (D) 0.016 )0.249
Cyprinella nivea (Cope) Whitefin shiner August 1996 (D)
Cyprinus carpio Linnaeus Common carp August 1996 (B)
Hybopsis rubrifrons (Jordan) Rosyface chub 2005 (B)
Nocomis leptocephalus (Girard) Bluehead chub August 1996 (BC) )0.496 0.466
Notemigonus crysoleucas (Mitchill) Golden shiner October 1996 (A) )0.131 0.174
Notropis hudsonius (Clinton) Spottail shiner October 1996 (CD) )0.282 )0.188
Notropis lutipinnis (Jordan & Brayton) Yellowfin shiner October 1996 (ABD) )0.205 0.185
Notropis scepticus (Jordan & Gilbert) Sandbar shiner 2000 (D)
Centrarchidae
Centrarchus macropterus (Lacepede) Flier August 1996 (D) 0.269 0.021
Lepomis auritus (Linnaeus) Redbreast sunfish August 1996 (CD) )0.483 )0.163
Lepomis cyanellus Rafinesque Green sunfish August 1996 (B) 0.068 )0.038
Lepomis gibbosus (Linnaeus) Pumpkinseed August 1996 (D) 0.495 )0.394
Lepomis gulosus (Cuvier) Warmouth August 1996 (C) 0.172 )0.135
Lepomis macrochirus Rafinesque Bluegill August 1996 (BCD) 0.936 )0.163
Lepomis microlophus (Gunther) Redear sunfish 1997 (ABD) 0.070 )0.305
Micropterus salmoides (Lacepede) Largemouth bass August 1996 (CD) )0.296 0.192
Pomoxis nigromaculatus (Lesueur) Black crappie 1997 (BC) )0.016 )0.165
Ictaluridae
Ameiurus brunneus Jordan Snail bullhead October 1996 (A) )0.041 )0.421
Ameiurus catus (Linnaeus) White catfish October 1996 (AD) )0.029 )0.044
Ameiurus natalis (Lesueur) Yellow bullhead October 1996 (A) )0.372 0.305
Ameiurus nebulosus (Lesueur) Brown bullhead 1997 (B)
Ameiurus platycephalus (Girard) Flat bullhead August 1996 (CD) )0.655 0.408
Ictalurus punctatus (Rafinesque) Channel catfish August 1996 (CD) 0.221 )0.544
Noturus insignis (Richardson) Margined madtom 1997 (D) 0.154 )0.289
Catostomidae
Catostomus commersoni (Lacepede) White sucker 2005 (A)
Erimyzon oblongus (Mitchill) Creek chubsucker August 1996 (C)
Hypentelium nigricans (Lesueur) Northern hogsucker August 1996 (D) )0.384 )0.038
Moxostoma rupiscartes (Jordan & Jenkins) Striped jumprock 1998 (B)
Poeciliidae
Gambusia holbrooki Girard Eastern mosquitofish August 1996 (C)
Percidae
Etheostoma thalassinum (Jordan & Brayton) Seagreen darter 2005 (D)
Clupeidae
Dorosoma cepedianum (Lesueur) Gizzard shad August 1996 (D) 0.398 )0.277
Esocidae
Esox americanus Gmelin Redfin pickerel October 1996 (C)
Site A was not sampled in August 1996. Correlation coefficients (Kendall’s tau) for ordination axes are provided for species included in
non-metric multidimensional scaling (see Fig. 3). Scientific names follow Rohde et al. (2009).
506 K. M. Kubach et al.
� 2010 Blackwell Publishing Ltd, Freshwater Biology, 56, 503–518

reach open to upstream colonists and a 30-km down-
stream reach isolated from main stem colonists by two
dams (Fig. 1). The fish kill assessment indicated that
fish mortality in Boyd Mill Pond was primarily in the
headwater region of the reservoir and surviving fishes
were mainly lentic species including centrarchids and
Dorosoma cepedianum.
At least 15 tributaries ranging from <4 to 92 km2 in
catchment area enter the Reedy River within or near
the fish kill section. Although tributaries were not
sampled during the initial recovery period, samples
taken in 2004–2005 from the five primary tributaries of
this section showed fish assemblages of 10–18 species
dominated by Nocomis leptocephalus, Notropis lutipin-
nis, Lepomis macrochirus, Lepomis auritus and Hypente-
lium nigricans, in order of average relative abundance.
Sampling design
Following the June 1996 fish kill, a longitudinal
sampling design was initiated to evaluate the fish
assemblage in the disturbed section. Given logistical
constraints in available personnel and the urgency to
document conditions as soon as possible after the spill,
sample sites were selected based on accessibility and
to maximise coverage of the disturbed section. In the
absence of pre-disturbance fish assemblage data, one
site 5.4 km upstream of the spill origin was selected to
represent undisturbed assemblage conditions in the
context of the oil spill and is hereafter referred to as the
‘reference’ site (Fig. 1). Four sites located 1.8, 14.2, 20.6,
and 29.5 km downstream of the spill and within the
37-km fish kill zone were selected as ‘disturbed’ sites
and are hereafter termed A, B, C and D, respectively
(Fig. 1). Elevation ranged from 171 to 225 m over the
34.9-km span of the five study sites (0.15% slope). The
study section consisted predominantly of sand ⁄gravel
runs and pools with scattered large woody debris and
occasional boulder ⁄bedrock shoals. Wetted width
among sample sites averaged 16.3 m (range 12.8–
17.7) under low-flow conditions.
Because of safety restrictions and clean-up efforts
following the spill, access to the study section was not
permitted until August 1996. Each site was sampled
once in August 1996 and during low annual flows in
October 1996, 1997, 1998, 2000 and September–Octo-
ber 2005, or about 1.5, 4, 16, 28, 52 and 112 months
post-disturbance. Gaps in sampling (1999, 2001–2004)
were because of high flows during target sample
periods or project limitations. Site A was not sampled
in August 1996; 29 samples were conducted alto-
gether. Fish sampling consisted of three-pass deple-
tion electrofishing by 12–15 persons using backpack
and barge-mounted electrofishers (Smith-Root Inc.,
Vancouver, WA, U.S.A.; Halltech Aquatic Research
Inc., Guelph, ON, Canada). The entire wetted channel
including all submerged cover was sampled in an
upstream direction over a reach length of 150 m to
obtain a representative sample of the fish assemblage.
All fish were collected with dip nets (4.8-mm mesh),
identified and enumerated after each pass and
released after the third pass. Questionable specimens
were preserved in 70% ethanol and returned to the
laboratory for identification. To standardise sampling
effort and area, sample sections were precisely
marked and electrofishing was conducted only when
discharge was £3.7 m3 s)1 at Fork Shoals (£86% of
mean October discharge). The same crew and equip-
ment configuration was employed during all sam-
pling. Abundance of each species was summed across
electrofishing passes for each sample prior to analysis.
To evaluate the degree of inherent longitudinal
variation in fish assemblage structure, and given the
large spatial span of the sample sites (35 km) and lack
of pre-disturbance data, we compared the Reedy
River study section to a similar river section that had
not suffered an oil spill (Sheldon, 1968; Vannote et al.,
1980). The North Tyger River was selected as the most
comparable system within the upper Santee River
basin containing sites approximating the elevation
range of the Reedy River study section (Fig. 1). Four
sites spanning 25.1 km and ranging from 183–233 m
in elevation (0.20% slope) were selected to assess
longitudinal variation in the North Tyger River. Sites
were sampled once each between 5 October and 17
November 2005 in identical fashion to the Reedy River
as described earlier.
Data analysis
Fish assemblage recovery was evaluated as a function
of relative compositional similarity among sites
through time with the hypothesis that the disturbed
sites would initially be dissimilar to the reference site
and become collectively more similar to the reference
site with time. The lack of pre-disturbance data meant
that recovery could not be measured as a return to
some level of pre-disturbance assemblage structure.
Fish assemblage recovery 507
� 2010 Blackwell Publishing Ltd, Freshwater Biology, 56, 503–518

However, since the disturbance did not physically
alter stream habitat, we expected assemblage struc-
ture to return towards that represented by the
undisturbed reference site. Recovery of the Reedy
River fish assemblage was therefore anticipated to
coincide with stabilisation in assemblage structure of
the disturbed sites relative to the expectedly stable
reference site (Matthews, Cashner & Gelwick, 1988).
We use the term ‘recovery’ with acknowledgement
that pre-disturbance assemblage structure was un-
known.
We used non-metric multidimensional scaling
(NMS) ordination to extract spatiotemporal patterns
in fish assemblage structure (Kruskal, 1964a,b; Math-
er, 1976; Kruskal & Wish, 1978). NMS is a general
ordination procedure recommended for non-normal
or questionably distributed data and calculates
ranked ecological distances (Clarke, 1993; McCune &
Grace, 2002), providing a relative measure of propor-
tional similarity in fish assemblage structure. NMS
was conducted using PC-ORD version 4 (McCune &
Mefford, 1999) with a random starting configuration
and 40 runs with real data. Sorensen distance was
selected as the similarity measure (Bray & Curtis,
1957). The probability of obtaining by chance a stress
less than or equal to that observed in the real data was
assessed with a Monte Carlo test (50 runs, a = 0.05).
Preliminary analysis of the full dataset of 33 species
revealed an inordinate influence of several rare
species on the ordination (Lohr & Fausch, 1997). Ten
species whose abundances represented £0.1% of the
grand total across samples were identified as strongly
influencing variation based on rarity alone, with little
spatiotemporal association in the context of fish
assemblage recovery. Seven of these species had
grand totals of £3 individuals occurring in £2 of 29
samples: Cyprinella nivea, Cyprinus carpio, Hybopsis
rubrifrons, Ameiurus nebulosus, Catostomus commersoni,
Erimyzon oblongus and Etheostoma thalassinum. There-
fore, we excluded these 10 rare species from ordina-
tion (e.g. Lonzarich et al., 1998; Wang, Seelbach &
Lyons, 2006; Table 1). We also detected a strong
influence of Gambusia holbrooki based on its extreme
variability in abundance. Relative abundance of
G. holbrooki was initially low at all sites in August
and October 1996 (mean 1 and 9%, respectively) then
increased substantially at all sites including the
reference site in 1997 (mean 43%; range 28–69%)
before decreasing sharply in 1998. Although we
acknowledge these dynamics as they may relate to
colonisation, the variability of this species masked the
underlying fish assemblage dynamics and it was thus
excluded from NMS (e.g. Lohr & Fausch, 1997).
Abundances of the 22 remaining species were stan-
dardised by sample totals to produce relative abun-
dance, thereby reducing the potential effects of minor
differences in sampled area among sites. The final
data matrix was processed with NMS, producing a
single output of all samples in species space. Corre-
lation coefficients (Kendall’s tau) were generated to
provide a rank measure of axis association for each
species (McCune & Grace, 2002). For the longitudinal
analysis, a separate NMS was performed on the North
Tyger River + Reedy River dataset (2005 only), pro-
viding a relative comparison of variation in assem-
blage structure within both systems. Eight rare (i.e.
<0.20% of grand total combined catch) species and
G. holbrooki were excluded from this analysis for
reasons described earlier.
From the NMS output, 95% confidence ellipses
were constructed about the mean axis scores (cent-
roids) for the reference site (across all time periods)
and disturbed sites (within time periods), characteris-
ing the variation within and similarity between
groups during each of the six sample periods. The
reference site samples were grouped across time
periods because we expected this site to chiefly reflect
natural assemblage dynamics and therefore show
relative stability (i.e. remain relatively localised in
ordination space) when compared to the disturbed
assemblages (Matthews et al., 1988). Grouping across
time periods would effectively represent this natural
variability and provide a target condition towards
which assemblage structure of the disturbed sites
would be expected to shift as recovery occurred.
Because of the aforementioned likelihood of natural
longitudinal variation, we did not necessarily expect
the disturbed sites to approach 100% similarity to the
reference site nor to one another, but rather to show a
net shift towards the reference condition.
To test for differences in assemblage structure
between disturbed sites and the reference site over
time, multi-response permutation procedure (MRPP;
Mielke, 1984) was performed using PC-ORD version 4
(McCune & Mefford, 1999). MRPP is a nonparametric
procedure that tests the null hypothesis of no differ-
ence among groups by comparing observed weighted
average within-group homogeneity with that
508 K. M. Kubach et al.
� 2010 Blackwell Publishing Ltd, Freshwater Biology, 56, 503–518
obtained by chance (McCune & Grace, 2002). Groups
were defined as the reference group (across sample
periods; n = 6 samples) and the disturbed groups
(within sample periods; n = 3 samples in August
1996; n = 4 samples in all other periods). MRPP was
performed using rank transformation of the Sorensen
distance matrix, with relative abundance as described
earlier to complement NMS (a = 0.05; McCune &
Grace, 2002). Post hoc pairwise comparisons were
performed to test for differences in assemblage struc-
ture between reference and disturbed groups within
each of the six sample periods (i.e. with time). The
experiment-wise Type I error rate for a = 0.05 was
controlled by applying a Bonferroni correction in
which groups were significantly different if P < 0.0083
(=0.05 ⁄6 comparisons).
Results
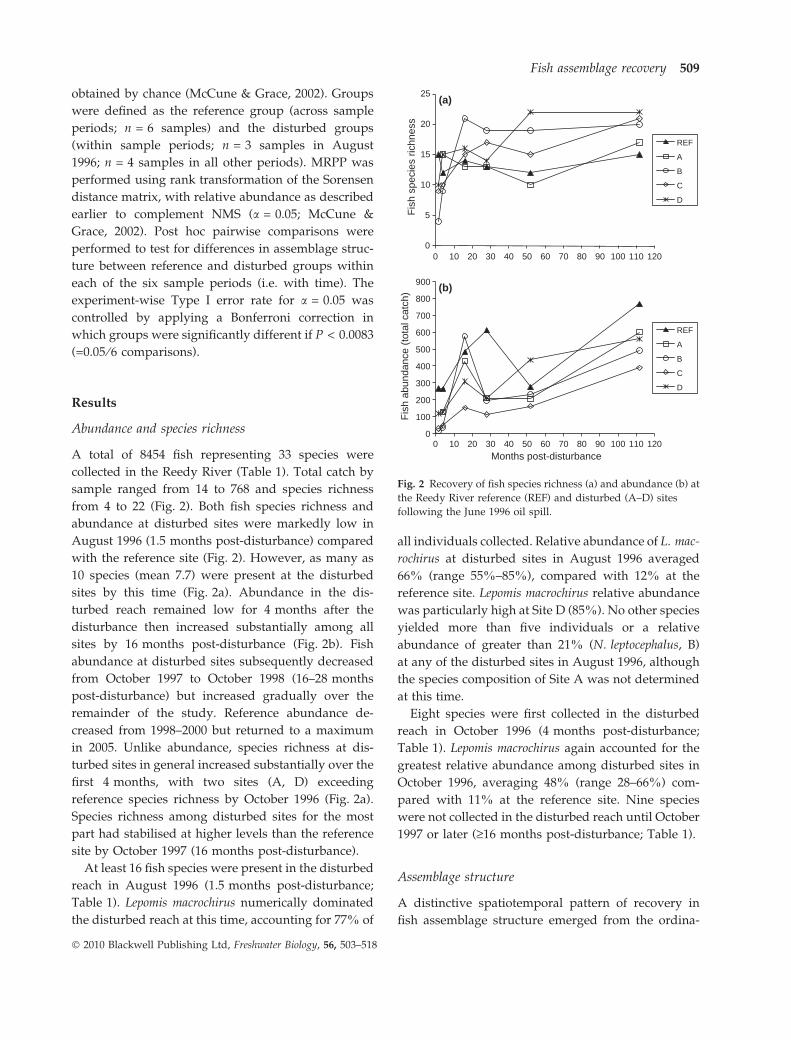
Abundance and species richness
A total of 8454 fish representing 33 species were
collected in the Reedy River (Table 1). Total catch by
sample ranged from 14 to 768 and species richness
from 4 to 22 (Fig. 2). Both fish species richness and
abundance at disturbed sites were markedly low in
August 1996 (1.5 months post-disturbance) compared
with the reference site (Fig. 2). However, as many as
10 species (mean 7.7) were present at the disturbed
sites by this time (Fig. 2a). Abundance in the dis-
turbed reach remained low for 4 months after the
disturbance then increased substantially among all
sites by 16 months post-disturbance (Fig. 2b). Fish
abundance at disturbed sites subsequently decreased
from October 1997 to October 1998 (16–28 months
post-disturbance) but increased gradually over the
remainder of the study. Reference abundance de-
creased from 1998–2000 but returned to a maximum
in 2005. Unlike abundance, species richness at dis-
turbed sites in general increased substantially over the
first 4 months, with two sites (A, D) exceeding
reference species richness by October 1996 (Fig. 2a).
Species richness among disturbed sites for the most
part had stabilised at higher levels than the reference
site by October 1997 (16 months post-disturbance).
At least 16 fish species were present in the disturbed
reach in August 1996 (1.5 months post-disturbance;
Table 1). Lepomis macrochirus numerically dominated
the disturbed reach at this time, accounting for 77% of
all individuals collected. Relative abundance of L. mac-
rochirus at disturbed sites in August 1996 averaged
66% (range 55%–85%), compared with 12% at the
reference site. Lepomis macrochirus relative abundance
was particularly high at Site D (85%). No other species
yielded more than five individuals or a relative
abundance of greater than 21% (N. leptocephalus, B)
at any of the disturbed sites in August 1996, although
the species composition of Site A was not determined
at this time.
Eight species were first collected in the disturbed
reach in October 1996 (4 months post-disturbance;
Table 1). Lepomis macrochirus again accounted for the
greatest relative abundance among disturbed sites in
October 1996, averaging 48% (range 28–66%) com-
pared with 11% at the reference site. Nine species
were not collected in the disturbed reach until October
1997 or later (‡16 months post-disturbance; Table 1).
Assemblage structure
A distinctive spatiotemporal pattern of recovery in
fish assemblage structure emerged from the ordina-
0
100
200
300
400
500
600
700
800
900
0 10 20 30 40 50 60 70 80 90 100 110 120
Fish
abu
ndan
ce (t
otal
cat
ch)
Months post-disturbance
REF
A
B
C
D
0
5
10
15
20
25
0 10 20 30 40 50 60 70 80 90 100 110 120
Fish
spe
cies
rich
ness
REF
A
B
C
D
(a)
(b)
Fig. 2 Recovery of fish species richness (a) and abundance (b) at
the Reedy River reference (REF) and disturbed (A–D) sites
following the June 1996 oil spill.
Fish assemblage recovery 509
� 2010 Blackwell Publishing Ltd, Freshwater Biology, 56, 503–518

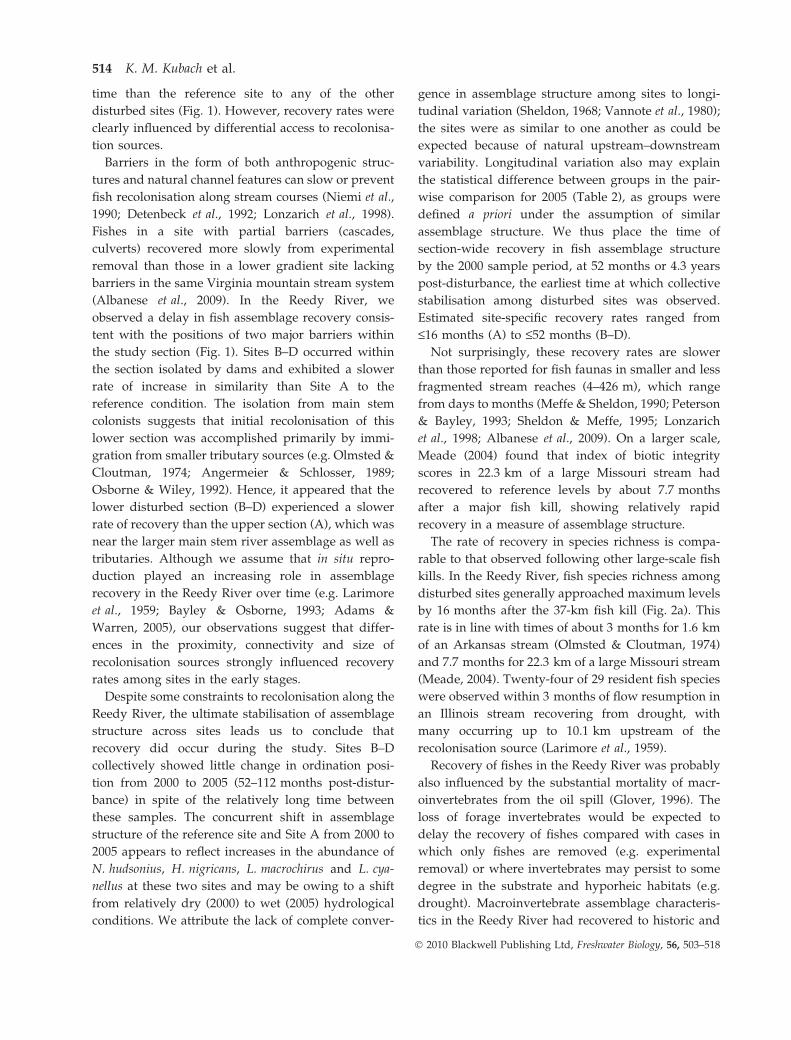
tion (Fig. 3). About 93% of the total variation in fish
assemblage structure among samples was represented
by two dimensions in NMS (Monte Carlo test,
P < 0.02; final stress = 10.97; Fig. 3). Axis 1 accounted
for the majority of variation (79%) and clearly
characterised the primary temporal component of
variation among samples. Axis 2 represented about
14% of the variance among samples and reflected a
less apparent pattern stemming from other sources of
variation.
Recovery in fish assemblage structure was clearly
illustrated by the position of sites through time on
Axis 1 (Fig. 3). The reference site showed relatively
little variability along Axis 1 and occupied a localised
area towards the negative end of this axis, indicating
relative stability in assemblage structure (Fig. 3a). In
August 1996, a marked difference in Axis 1 position
existed between the disturbed sites and the reference
condition, reflecting strong dissimilarity in assem-
blage structure about 1.5 months after the oil spill
(Fig. 3a). Sites B–D shifted slightly along Axis 1
towards the reference condition from August to
October 1996 (1.5–4 months post-disturbance) with
Site A showing greater similarity than the other
B
C
D
REF
A
BC
D
REFA
0.0 0.5 1.0 1.5 2.0
B
C
D
REF
A
August 1996 (1.5 months post–disturbance)
B
CD
Oct961998
2000
2005
B
CD
Aug96Oct96
1997
1998
2000
2005
REF
–1.0
–0.8
–0.6
–0.4
–0.2
0.0
0.2
0.4
0.6
0.8
1.0
BC
DREF
A
–1.0
–0.8
–0.6
–0.4
–0.2
0.0
0.2
0.4
0.6
0.8
1.0
–1.0
–0.8
–0.6
–0.4
–0.2
0.0
0.2
0.4
0.6
0.8
1.0
–1.0
–0.8
–0.6
–0.4
–0.2
0.0
0.2
0.4
0.6
0.8
1.0
–1.0
–0.8
–0.6
–0.4
–0.2
0.0
0.2
0.4
0.6
0.8
1.0
–1.0
–0.8
–0.6
–0.4
–0.2
0.0
0.2
0.4
0.6
0.8
1.0
–2.0 –1.5 –1.0 –0.5 0.0 0.5 1.0 1.5 2.0 –2.0 –1.5 –1.0 –0.5
0.0 0.5 1.0 1.5 2.0–2.0 –1.5 –1.0 –0.5
0.0 0.5 1.0 1.5 2.0–2.0 –1.5 –1.0 –0.50.0 0.5 1.0 1.5 2.0–2.0 –1.5 –1.0 –0.5
0.0 0.5 1.0 1.5 2.0–2.0 –1.5 –1.0 –0.5
BC D
REFA
October 1996 (4 months post–disturbance)
1997 (16 months post–disturbance) 1998 (28 months post–disturbance)
2000 (52 months post–disturbance) 2005 (112 months post–disturbance)
NMS Axis 1
NM
S A
xis
2
(c)
(a)
(f)
(d)
(b)
(e)
Fig. 3 Recovery of fish assemblage structure in the Reedy River following the June 1996 oil spill as illustrated in non-metric multi-
dimensional scaling ordination plots by sample period. Ellipses show 95% confidence intervals about the centroid position for the
reference site (m, REF; across samples from all time periods) and disturbed sites (•, A–D; within sample periods). Sample labels for the
reference site are shown in (a) and removed from the remaining panels for clarity (Aug96, August 1996; Oct96, October 1996). Axis 1
represents the majority (79%) of variation among samples; Axis 2 = 14%. Site A was not sampled in August 1996.
510 K. M. Kubach et al.
� 2010 Blackwell Publishing Ltd, Freshwater Biology, 56, 503–518

disturbed sites to the reference site by the time it was
first sampled in October 1996 (Fig. 3b). From 1996 to
1997 (4–16 months post-disturbance), the disturbed
sites further increased in similarity to the reference
assemblage on Axis 1 (Fig. 3c). Site A exhibited strong
similarity to the reference assemblage by 1997
(Fig. 3c). Little overall change in assemblage structure
was apparent in the disturbed sites from 1997 to 1998
(16–28 months post-disturbance; Fig. 3d). By 2000
(52 months post-disturbance), the disturbed sites
had further increased in similarity to the reference
site with considerable overlap in assemblage variation
(95% confidence intervals) between reference and
disturbed groups on Axis 1 (Fig. 3e). The disturbed
sites maintained a similar level of overall similarity to
the reference condition in 2005 (112 months post-
disturbance) with additional convergence in assem-
blage structure among disturbed sites as evident by a
tighter ellipse (Fig. 3f). This convergence was mainly
driven by a shift in Site A concurrent with the
reference site (Fig. 3f, note position of 2005 reference
point in Fig. 3a). In all, assemblage structure at the
disturbed sites began in a state of dissimilarity to the
reference site and shifted towards the reference
condition with time, largely stabilising in assemblage
structure as a group by 2000 (52 months post-distur-
bance).
We rejected the null hypothesis of no difference in
assemblage structure among reference (across sample
periods) and disturbed (within sample periods)
groups through time (MRPP, A = 0.349; P = 0.00007).
Pairwise comparisons of the reference group versus
the disturbed group within sample periods were
significantly different for August and October 1996
then were not different in 1997 (Bonferroni-corrected
a = 0.0083; Table 2). Pairwise differences subse-
quently alternated between significant (1998, 2005)
and not significant (2000; Table 2). Differences
appeared to be driven primarily by the aforemen-
tioned fluctuations in Site A and a general lack of
complete convergence in assemblage structure among
groups (Fig. 3). Despite these statistical fluctuations,
sites had generally stabilised in ordination position by
2000 (Fig. 3).
Species varied widely in strength of association
with the ordination axes (Kendall’s tau; Table 1). The
four strongest positive Axis 1 correlations were
L. macrochirus, L. gibbosus, D. cepedianum and Centrar-
chus macropterus (Table 1). The strongest negative Axis
1 values were those of Ameiurus platycephalus, N. lep-
tocephalus, L. auritus and H. nigricans (Table 1). Plot-
ting relative abundance against time for the two most
polar species on Axis 1, L. macrochirus and A. platy-
cephalus, showed a representative contrast of species
responses (Fig. 4). Lepomis macrochirus relative abun-
dance was initially high at disturbed sites and
decreased with time, whereas relative abundance of
A. platycephalus was at or near zero at most of the
disturbed sites in August 1996 (1.5 months post-
disturbance) and more slowly increased to relatively
stable levels (Fig. 4). Ameiurus platycephalus actually
exhibited a gradual decrease in relative abundance at
the reference site and at Site A from 1998 to 2005 (28–
112 months post-disturbance).
Longitudinal variation
The Reedy River and North Tyger River sites in 2005
produced a combined total of 5440 fishes from 36
species. Three dimensions in NMS characterised over
91% of the total variation in assemblage structure
among samples (Monte Carlo test, P < 0.02). The first
and third dimensions represented about 62% and
20% of this variation, respectively (Fig. 5). The second
dimension accounted for about 9% of the variation
and did not reflect any interpretable sources of
variation.
Two major patterns of variation in fish assemblage
structure were apparent among the concurrent Reedy
River and North Tyger River samples (Fig. 5). A
difference in assemblage composition between rivers
was evident along Axis 1 and represented the major-
ity of variation among samples (62%). Strongest
Table 2 MRPP test statistics for pairwise comparisons between
the reference site (grouped across sample periods) versus dis-
turbed sites (grouped within sample periods) by sample period
Reference
versus disturbed
comparison
Months
post-disturbance T A P
August 1996 1.5 )4.71 0.40 0.0017*
October 1996 4 )4.79 0.36 0.0022*
1997 16 )3.01 0.21 0.0143
1998 28 )3.57 0.25 0.0079*
2000 52 )2.22 0.17 0.0346
2005 112 )4.34 0.34 0.0041*
Groups are significantly different if P < 0.0083 (Bonferroni cor-
rection for 0.05 ⁄ 6 comparisons) and are marked with an asterisk.
MRPP, multi-response permutation procedure.
Fish assemblage recovery 511
� 2010 Blackwell Publishing Ltd, Freshwater Biology, 56, 503–518

associations (Kendall’s tau) for the Reedy River were
Lepomis cyanellus ()0.667), H. nigricans ()0.609),
Ameiurus catus ()0.609) and Ameiurus natalis ()0.559).
The North Tyger River was characterised most
strongly by Etheostoma olmstedi Storer (0.618), E. tha-
lassinum (0.588), Cyprinella zanema (Jordan & Brayton;
0.523) and N. leptocephalus (0.500). Etheostoma olmstedi
and C. zanema only occurred in the North Tyger River,
contributing to the differences between rivers.
The second and more noteworthy pattern in assem-
blage structure occurred among sites within systems,
following a distinct upstream–downstream longitudi-
nal gradient from positive to negative along Axis 3
(Fig. 5). Longitudinal variation was more pronounced
in the North Tyger River despite its shorter reach
length. Species common to both rivers and exhibiting
the strongest upstream distribution (Kendall’s tau)
were Notropis lutipinnis (0.551), L. cyanellus (0.444),
A. natalis (0.387) and Notropis hudsonius (0.222; Fig. 5).
Those most strongly associated with downstream
habitats were Cyprinella chloristia ()0.841), Notropis
scepticus ()0.609), C. nivea ()0.471) and E. thalassinum
()0.458). Lepomis macrochirus was neutral in longitu-
dinal association (0.000).
Discussion
Given the severity, extent and timing of the Reedy
River fish kill, it is not surprising that the disturbed
sites were dissimilar to the reference site in fish
assemblage structure during the first two sample
periods at 1.5 and 4 months post-disturbance.
Although many species were present in the disturbed
section by October 1996 (4 months post-disturbance),
total fish abundance was still low at the disturbed
sites compared with the reference site (Fig. 2).
0
10
20
30
40
50
60
70
80
90
100
0 10 20 30 40 50 60 70 80 90 100 110 120
Rel
ativ
e ab
unda
nce
(%)
REF
A
B
C
D
0
5
10
15
20
25
30
35
40
45
50
0 10 20 30 40 50 60 70 80 90 100 110 120
Rel
ativ
e ab
unda
nce
(%)
Months post-disturbance
REF
A
B
C
D
Lepomis macrochirus
Ameiurus platycephalus
(a)
(b)
Fig. 4 Contrasting relationships between
relative abundance and time for two fish
species in the Reedy River following the
June 1996 oil spill: Lepomis macrochirus (a)
and Ameiurus platycephalus (b).
512 K. M. Kubach et al.
� 2010 Blackwell Publishing Ltd, Freshwater Biology, 56, 503–518

Consequently, fish assemblage structure was rela-
tively dissimilar between the disturbed sites and the
reference site (Fig. 3). The rapid increase in species
richness observed between August and October 1996
prior to increase in abundance has similarly charac-
terised the recovery process after other natural and
experimental disturbances (Detenbeck et al., 1992;
Lonzarich et al., 1998; Adams & Warren, 2005).
As in many other studies (Niemi et al., 1990;
Detenbeck et al., 1992; Sheldon & Meffe, 1995; Lonza-
rich et al., 1998; Davey & Kelly, 2007), variation in
assemblage recovery rate among sites was consistent
with proximity and connectivity to recolonisation
sources. By the time it was first sampled in October
1996 (4 months post-disturbance), the fish assemblage
of Site A was notably more similar to the reference
condition than were those of the other disturbed sites
(Fig. 3). Site A subsequently became highly similar to
the reference site in 1997 (16 months post-distur-
bance) and maintained a relatively high degree of
similarity to the reference condition over the remain-
der of the study, with slight fluctuations probably
owing to natural variability, whereas the other dis-
turbed sites were slower to increase their similarity to
the reference condition.
The early similarity of Site A to the reference
condition can be attributed to two factors. First, Site A
was only 1.8 km downstream of the undisturbed main
stem fish assemblage, affording rapid immigration of
colonists from upstream. Proximity to a source of
colonists predictably influences fish population and
assemblage recovery rates from a wide range of
disturbances, both natural and anthropogenic (Olm-
sted & Cloutman, 1974; Detenbeck et al., 1992; Bayley
& Osborne, 1993; Sheldon & Meffe, 1995; Magoulick &
Kobza, 2003). In a chemically defaunated 715-km
section above a dam on the Green River, Wyoming,
fishes reappeared significantly later at sites 150–
244 km away from upstream sources of colonists than
at sites within 13–21 km (Detenbeck et al., 1992 citing
Binns, 1967). Fish density was inversely related to
distance from permanent water sources in sites
resuming flow after seasonal drought along 45 km
of a New Zealand river (Davey & Kelly, 2007). Second,
the apparently rapid recovery of Site A may in part
reflect a natural similarity to the reference site because
of longitudinal proximity and lack of barriers between
these sites (Sheldon, 1968; Vannote et al., 1980; Taylor,
1997). Based on longitudinal position, these two sites
should be more similar to one another at any point in
REEDY-RF
REEDY-A
REEDY-B
REEDY-CREEDY-D
TYGER-A
TYGER-BTYGER-C
TYGER-D
–1.0–1.0
0.0 1.0
–0.5
0.0
0.5
1.0
Axis 1
Axi
s 3
UpstreamNotropis lutipinnisLepomis cyanellusAmeiurus natalisNotropis hudsonius
DownstreamCyprinella chloristiaNotropis scepticusCyprinella niveaEtheostoma thalassinum
Reedy RiverLepomis cyanellusHypentelium nigricansAmeiurus catusAmeiurus natalis
North Tyger RiverEtheostoma olmstediEtheostoma thalassinumCyprinella zanemaNocomis leptocephalus
Fig. 5 Non-metric multidimensional scaling plot showing variation in fish assemblage structure between (Axis 1; 62% of variation
explained) and within (Axis 3; 20%) the Reedy River (REEDY) and North Tyger River (TYGER) study sections in 2005. Assemblage
structure follows a longitudinal pattern along Axis 3 from upstream (positive) to downstream (negative). The four species most
strongly associated with each axis direction are shown. Total section length on Reedy River = 34.9 km and North Tyger
River = 25.1 km.
Fish assemblage recovery 513
� 2010 Blackwell Publishing Ltd, Freshwater Biology, 56, 503–518
time than the reference site to any of the other
disturbed sites (Fig. 1). However, recovery rates were
clearly influenced by differential access to recolonisa-
tion sources.
Barriers in the form of both anthropogenic struc-
tures and natural channel features can slow or prevent
fish recolonisation along stream courses (Niemi et al.,
1990; Detenbeck et al., 1992; Lonzarich et al., 1998).
Fishes in a site with partial barriers (cascades,
culverts) recovered more slowly from experimental
removal than those in a lower gradient site lacking
barriers in the same Virginia mountain stream system
(Albanese et al., 2009). In the Reedy River, we
observed a delay in fish assemblage recovery consis-
tent with the positions of two major barriers within
the study section (Fig. 1). Sites B–D occurred within
the section isolated by dams and exhibited a slower
rate of increase in similarity than Site A to the
reference condition. The isolation from main stem
colonists suggests that initial recolonisation of this
lower section was accomplished primarily by immi-
gration from smaller tributary sources (e.g. Olmsted &
Cloutman, 1974; Angermeier & Schlosser, 1989;
Osborne & Wiley, 1992). Hence, it appeared that the
lower disturbed section (B–D) experienced a slower
rate of recovery than the upper section (A), which was
near the larger main stem river assemblage as well as
tributaries. Although we assume that in situ repro-
duction played an increasing role in assemblage
recovery in the Reedy River over time (e.g. Larimore
et al., 1959; Bayley & Osborne, 1993; Adams &
Warren, 2005), our observations suggest that differ-
ences in the proximity, connectivity and size of
recolonisation sources strongly influenced recovery
rates among sites in the early stages.
Despite some constraints to recolonisation along the
Reedy River, the ultimate stabilisation of assemblage
structure across sites leads us to conclude that
recovery did occur during the study. Sites B–D
collectively showed little change in ordination posi-
tion from 2000 to 2005 (52–112 months post-distur-
bance) in spite of the relatively long time between
these samples. The concurrent shift in assemblage
structure of the reference site and Site A from 2000 to
2005 appears to reflect increases in the abundance of
N. hudsonius, H. nigricans, L. macrochirus and L. cya-
nellus at these two sites and may be owing to a shift
from relatively dry (2000) to wet (2005) hydrological
conditions. We attribute the lack of complete conver-
gence in assemblage structure among sites to longi-
tudinal variation (Sheldon, 1968; Vannote et al., 1980);
the sites were as similar to one another as could be
expected because of natural upstream–downstream
variability. Longitudinal variation also may explain
the statistical difference between groups in the pair-
wise comparison for 2005 (Table 2), as groups were
defined a priori under the assumption of similar
assemblage structure. We thus place the time of
section-wide recovery in fish assemblage structure
by the 2000 sample period, at 52 months or 4.3 years
post-disturbance, the earliest time at which collective
stabilisation among disturbed sites was observed.
Estimated site-specific recovery rates ranged from
£16 months (A) to £52 months (B–D).
Not surprisingly, these recovery rates are slower
than those reported for fish faunas in smaller and less
fragmented stream reaches (4–426 m), which range
from days to months (Meffe & Sheldon, 1990; Peterson
& Bayley, 1993; Sheldon & Meffe, 1995; Lonzarich
et al., 1998; Albanese et al., 2009). On a larger scale,
Meade (2004) found that index of biotic integrity
scores in 22.3 km of a large Missouri stream had
recovered to reference levels by about 7.7 months
after a major fish kill, showing relatively rapid
recovery in a measure of assemblage structure.
The rate of recovery in species richness is compa-
rable to that observed following other large-scale fish
kills. In the Reedy River, fish species richness among
disturbed sites generally approached maximum levels
by 16 months after the 37-km fish kill (Fig. 2a). This
rate is in line with times of about 3 months for 1.6 km
of an Arkansas stream (Olmsted & Cloutman, 1974)
and 7.7 months for 22.3 km of a large Missouri stream
(Meade, 2004). Twenty-four of 29 resident fish species
were observed within 3 months of flow resumption in
an Illinois stream recovering from drought, with
many occurring up to 10.1 km upstream of the
recolonisation source (Larimore et al., 1959).
Recovery of fishes in the Reedy River was probably
also influenced by the substantial mortality of macr-
oinvertebrates from the oil spill (Glover, 1996). The
loss of forage invertebrates would be expected to
delay the recovery of fishes compared with cases in
which only fishes are removed (e.g. experimental
removal) or where invertebrates may persist to some
degree in the substrate and hyporheic habitats (e.g.
drought). Macroinvertebrate assemblage characteris-
tics in the Reedy River had recovered to historic and
514 K. M. Kubach et al.
� 2010 Blackwell Publishing Ltd, Freshwater Biology, 56, 503–518

upstream control levels by July 1997 (12 months post-
disturbance; J. B. Glover, unpubl. data), preceding fish
assemblage recovery by more than 3 years as reported
here. In another study, Meade (2004) observed
numerical improvement in invertebrates at some sites
within 22 weeks (5.1 months) following an effluent-
induced fish and invertebrate kill of 31.4 km in a
Missouri stream; fish abundance and species richness
had recovered by 33 weeks (7.7 months).
Although our analysis focused on the recovery of
fishes at the assemblage level, certain species stand
out in the recovery process. Lepomis macrochirus was
relatively abundant at all disturbed sites (including A)
in August and October 1996 (1.5–4 months post-
disturbance; Fig. 4) and was neutral in longitudinal
association, indicating recolonisation from sources
located throughout the disturbed section rather than
a single primary source such as Boyd Mill Pond at the
downstream end of the section. Tributary mouths and
backwater areas probably provided refugia and
sources of recolonisation (Detenbeck et al., 1992).
Juvenile L. macrochirus were collected in the early
samples, suggesting some reproduction in or near the
disturbed section (e.g. Olmsted & Cloutman, 1974).
The presence of other centrarchid species in low
abundance in 1996 but that subsequently increased in
relative abundance (e.g. L. auritus) suggests that the
high relative abundance of L. macrochirus was not
simply a product of electrofishing selectivity towards
shoreline-associated fish (Reynolds, 1983). Lepomis
macrochirus demonstrated a high immigration proba-
bility in Mississippi upper coastal plain streams
resuming flow following drought (Adams & Warren,
2005) but has also shown low immigration tendency
in Arkansas stream fish assemblages (Taylor & War-
ren, 2001). In other large-scale fish kills, L. macrochirus
took 7 weeks to reappear in an Arkansas stream (14th
of 26 species; Olmsted & Cloutman, 1974) and did not
increase in abundance until 22–33 weeks (5.5–
7.7 months) after a similar Missouri event (Meade,
2004).
Species with relatively neutral longitudinal associ-
ation and most strongly characterising the reference
end of the recovery axis (i.e. negative tau for Axis 1,
Fig. 3) were A. platycephalus, N. leptocephalus, L. aur-
itus and H. nigricans. Nocomis leptocephalus had gener-
ally reached its maximum relative abundance among
disturbed sites by October 1996 (4 months post-
disturbance), showing high resilience as reported in
other studies (Ensign et al., 1997; Albanese et al., 2009).
Lepomis auritus increased sharply from August to
October 1996 (1.5–4 months) at certain sites (B, C), but
otherwise steadily increased with time until 2000.
Relative abundance patterns in A. platycephalus and
H. nigricans were indicative of slower recovery (i.e.
lower resilience), especially in the lower section (Sites
B–D; Fig. 4b). These two species exhibit certain life
history traits that can translate into lower resilience,
such as relatively slow growth and longer time to
reproductive maturity (Schlosser, 1990; Detenbeck
et al., 1992). Resilience of ictalurids and catostomids
varied in other studies. Olmsted & Cloutman (1974)
indicated apparent recovery of Ameiurus melas (Rafin-
esque) but not A. natalis within 1 year of a 1.6-km fish
kill in Arkansas. Certain catostomid populations have
been slower to recover than other fishes after pulse
disturbances (e.g. Moxostoma duquesnei (Lesueur) in
Olmsted & Cloutman, 1974; Moxostoma cervinum
(Cope) in Ensign et al., 1997; Thoburnia rhothoeca
(Thoburn) in Ensign et al., 1997; Albanese et al.,
2009). Conversely, H. nigricans was nearly twice as
abundant about 3 months after flow resumption in a
previously dry Illinois stream than in a pre-drought
sample of the same area and time of year, whereas
other catostomids were far less abundant post-
drought (Larimore et al., 1959).
Low abundance or mobility may place species at
greater risk of extirpation in increasingly disturbed
and fragmented river systems (Albanese et al., 2009).
Catostomus commersoni was the only species collected
at the reference site or Site A (upstream of the
barriers) that was not also collected at Site B, C or D
(between the barriers) at any time during the study.
This species was represented by only two individuals
during the study (reference site, 2000 and Site A,
2005), suggesting that it normally occurs in low
numbers in this section of the river. The long time
between samples and distance between sites could
have reduced our ability to detect such rare or
sporadically occurring species; however, we cannot
rule out the possibility that Ca. commersoni was extir-
pated from the Reedy River between Cedar Falls Dam
and Boyd Mill Pond as a result of the oil spill.
Olmsted & Cloutman (1974) similarly failed to collect
Ca. commersoni despite frequent sampling for 1 year
following a 1.6-km fish kill in an Arkansas stream; its
pre-disturbance abundance was also low in their
study.
Fish assemblage recovery 515
� 2010 Blackwell Publishing Ltd, Freshwater Biology, 56, 503–518

Our study demonstrates biological recovery from a
severe and extensive disturbance, yet the recovery
process highlights the influence of anthropogenic
factors on resilience. Especially given the barriers to
fish movement along the Reedy River main stem,
recovery of the fish assemblage was in large part
dependent on the integrity of tributaries in supporting
adequate sources of colonists and pathways for
dispersal. However, like many other areas in the
south-eastern United States, the Reedy River catch-
ment is currently experiencing unprecedented human
population growth and associated conversion of
forested and agricultural landscapes into those dom-
inated by urban settings and impervious surfaces
(Campbell, Allen & Lu, 2007). Resulting cumulative
degradation of aquatic resources in this and other
catchments is increasingly documented and includes
reductions in stream water quality, altered geomor-
phic properties and loss of biological integrity (Sciera
et al., 2008). Such degradation represents the principal
long-term threat to aquatic biodiversity and may also
confound the recovery of aquatic ecosystems from
acute disturbances.
Acknowledgments
We thank the following individuals from Duke
Energy for conducting much of the early sampling:
R.D. Harrell, D.H. Barwick, D.J. Coughlan, B.K. Baker,
W.M. Rash, L.E. Miller, W.R. Doby and D.R. Cathey.
Harrell was instrumental in the design and imple-
mentation of the sampling strategy. Enterra, Inc. and
Entrix, Inc. assisted with much of the fieldwork.
SCDNR staff including J. Crane and W. Hayes
assisted with sampling. Clemson University also
provided sampling support. Gratitude is extended to
the property owners along the Reedy River for
providing access to study sites. Funding for this effort
was supplied by the Reedy River Mitigation Trust
Fund administered by the State of South Carolina. C.
Marion and W. Poly reviewed previous versions of
this manuscript.
References
Adams S.B. & Warren M.L. (2005) Recolonization by
warmwater fishes and crayfishes after severe drought
in upper Coastal Plain hill streams. Transactions of the
American Fisheries Society, 134, 1173–1192.
Albanese B., Angermeier P.L. & Peterson J.T. (2009) Does
mobility explain variation in colonisation and popula-
tion recovery among stream fishes? Freshwater Biology,
54, 1444–1460.
Allan J.D. & Flecker A.S. (1993) Biodiversity conservation
in running waters. BioScience, 43, 32–43.
Angermeier P.L. & Schlosser I.J. (1989) Species-area
relationships for stream fishes. Ecology, 70, 1450–1462.
Baker W.L. (1995) Long term response of disturbance
landscapes to human intervention and global change.
Landscape Ecology, 10, 143–159.
Bayley P.B. & Osborne L.L. (1993) Natural rehabilitation
of stream fish populations in an Illinois catchment.
Freshwater Biology, 29, 295–300.
Bender E.A., Case T.J. & Gilpin M.E. (1984) Perturbation
experiments in community ecology: theory and prac-
tice. Ecology, 65, 1–13.
Binns N.A. (1967) Effects of Rotenone Treatment on the
Fauna of the Green River, Wyoming. Fisheries Research
Bulletin Number 1. Wyoming Game and Fish Com-
mission, Cheyenne, WY, pp. 114.
Bray J.R. & Curtis J.T. (1957) An ordination of the upland
forest communities of southern Wisconsin. Ecological
Monographs, 27, 325–349.
Campbell C.E., Allen J. & Lu K.S. (2007) Modeling Growth
and Predicting Future Developed Land in the Upstate of South
Carolina. Report submitted to the Saluda-Reedy Wa-
tershed Consortium, Greenville, SC. Strom Thurmond
Institute, Clemson University, Clemson, SC, pp. 25.
Clarke K.R. (1993) Non-parametric multivariate analyses
of changes in community structure. Australian Journal
of Ecology, 18, 117–143.
Davey A.J.H. & Kelly D.J. (2007) Fish community
responses to drying disturbances in an intermittent
stream: a landscape perspective. Freshwater Biology, 52,
1719–1733.
Detenbeck N.E., Devore P.W., Niemi G.J. & Lima A.
(1992) Recovery of temperate-stream fish communities
from disturbance: a review of case studies and
synthesis of theory. Environmental Management, 16,
33–53.
Ensign W.E., Leftwich K.N., Angermeier P.L. & Dolloff
C.A. (1997) Factors influencing stream fish recovery
following a large-scale disturbance. Transactions of the
American Fisheries Society, 126, 895–907.
Fausch K.D., Torgersen C.E., Baxter C.V. & Li H.W.
(2002) Landscapes to riverscapes: bridging the gap
between research and conservation of stream fishes.
BioScience, 52, 483–498.
Glover J.B. (1996) Macroinvertebrate Impact Assessment of
the Reedy River Following a Pipeline Oil Spill. Tech.
Report 007-96. South Carolina Department of Health
and Environmental Control, Columbia, SC.
516 K. M. Kubach et al.
� 2010 Blackwell Publishing Ltd, Freshwater Biology, 56, 503–518

Griffith G.E., Omernik J.M., Comstock J.A., Schafale M.P.,
McNab W.H., Lenat D.R., MacPherson T.F., Glover J.B.
& Shelburne V.B. (2002) Ecoregions of South Carolina.
U.S. Environmental Protection Agency, National
Health and Environmental Effects Research Labora-
tory, Corvallis, OR, pp. 47.
Homer C., Huang C., Yang L., Wylie B. & Coan M. (2004)
Development of a 2001 National Landcover Database
for the United States. Photogrammetric Engineering and
Remote Sensing, 70, 829–840.
Jelks H.L., Walsh S.J., Burkhead N.M. et al. (2008)
Conservation status of imperiled North American
freshwater and diadromous fishes. Fisheries, 33, 372–
407.
Kruskal J.B. (1964a) Multidimensional scaling by opti-
mizing goodness of fit to a nonmetric hypothesis.
Psychometrika, 29, 1–27.
Kruskal J.B. (1964b) Nonmetric multidimensional scal-
ing: a numerical method. Psychometrika 29, 115–129.
Kruskal J.B. & Wish M. (1978) Multidimensional Scaling.
Sage Publications, Beverly Hills, CA.
Larimore R.W., Childers W.F. & Heckrotte C. (1959)
Destruction and re-establishment of stream fish and
invertebrates affected by drought. Transactions of the
American Fisheries Society, 88, 261–285.
Leuven R.S.E.W. & Poudevigne I. (2002) Riverine land-
scape dynamics and ecological risk assessment. Fresh-
water Biology, 47, 845–865.
Lohr S.C. & Fausch K.D. (1997) Multiscale analysis of
natural variability in stream fish assemblages of a
western Great Plains watershed. Copeia, 1997, 706–724.
Lonzarich D.G., Warren M.L.. Jr & Lonzarich M.R.E.
(1998) Effects of habitat isolation on the recovery of fish
assemblages in experimentally defaunated stream
pools in Arkansas. Canadian Journal of Fisheries and
Aquatic Sciences, 55, 2141–2149.
Magoulick D.D. & Kobza R.M. (2003) The role of refugia
for fishes during drought: a review and synthesis.
Freshwater Biology, 48, 1186–1198.
Mather P.M. (1976) Computational Methods of Multivariate
Analysis in Physical Geography, pp. 532. J. Wiley and
Sons, London.
Matthews W.J. (1986) Fish faunal structure in an Ozark
stream: stability, persistence and a catastrophic flood.
Copeia, 1986, 388–397.
Matthews W.J. & Marsh-Matthews E. (2003) Effects of
drought on fish across axes of space, time and
ecological complexity. Freshwater Biology, 48, 1232–
1253.
Matthews W.J., Cashner R.C. & Gelwick F.P. (1988)
Stability and persistence of fish faunas and assem-
blages in three midwestern streams. Copeia, 1988, 945–
955.
McCune B. & Grace J. (2002) Analysis of Ecological
Communities, pp. 300. MjM Software Design, Gleneden
Beach, OR.
McCune B. & Mefford M.J. (1999) PC-ORD. Multivariate
Analysis of Ecological Data, Version 4. MjM Software
Design, Gleneden Beach, OR.
Meade R. (2004) Fish and invertebrate recolonization in a
Missouri prairie stream after an acute pollution event.
North American Journal of Fisheries Management, 24, 7–
19.
Meffe G.K. & Sheldon A.L. (1990) Post-defaunation
recovery of fish assemblages in southeastern blackwa-
ter streams. Ecology, 71, 657–667.
Mielke P.W. (1984) Meteorological applications of per-
mutation techniques based on distance functions. In:
Handbook of Statistics, Vol. 4 (Eds P.R. Krishnaiah &
P.K. Sen), pp. 813–830. Elsevier Science Publishers,
Amsterdam.
National Transportation Safety Board (1998) Pipeline
Accident Report: Pipeline Rupture and Release of Fuel Oil
Into the Reedy River at Fork Shoals, South Carolina, June
26, 1996. NTSB ⁄ PAR-98 ⁄01. PB98-916502. Notation
6758A. National Transportation Safety Board, Wash-
ington, DC.
Niemi G.J., Devore P., Detenbeck N., Taylor D., Lima A.,
Pastor J., Yount J.D. & Naiman R.J. (1990) Overview of
case studies on recovery of aquatic systems from
disturbance. Environmental Management, 14, 571–587.
Olmsted L.L. & Cloutman D.G. (1974) Repopulation after
a fish kill in Mud Creek, Washington County, Arkan-
sas following pesticide pollution. Transactions of the
American Fisheries Society, 103, 79–87.
Osborne L.L. & Wiley M.J. (1992) Influence of tributary
spatial position on the structure of warmwater fish
communities. Canadian Journal of Fisheries and Aquatic
Sciences, 49, 671–681.
Peterson J.T. & Bayley P.B. (1993) Colonization rates of
fishes in experimentally defaunated warmwater
streams. Transactions of the American Fisheries Society,
122, 199–207.
Poff N.L. & Ward J.V. (1990) Physical habitat template of
lotic systems: recovery in the context of historical
pattern of spatiotemporal heterogeneity. Environmental
Management, 14, 629–645.
Pringle C. (2003) What is hydrologic connectivity and
why is it ecologically important? Hydrological Processes,
17, 2685–2689.
Rankin D.M., Geddings W.R. & Hayes W.E. (1996) Reedy
River fish kill investigation. In: Fisheries Investigations in
Lakes and Streams, Appendix III, District I Annual
Progress Report F-63-1-1. South Carolina Department
of Natural Resources, Freshwater Fisheries Section,
Columbia, SC.
Fish assemblage recovery 517
� 2010 Blackwell Publishing Ltd, Freshwater Biology, 56, 503–518

Resh V.H., Brown A.V., Covich A.P., Gurtz M.E., Li
H.W., Minshall G.W., Reice S.R., Sheldon A.L., Wallace
J.B. & Wissmar R.C. (1988) The role of disturbance in
stream ecology. Journal of the North American Bentho-
logical Society, 7, 433–455.
Reynolds J.B. (1983). Electrofishing. In: Fisheries Tech-
niques (Eds L.A. Nielsen & D.L. Johnson), pp. 147–164.
American Fisheries Society, Bethesda, MD.
Roghair C.N. & Dolloff C.A. (2005) Brook trout move-
ment during and after recolonization of a naturally
defaunated stream reach. North American Journal of
Fisheries Management, 25, 777–784.
Rohde F.C., Arndt R.G., Foltz J.W. & Quattro J.M. (2009)
Freshwater Fishes of South Carolina. The University of
South Carolina Press, Columbia, SC.
Schlosser I.J. (1990) Environmental variation, life history
attributes, and community structure in stream fishes:
implications for environmental management and
assessment. Environmental Management, 14, 621–628.
Schlosser I.J. (1991) Stream fish ecology: a landscape
perspective. BioScience, 41, 704–712.
Sciera K.L., Smink J.A., Morse J.C., Post C.J., Pike J.W.,
English W.R., Karanfil T., Hayes J.C., Schlautman M.A.
& Klaine S.J. (2008) Impacts of land disturbance on
aquatic ecosystem health: quantifying the cascade of
events. Integrated Environmental Assessment and Man-
agement, 4, 431–442.
Scott M.C. (2006) Winners and losers among stream
fishes in relation to land use legacies and urban
development in the southeastern U.S. Biological Con-
servation, 127, 301–309.
Sheldon A.L. (1968) Species diversity and longitudinal
succession in stream fishes. Ecology, 49, 193–198.
Sheldon A.L. & Meffe G.K. (1995) Short-term recoloniza-
tion by fishes of experimentally defaunated pools of a
coastal plain stream. Copeia, 1995, 828–837.
Taylor C.M. (1997) Fish species richness and incidence
patterns in isolated and connected stream pools: effects
of pool volume and spatial position. Oecologia, 110,
560–566.
Taylor C.M. & Warren M.L. Jr (2001) Dynamics in species
composition of stream fish assemblages: environmen-
tal variability and nested subsets. Ecology, 82, 2320–
2330.
Vannote R.L., Minshall G.W., Cummins K.W., Sedell J.R.
& Cushing C.E. (1980) The river continuum concept.
Canadian Journal of Fisheries and Aquatic Sciences, 37,
130–137.
Wang L., Seelbach P.W. & Lyons J. (2006) Effects of levels
of human disturbance on the influence of catchment,
riparian, and reach-scale factors on fish assemblages.
In: Landscape Influences on Stream Habitats and Biological
Assemblages (Eds R.M. Hughes, L. Wang & P.W.
Seelbach), pp. 199–219. American Fisheries Society
Symposium 48. American Fisheries Society, Bethesda,
MD.
(Manuscript accepted 20 September 2010)
518 K. M. Kubach et al.
� 2010 Blackwell Publishing Ltd, Freshwater Biology, 56, 503–518