Real-Time Amplitude and Phase Imaging of Optically … · Keywords Terahertz .Digitalholography ......
12
Real-Time Amplitude and Phase Imaging of Optically Opaque Objects by Combining Full-Field Off-Axis Terahertz Digital Holography with Angular Spectrum Reconstruction Masatomo Yamagiwa 1,2 & Takayuki Ogawa 3 & Takeo Minamikawa 1,2 & Dahi Ghareab Abdelsalam 1,2,4 & Kyosuke Okabe 5 & Noriaki Tsurumachi 5 & Yasuhiro Mizutani 2,6 & Testuo Iwata 1,2 & Hirotsugu Yamamoto 2,7 & Takeshi Yasui 1,2 Received: 13 January 2018 /Accepted: 12 March 2018 # Springer Science+Business Media, LLC, part of Springer Nature 2018 Abstract Terahertz digital holography (THz-DH) has the potential to be used for non-destructive inspection of visibly opaque soft materials due to its good immunity to optical scattering and absorption. Although previous research on full-field off-axis THz-DH has usually been performed using Fresnel diffraction reconstruction, its minimum reconstruction distance occasionally prevents a sample from being placed near a THz imager to increase the signal-to-noise ratio in the hologram. J Infrared Milli Terahz Waves https://doi.org/10.1007/s10762-018-0482-6 Electronic supplementary material The online version of this article (https://doi.org/10.1007/s10762-018- 0482-6) contains peer-reviewed but unedited supplementary material, which is available to authorised users. * Takeshi Yasui [email protected] 1 Graduate School of Technology, Industrial and Social Sciences, The Tokushima University, 2-1, Minami-Josanjima, Tokushima 770-8506, Japan 2 JST, ERATO, MINOSHIMA Intelligent Optical Synthesizer Project, 2-1, Minami-Josanjima, Tokushima 770-8506, Japan 3 Graduate School of Advanced Technology and Science, The Tokushima University, 2-1, Minami-Josanjima, Tokushima 770-8506, Japan 4 Engineering and Surface Metrology Lab, National Institute of Standards, Tersa St., El Haram, El Giza 12211, Egypt 5 Faculty of Engineering, Kagawa University, 2217-20, Hayashicho, Takamatsu, Kagawa 761-0396, Japan 6 Graduate School of Engineering, Osaka University, 2-1, Yamadaoka, Suita, Osaka 565-0871, Japan 7 Center for Optical Research and Education, Utsunomiya University, 7-1-2, Yoto, Utsunomiya, Tochigi 321-8585, Japan
Transcript of Real-Time Amplitude and Phase Imaging of Optically … · Keywords Terahertz .Digitalholography ......

Real-Time Amplitude and Phase Imaging of OpticallyOpaque Objects by Combining Full-Field Off-AxisTerahertz Digital Holography with AngularSpectrum Reconstruction
Masatomo Yamagiwa1,2 & Takayuki Ogawa3 &
Takeo Minamikawa1,2 & Dahi Ghareab Abdelsalam1,2,4 &
Kyosuke Okabe5 & Noriaki Tsurumachi5 &
Yasuhiro Mizutani2,6 & Testuo Iwata1,2 &
Hirotsugu Yamamoto2,7 & Takeshi Yasui1,2
Received: 13 January 2018 /Accepted: 12 March 2018# Springer Science+Business Media, LLC, part of Springer Nature 2018
Abstract Terahertz digital holography (THz-DH) has the potential to be used for non-destructiveinspection of visibly opaque soft materials due to its good immunity to optical scattering andabsorption. Although previous research on full-field off-axis THz-DH has usually been performedusing Fresnel diffraction reconstruction, its minimum reconstruction distance occasionally preventsa sample from being placed near a THz imager to increase the signal-to-noise ratio in the hologram.
J Infrared Milli Terahz Waveshttps://doi.org/10.1007/s10762-018-0482-6
Electronic supplementary material The online version of this article (https://doi.org/10.1007/s10762-018-0482-6) contains peer-reviewed but unedited supplementary material, which is available to authorised users.
* Takeshi [email protected]
1 Graduate School of Technology, Industrial and Social Sciences, The Tokushima University, 2-1,Minami-Josanjima, Tokushima 770-8506, Japan
2 JST, ERATO, MINOSHIMA Intelligent Optical Synthesizer Project, 2-1, Minami-Josanjima,Tokushima 770-8506, Japan
3 Graduate School of Advanced Technology and Science, The Tokushima University, 2-1,Minami-Josanjima, Tokushima 770-8506, Japan
4 Engineering and Surface Metrology Lab, National Institute of Standards, Tersa St., El Haram, ElGiza 12211, Egypt
5 Faculty of Engineering, Kagawa University, 2217-20, Hayashicho, Takamatsu, Kagawa 761-0396,Japan
6 Graduate School of Engineering, Osaka University, 2-1, Yamadaoka, Suita, Osaka 565-0871, Japan7 Center for Optical Research and Education, Utsunomiya University, 7-1-2, Yoto, Utsunomiya,
Tochigi 321-8585, Japan

In this article, we apply the angular spectrum method (ASM) for wavefront reconstruction in full-filed off-axis THz-DH because ASM is more accurate at short reconstruction distances. Wedemonstrate real-time phase imaging of a visibly opaque plastic sample with a phase resolutionpower of λ/49 at a frame rate of 3.5 Hz in addition to real-time amplitude imaging.We also performdigital focusing of the amplitude image for the same object with a depth selectivity of 447 μm.Furthermore, 3D imaging of visibly opaque silicon objects was achieved with a depth precision of1.7μm.The demonstrated results indicate the high potential of the proposedmethod for in-line or in-process non-destructive inspection of soft materials.
Keywords Terahertz . Digital holography . Phase image . Off-axis . Angular spectrummethod
1 Introduction
Digital holography (DH) [1] is a technique that acquires a hologram of an object by a digitalimaging device and numerically reconstructs the optical wavefront based on the acquiredhologram to obtain both the amplitude and phase images of the sample object. Furthermore,the phase image can be used for three-dimensional (3D) imaging of geometrical shapes or opticalthicknesses in an object with a sub-wavelength depth resolution, whereas digital focusing of theamplitude image [2] enables 3D imaging with a wavelength depth resolution over a widedynamic range of depths without changing the optical system. Until now, visible light has beenwidely used for DHwith a variety of light sources and digital imaging devices, namely, VIS-DH.The 3D shape of a visibly transparent object can be visualized by VIS-DH in a transmissionconfiguration [3]. Furthermore, the VIS-DH reflection configuration enables 3D imaging ofsurface shapes in a visibly opaque object [4]. Due to its real-time, quantitative, 3D-imagingcapability, VIS-DH has been widely used in various applications in science and industry.
However, if the object surface is visibly rough, strong scattering and/or phase wrappingambiguity will be problematic in VIS-DH. Additionally, transmission VIS-DH cannot beapplied to a visibly opaque object. If DH is performed using other electromagnetic radiationwith good immunity to optical scattering and good penetration of visibly opaque objects, theapplications of DH will be further expanded; for example, non-destructive inspection of softmaterials, such as plastics, semiconductor, ceramics, rubber, wood, and concrete, will berealized.
One promising radiation for this purpose is terahertz (THz) radiation (freq. = 0.1~10 THz,wavelength = 30~3000 μm) [5, 6]. Due to its existence at the boundary between optical andelectric radiation, THz radiation has both characteristics, i.e., good penetration of visiblyopaque, non-metallic materials, less scattering by visibly rough surfaces or visible scatteringobjects, good beam coherence, low invasiveness, and multiple spectral fingerprints. Fortunate-ly, the recent progress of continuous-wave (CW) THz laser sources and THz digital imagersallows full-field DH to be easily performed in the THz region [7–16]. For example, thecombination of a gas far-infrared laser with a pyroelectric array detector was applied forGarbor-type in-line transmission THz-DH to acquire the phase image of cancerous tissues[12]. While in-line THz-DH can be performed in a simple optical configuration without theneed of a two-arm interferometer, it is hampered by the spatial overlap of unnecessary zero-order-diffraction-light and conjugate first-order-diffraction-light images on the necessary first-order-diffraction-light image. To overcome this problem, off-axis full-field THz-DH [13] wasperformed in a transmission or reflection configuration using a THz quantum cascade laser
J Infrared Milli Terahz Waves

(THz-QCL) [17, 18] and uncooled, bolometer-type 2D focal plane array [19]; in this case, theunnecessary zero-order-diffraction-light and conjugate first-order-diffraction-light images werespatially separated and then filtered in the spatial frequency domain. By using the Fresneldiffraction method (FDM) [20, 21] for the numerical reconstruction of the THz wavefront, theTHz amplitude and phase imaging of the samples was demonstrated in real time. While FDMperforms only one Fourier transform, its use is limited under certain conditions, e.g., theminimum distance (reconstruction distance z) between the object plane and the hologramplane. In many cases of actual full-field THz-DH, the output power of a THz-QCL is notalways enough to achieve a high signal-to-noise ratio (SNR) in a real-time hologram acqui-sition by a THz digital imager; in this case, the object must be placed near the imager to reducethe signal loss in the lens-less configuration of DH. Such an experimental configuration maynot satisfy the requirement for the minimum z in FDM. An angular spectrum method (ASM)[20, 21] is another hologram reconstruction method and is more accurate for short reconstruc-tion distances; however, a Fourier transform is performed twice. ASM has been used for point-scanning THz-DH systems [7, 15], but no attempt has been made to use ASM in full-fieldTHz-DH equipped with THz-QCL and THz digital imagers.
In this article, we acquired a THz digital hologram using a full-field off-axis THz-DHsystem equipped with THz-QCL and uncooled, bolometer-type 2D focal plane arrays andthen, performed the numerical reconstruction of the wavefront based on ASM. Furthermore,we evaluated the phase noise in the reconstructed phase image, which limits the precision ofthe phase imaging and the 3D imaging of a sample. Finally, we demonstrated the quantitativephase imaging of visibly opaque objects in real time and the 3D shape measurement of avisibly opaque, stepped structure.
2 Method
2.1 Experimental Setup
Figure 1 illustrates a schematic diagram of a full-field off-axis THz-DH system in a transmis-sion configuration. The CW-THz radiation was generated by a THz-QCL (EasyQCL,LongWave Photonics LLC, center frequency = 3 THz, center wavelength = 100 μm, averagepower = 1.78 mW). The THz-QCL was kept at 50 K in a cryostat using a Stirling cycle coolerwithout the need for cryogenic cooling. After passing through an optical chopper (OC, 3501,New Focus, modulation frequency = 7.5 Hz), the CW-THz radiation was collimated at adiameter of 7 mm by an off-axis parabolic mirror (OA-PM, off-axis angle = 90°, diameter =25.4 mm, focal length = 50.8 mm) and was fed into a Mach-Zehnder interferometer. In theinterferometer, the object beam passed through a silicon beam splitter (BS, diameter =101.6 mm, thickness = 500 μm, reflection = 54%, transmittance = 46%) and a sample, whereasthe reference beam was reflected by BS and an aluminum mirror (M). Both beams wereincident onto an uncooled, 2D micro-bolometer array, namely, the THz imager (IRV-T0831,NEC Inc., sensor area = 7.52 mm × 5.64 mm, pixel number = 320 pixels × 240 pixels, pixelsize = 23.5 μm × 23.5 μm, frame rate = 7.5 frames per second, exposure time = 66.7 ms, digitaloutput resolution = 14 bit) at an off-axis angle of 40°. This results in the generation of verticalinterference patterns of CW-THz radiation on the THz imager, namely, the THz digitalhologram. To improve the image SNR, we adopted a dynamic subtraction technique bysynchronizing the THz imager with the CW-THz radiation. To this end, the CW-THz radiation
J Infrared Milli Terahz Waves

was chopped with the OC. We performed alternating acquisitions of the image with andwithout the CW-THz radiation and subtracted successive images, thereby suppressing thebackground noise. The minimum sampling spacing in the THz hologram is 47 μm from thesampling theorem for a THz imager with a 23.5-μm pixel pitch.
2.2 Hologram Reconstruction
ASM is a method to directly calculate the diffraction integral. Since the details of ASM aregiven elsewhere [20, 21], we briefly describe the main characteristics of this method. In thescalar diffraction theory, the diffracted field, ψp(x, y; z), is given by the incident field, ψp0(x, y),as follows:
ψp x; y; zð Þ ¼ F−1 F ψp0 x; yð Þ! "
$ H kx; ky; z# $% &
; ð1Þ
where H(kx, ky; z) is the spatial frequency transfer function (SFTF). As shown in Eq. (1), ASMrequires two Fourier transform (FT) calculations. Assuming that the sampling period along thex-axis is ∆x with a total ofM samples and the sampling period along the y-axis is ∆y with a totalof N samples, the discrete form of Eq. (1) is given by:
ψp m; n½ & ¼ IDFT2D DFT 2D ψp0 m; nð Þ! "
$ H p; q½ &% &
: ð2Þ
In Eq. (2), the discrete form of SWTF, H[p, q], is given by:
H p; q½ & ¼ e−jk0z
ffiffiffiffiffiffiffiffiffiffiffiffiffiffiffiffiffiffiffiffiffiffiffiffiffiffiffiffiffi1−
pΔkxð Þ2k0
2 −qΔkyð Þ2k0
2
r
; ð3Þ
where ∆kx and ∆kx are the frequency resolution corresponding to sampling periods, ∆x and ∆y,along the x- and y-directions, respectively. The sampling period of the reconstructed image isequal to that of the hologram regardless of the reconstruction distance.
3 Results
3.1 Amplitude and Phase Imaging of a Plastic Object
We first measured a plastic object, i.e., a visibly opaque sample with a 3D shape. In thissample, two letters, BP^ and BS,^ were impressed in a convex manner (height = 228 μm)
Fig. 1 Experimental setup. THz-QCL THz quantum cascade laser(center frequency = 3 THz,average power = 1.78 mW); OCoptical chopper (modulationfreq. = 7.5 THz); OA-PM off-axisparabolic mirror (off-axis angle =90°, diameter = 25.4 mm, focallength = 50.8 mm); M aluminummirror; BS silicon beam splitter(diameter = 101.6 mm, thickness =500 μm)
J Infrared Milli Terahz Waves

on a polystyrene plate (thickness = 0.8 mm, refractive index = 1.67), as shown in Fig. 2a.Figure 2b shows the acquired hologram (image size = 7.52 mm × 5.64 mm, pixel num-ber = 320 pixels × 240 pixels, number of image integrations = 128). We confirmed theinterference pattern with a spacing of ≈ 80 μm. This spacing was in good agreement withthe expected value based on the CW-THz radiation wavelength of 100 μm and the off-axis angle of 40°. To avoid aliasing in the reconstruction, we added null data to the areaaround the hologram to increase the number of pixels to 640 pixels × 640 pixels. Then,we reconstructed the amplitude and phase images of the sample at a reconstructiondistance, z, of 7 mm using ASM, as shown in Fig. 2c, d. The two letters BP^ and BS^were clearly confirmed in both images. In the amplitude image, the image contrast isgiven by the edges of the letters due to the reflection and scattering losses of CW-THzradiation. However, the contrast in the phase image is due to the differences in theoptical thickness in the letter and no letter regions. The phase image has a better contrastthan the amplitude image in the limited SNR of the hologram.
We next demonstrated the digital focusing of the amplitude image in the same plasticsample (see Fig. 2a) by changing the reconstruction distance, z. Figure 3 and Video 1show a series of amplitude images as z was changed at intervals of 1 mm (image size =7.52 mm × 5.64 mm, pixel number = 320 pixels × 240 pixels, number of image integra-tions = 128). The letters BP^ and BS^ were in focus at z = 7 mm, but they were out offocus at z ≥ 8 mm and ≤ 6 mm. The depth resolution of the digital focusing was estimatedby the depth of the focus, DF, of the optical system as follows:
Fig. 2 a Optical photograph of a visibly opaque, plastic sample with two impressed letters, BP^ and BS.^ b THzdigital hologram (image size = 7.52 mm × 5.64 mm, pixel number = 320 pixels × 240 pixels, number of imageintegrations = 128). Reconstructed images of the c amplitude and d phase (image size = 7.52 mm × 5.64 mm,pixel number = 320 pixels × 240 pixels) by ASM
J Infrared Milli Terahz Waves

DF ¼ λNA2 ¼ 100$ 10−6
0:4732¼ 447Ëcm: ð4Þ
This depth resolution is reasonably reflected in Fig. 3 and Video 1. Because digital focusingdoes not require any changes in the optical setup, it is a powerful modality for 3D imaging overa wide dynamic range of depths. For example, if another object is placed at a different depthposition, digital focusing allows us to individually separate and visualize them.
We also obtained a real-time movie of the amplitude and phase when the plastic sample (seeFig. 2a) was screened by a paper sheet. A hologram was acquired over 11.4 s at a frame rate of3.5 Hz, as shown in the left panel of Video 2. Figure 4a shows a snapshot of the hologrammovie (image size = 7.52 mm × 5.64 mm, pixel number = 320 pixels × 240 pixels, no imageintegration). The interference pattern was still observed in the single-shot hologram. Byapplying ASM to the full movie of the hologram, we obtained movies of both the amplitudeand phase, as shown in the center and right panels of Video 2, respectively. Figure 4b, c showssnapshots of the amplitude and phase movies (image size = 7.52 mm × 5.64 mm, pixelnumber = 320 pixels × 240 pixels, reconstruction distance z = 7 mm) before the sample wasscreened by the paper sheet (t = 0.285 s). The two letters BP^ and BS^ were confirmed in bothimages. Next, Fig. 4d, e shows snapshots of the amplitude and phase movies when the samplewas partially screened by the paper sheet (t = 1.710 s). Good contrast was still maintained inthe phase image, whereas the two letters almost disappeared in the amplitude image due to thedecreased amplitude caused by the paper sheet. These movies and figures reflect the change inthe amplitude and phase caused by inserting the paper sheet in front of the sample. Further-more, the phase image is more powerful than the amplitude image in the low SNR. The real-time imaging capability of both the amplitude and phase has the potential to expand theapplications of THz-DH.
3.2 3D Imaging of a Semiconductor Object Based on a Phase Image
We measured a semiconductor object, i.e., a visibly opaque sample with known 3Ddimensions to demonstrate the potential for 3D imaging of visibly opaque objects. Achecker pattern was carved on a silicon substrate (n-type, thickness = 300 μm, electricresistivity > 1 Ω•cm) by a photolithography method. Figure 5a shows the optical photo-graph and schematic drawing of the checker-patterned sample (grid size = 1 mm by 1 mm).The depth of the sample was determined to be 21.11 ± 0.03 μm by a 3D optical microscopebased on white light interferometry (Veeco, Wyko NT9100, depth resolution < 0.1 nm,lateral resolution > 0.5 μm).
We acquired the THz digital hologram (see Fig. 5b, image size = 7.52 mm × 5.64 mm, pixelnumber = 320 pixels × 240 pixels, number of image integrations = 128) of the sample. Byapplying ASM to the acquire hologram, we reconstructed the amplitude image and phaseimage of the sample (image size = 7.52 mm × 5.64 mm, pixel number = 320 pixels ×240 pixels)at a reconstruction distance, z, of 7 mm, as shown in Fig. 5c, d. In the amplitude image,although the edge of the grid pattern was confirmed, the checker pattern with differentthicknesses was not as clear due to the small differences in the THz attenuation between thechecker patterns. However, the phase image clearly shows the checker pattern due to the largedifference in the optical thicknesses of the top and bottom surfaces.
J Infrared Milli Terahz Waves
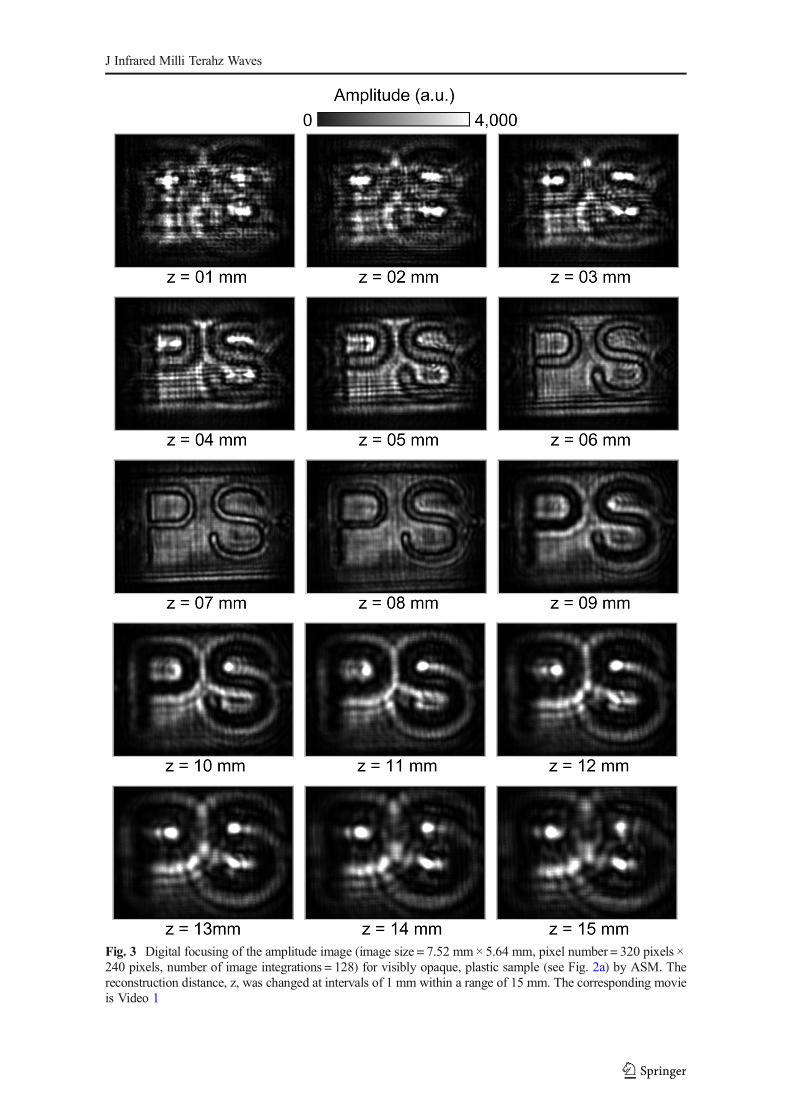
Fig. 3 Digital focusing of the amplitude image (image size = 7.52 mm × 5.64 mm, pixel number = 320 pixels ×240 pixels, number of image integrations = 128) for visibly opaque, plastic sample (see Fig. 2a) by ASM. Thereconstruction distance, z, was changed at intervals of 1 mm within a range of 15 mm. The corresponding movieis Video 1
J Infrared Milli Terahz Waves

We reconstructed a 3D image of the sample from the phase image, ϕ(x, y). The 2Ddistribution of the relative thickness, t(x, y), was given by:
t x; yð Þ ¼ λ2π nsample−nair
# $ ϕ x; yð Þ; ð5Þ
where λ is the wavelength of the CW-THz radiation and nsample and nair are the refractiveindices of the samples and air, respectively. nsample was determined to be 3.1 by ourasynchronous-optical-sampling terahertz time-domain spectrometer [22]. Figure 5e showsthe t(x, y) of the sample calculated from the phase image in Fig. 5d. The 3D contour of thesample was clearly visualized. Because the relative thickness was 13.4 ± 1.6 μm for the top
Fig. 4 Real-time movie of a visibly opaque, plastic sample. a Snapshot of a THz digital hologram (image size =7.52 mm × 5.64 mm, pixel number = 320 pixels × 240 pixels, frame rate = 3.5 Hz). Snapshots of the reconstruct-ed b amplitude and c phase movies (image size = 7.52 mm × 5.64 mm, pixel number = 320 pixels × 240 pixels)by ASM before the sample was screened by a paper sheet (t = 0.285 s). Snapshots of the reconstructed damplitude and e phase movies (image size = 7.52 mm × 5.64 mm, pixel number = 320 pixels × 240 pixels) byASM after the sample was screened by a paper sheet (t = 1.710 s). The corresponding movie is Video 2
J Infrared Milli Terahz Waves

surface and − 9.0 ± 1.8 μm for the bottom surface, the difference in the geometrical thicknesswas 22.4 ± 1.7 μm. This value is in good agreement with the value (21.11 ± 0.03 μm) obtainedby 3D optical microscopy. The unevenness of the phase value in each pattern was due to thephase noise discussed later rather than the surface roughness of the sample. The expectedvalues for the spatial resolution of the horizontal and vertical directions are given by:
SRx ¼λz
MΔx¼ 100$ 10−6 $ 14$ 10−3
320$ 23:5$ 10−6¼ 186 μm ð6Þ
SRy ¼λz
NΔy¼ 100$ 10−6 $ 14$ 10−3
240$ 23:5$ 10−6¼ 248 μm: ð7Þ
Fig. 5 a Optical photograph and schematic diagram of a visibly opaque, silicon sample with a checker pattern. bTHz digital hologram (image size = 7.52 mm × 5.64 mm, pixel number = 320 pixels × 240 pixels, number ofimage integrations = 128). Reconstructed images of the c amplitude and d phase (image size = 7.52 mm ×5.64 mm, pixel number = 320 pixels × 240 pixels) by ASM. e 3D image calculated by the phase image in Fig. 5d
J Infrared Milli Terahz Waves

4 Discussion
Phase resolution is an important performance of THz-DH to determine the depth preci-sion of 3D imaging based on the phase image. Here, we discuss the phase resolution inthe present phase image because the phase resolution is directly related to the depthresolution. The phase resolution is defined as the fluctuation of the phase value betweendifferent phase images, which depends on the robustness of the optical system to externaldisturbance (vibration, air turbulence, etc.) and/or SNR in the phase image. Figure 6a–cshows a typical hologram without the sample (image size = 7.52 mm × 5.64 mm, pixelnumber = 320 pixels × 240 pixels, number of image integrations = 128) and the corre-sponding amplitude and phase images (image size = 7.52 mm × 5.64 mm, pixel number =320 pixels × 240 pixels), respectively. Also, Fig 6d–f shows the hologram, amplitudeimage, and the phase image when no image integrations were performed. Amplitude
Fig. 6 a Thz digital hologram, b reconstructed amplitude image, and c reconstructed phase image without thesample (image size = 7.52 mm × 5.64 mm, pixel number = 320 pixels × 240 pixels, number of image integra-tions = 128). d THz digital hologram, e reconstructed amplitude image, and f reconstructed phase image withoutthe sample (image size = 7.52 mm × 5.64 mm, pixel number = 320 pixels × 240 pixels, no image integrations).Spatial distribution of the phase noise in g 128-hologram-integrated and h no-hologram-integrated phase images.i Phase resolution and amplitude SNR with respect to number of image integration
J Infrared Milli Terahz Waves
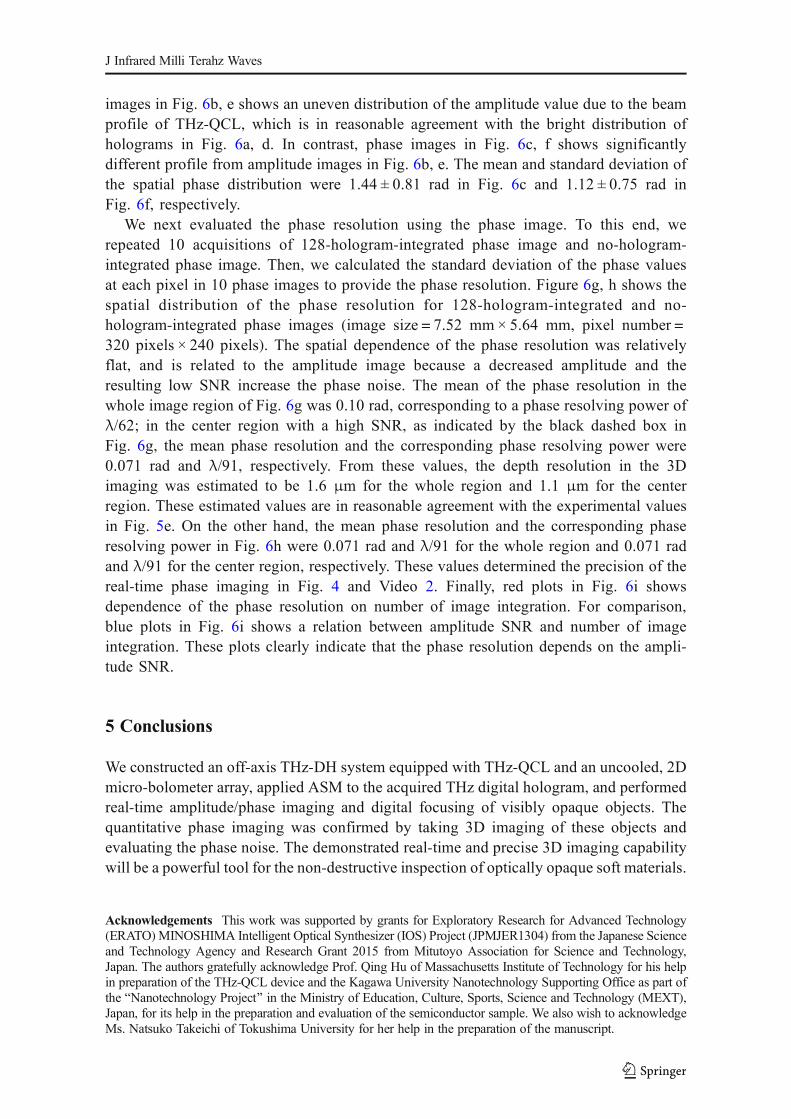
images in Fig. 6b, e shows an uneven distribution of the amplitude value due to the beamprofile of THz-QCL, which is in reasonable agreement with the bright distribution ofholograms in Fig. 6a, d. In contrast, phase images in Fig. 6c, f shows significantlydifferent profile from amplitude images in Fig. 6b, e. The mean and standard deviation ofthe spatial phase distribution were 1.44 ± 0.81 rad in Fig. 6c and 1.12 ± 0.75 rad inFig. 6f, respectively.
We next evaluated the phase resolution using the phase image. To this end, werepeated 10 acquisitions of 128-hologram-integrated phase image and no-hologram-integrated phase image. Then, we calculated the standard deviation of the phase valuesat each pixel in 10 phase images to provide the phase resolution. Figure 6g, h shows thespatial distribution of the phase resolution for 128-hologram-integrated and no-hologram-integrated phase images (image size = 7.52 mm × 5.64 mm, pixel number =320 pixels × 240 pixels). The spatial dependence of the phase resolution was relativelyflat, and is related to the amplitude image because a decreased amplitude and theresulting low SNR increase the phase noise. The mean of the phase resolution in thewhole image region of Fig. 6g was 0.10 rad, corresponding to a phase resolving power ofλ/62; in the center region with a high SNR, as indicated by the black dashed box inFig. 6g, the mean phase resolution and the corresponding phase resolving power were0.071 rad and λ/91, respectively. From these values, the depth resolution in the 3Dimaging was estimated to be 1.6 μm for the whole region and 1.1 μm for the centerregion. These estimated values are in reasonable agreement with the experimental valuesin Fig. 5e. On the other hand, the mean phase resolution and the corresponding phaseresolving power in Fig. 6h were 0.071 rad and λ/91 for the whole region and 0.071 radand λ/91 for the center region, respectively. These values determined the precision of thereal-time phase imaging in Fig. 4 and Video 2. Finally, red plots in Fig. 6i showsdependence of the phase resolution on number of image integration. For comparison,blue plots in Fig. 6i shows a relation between amplitude SNR and number of imageintegration. These plots clearly indicate that the phase resolution depends on the ampli-tude SNR.
5 Conclusions
We constructed an off-axis THz-DH system equipped with THz-QCL and an uncooled, 2Dmicro-bolometer array, applied ASM to the acquired THz digital hologram, and performedreal-time amplitude/phase imaging and digital focusing of visibly opaque objects. Thequantitative phase imaging was confirmed by taking 3D imaging of these objects andevaluating the phase noise. The demonstrated real-time and precise 3D imaging capabilitywill be a powerful tool for the non-destructive inspection of optically opaque soft materials.
Acknowledgements This work was supported by grants for Exploratory Research for Advanced Technology(ERATO) MINOSHIMA Intelligent Optical Synthesizer (IOS) Project (JPMJER1304) from the Japanese Scienceand Technology Agency and Research Grant 2015 from Mitutoyo Association for Science and Technology,Japan. The authors gratefully acknowledge Prof. Qing Hu of Massachusetts Institute of Technology for his helpin preparation of the THz-QCL device and the Kagawa University Nanotechnology Supporting Office as part ofthe BNanotechnology Project^ in the Ministry of Education, Culture, Sports, Science and Technology (MEXT),Japan, for its help in the preparation and evaluation of the semiconductor sample. We also wish to acknowledgeMs. Natsuko Takeichi of Tokushima University for her help in the preparation of the manuscript.
J Infrared Milli Terahz Waves

References
1. U. Schnars, C. Falldorf, J. Watson, W. Jüptner, Digital holography (Springer Berlin, 2005).2. P. Langehanenberg, G. von Bally, B. Kemper, 3D Res. 2, 4 (2011).3. B. Kemper, G. Bally, Appl. Opt. 47, A52 (2008).4. B. Javid, E. Tajahuerce, Opt. Lett. 25, 610 (2000).5. M. Tonouchi, Nat. Photonics 1, 97 (2007).6. D. M. Mittleman, Sensing with THz radiation (Springer, 2003).7. M. S. Heimbeck, M. K. Kim, D. A. Gregory, H. O. Everitt, Opt. Express 19, 9192 (2011).8. S. Ding, Q. Li, Y. Li, Q. Wang, Opt. Lett. 36, 1993 (2011).9. K. Xue, Q. Li, Y. Li, Q. Wang, Opt. Lett. 37, 3228 (2012).10. E. Hack, P. Zolliker, Opt. Express 22, 16079 (2014).11. L. Rong, T. Latychevskaia, D. Wang, X. Zhou, H. Huang, Z. Li, Y. Wang, Opt. Express 22, 17236 (2014).12. L. Rong, T. Latychevskaia, C. Chen, D. Wang, Z. Yu, X. Zhou, Z. Li, H. Huang, Y. Wang, Z. Zhou, Sci.
Reports 5, 8445 (2015).13. M. Locatelli, M. Ravaro, S. Bartalini, L. Consolino, M. S. Vitiello, R. Cicchi, F. Pavone, P. De Natale, Sci.
Reports 5, 13566 (2015).14. H. Zolliker, E. Hack, Opt. Express 23, 10957 (2015).15. M. S. Heimbeck, W.-R. Ng, D. R. Golish, M. E. Gehm, H. O. Everitt, IEEE Trans. THz Sci. Technol. 5, 110
(2015).16. L. Valzania, P. Zolliker, E. Hack, Opt. Express 25, 11038 (2017).17. B. S. Williams, Nat. Photon. 1, 517 (2007).18. S. Kumar, IEEE J. Sel. Top. Quantum Electron. 17, 38 (2011).19. N. Oda, C. R. Phys. 11, 496 (2010).20. M. K. Kim, L. Yu, C. J. Mann, J. Opt. A: Pure Appl. Opt. 8, S518 (2006).21. T. C. Poon, J. P. Liu, Introduction to modern digital holography with MATLAB (Cambridge University
Press, 2014).22. Y.-D. Hsieh, S. Nakamura, D. G. Abdelsalam, T. Minamikawa, Y. Mizutani, H. Yamamoto, T. Iwata, F.
Hindle, T. Yasui, Sci. Reports 6, 28114 (2016).
J Infrared Milli Terahz Waves