Real GDP Growth - University of Colorado Boulder · Real GDP Growth 5 3 9 9 Employment Growth 21 6...
120
Transcript of Real GDP Growth - University of Colorado Boulder · Real GDP Growth 5 3 9 9 Employment Growth 21 6...


Business Research Division | Leeds School of Business | University of Colorado Boulder
Real GDP GrowthQuarterly Real GDP
Sources: Bureau of Economic Analysis and Consensus Forecasts.
-10.0
-8.0
-6.0
-4.0
-2.0
0.0
2.0
4.0
6.0
8.0
10.0
1990 1992 1994 1996 1998 2000 2002 2004 2006 2008 2010 2012 2014 2016
Percent Change, SAAR
Business Research Division | Leeds School of Business | University of Colorado Boulder
10
12
14
16
18
20
22
2000 2002 2004 2006 2008 2010 2012 2014 2016 2018 2020 2022 2024
Trillions, USD
Recession
18 MonthsRecession
8 Months
Real GDP
Actual Projected
Source: Congressional Budget Office, Budget and Economic Outlook, Fiscal Years 2015 to 2025.
GDP and Potential GDP
Potential Real GDP

Business Research Division | Leeds School of Business | University of Colorado Boulder
National Employment
Sources: Bureau of Labor Statistics (Seasonally Adjusted), National Bureau of Economic Research, and the Business Research Division.
-900
-700
-500
-300
-100
100
300
500
2000 2002 2004 2006 2008 2010 2012 2014 2016
Thousands, Month-over-Month
Rec
essi
on 1
8 M
onth
s
Rec
essi
on 8
Mon
ths

Business Research Division | Leeds School of Business | University of Colorado Boulder
State Employment GrowthPre-Recession Peak to October 2015
Sources: Bureau of Labor Statistics (Seasonally Adjusted).

Business Research Division | Leeds School of Business | University of Colorado Boulder
National Unemployment
Source: Bureau of Labor Statistics (Seasonally Adjusted).
0.0
2.0
4.0
6.0
8.0
10.0
12.0
14.0
16.0
18.0
1994 1997 2000 2003 2006 2009 2012 2015
U-3
U-2
U-1
Percentage of Labor Force

Business Research Division | Leeds School of Business | University of Colorado Boulder
Labor Underutilization
Source: Bureau of Labor Statistics (Seasonally Adjusted).
0.0
2.0
4.0
6.0
8.0
10.0
12.0
14.0
16.0
18.0
1994 1997 2000 2003 2006 2009 2012 2015
U-6
U-5U-4U-3
U-2
U-1
Percentage of Labor Force

Business Research Division | Leeds School of Business | University of Colorado Boulder
Labor SlackNumber of Available People Per Job Opening
2
3
4
5
6
7
8
9
10
2000 2001 2002 2003 2004 2005 2006 2007 2008 2009 2010 2011 2012 2013 2014 2015
People per job opening
Ratio of people not in the labor force who want a job now and the total number of unemployed, divided by total number of job openings
Sources: BLS JOLTS, Labor Force, and Unemployment; Deutsche Bank Research.
Pre-recession average

Business Research Division | Leeds School of Business | University of Colorado Boulder
Labor Force and Unemployment RateNational, by Age Cohort, October 2015
70.8%
80.6% 82.3%79.4%
63.8%
0%
10%
20%
30%
40%
50%
60%
70%
80%
90%
20-24 25-34 35-44 45-54 55-64
Labor Force Participation Rate
Sources: Bureau of Labor Statistics, all data seasonally adjusted except for ages 55-64.
9.4%
5.3%
4.1%3.6%
3.3%
0%
2%
4%
6%
8%
10%
20-24 25-34 35-44 45-54 55-64
Unemployment Rate

Business Research Division | Leeds School of Business | University of Colorado Boulder
U.S. Income and Consumption
Sources: Consensus Forecasts.
-3.0
-2.0
-1.0
0.0
1.0
2.0
3.0
4.0
2006 2008 2010 2012 2014 2016
Percent Change
Real Personal Consumption
2.9%
-3.0
-2.0
-1.0
0.0
1.0
2.0
3.0
4.0
5.0
2006 2008 2010 2012 2014 2016
Percent Change
Real Disposable Income
2.8%

Business Research Division | Leeds School of Business | University of Colorado Boulder
Household WealthQ2 2000-Q2 2015
Source: Federal Reserve Board, Balance Sheet of Households and Nonprofit Organizations (B100) (Not Seasonally Adjusted).
-20
0
20
40
60
80
100
Q2 2000 Q2 2003 Q2 2006 Q2 2009 Q2 2012 Q2 2015
$ Trillions
Mutual
Funds
Corporate
Equities
Real
Estate
Other
Assets
Total
Liabilities

Business Research Division | Leeds School of Business | University of Colorado Boulder
Household Debt BurdenPercent of Disposable Income
Source: Federal Reserve, Household Debt Service and Obligations Ratios.
13.0
14.0
15.0
16.0
17.0
18.0
19.0
20.0
8.0
9.0
10.0
11.0
12.0
13.0
14.0
15.0
1980Q2 1983Q4 1987Q2 1990Q4 1994Q2 1997Q4 2001Q2 2004Q4 2008Q2 2011Q4 2015Q2
FORDSR

Business Research Division | Leeds School of Business | University of Colorado Boulder
0
20
40
60
80
100
120
140
160
1990 1992 1995 1997 2000 2002 2005 2007 2010 2012 2015
1985=100 Recession
8 months
United States
Mountain Region
Index of Consumer Confidence
Recession
18 months
Sources: The Conference Board and National Bureau of Economic Research.

Business Research Division | Leeds School of Business | University of Colorado Boulder
Vehicle Sales and Retail Sales
Sources: Seasonally Adjusted Annual Rate, Autodata Corp., Motor Intelligence, U.S. Census Bureau.
0
5,000
10,000
15,000
20,000
25,000
2005 2007 2009 2011 2013 2015
Vehicle SalesThousands, SAAR
-15.0
-10.0
-5.0
0.0
5.0
10.0
15.0
2005 2007 2009 2011 2013 2015
Retail and Food Services SalesYOY, Percentage Change

Business Research Division | Leeds School of Business | University of Colorado Boulder
Nominal Corporate Profits and U.S. Business Fixed Investment
-20.0
-15.0
-10.0
-5.0
0.0
5.0
10.0
15.0
20.0
25.0
30.0
2006 2008 2010 2012 2014 2016
Percent Change
Nominal Pre-Tax Corporate Profits
Sources: Bureau of Economic Analysis, Consensus Forecasts.
-20.0
-15.0
-10.0
-5.0
0.0
5.0
10.0
2006 2008 2010 2012 2014 2016
Percent Change
Business Fixed Investment
4.2%
4.0%

Business Research Division | Leeds School of Business | University of Colorado Boulder
ISM Indices
Source: Institute for Supply Management (ISM).
30
35
40
45
50
55
60
65
70
2003 2005 2007 2009 2011 2013 2015
ISM Manufacturing Index
30
35
40
45
50
55
60
65
70
2003 2005 2007 2009 2011 2013 2015
ISM Non-Manufacturing Index

Business Research Division | Leeds School of Business | University of Colorado Boulder
National FHFA Home Price GrowthYear over Year Q3 2015
Source: Federal Housing Finance Agency Home Price Index, All Transactions Index.

Business Research Division | Leeds School of Business | University of Colorado Boulder
Housing Affordability Index
Source: National Association of Realtors.
60
100
140
180
220
1981 1983 1985 1987 1989 1991 1993 1995 1997 1999 2001 2003 2005 2007 2009 2011 2013 2015
Composite Index

Business Research Division | Leeds School of Business | University of Colorado Boulder
National Housing Starts
Sources: U.S. Census Bureau and Consensus Forecasts.
1.3
0.0
0.5
1.0
1.5
2.0
2.5
2001 2002 2003 2004 2005 2006 2007 2008 2009 2010 2011 2012 2013 2014 2015 2016
Millions

Business Research Division | Leeds School of Business | University of Colorado Boulder
Federal Budget Balance
Sources: Bureau of Economic Analysis, NIPA Table 3.18B, Consensus Forecasts.
-1,600
-1,400
-1,200
-1,000
-800
-600
-400
-200
0
200
400
2001 2002 2003 2004 2005 2006 2007 2008 2009 2010 2011 2012 2013 2014 2015 2016
$ Billions
-$473

Business Research Division | Leeds School of Business | University of Colorado Boulder
Federal DebtPercentage of GDP
0
10
20
30
40
50
60
70
80
90
100
110
120
130
1943 1955 1967 1979 1991 2003 2015
Percent
Held by the Public
Sources: Office of Management and Budget, Federal Debt at End of Year (Table 7.1).
Gross Federal Debt

Business Research Division | Leeds School of Business | University of Colorado Boulder
Money, Interest Rates, and Prices

Business Research Division | Leeds School of Business | University of Colorado Boulder
Interest Rates
Sources: Federal Reserve and Moody’s.
0.0
1.0
2.0
3.0
4.0
5.0
6.0
7.0
2000 2001 2002 2003 2004 2005 2006 2007 2008 2009 2010 2011 2012 2013 2014 2015 2016 2017
Interest Rates, 2000-2017 (Forecast)Percent
10-Year T-Note
3-Month T-Bill

Business Research Division | Leeds School of Business | University of Colorado Boulder
National Inflation
-3.0
-2.0
-1.0
0.0
1.0
2.0
3.0
4.0
5.0
6.0
2001 2003 2005 2007 2009 2011 2013 2015
Year-over-Year Percent Change
All items
Shelter
All items less food
and energy
Source: Bureau of Labor Statistics (SA).

Business Research Division | Leeds School of Business | University of Colorado Boulder
Colorado Population, Employment, and Prices

Business Research Division | Leeds School of Business | University of Colorado Boulder
Change in Population
4th-fastest state for percentage growth
8th-fastest state for absolute growth
22nd-most populated state in nation
Continued net migration into the state
83% of population along Front Range
Source: Colorado Demography Office.
0
20
40
60
80
100
120
2004 2009 2014 2019 2024 2029 2034 2039
Thousands
Change in Colorado Population 2004-2040
Na
tura
l Incre
ase
Net M
igra
tion

Business Research Division | Leeds School of Business | University of Colorado Boulder
Colorado Employment GrowthJobs Added
Sources: Colorado Department of Labor and Employment, BEOF Committee Members.
-120
-100
-80
-60
-40
-20
0
20
40
60
80
100
2001 2002 2003 2004 2005 2006 2007 2008 2009 2010 2011 2012 2013 2014 2015 2016
Thousands
65,100

Business Research Division | Leeds School of Business | University of Colorado Boulder
Employment Change2015-2016
Natural Resources and Mining
Information
Other Services
Manufacturing
Financial Activities
Government
Leisure and Hospitality
Construction
Trade, Transportation, and Utilities
Education and Health Services
Professional and Business Services
-4 0 4 8 12 16Thousands of Jobs
Source: Bureau of Labor Statistics (Seasonally Adjusted).

Business Research Division | Leeds School of Business | University of Colorado Boulder
Colorado Ranking Among Other States
Metric 1-Year 3-Year 5-Year 10-Year
Real GDP Growth 5 3 9 9
Employment Growth 21 6 5 5
Population Growth 4 3 4 6
Personal Income Growth 7 1 3 9
PCPI Growth 9 12 23 29
PCPI 14 16 13 12
Average Annual Pay Growth 8 16 20 20
Average Annual Pay 13 12 12 12
Unemployment Rate 13 27 29 22
Labor Force 38 17 12 7
FHFA Home Price Index 1 5 6 4
Data Sources: Bureau of Economic Analysis, Bureau of Labor Statistics, U.S. Census Bureau, Federal Housing Finance Agency, and the
Colorado State Demography Office. BRD calculations. Note: 1-year, 3-year, and 5-year are based on the compound annual growth rate.

Business Research Division | Leeds School of Business | University of Colorado Boulder
Talent in ColoradoPercent Bachelor's Degree or Higher
0.0%
5.0%
10.0%
15.0%
20.0%
25.0%
30.0%
35.0%
40.0%
45.0%
We
st
Vir
gin
iaM
iss
issip
pi
Ark
an
sa
sK
en
tucky
Lo
uis
ian
aN
evad
aA
lab
am
aO
kla
ho
ma
Ind
ian
aId
ah
oT
en
ness
ee
So
uth
Ca
roli
na
Ne
w M
ex
ico
Oh
ioW
yo
min
gF
lori
da
Mic
hig
an
No
rth
Dak
ota
Mis
so
uri
Ari
zo
na
Iow
aS
ou
th D
ako
taT
ex
as
Ala
ska
Wis
co
nsin
No
rth
Caro
lin
aP
en
nsy
lvan
iaG
eo
rgia
Mo
nta
na
Ma
ine
Neb
rask
aR
ho
de I
sla
nd
Dela
wa
reO
reg
on
Haw
aii
Uta
hK
an
sas
Califo
rnia
Illi
no
isW
ash
ing
ton
Min
nes
ota
New
Yo
rkV
erm
on
tN
ew
…V
irg
inia
New
Je
rsey
Co
nn
ec
ticu
tM
ary
lan
dC
olo
rad
oM
assa
ch
usett
s
Source: U.S. Census Bureau, Educational Attainment, 2014 ACS.

Business Research Division | Leeds School of Business | University of Colorado Boulder
Construction
Value of Construction
Nonresidential
30%
Nonbuilding
14%
Residential
55%
Photo Courtesy www.rtd-fastracks.com

Business Research Division | Leeds School of Business | University of Colorado Boulder
Housing Units vs. Households
0
10,000
20,000
30,000
40,000
50,000
60,000
70,000
1994 1996 1998 2000 2002 2004 2006 2008 2010 2012 2014
Households
2000-2007 – 125,060
more housing units than
households
Annual Change
Housing Units
2008-2014 –113,230
more households than
housing units
Source: Colorado State Demography Office. Data as of September 2014.

Business Research Division | Leeds School of Business | University of Colorado Boulder
S&P/Case-Shiller Home Price Indices
Source: Standard & Poor’s (Not Seasonally Adjusted).
0.0% 2.0% 4.0% 6.0% 8.0% 10.0% 12.0%
Chicago
Washington D.C.
New York
Cleveland
Minneapolis
Charlotte
Boston
Phoenix
Detroit
Las Vegas
Atlanta
Los Angeles
Tampa
San Diego
Miami
Seattle
Dallas
Portland
Denver
San Francisco
September 2015
Percent Change

Business Research Division | Leeds School of Business | University of Colorado Boulder
0
5,000
10,000
15,000
20,000
25,000
30,000
35,000
40,000
45,000
2006 2007 2008 2009 2010 2011 2012 2013 2014 2015 2016
36,750
Residential Building Permits2006-2016
Sources: U.S. Census Bureau and Colorado Business Economic Outlook Committee.
Multifamily
Single
Family
Residential Housing:
• Home appreciation among the fastest nationally
• Mostly single family permits in 2016
• Lowest foreclosure rate in two decades

Business Research Division | Leeds School of Business | University of Colorado Boulder
Value of ConstructionResidential, 2006-2016
0
1,000
2,000
3,000
4,000
5,000
6,000
7,000
8,000
9,000
2006 2007 2008 2009 2010 2011 2012 2013 2014 2015 2016
$Millions $8.8 B
Sources: U.S. Census Bureau, Colorado Business Economic Outlook Committee.

Business Research Division | Leeds School of Business | University of Colorado Boulder
Value of ConstructionNonresidential, 2006-2016
0
1,000
2,000
3,000
4,000
5,000
6,000
2006 2008 2010 2012 2014 2016
$ Millions
$4,851.5
Sources: U.S. Census Bureau and Colorado Business Economic Outlook Committee. Photo courtesy of Denver International Airport.

Business Research Division | Leeds School of Business | University of Colorado Boulder
Value of ConstructionNonbuilding, 2006-2016
0
500
1,000
1,500
2,000
2,500
3,000
3,500
4,000
2006 2008 2010 2012 2014 2016
$ Millions
$3.2 B
Sources: Colorado Business Economic Outlook Committee and Dodge Construction
Analytics. Photo courtesy of RTD..

Business Research Division | Leeds School of Business | University of Colorado Boulder
Value of Construction2006-2016
Sources: McGraw-Hill Construction Dodge Research and Analytics and Colorado Business Economic Outlook Committee.
$16.8 B
0
2,000
4,000
6,000
8,000
10,000
12,000
14,000
16,000
18,000
2006 2007 2008 2009 2010 2011 2012 2013 2014 2015 2016
$ Millions
Nonbuilding
Residential
Nonresidential

Business Research Division | Leeds School of Business | University of Colorado Boulder
0
20
40
60
80
100
120
140
160
180
2006 2008 2010 2012 2014 2016
Thousands
160.2
Sources: Colorado Department of Labor and Employment and Colorado Business Economic Outlook Committee.
ConstructionEmployment, 2006-2016
Photo Courtesy of Breckenridge
Brewery.

Business Research Division | Leeds School of Business | University of Colorado Boulder
Real Estate Breakout Session
“How Long will This Hot Real Estate Market Last?”
Tom Thibodeau, Leeds School of Business
Tyler Carner, CBRE
Jeff Handlin, Anthem
Riki Hashimoto, Newmark Grubb Knight Frank
Pat Stucker, Jones Lang LaSalle
Doug Wulf, Cassidy Turley
Jay Landt, Colliers International

Business Research Division | Leeds School of Business | University of Colorado Boulder
Agriculture
Photo
court
esy
of Ji
ll Lam
bert
.

Business Research Division | Leeds School of Business | University of Colorado Boulder
Source: Colorado Business Economic Outlook Committee.
Gross Farm Revenue and Net Income2006-2016
0
1,000
2,000
3,000
4,000
5,000
6,000
7,000
8,000
9,000
10,000
2006 2008 2010 2012 2014 2016
$ Millions
Net Income
Farm Production
$7.7B
Photo courtesy of Sandy Wilt.

Business Research Division | Leeds School of Business | University of Colorado Boulder
Livestock Cash Receipts2006-2016
Source: Colorado Business Economic Outlook Committee.
1,000
2,000
3,000
4,000
5,000
6,000
2006 2008 2010 2012 2014 2016
$ Millions
$4.7B• 70% of total value of production in
Colorado
• Rebuilding herds
• Fed cattle prices continued to wane from 2011 high
• Number of cattle sales anticipated to drop to record low in 2015

Business Research Division | Leeds School of Business | University of Colorado Boulder
Commodity PricesWheat and Corn
Sources: Prices from U.S. Department of Agriculture (No. 1 hard red winter - ordinary protein, Kansas City, MO), Bloomberg (USDA
Toledo No. 2 Yellow Corn Not on the River Spot Price). Data through November 12, 2015.
0.0
2.0
4.0
6.0
8.0
10.0
12.0
14.0
2004 2005 2006 2007 2008 2009 2010 2011 2012 2013 2014 2015
Dollars
Wheat
Corn

Business Research Division | Leeds School of Business | University of Colorado Boulder
Crops Cash Receipts2006-2016
Source: Colorado Business Economic Outlook Committee.
0
500
1,000
1,500
2,000
2,500
3,000
2006 2008 2010 2012 2014 2016
$ Millions
$1.8B
• Corn prices lowest in five years
• Major crops: wheat, corn, and hay
• Cash receipts expected to fall for 2016
• Government payments expected to rise for 2016
• Innovation will play an increasing role for agriculture

Business Research Division | Leeds School of Business | University of Colorado Boulder
Manufacturing
Spro
ut
Tin
y H
om
es
built
in L
a J
unta
’s indust
rial park
. Photo
by D
iane G
raham
.

Business Research Division | Leeds School of Business | University of Colorado Boulder
Manufacturing and Total Jobs AddedColorado, 1991-2015
-150
-120
-90
-60
-30
0
30
60
90
120
1991 1993 1995 1997 1999 2001 2003 2005 2007 2009 2011 2013 2015
Thousands
Total Employment
Manufacturing
Source: Bureau of Labor Statistics.

Business Research Division | Leeds School of Business | University of Colorado Boulder
Manufacturing Employment2006-2016
110
115
120
125
130
135
140
145
150
2006 2008 2010 2012 2014 2016
Thousands
142,000
Source: Bureau of Labor Statistics and Colorado Business Economic Outlook Committee.
2016 impacts will include:
• Lower energy prices
• Interest rates
• Trans-Pacific Partnership
• Dollar strength
• Exports

Business Research Division | Leeds School of Business | University of Colorado Boulder
0
40
80
120
160
200
240
280
320
1859
1872
1885
1898
1911
1924
1937
1950
1963
1976
1989
2002
2015
Number of Breweries
Pro
hib
itio
n
Nondurable Goods1859-2015
Source: Colorado Brewers Guild.
• Account for 35% of manufacturing employment
• Food manufacturing largest subsector
• Food manufacturing adding the most jobs in 2016
• Colorado third for craft breweries

Business Research Division | Leeds School of Business | University of Colorado Boulder
Durable Goods
Account for 65% of manufacturing employment
2016 throughout sector:
• Nonmetallic minerals
• Fabricated metals
• Computer and electronic products
• Transportation equipment
• Other durables
Employment growth:
• 2.7% in 2015
• 1.8% in 2016

Business Research Division | Leeds School of Business | University of Colorado Boulder
Natural Resources and Mining

Business Research Division | Leeds School of Business | University of Colorado Boulder
0.0
20.0
40.0
60.0
80.0
100.0
120.0
140.0
160.0
2004 2005 2006 2007 2008 2009 2010 2011 2012 2013 2014 2015
Dollars per Barrel
November 16, 2015:
$41.68
November 17, 2014:
$75.64
June 3, 2008: $145.31
WTI Oil Price2004-2015
Average 2004-2015
Source: EIA, Cushing, OK WTI Spot Price FOB (Dollars per Barrel).

Business Research Division | Leeds School of Business | University of Colorado Boulder
0
20
40
60
80
100
120
2006 2008 2010 2012 2014 2016
Millions of Barrels
Crude Oil Production
Largest Producers
1. Texas
2. North Dakota
3. California
4. New Mexico
5. Alaska
6. Colorado
7. Oklahoma
8. Wyoming
9. Louisiana
10. Kansas
Production boosted by
Horizontal drilling
Hydraulic fracturing
2006-2016
Sources: Rankings from the Energy Information Administration. Production data from Colorado Geological Survey Mineral and Mineral Fuel Activity Reports, Colorado Oil and Gas Conservation Commission, Department of Minerals and Geology, and Colorado Business Economic Outlook Committee.
107.5

Business Research Division | Leeds School of Business | University of Colorado Boulder
0
200
400
600
800
1,000
1,200
1,400
1,600
1,800
2006 2008 2010 2012 2014 2016
Billions of Cubic Feet
Natural Gas Production2006-2016
Sources: Colorado Geological Survey Mineral and Mineral Fuel Activity Reports, Colorado Oil and Gas Conservation Commission,Department of Minerals and Geology, and Colorado Business Economic Outlook Committee.
1,475
• Seventh-largest producing state
• Average residential gas prices in Colorado for 2014 were the fourth-lowest in the country
• Net exporter of natural gas
• Total value of production stagnant due to prices

Business Research Division | Leeds School of Business | University of Colorado Boulder
Coal Production2006-2016
0
5
10
15
20
25
30
35
40
2006 2008 2010 2012 2014 2016
Short Tons (Millions)
19.0
Sources: Colorado Geological Survey Mineral and Mineral Fuel Activity Reports, Colorado Oil and Gas Conservation Commission,Department of Minerals and Geology, and Colorado Business Economic Outlook Committee.
• Supplies 60% of Colorado’s energy
• State ranking slipped to 11th
in 2015
• Ships to 21 states
• Decreasing demand from TVA
• Power plants divesting from coal

Business Research Division | Leeds School of Business | University of Colorado Boulder
Colorado Severance Taxes2005-2015
Sources: Energy Information Association (EIA), Cushing, OK WTI Spot Price FOB; Colorado Department of Revenue, Colorado Office of State Planning and Budgeting.
$0
$50
$100
$150
$200
$250
$300
$350
2005 2006 2007 2008 2009 2010 2011 2012 2013 2014 2015
$50
$60
$70
$80
$90
$100
$110
$120
Severance Taxes, 12-Mo. Rolling Sum
WTI, 12-Mo. Ave. $/Barrel
WTI Spot Price
(R Axis)
Severance Taxes
(L Axis)

Business Research Division | Leeds School of Business | University of Colorado Boulder
Renewables
• First renewable portfolio standard in the country
• Includes wind, solar, hydro, geothermal, and biomass
• 17.8% of net generation in 2014
• Most of Colorado’s renewable energy comes from wind resources
• Colorado ranks 10th nationally for total megawatts installed for wind energy
Photo courtesy of Juan Altamirano.

Business Research Division | Leeds School of Business | University of Colorado Boulder
Natural Resources and MiningWorkers Added, 2006-2016
Sources: Colorado Geological Survey Mineral and Mineral Fuel Activity Reports, Colorado Oil and Gas Conservation Commission,Department of Minerals and Geology, and Colorado Business Economic Outlook Committee.
-5
-4
-3
-2
-1
0
1
2
3
4
5
2006 2008 2010 2012 2014 2016
Thousands
-1.3
Making Sense of
Commodities Prices
-Mt. Sopris Room B

Business Research Division | Leeds School of Business | University of Colorado Boulder
-50
-40
-30
-20
-10
0
10
20
2006 2009 2012 2015
Goods-Producing Workers Added 2006-2016
10.6
Thousands
Mining1%
Construction6%
Manufacturing6%
Services-Producing
87%
Goods-Producing Share of Colorado Employment
Sources: Colorado Department of Labor and Employment and Colorado Business Economic Outlook Committee.
Goods-Producing Employment

Business Research Division | Leeds School of Business | University of Colorado Boulder
International Trade
Top 15 Export Destinations
Canada
Mexico
China
Japan
Malaysia
Korea, Republic Of
Netherlands
Switzerland
United Kingdom
Germany
Hong Kong
Taiwan
Philippines
Australia
Belgium
Major Export Destinations
Canada20%
Mexico13%
China (Mainland)
8%
Japan6%
Netherlands4% Malaysia
4%
Republic of Korea
4%
Hong Kong3%
Other38%
Export Destinations
Sources: World Institute for Strategic Economic Research and Colorado Business Economic Outlook Committee.

Business Research Division | Leeds School of Business | University of Colorado Boulder
International Trade
Factors Impacting Trade
• Slower economic growth in some international economies
• Strengthening of U.S. dollar
• Trans-Pacific Partnership
Source: Federal Reserve Board.
90.00
95.00
100.00
105.00
110.00
115.00
120.00
125.00
130.00
135.00
2000 2003 2006 2009 2012 2015
Indexed, 1973=100
Nominal Broad Dollar Index

Business Research Division | Leeds School of Business | University of Colorado Boulder
Colorado ExportsValue of Exports, 2006-2015
0
1,000
2,000
3,000
4,000
5,000
6,000
7,000
8,000
9,000
10,000
2006 2007 2008 2009 2010 2011 2012 2013 2014 2015
$ Millions
$8,229
Sources: World Institute for Strategic Economic Research and Colorado Business Economic Outlook Committee.
Business Research Division | Leeds School of Business | University of Colorado Boulder
Colorado Agricultural Exports
Photo courtesy of Brigitte Shafer.

Business Research Division | Leeds School of Business | University of Colorado Boulder
Trade, Transportation, and Utilities
Photo courtesy of Denver International Airport.

Business Research Division | Leeds School of Business | University of Colorado Boulder
Wholesale Trade
Employment growth at a slower pace
Dominated by merchant wholesalers in durable goods
Durables: computers, electronics
Nondurables: groceries
Workers Added, 2006-2016
-8
-6
-4
-2
0
2
4
6
2006 2008 2010 2012 2014 2016
Thousands
3.1
Sources: Colorado Department of Labor and Employment and Colorado Business Economic Outlook Committee.

Business Research Division | Leeds School of Business | University of Colorado Boulder
$0.00
$0.50
$1.00
$1.50
$2.00
$2.50
$3.00
$3.50
$4.00
$4.50
2005 2006 2007 2008 2009 2010 2011 2012 2013 2014 2015
Dollars per Gallon
November 30, 2015:
US $2.17
CO $2.01
December 1, 2014:
US $2.86
CO $2.84
July 7, 2008:
US $4.17
CO $4.03
Colorado Gasoline Prices 2005-2015
Source: Weekly Colorado All Grades All Formulations Retail Gasoline Prices (Dollars per Gallon).
Average 2004-2014

Business Research Division | Leeds School of Business | University of Colorado Boulder
Retail Trade Sales
Sources: Colorado Department of Revenue and Colorado Business Economic Outlook Committee.
5.6
-15.0
-10.0
-5.0
0.0
5.0
10.0
2006 2008 2010 2012 2014 2016
Percent Change
Nominal Growth
Real Growth
Colorado Retail Trade Sales
2006-2016
50
55
60
65
70
75
80
85
90
95
2001 2003 2005 2007 2009 2011 2013 2015
Colorado Taxable Retail Sales12-Month Rolling Sum
12-Month Rolling Sum,
$ Millions
70 Months

Business Research Division | Leeds School of Business | University of Colorado Boulder
DIA Enplanements and Deplanements2005-2015
0
10
20
30
40
50
60
2005 2007 2009 2011 2013 2015
Millions
53.5
Sources: Denver International Airport and Colorado Business Economic Outlook Committee.

Business Research Division | Leeds School of Business | University of Colorado Boulder
Transportation and WarehousingEmployment
-5
-4
-3
-2
-1
0
1
2
3
4
2006 2007 2008 2009 2010 2011 2012 2013 2014 2015 2016
ThousandsTransportation and Warehousing Jobs Added
2006-2016
2.0
Sources: Colorado Department of Labor and Employment and Colorado Business Economic Outlook Committee.

Business Research Division | Leeds School of Business | University of Colorado Boulder
Electricity and Natural Gas Consumption
0
10,000
20,000
30,000
40,000
50,000
60,000
70,000
2006 2008 2010 2012 2014 2016
Million kWhElectricity Consumption
2006-2016
54,262
0
100
200
300
400
500
600
2006 2008 2010 2012 2014 2016
Billion Cubic Feet
Natural Gas Consumption 2006-2016
481.8
Sources: Edison Electrical Institute Statistical Yearbook, Xcel Energy, and Colorado Business Economic Outlook Committee.

Business Research Division | Leeds School of Business | University of Colorado Boulder
0
50
100
150
200
250
300
350
400
450
500
2006 2007 2008 2009 2010 2011 2012 2013 2014 2015 2016
Thousands
Utilities
Retail
Trade
Wholesale
Trade
454.8
Transportation
Sources: Colorado Department of Labor and Employment and Colorado Business Economic Outlook Committee.
Trade, Transportation, and UtilitiesEmployment, 2006-2016

Business Research Division | Leeds School of Business | University of Colorado Boulder
Information

Business Research Division | Leeds School of Business | University of Colorado Boulder
-4.0%
-2.0%
0.0%
2.0%
4.0%
6.0%
8.0%
10.0%
12.0%
2000 2002 2004 2006 2008 2010 2012 2014
$0
$5
$10
$15
$20
$25
Percentage Change
$22.3
$ Billions,
Chained 2009
Information GDP2000-2014
Sources: Colorado Department of Labor and Employment and Colorado Business Economic Outlook Committee.

Business Research Division | Leeds School of Business | University of Colorado Boulder
Publishing
-3.0
-2.0
-1.0
0.0
2006 2008 2010 2012 2014 2016
Publishing Workers Added, 2006-2016
-0.1
Thousands
Sources: Colorado Department of Labor and Employment and Colorado Business Economic Outlook Committee.

Business Research Division | Leeds School of Business | University of Colorado Boulder
Telecommunications2006-2016
-2.0
-1.5
-1.0
-0.5
0.0
0.5
1.0
1.5
2006 2008 2010 2012 2014 2016
0.2
Thousands
Telecom, 39%
Other, 33%
Information Employment
Publishing,
28%
Sources: Colorado Department of Labor and Employment and Colorado Business Economic Outlook Committee.

Business Research Division | Leeds School of Business | University of Colorado Boulder
Colorado’s Film Industry
Colorado Film Tourism
The Hateful Eight
Dear Eleanor
Heaven Sent
Fast and Furious 7
Cop Car

Business Research Division | Leeds School of Business | University of Colorado Boulder
Financial Activities
70%
30%
Financial Activities Employment
Finance and Insurance
Source: Colorado Business Economic Outlook Committee

Business Research Division | Leeds School of Business | University of Colorado Boulder
600
800
1,000
1,200
1,400
1,600
1,800
2,000
2,200
2,400
2008 2009 2010 2011 2012 2013 2014 2015
-53%
203%
Price in Dollars
Securities TrendsS&P 500 Index, 2008-2015 YTD
Source: Bloomberg.

Business Research Division | Leeds School of Business | University of Colorado Boulder
The FEDBalance Sheet, 2007-2015
• QE 1, QE 2, QE 3
• Fed promises near zero interest rates until mid-2013, 2014, 2015, 2016
• Operation Twist
• Swaps
• Tapering
• Tapering Complete
• Federal Funds Rate Increase?
0
500,000
1,000,000
1,500,000
2,000,000
2,500,000
3,000,000
3,500,000
4,000,000
4,500,000
5,000,000
2007 2008 2009 2010 2011 2012 2013 2014 2015
Other Assets
Mortgage BackedSecurities
Federal Agency DebtSecurities
Treasury Securities
$ Millions
Source: Federal Reserve Balance Sheet.

Business Research Division | Leeds School of Business | University of Colorado Boulder
-2%
0%
2%
4%
6%
8%
10%
12%
14%
16%
18%
1994 1997 2000 2003 2006 2009 2012 2015
$0
$20,000
$40,000
$60,000
$80,000
$100,000
$120,000
$140,000
Percent ChangeDeposits, Millions
Percent Change
Deposits
Colorado Bank Deposits1994-2015
Source: FDIC, Deposit Market Share Report.

Business Research Division | Leeds School of Business | University of Colorado Boulder
Improving capital structures in banks
Raising new capital is expensive for smaller banks
Solid loan demand
Improvement in loan portfolios
Decline in acquisitions by large banks
Regulatory environment causing some banks to opt out of making mortgage loans
Banking Trends

Business Research Division | Leeds School of Business | University of Colorado Boulder
Regulation
Dodd-Frank Act Rulemaking
• Real estate lending “7 rules”
Growing compliance costs
Regulation uncertainty
Customers on the margin are excluded due to tightened regulation
and greater regulatory complexity with regards to loans
TILA-RESPA went into effect in August 2015
Smaller loan interest margins limit revenues

Business Research Division | Leeds School of Business | University of Colorado Boulder
Colorado Insurance Trends
Modest job growth in 2015 and 2016
Premium increases for property and casualty subsector
Increased number of insurance agency mergers and acquisitions
Health rates expected to increase 2016

Business Research Division | Leeds School of Business | University of Colorado Boulder
Commercial Real Estate Trends
Colorado ranked fourth-best state for a STEM-focused economy
Rising rents and decreasing vacancies
Lowest post-recession retail vacancy rate in Denver (5.9%)
Statewide economic growth driving real estate activity

Business Research Division | Leeds School of Business | University of Colorado Boulder
0
10,000
20,000
30,000
40,000
50,000
60,000
70,000
80,000
2004 2006 2008 2010 2012 2014
Total State Foreclosures Over Time
Filings
Sales
Colorado Foreclosures2004-2015
Source: Colorado Division of Housing
2014 2015
June YTD2014-2015

Business Research Division | Leeds School of Business | University of Colorado Boulder
Federal Housing Finance Agency (FHFA)House Price Index by MSA
Source: Federal Housing Finance Agency, All Transactions Indexes.
0.0 3.0 6.0 9.0 12.0 15.0
Grand Junction
Colorado Springs
Pueblo
Greeley
Fort Collins
Boulder
Denver-Aurora-Lakewood
Percent
Colorado 12.7%
Q3 2014 – Q3 2015
0.0 1.0 2.0 3.0 4.0
Grand Junction
Colorado Springs
Pueblo
Greeley
Fort Collins
Boulder
Denver-Aurora-Lakewood
Percent
Colorado 2.5%
CAGR Q3 2005 – Q3 2015

Business Research Division | Leeds School of Business | University of Colorado Boulder
-10.0
-8.0
-6.0
-4.0
-2.0
0.0
2.0
4.0
6.0
2006 2007 2008 2009 2010 2011 2012 2013 2014 2015 2016
Thousands
2.6
Sources: Colorado Department of Labor and Employment and Colorado Business Economic Outlook Committee.
Financial Activities Employment2006-2016

Business Research Division | Leeds School of Business | University of Colorado Boulder
Professional and Business Services
Management of
Companies and
Enterprises
9%
Administrative and
Support and Waste
Management
Services
40%
Professional,
Scientific, and
Technical
Services
51%

Business Research Division | Leeds School of Business | University of Colorado Boulder
Legal 10%
Architectural and Engineering
23%
Computer Systems Design
25%
Management, Scientific,
and Technical
Consulting11%
Other 31%
PST Employment
-8.0
-3.0
2.0
7.0
12.0
2006 2008 2010 2012 2014 2016
PST Workers Added 2006-2016
8.7
Thousands
Sources: Colorado Department of Labor and Employment and Colorado Business Economic Outlook Committee.
Professional, Scientific, and Technical Services

Business Research Division | Leeds School of Business | University of Colorado Boulder
Management of Companies and Enterprises2006-2016
-0.5
0.0
0.5
1.0
1.5
2.0
2.5
3.0
2006 2008 2010 2012 2014 2016
0.9
Thousands
Sources: Colorado Department of Labor and Employment and Colorado Business Economic Outlook Committee.
Most diverse sector of PBS, includes broad cross-section of headquarters and regional offices
Sells nationally and globally
Colorado remains an appealing place to locate company headquarters

Business Research Division | Leeds School of Business | University of Colorado Boulder
Moderated by:
Ellen Balaguer, Retired Senior Executive, Accenture
Panelists:
Matt Erickson, Zayo Group
Brian McDonald, Charles Schwab
Joe Mello, DaVita HealthCare Partners
Mary Rhinehart, Johns Manville
CEO Panel

Business Research Division | Leeds School of Business | University of Colorado Boulder
Administrative and Waste Services
Building and Dwellings,
27%
Business Support,
16%
Other, 25%
Admin and Waste Services Employment
Employment
Services,
29%
-16.0
-12.0
-8.0
-4.0
0.0
4.0
8.0
2006 2008 2010 2012 2014 2016
Admin and Waste Services Workers Added 2006-2016
5.8
Thousands
Sources: Colorado Department of Labor and Employment and Colorado Business Economic Outlook Committee.

Business Research Division | Leeds School of Business | University of Colorado Boulder
-25.0
-20.0
-15.0
-10.0
-5.0
0.0
5.0
10.0
15.0
20.0
2006 2007 2008 2009 2010 2011 2012 2013 2014 2015 2016
Thousands
15.5
Sources: Colorado Department of Labor and Employment and Colorado Business Economic Outlook Committee.
Professional and Business ServicesWorkers Added, 2006-2016

Business Research Division | Leeds School of Business | University of Colorado Boulder
Leisure and Hospitality
Photo
court
esy
of:
Colo
rado S
tate
Park
s.

Business Research Division | Leeds School of Business | University of Colorado Boulder
-15.0
-10.0
-5.0
0.0
5.0
10.0
15.0
2006 2007 2008 2009 2010 2011 2012 2013 2014 2015 2016
Thousands
7.4
Accommodation & Food ServicesWorkers Added, 2006-2016
Sources: Colorado Department of Labor and Employment and Colorado Business Economic Outlook Committee.

Business Research Division | Leeds School of Business | University of Colorado Boulder
0
10
20
30
40
50
60
70
2008 2010 2012 2014 2016
Millions
Public Lands Visits2008-2016
57.7
Sources: National Park Service and Colorado Business Economic Outlook Committee.
Colorado Public Lands Visits
Photo courtesy of: Colorado State Parks.

Business Research Division | Leeds School of Business | University of Colorado Boulder
Skier Visits
Photo Courtesy of: steamboatpowdercats.com

Business Research Division | Leeds School of Business | University of Colorado Boulder
-12
-10
-8
-6
-4
-2
0
2
4
6
8
10
12
14
2006 2008 2010 2012 2014 2016
9.0
Thousands
Sources: Colorado Department of Labor and Employment and Colorado Business Economic Outlook Committee.
Leisure and HospitalityWorkers Added 2006-2016
• 1-in-8 Colorado jobs
• Industry among the first to add workers after
the recession
• Stronger household balance sheets and
increased income
• Increase in consumer spending in restaurants

Business Research Division | Leeds School of Business | University of Colorado Boulder
Education and Health Services

Business Research Division | Leeds School of Business | University of Colorado Boulder
Private Education
Includes:
• Elementary and Secondary Schools
• Colleges, Universities, and Professional Schools
• Sports and Recreation Instruction
• Cosmetology and Barber Schools
• Fine Arts Schools
• Exam Preparation and Tutoring
• Automobile Driving Schools

Business Research Division | Leeds School of Business | University of Colorado Boulder
Private EducationEmployment, 2006-2016
Sources: Colorado Department of Labor and Employment and Colorado Business Economic Outlook Committee.
0
5
10
15
20
25
30
35
40
2006 2007 2008 2009 2010 2011 2012 2013 2014 2015 2016
Thousands37.9

Business Research Division | Leeds School of Business | University of Colorado Boulder
Health Care Services
11% of Colorado jobs
Consistent employment growth
Obesity among Coloradoans growing
Growing senior population
Insurance coverage expanding4.8%
1.8%
1.7%
3.7%
1.0% 2.0% 3.0% 4.0% 5.0%
SocialAssistance
Nursing Care
Hospitals
Ambulatory
Health Care Services Employment Growth, Annualized, 2007-2015
CAGR
Sources: Colorado Department of Labor and Employment and Colorado Business Economic Outlook Committee.

Business Research Division | Leeds School of Business | University of Colorado Boulder
Health Care ServicesMajor Trends
• Growth of patient population outpacing growth of
healthcare providers
• Average annual wage is below statewide average
• Sustained growth expected because of:
– Aging population
– Greater number of people eligible for health
insurance
– Growing rates of diabetes and obesity

Business Research Division | Leeds School of Business | University of Colorado Boulder
Health Care ServicesOccupations
• Above average patient to physician ratio
compared to the nation
• Nurse practitioners are growing the
quickest of the healthcare occupations,
both statewide and nationally
• Registered nurses are the largest segment
of primary care
• Growing demand for long-term services
and support (LTSS) workforce with aging
population

Business Research Division | Leeds School of Business | University of Colorado Boulder
Health Care ServicesLegislation
• 93.3% of Colorado’s population now
has health insurance due to the
passing of the PPACA
• Increasing insurance premiums
• Growing number of underinsured
Coloradoans
• Higher premiums for individual
insurance coverage
Business Research Division | Leeds School of Business | University of Colorado Boulder
0
50
100
150
200
250
300
350
2006 2007 2008 2009 2010 2011 2012 2013 2014 2015 2016
Thousands
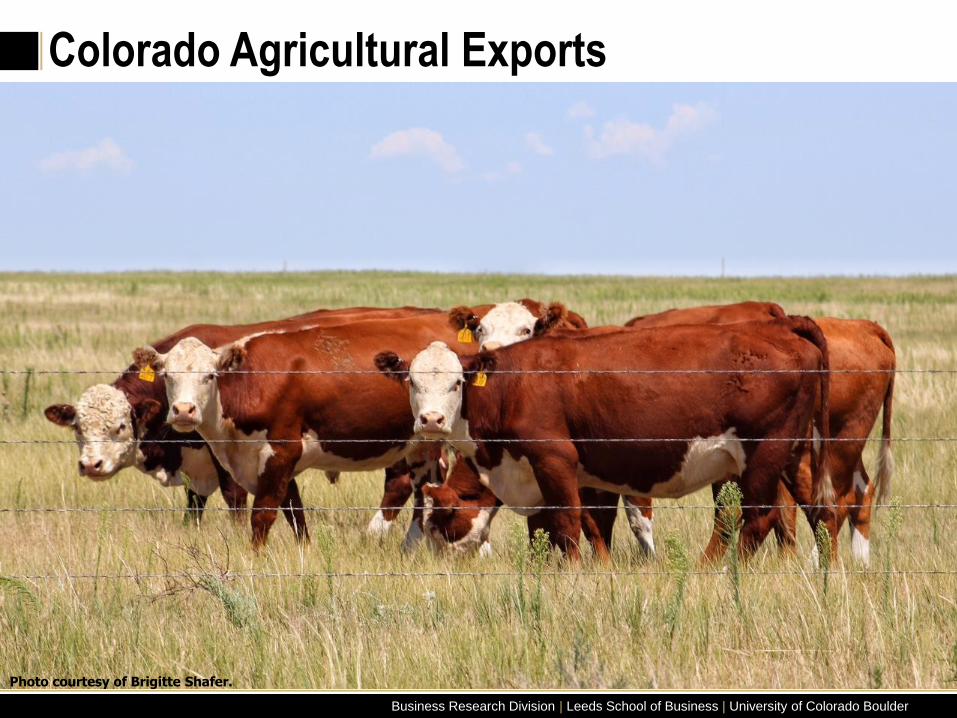
323
Education
Health Care and Social Assistance
Education and Health ServicesEmployment, 2006-2016
Sources: Colorado Department of Labor and Employment and Colorado Business Economic Outlook Committee.

Business Research Division | Leeds School of Business | University of Colorado Boulder
Other Services
Repair and Maintenance
Personal and Laundry Services
Nonprofit Associations(Religious, Grantmaking,
Civic, Professional, andSimilar Organizations)
Workers Added, 2006-2016
Sources: Colorado Department of Labor and Employment and Colorado Business Economic Outlook Committee.
-2
-1
0
1
2
3
4
2006 2008 2010 2012 2014 2016
1.9
Thousands

Business Research Division | Leeds School of Business | University of Colorado Boulder
GovernmentEmployment, 2006-2016
340,000
350,000
360,000
370,000
380,000
390,000
400,000
410,000
420,000
430,000
2006 2008 2010 2012 2014 2016
418,200
Sources: Colorado Department of Labor and Employment and Colorado Business Economic Outlook Committee.

Business Research Division | Leeds School of Business | University of Colorado Boulder
Government Employment
Federal13%
State (General)10%
State (Education)16%
Local (General)29%
Local (Education)32%

Business Research Division | Leeds School of Business | University of Colorado Boulder
Federal GovernmentWorkers Added, 2006-2016
-2.0
-1.0
0.0
1.0
2.0
3.0
2006 2008 2010 2012 2014 2016
0.4
Thousands
Sources: Colorado Department of Labor and Employment and Colorado Business Economic Outlook Committee.

Business Research Division | Leeds School of Business | University of Colorado Boulder
State GovernmentWorkers Added, 2006-2016
0.0
2.0
4.0
6.0
8.0
10.0
12.0
2006 2008 2010 2012 2014 2016
Thousands
0.7
Sources: Colorado Department of Labor and Employment and Colorado Business Economic Outlook Committee, Photo courtesy of coloradopreservation.org.*Note: 2013 increase partially due to reclassification of employees.

Business Research Division | Leeds School of Business | University of Colorado Boulder
Colorado General FundGross Revenue (excluding reserves, diversions, and transfers)
Source: Colorado Office of State Planning and Budgeting, excluding reserves, diversions, and transfers, December 2014.
6,000
6,600
7,200
7,800
8,400
9,000
9,600
10,200
10,800
11,400
12,000
FY 2007 FY 2008 FY 2009 FY 2010 FY 2011 FY 2012 FY 2013 FY 2014 FY 2015 FY 2016 FY 2017 FY 2018
$ Millions

Business Research Division | Leeds School of Business | University of Colorado Boulder
Local GovernmentWorkers Added, 2006-2016
-3
-2
-1
0
1
2
3
4
5
6
7
2006 2008 2010 2012 2014 2016
Thousands
2.3
Sources: Colorado Department of Labor and Employment and Colorado Business Economic Outlook Committee.
Revenue Sources:
Property taxes
Sales and use taxes
Fees
Intergovernmental revenues

Business Research Division | Leeds School of Business | University of Colorado Boulder
Colorado Property Tax Revenue
$0
$1,000
$2,000
$3,000
$4,000
$5,000
$6,000
$7,000
$8,000
2005 2006 2007 2008 2009 2010 2011 2012 2013 2014
Rural
Millions
Urban and Rural, 2005-2014
Source: Colorado Department of Local Affairs.
Urban

Business Research Division | Leeds School of Business | University of Colorado Boulder
0
100,000
200,000
300,000
400,000
500,000
600,000
700,000
800,000
900,000
1,000,000
2004 2006 2008 2010 2012 2014
Public School Enrollment Student
Enrollment
EducationPublic Enrollment, 2004-2014
0
50,000
100,000
150,000
200,000
250,000
2004 2006 2008 2010 2012 2014
Student Enrollment
Higher Education Enrollment All Levels
Source: Colorado Department of Education and Colorado Department of Higher Education
Charter Schools
Traditional K-12

Business Research Division | Leeds School of Business | University of Colorado Boulder
-80
-60
-40
-20
0
20
40
60
80
2006 2008 2010 2012 2014 2016
Services-Producing Workers Added 2006-2016
54.5
Thousands
Sources: Colorado Department of Labor and Employment and Colorado Business Economic Outlook Committee.
Trade, Transportation,
and Utilities18%
Information
3%Financial Activities
6%
Professional and Business Services
16%
Private Education and Health
12%
Leisure and Hospitality
12%
Other4%
Government16%
Goods-Producing
13%
Services-Producing Employment
Services-Producing Employment

Business Research Division | Leeds School of Business | University of Colorado Boulder
Colorado Employment GrowthJobs Added, 1991-2016
-150
-100
-50
0
50
100
1991 1996 2001 2006 2011 2016
Thousands
Sources: Bureau of Economic Analysis, NIPA Table 3.18B, Consensus Forecasts.
Best
years
since
2000

Business Research Division | Leeds School of Business | University of Colorado Boulder
International and National Summary
Global output and trade growth
Value of the dollar strengthening
GDP growth nearing potential
Balance sheets getting stronger
Rising (but low) interest rates
Subdued inflation

Business Research Division | Leeds School of Business | University of Colorado Boulder
State Summary
Colorado outperforms nation in
employment growth
Falling unemployment
Labor force pressures
Full employment
Growing population
Strong in-migration

Business Research Division | Leeds School of Business | University of Colorado Boulder
Concerns
Fed funds target rate
Cost of housing
Availability of labor
Price of oil
El Niño
Median family income