Economic Indicators Comparative GDP Growth ( 3.9% of global GDP / 15% of global growth )
33
W O R L D T R A D E G R O U P . L L P . B u s in es s O u tllo o k IN C H IN A A B r e a k fa s t R o u n d -T ab le
-
Upload
meryl-nichols -
Category
Documents
-
view
219 -
download
0
Transcript of Economic Indicators Comparative GDP Growth ( 3.9% of global GDP / 15% of global growth )

W O R L D T R A D E G R O U P . L L P .
B u s i n e s s O u t l l o o k I N
C H I N A
A B r e a k f a s t R o u n d - T a b l e

WORLD TRADE GROUP. LLP.
China at a Glance
Slightly smaller than the US
1.3 billion people
Population growth rate of 0.9%
23 provinces / 6 special administrative regions / 5 state-governed municipalities
Counties / Cities / Villages

WORLD TRADE GROUP, LLP.

WORLD TRADE GROUP, LLP.

WORLD TRADE GROUP, LLP.
WORLD TRADE GROUP. LLP.
-5
0
5
10
15
20
25
Ann
ual G
row
th R
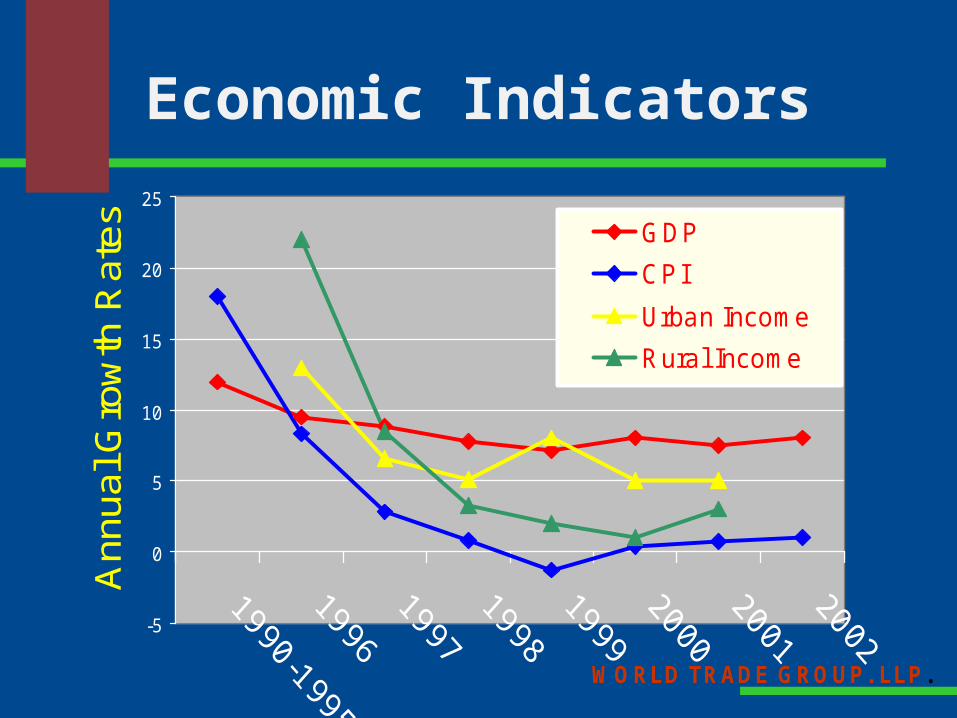
ates GDP
CPI
Urban Income
Rural Income
Economic Indicators

-1
0
1
2
3
4
5
6
7
8
9
China Aisa-Pacificw/o China
US World
An
nu
al G
DP
Gro
wth
(%
)
1999
2000
2001
2002
Comparative GDP Growth( 3.9% of global GDP / 15% of global growth )
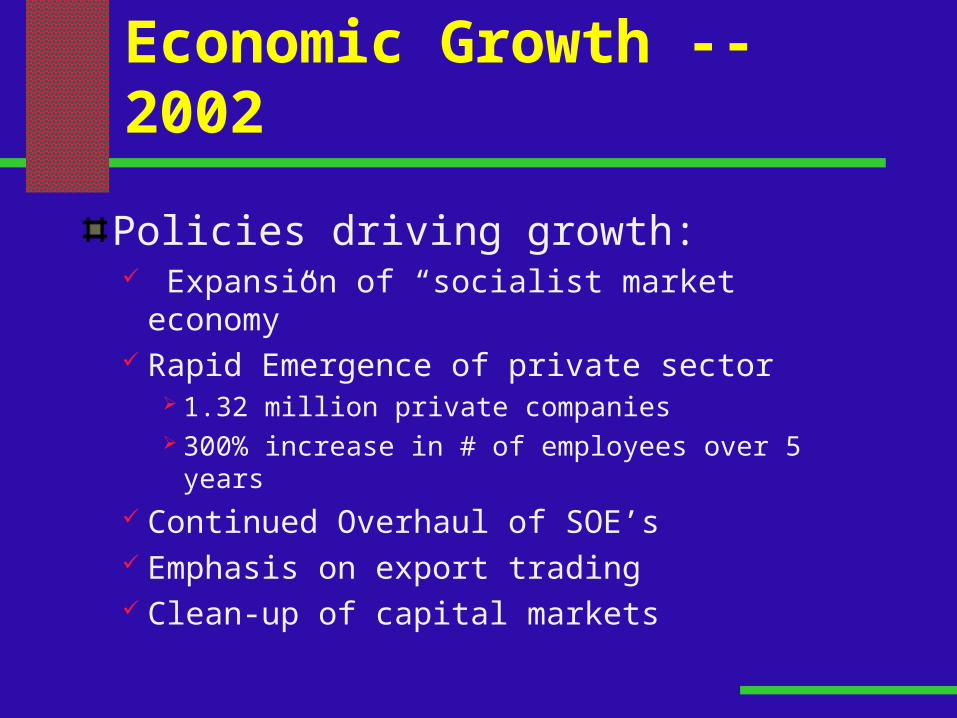
Economic Growth -- 2002
Policies driving growth: Expansion of “socialist market economy” Rapid Emergence of private sector
1.32 million private companies 300% increase in # of employees over 5 years
Continued Overhaul of SOE’s Emphasis on export trading Clean-up of capital markets

Economic Growth -- 2002
Market sectors driving growth Manufacturing – 35% of GDP Exports – 26% of GDP Infrastructure expansion 10% – 15% of GDP Foreign investment – $52 billion Capital Markets
Domestic consumption

Government Initiatives and Projects
SOE overhaul and privatization Financial services
Banking overhaul Insurance services Asset management Investment services
Agricultural modernization

Government Initiatives and Projects -- continued
Home ownership – 30% growth Technology development Developing Western provinces Infrastructure projects (water / waste / roads
/ power / airports / Yangtze project) Environmental clean up – 1% of GDP 2008 Olympics 2010 World Expo
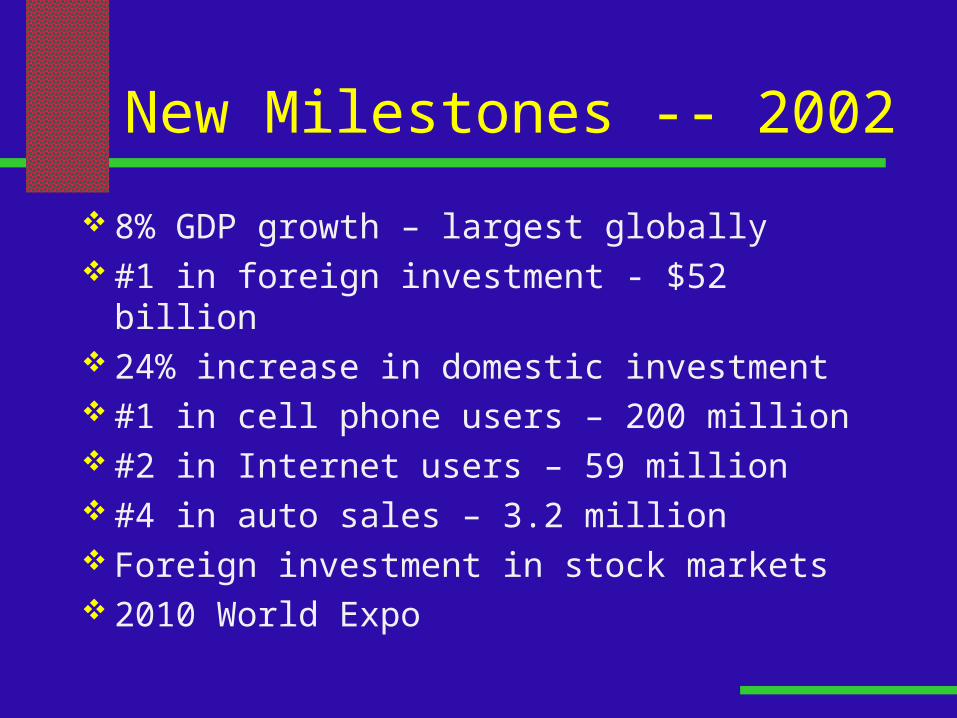
New Milestones -- 2002
8% GDP growth – largest globally #1 in foreign investment - $52 billion 24% increase in domestic investment #1 in cell phone users – 200 million #2 in Internet users – 59 million #4 in auto sales – 3.2 million Foreign investment in stock markets 2010 World Expo

Change in Leadership
Hu Jintao New Chairman of Central Committee – CCP President – March, 2003 Maoist leanings and ideals Rejuvenation of Party Continuation of private sector expansion “Spreading the growth” to inner Provinces Social security and health care benefits

Major Exports - 2002
Apparel, clothing & footwear
Machinery, parts & transportation equip.
Textiles & yarn
Chemical industrial products
Furniture, housewares, toys, handicrafts
Food stuffs
Electrical equipment & parts

Major Imports - 2002
Electrical equipment & parts
Machinery & parts
Transportation equip.
Crude oil and fuels
Plastics and plastic articles

W O R L D T R A D E G R O U P . L L P .
C h in a ’ s L e a d in g M a r k e t s
U S
H K
J A P A N
E U
O T H E R
W O R L D T R A D E G R O U P . L L P .
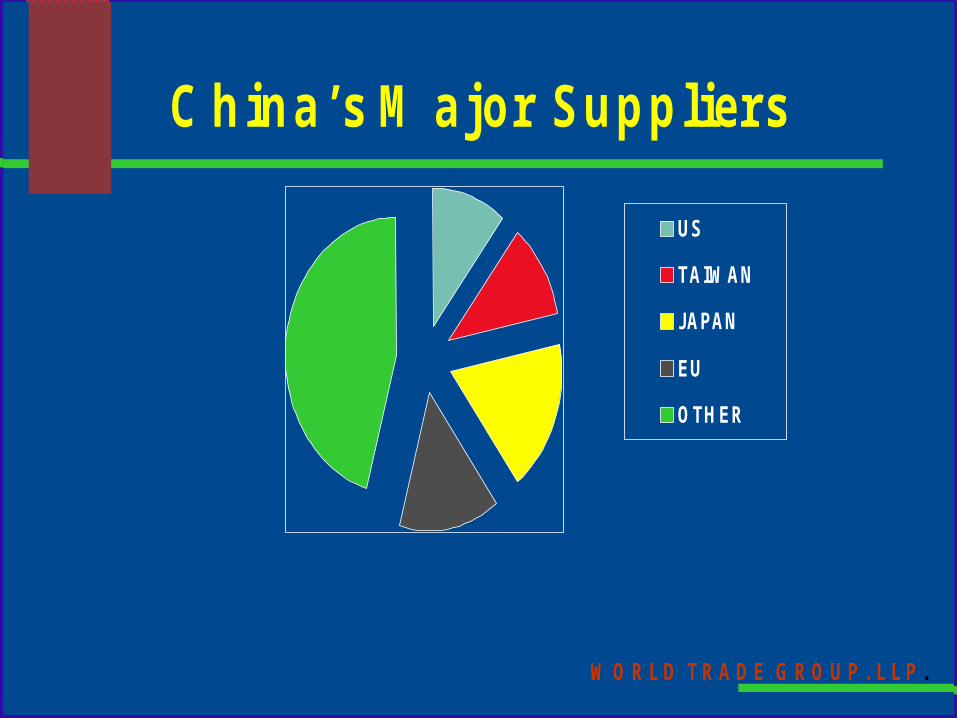
Economic Indicators
US
TAIWAN
JAPAN
EU
OTHER
C h in a ’ s M a jo r S u p p l ie r s

Table 1: China's Trade with the World ($ billion)
1996 1997 1998 1999 2000 2001
Exports 151 182 183 194 249
Imports 138 142 140 165 225
Total 289 325 324 360 474
266
243
509
2002
550

WORLD TRADE GROUP. LLP.
Table 5: China's Trade with the United States ($ billion)
1996 1997 1998 1999 2000 2001
US Exports 12.0 12.8 14.3 13.1 16.3
US Imports 51.5 62.5 71.2 81.8 100.1
Total 63.5 75.3 85.4 94.9 116.4
2002
19.1
102.2
121.3
WORLD TRADE GROUP. LLP.
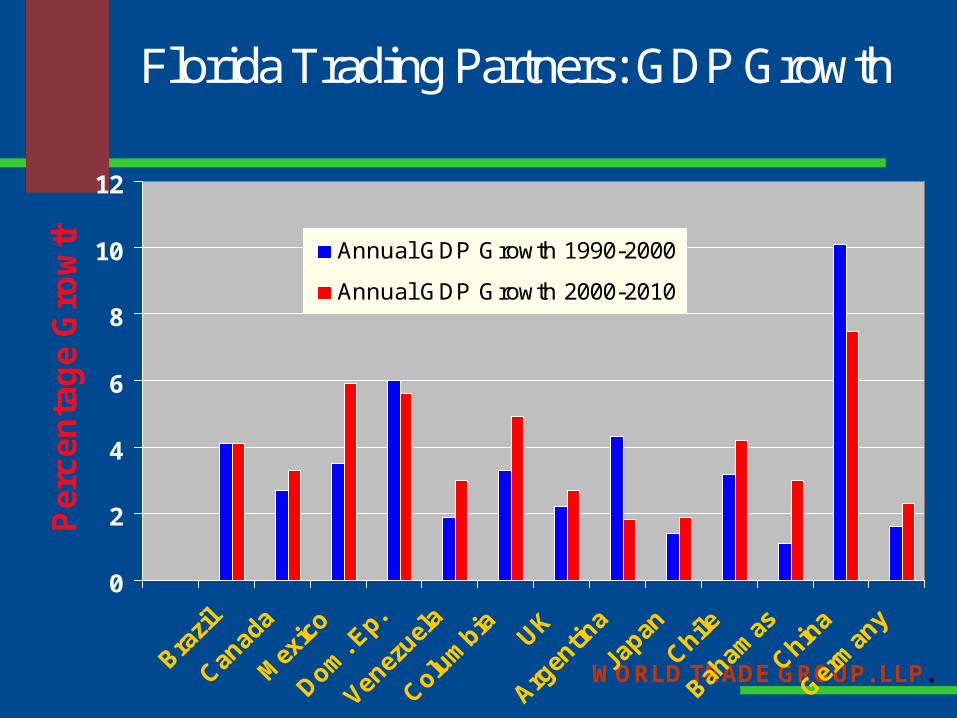
0
2
4
6
8
10
12
Pe
rce
nta
ge
Gro
wth Annual GDP Growth 1990-2000
Annual GDP Growth 2000-2010
Florida Trading Partners: GDP Growth

Continued Foreign Corporate Expansions in China
Walmart
Kfc / Pizza Hut
Heinz / P&G
MacDonalds
Office 1 Superstore
Home Depot
Honda / Mitsubishi / VW / GM
Intel
Microsoft
Computer Associates
DuPont
Rockwell
Toshiba
Embraer Aviation
World Trade Group
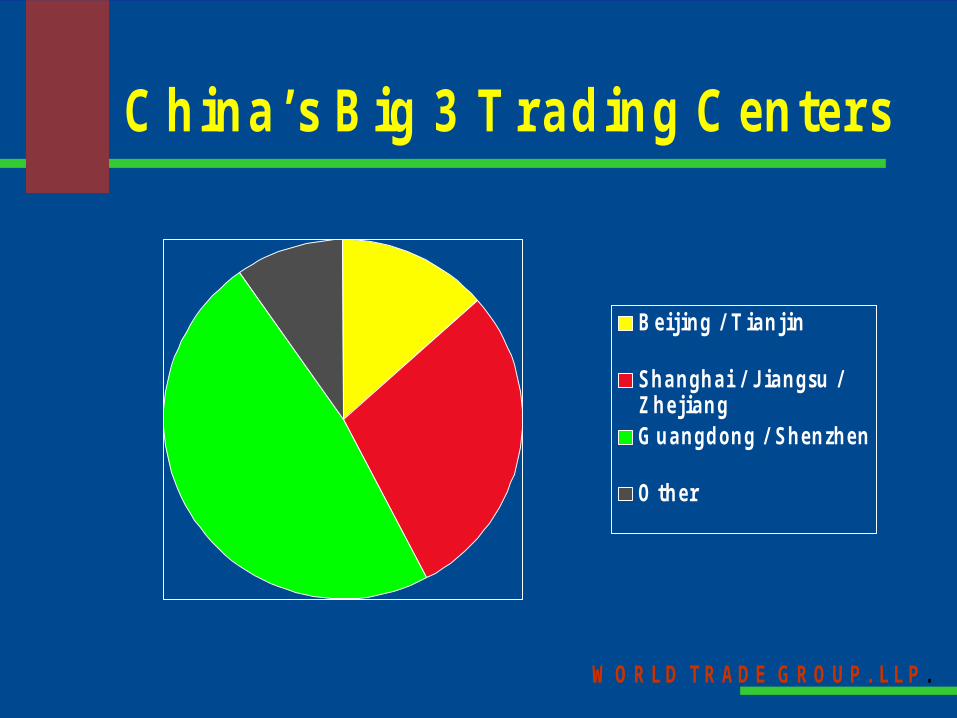
W O R L D T R A D E G R O U P . L L P .
C h in a ’ s B ig 3 T r a d in g C e n t e r s
B e i j i n g / T i a n j i n
S h a n g h a i / J i a n g s u /Z h e j i a n gG u a n g d o n g / S h e n zh e n
O t h e r

Rogers Towers Bailey Jones & Gay

China’s Work Force Allocation(percentage of work force)
0
10
20
30
40
50
60
Industry and commerce
agriculture and forestry
other

China’s Labor Supply
1999 2000 2001 2002
Labor costUSD / hour
0.42 0.44 0.44 0.50
Recorded Unemployment*
5.50 7.0 6.0
????
8.0
????
* Does not include 150 mil. Underemployed in rural areas

Manufacturing Wages: China vs. Latin America (USD)
780
1802
2658
3738
7338
7607
0 2000 4000 6000 8000
China
Guatemala
Honduras
Uruguay
Argentina
Mexico
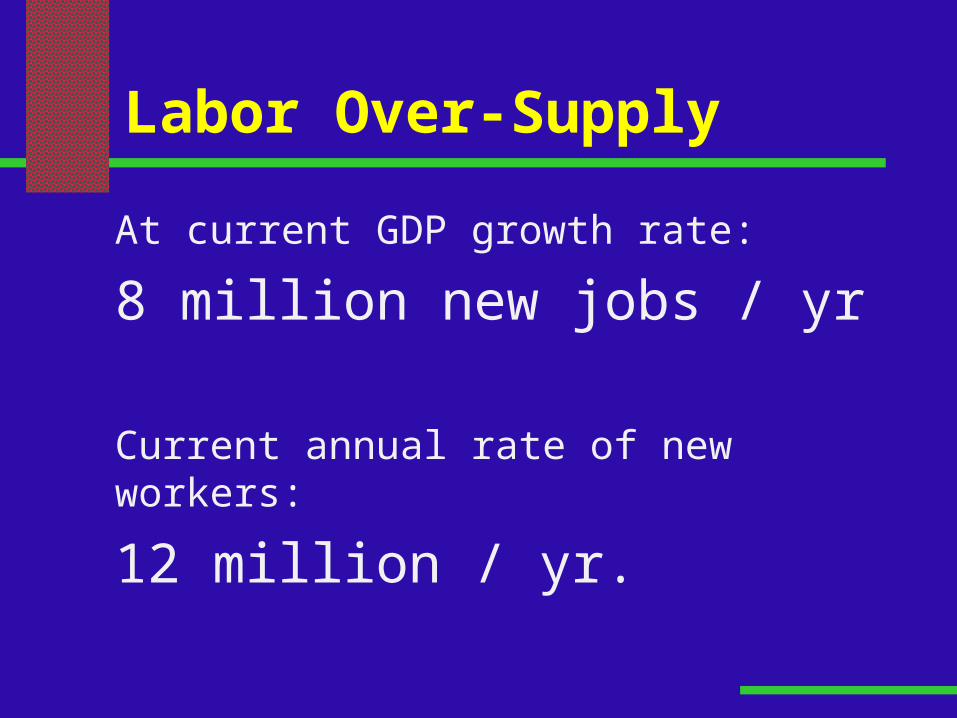
Labor Over-Supply
At current GDP growth rate:
8 million new jobs / yr
Current annual rate of new workers:
12 million / yr.

Major WTO – Related Changes in 2002
Tariffs
Quotas and other non-tariff barriers
Anti-dumping / overproduction
Enhanced IP protection and enforcement
Transparency rules and systems
Accelerated Clean up of banking and securities markets
“Opening up service industries

Services Opening up with WTO
Sales and distribution
3rd party Logistics
Telecom
Banking and finance
Insurance
Construction and development
Project consulting
Engineering
Architecture
Environmental
Legal services
Education / training
Travel services
Employment agencies
Franchising

Chinese Legal Changes - 2002
Over 200 new or changed laws Joint ventures and wholly-owned subsidiaries Patent, trademark and copyright laws Foreign investment Import / export, distribution, franchising Stock markets
Thousands of implementing regulations
Training of attorneys and judges

W O R L D T R A D E G R O U P . L L P .
B u s i n e s s O u t l l o o k I N
C H I N A
A B r e a k f a s t R o u n d - T a b l e
Break

Panel Members
William Cobb – Coastal Industries
Ken Overman – Hunter Marine
Sasha Yang – World Trade Group
Mike Bellamy – PassageMaker
Bill Rhey – JU College of Bus.
Jeff Michelman – UNF College of Bus.
Arthur Chiang – FCCJ

W O R L D T R A D E G R O U P . L L P .
B u s i n e s s O u t l l o o k I N
C H I N A
A B r e a k f a s t R o u n d - T a b l e
End