Raw Milk Quality Tests – do they predict shelf-life Milk Quality Tests – Do They Predict Fluid...
30
Raw Milk Quality Tests – Do They Predict Fluid Milk Shelf-life or Is it time for new tests? Martin Wiedmann Milk Quality Improvement Program November 3, 2011
Transcript of Raw Milk Quality Tests – do they predict shelf-life Milk Quality Tests – Do They Predict Fluid...

Raw Milk Quality Tests – Do They
Predict Fluid Milk Shelf-life
or
Is it time for new tests?
Martin Wiedmann
Milk Quality Improvement Program
November 3, 2011

Fluid milk shelf life
• What defines shelf life – Microbiological criteria
• Time until regulatory limit is reached: 20,000 CFU/ml
– Sensory quality/consumer acceptance (“the ultimate shelf life test”)
• What affects shelf life – Raw milk quality (presence of bacteria, enzymes, and
off flavors that are not eliminated by pasteurization)
– Post-pasteurization microbial contamination and chemical degradation
– Post-pasteurization handling (e.g., temperature, kight exposure)
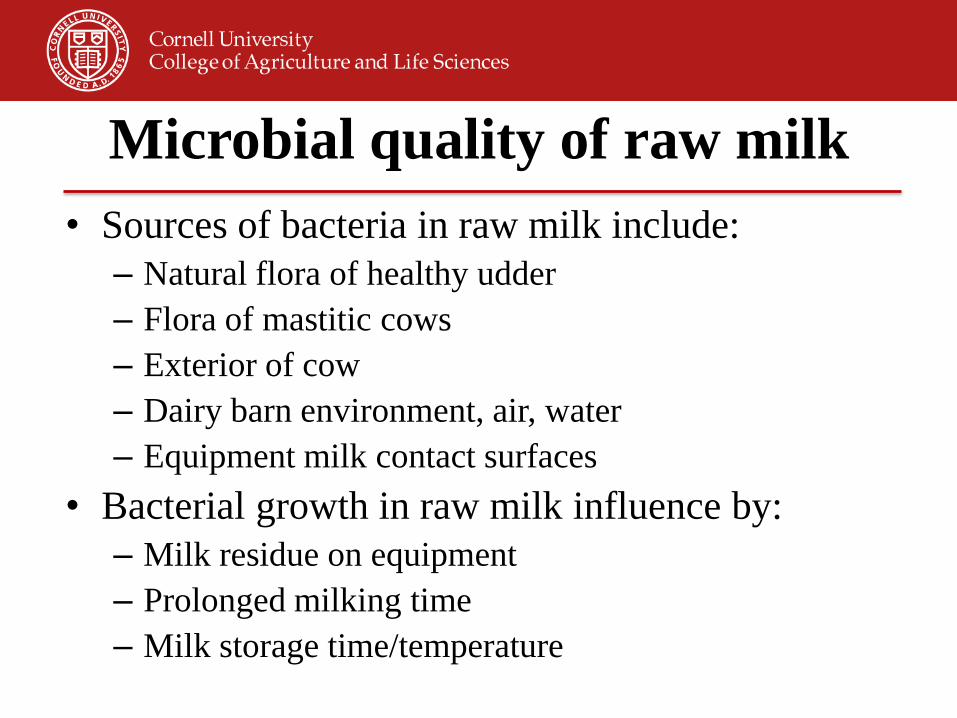
Microbial quality of raw milk
• Sources of bacteria in raw milk include:
– Natural flora of healthy udder
– Flora of mastitic cows
– Exterior of cow
– Dairy barn environment, air, water
– Equipment milk contact surfaces
• Bacterial growth in raw milk influence by:
– Milk residue on equipment
– Prolonged milking time
– Milk storage time/temperature

• Cause Spoilage • fermentative/acid producers (LAB - lactic acid bacteria; coliforms)
• proteolytic, lypolytic, etc, (breakdown proteins, fats, etc.)
• gas producers (coliform bacteria; some LAB)
• Grow under refrigeration • psychrotolerant (e.g., Pseudomonas)
• Survive pasteurization • thermoduric or thermo-tolerant
• includes spore-formers, some psychrotolerant species and
strains
• Cause mastitis infections in cows
- Staphylococcus, Streptococcus, coliforms, others
Raw Milk Quality Important Types of Bacteria in Raw Milk
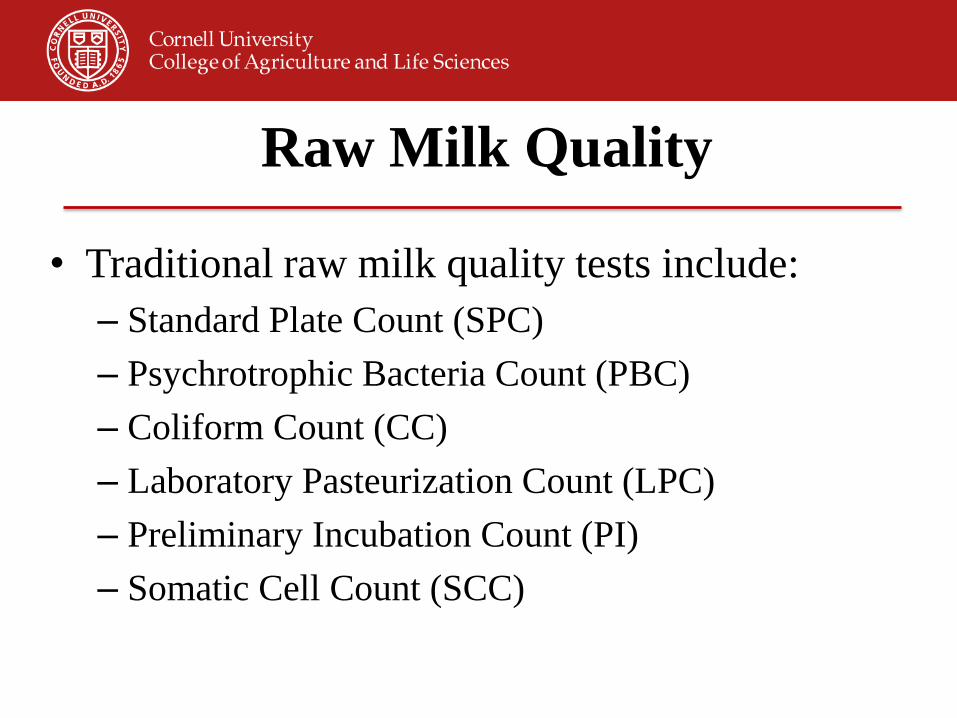
Raw Milk Quality
• Traditional raw milk quality tests include:
– Standard Plate Count (SPC)
– Psychrotrophic Bacteria Count (PBC)
– Coliform Count (CC)
– Laboratory Pasteurization Count (LPC)
– Preliminary Incubation Count (PI)
– Somatic Cell Count (SCC)

Microbiological Tests Used as Indicators
of Pasteurized Milk Shelf-Life
• Raw milk tests:
– PI count
• 13ºC/18 h pre-incubation
– Lab pasteurization count
• 62.8ºC/30 min
pasteurization
– HR3 test
• Pasteurized milk tests:
– Moseley keeping quality
• SPC obtained for fresh
samples and samples
stored at 7ºC for 5 to 7
days
– HR1, HR2 and HR3 test
– PI count
• 13ºC/18 h incubation
– MicroFoss


Study Goals
• Measure statistical correlations between raw
milk microbiological tests and pasteurized
milk shelf life as defined by both sensory
evaluation and microbiological evaluation

Study Design
• Raw milk and corresponding 2% pasteurized
milk samples were collected once a month for
12 months from four NYS processors (with the
exception of plant C, which closed after month
7)
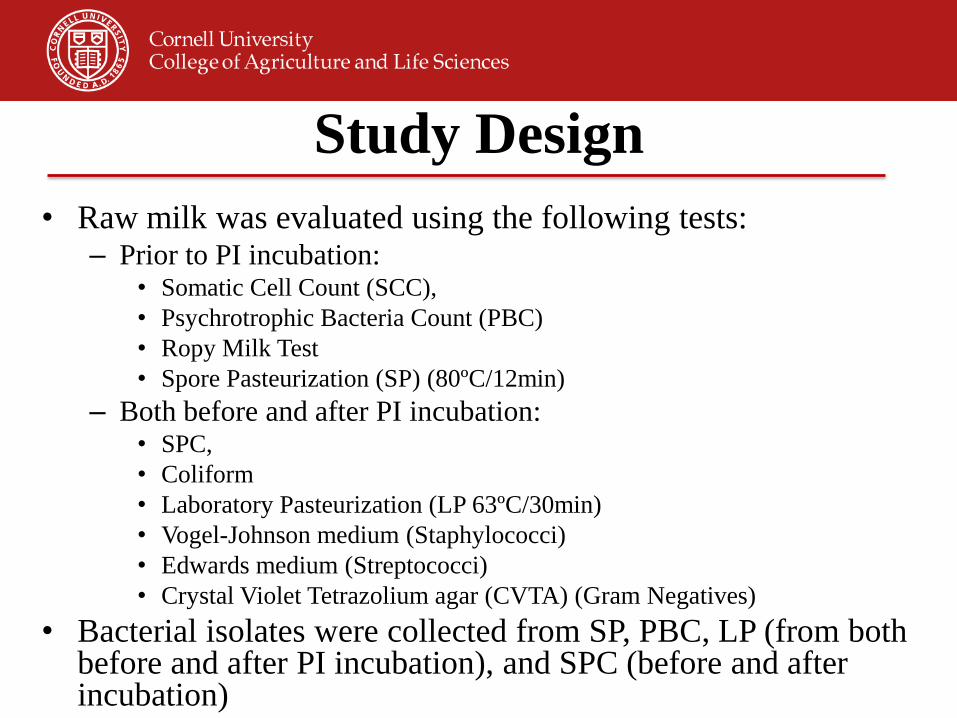
Study Design
• Raw milk was evaluated using the following tests: – Prior to PI incubation:
• Somatic Cell Count (SCC),
• Psychrotrophic Bacteria Count (PBC)
• Ropy Milk Test
• Spore Pasteurization (SP) (80ºC/12min)
– Both before and after PI incubation: • SPC,
• Coliform
• Laboratory Pasteurization (LP 63ºC/30min)
• Vogel-Johnson medium (Staphylococci)
• Edwards medium (Streptococci)
• Crystal Violet Tetrazolium agar (CVTA) (Gram Negatives)
• Bacterial isolates were collected from SP, PBC, LP (from both before and after PI incubation), and SPC (before and after incubation)

Raw Milk
Silo/Tank
Samples
Ropy
Milk
Test
SP
80°C/
12m
LP
63°C/
30m
PBC SPC
SCC VJ CVTA Edwards Coliform PI
SPC LP VJ CVTA Edwards Coliform
Held at
6°C and
plated
over
shelf-life
Time held
in
tank/silo
recorded
Temp at
time of
sampling
Day Zero Plating
Day One Plating
Held at
6°C and
plated
over
shelf-life
Red boxes indicate samples from which isolates were collected

Raw Milk Study Design
• Corresponding 2% pasteurized milk from processors were evaluated as follows:
– SPC and coliform testing performed on days initial, 7, 10, 14, 17 and 21 post-pasteurization and storage at 6C
– Sensory evaluation performed on days initial, 10, 14 and 17 post-pasteurization
– Isolates collected either when the milk sample reached the PMO limit for pasteurized milk (20,000 cfu/mL) or on the last day of the study (21 d post-pasteurization)
• Data were used to identify post-pasteurization contamination (PPC)

Raw Milk Study Plant Processing
Parameters
Plant Temperature (°F) Time (sec)
A 170 25
B 176.5 33
C 176 30
D 171.7 30
Processing Parameters

Results–average quality parameters by
plant
0
2
4
6
8
10
12
Raw SPC PI Day 17 SPC Day 17 LP
Lo
g c
fu/m
L
0
2
4
6
8
10
12
Day 17 Sensory Score
Sen
sory
Sco
re
Plant A
Plant B
Plant C
Plant D
a
a
a
NS
b
b
a/b
b
b
b
b
b
b
NS

Results – correlation between day 17
SPC and PI count
R² = 0.2416
R² = 0.1973
0.00
2.00
4.00
6.00
8.00
10.00
12.00
14.00
3.00 3.50 4.00 4.50 5.00 5.50 6.00 6.50 7.00 7.50 8.00
Da
y 1
7 S
PC
(lo
g c
fu/m
L)
PI Count (log cfu/mL)
Samples With
Evidence of
PPC
Samples With
No Evidence of
PPC
Linear (All
Samples)
Linear
(Samples With
No Evidence of PPC)

R² = 0.106
R² = 0.078
0.00
2.00
4.00
6.00
8.00
10.00
12.00
3.00 4.00 5.00 6.00 7.00 8.00
Da
y 1
7 S
enso
ry S
core
PI Count (log cfu/mL)
Samples With
Evidence of
PPC
Samples With
No Evidence
of PPC
Linear (All
Samples)
Linear
(Samples
With No Evidence of
PPC)
Results – correlation between day 17
sensory score and PI count

R² = 0.0003
R² = 0.0003
0.00
2.00
4.00
6.00
8.00
10.00
12.00
3.00 3.50 4.00 4.50 5.00 5.50 6.00 6.50 7.00 7.50 8.00
LP
C (
log
cfu
/mL
)
PI Count (log cfu/mL)
Day 17
Day 21
Linear (Day 17 )
Linear (Day 21)
Results – correlation between day 17
and day 21 LPC and PI count

Raw milk tests
R2 Values
D17 SPC D17 SPC
(w/o PPC) D21 SPC
D21 SPC
(w/o PPC)
D17 Sensory
Score
D17 Sensory
Score (w/o
PPC)
D17 LP D21 LP
SCC 0.0221 0.0005 0.0235 0.0016 0.1132 0.1571* 0.0014 0.0092
SP 0.0031 0.0001 0.0000 0.0058 0.0301 0.0223 0.0002 0.0140
Edwards 0.0092 0.2637 0.0002 0.2186 0.0283 0.0212 0.0109 0.0180
VJ 0.0011 0.0950 0.0003 0.1274 0.0145 0.0229 0.0569 0.0266
LP 0.0299 0.1009 0.0365 0.1122 0.0004 0.0060 0.0882 0.0509
Raw SPC 0.0544 0.2095 0.0463 0.1877 0.0000 0.0000 0.0896 0.0523
PBC 0.1280 0.2173 0.0876 0.1228 0.0097 0.0038 0.0601 0.0798*
CVTA 0.1238 0.4169* 0.1125 0.3681* 0.0003 0.0092 0.0907* 0.0678
Coliform 0.1301 0.2641 0.1471 0.2413 0.0565 0.0461 0.0399 0.0064
PI 0.2416* 0.1973 0.2211* 0.1874 0.1060 0.0725 0.0003 0.0003
ΔPI 0.1807 0.1524 0.1554 0.1291 0.1314* 0.0628 0.0436 0.0270
Study Results – Summary of all tests

Study Conclusions
• None of the tests commonly used for raw milk screening have the ability to predict the bacterial or sensory quality of pasteurized milk
• Processing plant factors, such as post-pasteurization contamination and processing parameters (e.g., temperature) play a large role in pasteurized fluid milk quality
• New approaches are needed – Cold-growing spore-forming organisms, such as
Paenibacillus, that are known to limit the shelf life of pasteurized milk are a logical target to pursue

Paenibacillus spp. • Gram-positive, aerobic or facultatively anaerobic, rod-shaped
sporeforming bacteria
• Paenibacillus only recently recognized as distinct genera from Bacillus (Paeni translates to „almost‟)
• Spores can survive multiple stresses including: broad ranges of pH, temperature and water activities
• Commonly isolated by heat treatment (80°C for 12 min) to destroy non-spore forming microbes and stimulate spore germination
• Found in soil, rhizosphere, and insect larvae
• Used in a broad range of industrial applications for: – Production of extracellular degrading enzymes
– Antimicrobial and antifungals
– Biofertilizers and biopesticides of root pathogens
• Genome of P. vortex sequenced to better understand social behavior
Paenibacillus vortex
Sirota-Madi et al., 2010
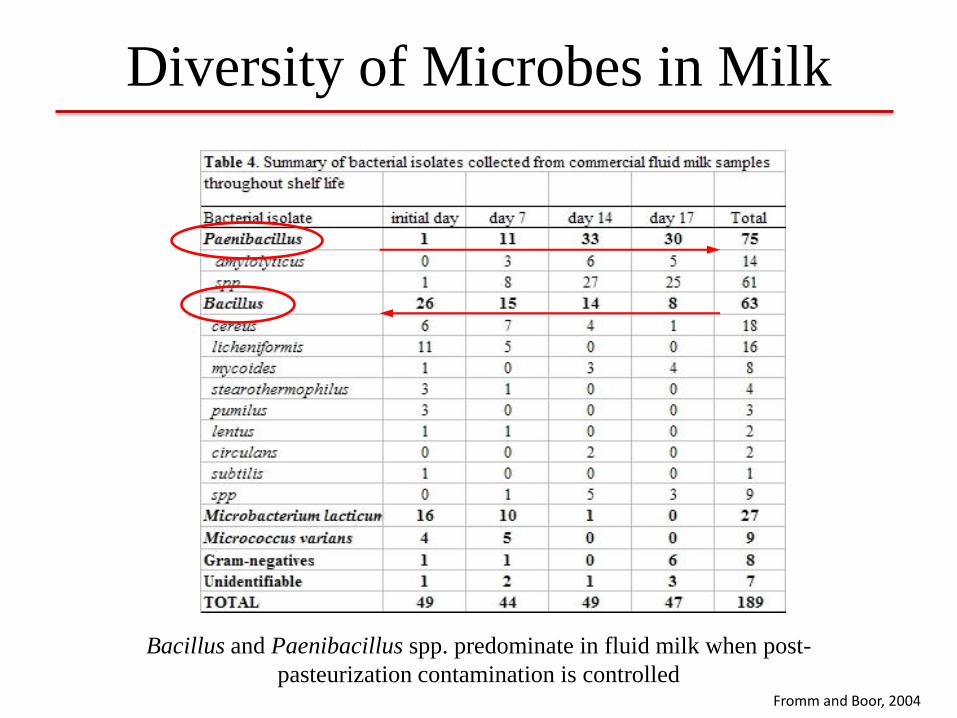
Diversity of Microbes in Milk
Bacillus and Paenibacillus spp. predominate in fluid milk when post-
pasteurization contamination is controlled Fromm and Boor, 2004

Sporeformer life-cycle
Adapted from Errington, 2010
Activation Germination
Sporulation
Vegetative Cycle
Product Spoilage
Resistant to: • Heat • Pressure • Chemicals

Class “Bacilli”
Many endospore
forming bacteria
Genetic diversity
allows survival in
wide range of
environments
Ludwig et al., 2009 Low pH
Salt
High pH
Extremely high heat (spores)
Cold temperatures
Anaerobic

DNA Sequence Based Characterization
2. Representative
colony
morphologies
picked from plate
3. Prepare lysate
4. Genetic target
amplified with
polymerase chain
reaction (PCR),
then sequenced
1. Plate sample

DNA Sequence Based Subtyping
• Traditional sequence based identification targets 16S rDNA
• Sequences can be compared to databases to identify sporeforming or other bacteria
• Sequence based identification is more reliable and faster than traditional phenotypic (biochemical) characterization
• Results for a single culture generally reported by percent similarity to top matches: – Example: 99.79% Bacillus vallismortis, 99.71% Bacillus atrophaeus,
99.48% Bacillus amylolquefaciens
Isolate 1
Isolate 4
Isolate 5
5. Sequences are aligned
and compared

DNA Sequence Based Subtyping • Comparison of sequences can allow for discrimination
between spoilage organisms
• Level of discrimination dependent on nucleotide differences – 16S rDNA is good for genus identification, but may not
discriminate between Bacillus species
– rpoB provides appropriate number of polymorphisms (unique bases for a single nucleotide site) for discrimination beyond genus level
Bacillus subtilis. AT2
Paenibacillus lautus AT1
Bacillus subtilis AT2
16S Sequence Comparison rpoB Sequence Comparison
Isolate 6
Isolate 7
Isolate 5
Isolate 4
Isolate 8
Isolate 11
Isolate 1
Isolate 9
Bacillus sp.

Paenibacillus Assay – Raw Milk Screening
Tool
Heat-Treat
Raw Milk
(80°C for 12
min)
Enrichment at
6°C
(17-21 days)
Sample Enumeration
(1 day)
Colony Selection and
Sequence Based
Identification
(3 days)
Paenibacillus
Quantitative PCR
(4 hours)
Enrichment at
13°C
(2 days) Sample
Enumeration and
Colony Selection
(1 day) Heat-Treat
Raw Milk
(80°C for 12
min)

Overview of Quantitative
Paenibacillus Assay
1. Raw Milk Sample Collection 2. Raw milk spore-
shock: 80°C for 12
minutes to kill
vegetative cells and
induce spore
germination
3. Enrichment
(incubation) at
13°C for 48
hours
4. Bacterial
DNA extraction
from 1mL milk
sample
5. TaqMan PCR
2uL sample added
to each well with
PCR reagents
96 well-plate
Visual output of Pb target amplification

Evaluation of raw milk quality
0
1
2
3
4
5
6
7
8
9
Initial 7 14 21
Mea
n A
PC
, lo
g c
fu/m
L
Day, post heat-treatment at 6°C
Paenibacillus spoilage
Assay predicts spoilage in
4/5 samples with
Paenibacillus growth to
over 1 x 10⁶ cfu/mL
16 of 16 raw milk samples with
low bacterial growth (< 20,000
cfu/mL) were not detected with
assay (no false positives)
3 samples approached 1 x 10⁶
cfu/mL but were not detected
Spoilage determined to be B.
weihenstephanensis (2
samples) and Paenibacillus (1
sample)
Assay
Results
3.5

Conclusions
• Spores are an important hurdle to the extension
of shelf-life and quality of dairy products
– Only some sporeformers can grow at refrigeration
temperatures
• With a high quality raw milk supply traditional
raw milk tests have limited value
• There is a need for new tests in the dairy
industry for both raw milk and shelf life
prediction of finished products