Rational Design of Perovskite Based Anode Materials For ... · Rational Design of Perovskite Based...
211
University of South Carolina Scholar Commons eses and Dissertations 1-1-2013 Rational Design of Perovskite Based Anode Materials For Solid Oxide Fuel Cells: A Computational Approach Suwit Suthirakun University of South Carolina Follow this and additional works at: hp://scholarcommons.sc.edu/etd is Open Access Dissertation is brought to you for free and open access by Scholar Commons. It has been accepted for inclusion in eses and Dissertations by an authorized administrator of Scholar Commons. For more information, please contact [email protected]. Recommended Citation Suthirakun, S.(2013). Rational Design of Perovskite Based Anode Materials For Solid Oxide Fuel Cells: A Computational Approach. (Doctoral dissertation). Retrieved from hp://scholarcommons.sc.edu/etd/597
Transcript of Rational Design of Perovskite Based Anode Materials For ... · Rational Design of Perovskite Based...

University of South CarolinaScholar Commons
Theses and Dissertations
1-1-2013
Rational Design of Perovskite Based AnodeMaterials For Solid Oxide Fuel Cells: AComputational ApproachSuwit SuthirakunUniversity of South Carolina
Follow this and additional works at: http://scholarcommons.sc.edu/etd
This Open Access Dissertation is brought to you for free and open access by Scholar Commons. It has been accepted for inclusion in Theses andDissertations by an authorized administrator of Scholar Commons. For more information, please contact [email protected].
Recommended CitationSuthirakun, S.(2013). Rational Design of Perovskite Based Anode Materials For Solid Oxide Fuel Cells: A Computational Approach.(Doctoral dissertation). Retrieved from http://scholarcommons.sc.edu/etd/597

1
Rational Design of Perovskite Based Anode Materials for Solid Oxide Fuel
Cells: A Computational Approach
by
Suwit Suthirakun
Bachelor of Science
Chiang Mai University, Chiang Mai (Thailand), 2007
Submitted in Partial Fulfillment of the Requirements
For the Degree of Doctor of Philosophy in
Chemical Engineering
College of Engineering and Computing
University of South Carolina
2013
Accepted by:
Andreas Heyden, Major Professor
John Weidner, Committee Member
Christopher Williams, Committee Member
Hans-Conrad zur Loye, Committee Member
Fanglin Chen, Committee Member
Lacy Ford, Vice Provost and Dean of Graduate Studies

ii
© Copyright by Suwit Suthirakun, 2013
All Rights Reserve

iii
DEDICATION
This dissertation is dedicated to my mother Maneerat Pungpiboon for all her love
and endless support.

iv
ACKNOWLEDGEMENTS
I would first like to thank my advisor, Professor Andreas Heyden, who has been a
fantastic mentor and colleague throughout my time at the University of South Carolina.
He gave me the opportunity to attend several meaningful classes that I am interested in,
which have greatly benefited my development as a scientist. He also gave me the
opportunity to attend many conferences, which helped me improve my presentation skill.
He guided me throughout the processes of doing researches and inspired me with his
wisdom, patience, and enthusiasm. I would also like to thank my thesis committees:
Professors Hans-Conrad zur Loye, Fanglin Chen, John Weidner, and Christopher
Williams. The comments provided during the comprehensive exam, pre-defense, and
dissertation defense have been very useful and have resulted in a significantly improved
dissertation.
I would like to acknowledge all of the members of the Heyden Group. When I
started as a PhD student, Dr. Ammal Salai was very patience when she tried to teach me
how to run a simple calculation, how to use basic linux commands, and answer every
single question with patience. Dr. Jianmin taught me how to run transition state
calculations and suggested me some good new programs to view the structures which
make my research life much easier. Faheem, Sina, and Sara have both been great friends
and colleagues. I have enjoyed learning alongside them and I know that without them
working in the office alone would have been a lot more difficult. Their constant hard
work has certainly inspired me to work harder on my projects.

v
I would like to thank all of my colleagues, Fan, Xiaojing Shuai, Tong, Cho,
Rahul, Visarn, Chris, Artem, and Elenie, who joined the school at the same time as I did.
They all helped me to survive the toughest year of studying I have ever had. Since I did
not have a chemical engineering background, they help me understanding materials in
classes and tutor me for the qualifying exam. They are also good friends and make my
time here more memorable. I also thank all of my Thai friends here, Nok, Trisha, Amie,
Gift, and Nikki, whom I share all good and bad times with during my Ph.D. They make
this place to be a better place to stay.
The most gratitude goes to my mom, Maneerat Pungpiboon. She is a real giver
who never expects anything return. She raised me with love and taught me respect,
confidence, and etiquette. She gave me the greatest gift of all, education and the freedom
of choice. I would not be who I am today without her support.

vi
ABSTRACT
A key challenge in the development of solid oxide fuel cell (SOFC) technology is
related to finding a suitable replacement for Ni-based cermet anodes. Although
conventional Ni-based electrodes exhibit excellent catalytic activity and current
collection, they suffer from several limitations such as instability upon redox cycling,
nickel sintering, and sulfur and carbon poisoning when exposed to practical hydrocarbon
fuels. Therefore, alternative anode materials need to be developed for SOFCs. Among the
novel anode electrodes, perovskite based materials (ABO3) are of great interest because
they have been shown to satisfy most intrinsic SOFC anode requirements such as high
thermodynamic stability in anodic environments and strong resistance to carbon
deposition and sulfur poisoning.
In this dissertation, we described how ―first principles‖ modeling can be used to
rationally develop a doping strategy to obtain mixed ionic/electronic conductivity in
SrTiO3 perovskites under anodic SOFC conditions. First, constrained ab initio
thermodynamic calculations were employed to evaluate the thermodynamic stability of
the doped SrTiO3 phases at synthesized and anodic SOFC conditions. Then, we computed
and analyzed the density of states (DOS) of p- and n-doped SrTiO3 to determine the
number of charge carriers per unit cell in each phase. In agreement with experimental
observations, the computational results reveal that mixed p- and n-doping is an efficient
strategy to obtain mixed ionic/electronic conductivity in perovskite oxides such as

vii
SrTiO3. Moreover, we have proven that this strategy is valid independent of p- and n-
doping site (A- or B-site) in the perovskite structure. We used La and Nb as n-type
dopants and Na and Ga as p-type dopants to replace the A-site and B-site cations in the
SrTiO3 perovskite structure, respectively. All p- and n-doped SrTiO3 perovskite oxides
exhibit mixed ionic and electronic conductivity in a reducing environment as long as the
concentration of p-dopants is significantly below, e.g., half, the concentration of the n-
dopant.
Next, we explain how multiscale simulations can help understand the rate /
performance limiting steps in SOFCs based on Sr2Fe1.5Mo0.5O6-δ (SFM) anodes running
on H2. First, we performed constrained ab initio thermodynamic simulations to identify
the surface phase of SFM (001) under anodic SOFC conditions. Then, we studied the
reaction mechanism of the electrochemical H2 oxidation from first principles and
developed a microkinetic model that identified the second H transfer step to be rate
determining under operating voltage and temperature. As a result, adding a transition
metal to the SFM surface such as Ni that facilitates H transfer should improve the overall
cell performance. Indeed, experimental observations confirm this predicted SOFC cell
behavior.

viii
TABLE OF CONTENTS
DEDICATION ................................................................................................................... iii
ACKNOWLEDGEMENTS .................................................................................................... vi
ABSTRACT ...................................................................................................................... vi
LIST OF TABLES .............................................................................................................. xi
LIST OF FIGURES ............................................................................................................ xii
CHAPTER 1: INTRODUCTION
1.1 Introduction ...................................................................................................... 1
1.2 Scope of the Dissertation .................................................................................. 2
1.3 Organization of the Dissertation ....................................................................... 4
1.4 References ........................................................................................................ 6
CHAPTER 2: LITERATURE REVIEWS................................................................................ 8
2.1 Solid Oxide Fuel Cell Overview ....................................................................... 8
2.2 Anode Materials for Solid Oxide Fuel Cells ................................................... 13
2.3 Structure and Properties of Perovskite Oxides ................................................ 24
2.4 Perovskite Oxides for Solid Oxide Fuel Cells ................................................. 30
2.5 References ...................................................................................................... 34
CHAPTER 3: COMPUTATIONAL METHODS ..................................................................... 37
3.1 Density Functional Theory (DFT) ................................................................... 37
3.2 Ab Initio Thermodynamic Simulations ........................................................... 45
3.3 Kinetic Models for Catalytic Reactions .......................................................... 53
ix
3.4 References ...................................................................................................... 58
CHAPTER 4: DFT STUDY ON THE ELECTRONIC STRUCTURE OF P- AND N- DOPED
STRONTIUM TITIVATES IN A REDUCING ENVIRONMENT .......................................... 60
4.1 Summary ........................................................................................................ 60
4.2 Introduction .................................................................................................... 61
4.3 Computational Details .................................................................................... 65
4.4 Results and Discussion ................................................................................... 67
4.5 Conclusions .................................................................................................... 87
4.6 References ...................................................................................................... 87
CHAPTER 5: OBTAINING MIXED IONIC/ELECTRONIC CONDUCTIVITY IN PEROVSKITE
OXIDES UNDER ANODIC SOLID OXIDE FUEL CELL CONDITIONS: A COMPUTATIONAL
PREDICTION FOR DOPED STRONTIUM TITIVATES..................................................... 90
5.1 Summary ........................................................................................................ 90
5.2 Introduction .................................................................................................... 91
5.3 Computational Details .................................................................................... 92
5.4 Results and Discussion ................................................................................... 93
5.5 Conclusions .................................................................................................. 114
5.6 References .................................................................................................... 114
CHAPTER 6: RATIONAL DESIGN OF MIXED IONIC AND ELECTRONIC CONDUCTING
PEROVSKITE OXIDES FOR SOLID OXIDE FUEL CELL ANODE MATERIALS: A CASE
STUDY FOR DOPED STRONTIUM TITIVATES .......................................................... 116
6.1 Summary ...................................................................................................... 116
6.2 Introduction .................................................................................................. 117
6.3 Methods ....................................................................................................... 118
6.4 Results and Discussion ................................................................................. 120
6.5 Conclusions .................................................................................................. 147

x
6.6 References .................................................................................................... 148
CHAPTER 7: THEORETICAL INVESTIGATION OF HYDROGEN OXIDATION ON THE
Sr2Fe1.5Mo0.5O6-δ (001) PEROVSKITE SURFACE UNDER ANODIC SOLID OXIDE FUEL
CELL CONDITIONS ............................................................................................... 149
7.1 Summary ...................................................................................................... 149
7.2 Introduction .................................................................................................. 150
7.3 Computational Details .................................................................................. 151
7.4 Results and Discussion ................................................................................. 152
7.5 Conclusions .................................................................................................. 172
7.6 References .................................................................................................... 173
CHAPTER 8: CONCLUSIONS AND FUTURE OUTLOOK ................................................... 175
8.1 Conclusions .................................................................................................. 175
8.2 Future Research Directions ........................................................................... 177
8.3 References .................................................................................................... 178
REFERENCES ................................................................................................................ 179

xi
LIST OF TABLES
Table 4.1 Summary of reaction energies used in constrained ab initio thermodynamic
calculations ................................................................................................................... 70
Table 5.1 Summary of reaction energies used in constrained ab initio thermodynamic
calculations ................................................................................................................... 96
Table 6.1 Summary of reaction energies used in constrained ab initio thermodynamic
calculations. ................................................................................................................ 121
Table 6.2 Summary of integrated number of electrons below the Fermi level in the
conduction band computed from partial density of states (PDOS) of various p- and n-
doped SrTiO3 structures. Mobile charge carriers are assumed to originate only from Ti
and Nb......................................................................................................................... 130
Table 7.1 Geometric and energetic parameters for intermediates resulting from H2
dissociation (SFMH-H), 𝐻2(𝑔) + 𝑆𝐹𝑀 ⇌ 𝑆𝐹𝑀𝐻−𝐻 ...................................................... 160
Table 7.2 Geometric and energetic parameters for intermediates resulting from H-transfer
(SFMOH2), 𝐻2(𝑔) + 𝑆𝐹𝑀 ⇌ 𝑆𝐹𝑀𝑂𝐻2 .......................................................................... 160
Table 7.3 Energies of oxygen vacancy formation of SFMVS and SFMVB intermediates . 161
Table 7.4 Zero-point energy corrected reaction energies and forward activation barriers
for the elementary steps considered in the Mo1 and Fe1-1 pathways of the H2 oxidation
mechanism. ................................................................................................................. 165
Table 7.5 Forward rate constants (kfor) and equilibrium constants (K) calculated at 1100 K
for the elementary steps considered in the Mo1 and Fe1-1 pathways of the H2 oxidation
mechanism. ................................................................................................................. 167
Table 7.6 Calculated rates for H2 oxidation on Mo1 and Fe1-1 sites on the SFM surface,
apparent activation barriers, degree of rate control (XRC), and degree of thermodynamic
rate control (XTRC) obtained from microkinetic analysis at 1100 K. ............................. 167
Table 7.7 Calculated rates for H2 oxidation on Mo1 and Fe1-1 sites on the SFM surface,
apparent activation barriers, and degree of rate control (XRC) obtained from microkinetic
analysis at operating voltage of 0.7 V and 1100 K. ...................................................... 172

xii
LIST OF FIGURES
Figure 2.1 Schematic diagram showing the working principle of a solid oxide fuel cell ... 9
Figure 2.2 Electrolyte conductivity as a function of temperature ................................... 11
Figure 2.3 Ceria (CeO2) fluorite structure ...................................................................... 17
Figure 2.4 The rutile, MO2 structure .............................................................................. 18
Figure 2.5 The tungsten bronze structure ...................................................................... 19
Figure 2.6 The Pyrochlore structure .............................................................................. 21
Figure 2.7 Unit cell of the ABO3 perovskite structure ................................................... 22
Figure 2.8 The perovskite ABO3 structure ..................................................................... 25
Figure 2.9 Ionicity graph of the ABO3 phase diagram. ................................................... 27
Figure 2.10 Crystal structure of BaTiO3 using the Ewald method and local density of
charge ........................................................................................................................... 28
Figure 2.11 Arrhenius plot of (a) the electrical conductivity of Ca-doped LnAlO3 [Ln =
La (□), Pr (●), Nd (○), Sm (▲), Gd (∆), Y (■), Yb (♦)]and (b) electrical conductivity at
1223 K as a function of A-site cation size ..................................................................... 32
Figure 3.1 Flow chart of the KS SCF procedure ............................................................ 42
Figure 3.2 (a) Schematic grand potential diagram for oxidation of metal and its oxide and
(b) the phase diagram defined by the grand potential diagram ........................................ 48
Figure 3.3 Extension of the grand potential diagram from Fig. 3.2 with the addition of a
metal oxide M2O3 .......................................................................................................... 49
Figure 3.4 DFT-calculated phase diagram for oxidation of bulk Cu and Ag. .................. 50
Figure 3.5 Schematic illustration of a surface in contact with a reference phase of atomic
species 𝑖 at particular temperature and pressure . ........................................................... 51
Figure 4.1 Unit cell of SrTiO3 perovskite oxide ............................................................. 65

xiii
Figure 4.2 DOS of stoichiometric SrTiO3 with calculated band gap of 1.80 eV .............. 67
Figure 4.3 Most stable structures of 20% Nb-doped SrTiO3: a) Sr0.9Ti0.8Nb0.2O3, b)
Sr0.95Ti0.8Nb0.2O3 and c) SrTi0.8Nb0.2O3. Green, gray, blue, and red spheres represent Sr,
Ti, Nb, and O atoms, respectively. Blue squares represent the position of a Sr vacancy. 69
Figure 4.4 Calculated phase diagram of Nb2O5/NbO2. Differently shaded areas mark the
stability regions of various structures for a given temperature and partial pressure of
oxygen. The hatched area decribes possible changes in the phase diagram if computed
reaction energies shown in Table 4.1 are off by ±0.2 eV (our estimated error bar). Green
and red areas symbolize stability of Nb2O5 and NbO2, respectively. .............................. 73
Figure 4.5 Calculated phase diagram of 20% Nb-doped SrTiO3 with a) SrO rich phase
and b) TiO2/niobium oxide rich phases. Differently shaded areas mark the stability
regions of various structures for a given temperature and partial pressure of oxygen. The
hatched area decribes possible changes in the phase diagram if computed reaction
energies shown in Table 4.1 are off by ±0.2 eV (our estimated error bar). Green, yellow,
and red areas symbolize stability of Sr0.9Ti0.8Nb0.2O3, Sr0.95Ti0.8Nb0.2O3, and
SrTi0.8Nb0.2O3, respectively. .......................................................................................... 74
Figure 4.6 Density of states of a) Sr0.9Ti0.8Nb0.2O3`, b) Sr0.95Ti0.8Nb0.2O3 and c)
SrTi0.8Nb0.2O3. Fermi energy is set to zero on energy scale. Numbers of electrons shown
in the figure indicate the integrated number of electrons per supercell for the specified
DOS area, i.e., states in the band gap and states below the Fermi level. ......................... 76
Figure 4.7 Electronic band structure and density of states of SrTi0.8Nb0.2O3. .................. 77
Figure 4.8 Most stable structures of 10% Ga- and 20% Nb-doped SrTiO3: a)
Sr0.95Ti0.7Nb0.2Ga0.1O3, b) SrTi0.7Nb0.2Ga0.1O3, c) SrTi0.7Nb0.2Ga0.1O2.95, d)
SrTi0.7Nb0.2Ga0.1O2.9, and e) SrTi0.7Nb0.2Ga0.1O2.85. Green, gray, blue, brown and red
spheres represent Sr, Ti, Nb, Ga and O atoms, respectively. Blue and gray squares
represent the position of a Sr and O vacancy, respectively. ............................................ 78
Figure 4.9 Calculated phase diagram of 10% Ga- and 20% Nb-doped SrTiO3 with a) SrO
rich phase and b) TiO2/Ga2O3/niobium oxide rich phases. Differently shaded areas mark
the stability regions of various structures for a given temperature and partial pressure of
oxygen. The hatched area decribes possible changes in the phase diagram if computed
reaction energies shown in Table 4.1 are off by ±0.2 eV (our estimated error bar). Blue,
green, yellow, and red areas symbolize stability of Sr0.95Ti0.7Nb0.2Ga0.1O3,
SrTi0.7Nb0.2Ga0.1O3, SrTi0.7Nb0.2Ga0.1O2.9, and SrTi0.7Nb0.2Ga0.1O2.85, respectively. The
hatched violet area symbolizes the possible stability of a SrTi0.7Nb0.2Ga0.1O2.95 phase. .. 80
Figure 4.10 Density of states of a) Sr0.95Ti0.7Nb0.2Ga0.1O3, b) SrTi0.7Nb0.2Ga0.1O3, c)
SrTi0.7Nb0.2Ga0.1O2.95, d) SrTi0.7Nb0.2Ga0.1O2.9 and e) SrTi0.7Nb0.2Ga0.1O2.85. Fermi energy
is set to zero on energy scale. Numbers of electrons shown in the figure indicate the

xiv
integrated number of electrons per supercell for the specified DOS area, i.e., states in the
band gap and states below the Fermi level. .................................................................... 81
Figure 4.11 Partial density of states (PDOS) of a) the gap states between the valence and
conduction band and b) the states below the Fermi level in SrTi0.7Nb0.2Ga0.1O2.9. .......... 82
Figure 4.12 Most stable structures of 20% Ga- and 20% Nb-doped SrTiO3: a)
SrTi0.6Nb0.2Ga0.2O3, b) SrTi0.6Nb0.2Ga0.2O2.95, c) SrTi0.6Nb0.2Ga0.2O2.9, d)
SrTi0.6Nb0.2Ga0.2O2.85 and e) SrTi0.6Nb0.2Ga0.2O2.8. Green, gray, blue, brown, and red
spheres represent Sr, Ti, Nb, Ga, and O atoms, respectively. A gray square represents the
position of an O vacancy. .............................................................................................. 84
Figure 4.13 Calculated phase diagram of 20% Ga- and 20% Nb-doped SrTiO3.
Differently shaded areas mark the stability regions of various structures for a given
temperature and partial pressure of oxygen. The hatched area decribes possible changes
in the phase diagram if computed reaction energies shown in Table 4.1 are off by ±0.2 eV
(our estimated error bar). Blue, yellow, and red areas symbolize stablity of
SrTi0.6Nb0.2Ga0.2O3, SrTi0.6Nb0.2Ga0.2O2.9, and SrTi0.6Nb0.2Ga0.2O2.85, respectively. The
hatched green area symbolizes the stability of a SrTi0.6Nb0.2Ga0.2O2.95 phase. ................ 85
Figure 4.14 Density of states of a) SrTi0.6Nb0.2Ga0.2O3, b) SrTi0.6Nb0.2Ga0.2O2.95, c)
SrTi0.6Nb0.2Ga0.2O2.9, and d) SrTi0.6Nb0.2Ga0.2O2.85. Fermi energy is set to zero on the
energy scale. Numbers of electrons shown in the figure indicate the integrated number of
electrons per supercell for the specified DOS area, i.e., states in the band gap and states
below the Fermi level. ................................................................................................... 86
Figure 5.1 Most stable structures of 20% La-doped SrTiO3: a) Sr0.7La0.2TiO3 and b)
Sr0.8La0.2TiO3 Green, gray, blue, and red spheres represent Sr, Ti, La, and O atoms,
respectively. Blue squares represent the position of Sr vacancies. .................................. 97
Figure 5.2 Calculated phase diagram of 20% La-doped SrTiO3 with a) SrO rich phase and
b) TiO2/La2O3 rich phases. Differently shaded areas mark the stability regions of various
structures for a given temperature and partial pressure of oxygen. The hatched area
decribes possible changes in the phase diagram if computed reaction energies shown in
Table 5.1 are off by ±0.2 eV (estimated error bar). Dark blue and green areas symbolize
the stability of Sr0.7La0.2TiO3 and Sr0.8La0.2TiO3, respectively. ....................................... 99
Figure 5.3 Density of states of a) Sr0.7La0.2TiO3 and b) Sr0.8La0.2TiO3. The Fermi energy
is set to zero on the energy scale. Numbers of electrons shown in the figure indicate the
integrated number of electrons per supercell for the specified DOS area, i.e., states in the
band gap and states below the Fermi level. .................................................................. 100
Figure 5.4 Most stable structures of 10% Ga- and 20% La-doped SrTiO3: a)
Sr0.75La0.2Ti0.9Ga0.1O3, b) Sr0.8La0.2Ti0.9Ga0.1O3, c) Sr0.8La0.2Ti0.9Ga0.1O2.9, and d)
Sr0.8La0.2Ti0.9Ga0.1O2.85. Green, gray, blue, brown and red spheres represent Sr, Ti, La, Ga
xv
and O atoms, respectively. Blue and black squares represent the position of a Sr and O
vacancy, respectively. .................................................................................................. 101
Figure 5.5 (a) The structure of Sr0.81La0.19Ti0.89Ga0.11O2.89 with 3×3×3 supercell. Green,
gray, blue, brown and red spheres represent Sr, Ti, La, Ga and O atoms, respectively.
Black squares represent the position of O vacancies. (b) The DOS of
Sr0.81La0.19Ti0.89Ga0.11O2.89. Fermi energy is set to zero on the energy scale. Numbers of
electrons shown in the figure indicate the integrated number of electrons per supercell for
the specified DOS area, i.e., states in the band gap and states below the Fermi level. ... 102
Figure 5.6 Calculated phase diagram of 10% Ga- and 20% La-doped SrTiO3 with a) SrO
rich phase and b) TiO2/Ga2O3/La2O3 rich phases. Differently shaded areas mark the
stability regions of various structures for a given temperature and partial pressure of
oxygen. The hatched area decribes possible changes in the phase diagram if computed
reaction energies shown in Table 5.1 are off by ±0.2 eV (estimated error bar). Dark blue,
green, yellow, and red areas symbolize the stability of Sr0.75La0.2Ti0.9Ga0.1O3,
Sr0.8La0.2Ti0.9Ga0.1O3, Sr0.8La0.2Ti0.9Ga0.1O2.9, and Sr0.8La0.2Ti0.9Ga0.1O2.85, respectively.
.................................................................................................................................... 103
Figure 5.7 Density of states of a) Sr0.75La0.2Ti0.9Ga0.1O3, b) Sr0.8La0.2Ti0.9Ga0.1O3, c)
Sr0.8La0.2Ti0.9Ga0.1O2.9, and d) Sr0.8La0.2Ti0.9Ga0.1O2.85. The Fermi energy is set to zero on
the energy scale. Numbers of electrons shown in the figure indicate the integrated number
of electrons per supercell for the specified DOS area, i.e., states in the band gap and states
below the Fermi level. ................................................................................................. 104
Figure 5.8 (a) Partial density of states of the gap states between the valence band and
conduction band of Sr0.8La0.2Ti0.9Ga0.1O2.85. The insets describe the charge density of the
localized states which are located at the oxygen vacancy sites. (b) Partial density of states
of Sr0.8La0.2Ti0.9Ga0.1O2.85 below the Fermi level. The inset illustrates the charge density
of delocalized states from mixed-valent Ti3+
/Ti4+
......................................................... 105
Figure 5.9 Most stable structures of 20% Ga- and 20% La-doped SrTiO3: a)
Sr0.8La0.2Ti0.8Ga0.2O3, b) Sr0.8La0.2Ti0.8Ga0.2O2.9, and c) Sr0.8La0.2Ti0.8Ga0.2O2.85. Green,
gray, blue, brown and red spheres represent Sr, Ti, La, Ga and O atoms, respectively.
Black squares represent the position of O vacancies. ................................................... 107
Figure 5.10 Calculated phase diagram of 20% Ga- and 20% La-doped SrTiO3. Differently
shaded areas mark the stability regions of various structures for a given temperature and
partial pressure of oxygen. The hatched area decribes possible changes in the phase
diagram if computed reaction energies shown in Table 5.1 are off by ±0.2 eV (estimated
error bar). Dark blue, yellow, and red areas symbolize stablity of Sr0.8La0.2Ti0.8Ga0.2O3,
Sr0.8La0.2Ti0.8Ga0.2O2.9, and Sr0.8La0.2Ti0.8Ga0.2O2.85, respectively. ................................ 108
Figure 5.11 Density of states of a) Sr0.8La0.2Ti0.8Ga0.2O3, b) Sr0.8La0.2Ti0.8Ga0.2O2.9 and c)
Sr0.8La0.2Ti0.8Ga0.2O2.85. The Fermi energy is set to zero on the energy scale. Numbers of

xvi
electrons shown in the figure indicate the integrated number of electrons per supercell for
the specified DOS area, i.e., states in the band gap and states below the Fermi level. ... 109
Figure 5.12 (a) Partial density of states of the gap states between the valence and
conduction band of Sr0.8La0.2Ti0.8Ga0.2O2.85. The insets describe the charge density of the
localized states which are located at the oxygen vacancy sites. (b) Partial density of states
of Sr0.8La0.2Ti0.9Ga0.1O2.85 below the Fermi level. The inset illustrates the charge density
of the localized states in the lower energy region and charge density of delocalized states
from mixed-valent Ti3+
/Ti4+
near the Fermi level. ........................................................ 110
Figure 5.13 Calculated phase diagram of a) 10% Ga- and 20% Nb-doped SrTiO3 and b)
10% Ga- and 20% La-doped SrTiO3. Differently shaded areas mark the stability regions
of various structures for a given temperature and partial pressure of oxygen. The hatched
area decribes possible changes in the phase diagram if computed reaction energies shown
in Table 5.1 are off by ±0.2 eV (our estimated error bar). In Fig. 5.13(a), Dark blue,
green, yellow, and red areas symbolize stability of Sr0.95Ti0.7Nb0.2Ga0.1O3,
SrTi0.7Nb0.2Ga0.1O3, SrTi0.7Nb0.2Ga0.1O2.9, and SrTi0.7Nb0.2Ga0.1O2.85, respectively. The
hatched violet area symbolizes the possible stability of a SrTi0.7Nb0.2Ga0.1O2.95 phase. In
Fig. 5.13(b), blue, green, yellow, and red areas symbolize the stability of
Sr0.75La0.2Ti0.9Ga0.1O3, Sr0.8La0.2Ti0.9Ga0.1O3, Sr0.8La0.2Ti0.9Ga0.1O2.9, and
Sr0.8La0.2Ti0.9Ga0.1O2.85, respectively. ........................................................................... 112
Figure 5.14 Density of states of a) SrTi0.7Nb0.2Ga0.1O2.9, b) SrTi0.7Nb0.2Ga0.1O2.85, c)
Sr0.8La0.2Ti0.9Ga0.1O2.9, and d) Sr0.8La0.2Ti0.9Ga0.1O2.85. The Fermi energy is set to zero on
the energy scale. Numbers of electrons shown in the figure indicate the integrated number
of electrons per supercell for the specified DOS area, i.e., states in the band gap and states
below the Fermi level. ................................................................................................. 113
Figure 6.1 Most stable structures of 10% Na- and 20% La-doped SrTiO3: a)
Sr0.65La0.2Na0.1O3, b) Sr0.7La0.2Na0.1O3, c) Sr0.7La0.2Na0.1O2.9, and d) Sr0.7La0.2Na0.1O2.85.
Green, gray, blue, purple and red spheres represent Sr, Ti, La, Na and O atoms,
respectively. Blue and gray squares represent the position of a Sr and O vacancy,
respectively. ................................................................................................................ 123
Figure 6.2 Calculated phase diagram of 10% Na- and 20% La-doped SrTiO3 with a) SrO
rich phase and b) TiO2/La2O3/Na2O rich phases. Differently shaded areas mark the
stability region of various structures for a given temperature and partial pressure of
oxygen. The hatched areas describe possible changes in the phase diagram if computed
reaction energies shown in Table 6.1 are off by ±0.2 eV (estimated error bar). Dark blue,
green, yellow and red areas symbolize the stability of Sr0.65La0.2Na0.1TiO3,
Sr0.7La0.2Na0.1TiO3, Sr0.7La0.2Na0.1TiO2.9, and Sr0.7La0.2Na0.1TiO2.85, respectively. ........ 125
Figure 6.3 Density of states of a) Sr0.65La0.2Na0.1TiO3, b) Sr0.7La0.2Na0.1TiO3, c)
Sr0.7La0.2Na0.1TiO2.9, and d) Sr0.7La0.2Na0.1TiO2.85. The Fermi level is set to zero on the
energy scale. Numbers of electrons shown in the figure indicate that integrated number of
xvii
electrons per supercell for the specified DOS area, i.e., states in the band gap and states
below the Fermi level. ................................................................................................. 127
Figure 6.4 Partial density of states of Sr0.7La0.2Na0.1TiO2.9 below the Fermi level in the
conduction band. The left inset illustrates the charge density of the localized states which
are located at the oxygen vacancy (energy ranges between -0.3 and -0.2 eV). The right
inset describes the charge density of delocalized states from mixed-valent Ti3+
/Ti4+
found
in the energy range between -0.2 to 0 eV. .................................................................... 128
Figure 6.5 Most stable structures of 20% Na- and 20% La-doped SrTiO3: a)
Sr0.6La0.2Na0.2TiO3, b) Sr0.6La0.2Na0.2TiO2.95, c) Sr0.6La0.2Na0.2TiO2.9, and d)
Sr0.6La0.2Na0.2TiO2.85. Green, gray, blue, purple, and red spheres represent Sr, Ti, La, Na,
and O atoms, respectively. A gray square represents the position of an O vacancy. ...... 129
Figure 6.6 Calculated phase diagram of 20% Na- and 20% La-doped SrTiO3. Differently
shaded areas mark the stability region of various structures for a given temperature and
partial pressure of oxygen. The hatched areas describe possible changes in the phase
diagram if computed reaction energies shown in Table 6.1 are off by ±0.2 eV (estimated
error bar). Dark blue, green, yellow, and red areas symbolize the stability of
Sr0.6La0.2Na0.2TiO3, Sr0.6La0.2Na0.2TiO2.95, Sr0.6La0.2Na0.2TiO2.9, and Sr0.6La0.2Na0.2TiO2.85,
respectively. ................................................................................................................ 132
Figure 6.7 Density of states of a) Sr0.6La0.2Na0.2TiO3, b) Sr0.6La0.2Na0.2TiO2.95, c)
Sr0.6La0.2Na0.2TiO2.9, and d) Sr0.6La0.2Na0.2TiO2.85. The Fermi level is set to zero on the
energy scale. Numbers of electrons shown in the figure indicate the integrated number of
electrons per supercell for the specified DOS area, i.e., states in the band gap and states
below the Fermi level. ................................................................................................. 133
Figure 6.8 Most stable structures of 10% Na- and 20% Nb-doped SrTiO3: a)
Sr0.85Na0.1Ti0.8Nb0.2O3, b) Sr0.9Na0.1Ti0.8Nb0.2O3, c) Sr0.9Na0.1Ti0.8Nb0.2O2.95, d)
Sr0.9Na0.1Ti0.8Nb0.2O2.90 and e) Sr0.9Na0.1Ti0.8Nb0.2O2.85. Green, gray, blue, purple and red
spheres represent Sr, Ti, Nb, Na and O atoms, respectively. Blue and gray squares
represent the position of a Sr and O vacancy, respectively. .......................................... 135
Figure 6.9 Calculated phase diagram of 10% Na- and 20% Nb-doped SrTiO3 with a) SrO
rich phase and b) TiO2/NbO2/Na2O rich phases. Differently shaded areas mark the
stability region of various structures for a given temperature and partial pressure of
oxygen. The hatched areas describe possible changes in the phase diagram if computed
reaction energies shown in Table 6.1 are off by ±0.2 eV (estimated error bar). Dark blue,
green, purple, yellow and red areas symbolize the stability of Sr0.85Na0.1Ti0.8Nb0.2O3,
Sr0.9Na0.1Ti0.8Nb0.2O3, Sr0.9Na0.1Ti0.8Nb0.2O2.95, Sr0.9Na0.1Ti0.8Nb0.2O2.9, and
Sr0.9Na0.1Ti0.8Nb0.2O2.85, respectively. .......................................................................... 136
Figure 6.10 Density of states of a) Sr0.85Na0.1Ti0.8Nb0.2O3, b) Sr0.9Na0.1Ti0.8Nb0.2O3, c)
Sr0.9Na0.1Ti0.8Nb0.2O2.95, d) Sr0.9Na0.1Ti0.8Nb0.2O2.90 and e) Sr0.9Na0.1Ti0.8Nb0.2O2.85. The
Fermi level is set to zero on the energy scale. Numbers of electrons shown in the figure

xviii
indicate the integrated number of electrons per supercell for the specified DOS area, i.e.,
states in the band gap and states below the Fermi level. ............................................... 137
Figure 6.11 Most stable structures of 20% Na- and 20% Nb-doped SrTiO3: a)
Sr0.8Na0.2Ti0.8Nb0.2O3, b) Sr0.8Na0.2Ti0.8Nb0.2O2.95, c) Sr0.8Na0.2Ti0.8Nb0.2O2.9, and d)
Sr0.8Na0.2Ti0.8Nb0.2O2.85. Green, gray, blue, purple and red spheres represent Sr, Ti, Nb,
Na and O atoms, respectively. A gray square represent the position of an O vacancy. .. 139
Figure 6.12 Calculated phase diagram of 20% Na- and 20% Nb-doped SrTiO3.
Differently shaded areas mark the stability region of various structures for a given
temperature and partial pressure of oxygen. The hatched areas describe possible changes
in the phase diagram if computed reaction energies shown in Table 6.1 are off by ±0.2 eV
(estimated error bar). Dark blue, green, yellow, and red areas symbolize the stability of
Sr0.8Na0.2Ti0.8Nb0.2O3, Sr0.8Na0.2Ti0.8Nb0.2O2.95, Sr0.8Na0.2Ti0.8Nb0.2O2.9, and
Sr0.8Na0.2Ti0.8Nb0.2O2.85, respectively. .......................................................................... 140
Figure 6.13 Density of states of a) Sr0.8Na0.2Ti0.8Nb0.2O3, b) Sr0.8Na0.2Ti0.8Nb0.2O2.95, c)
Sr0.8Na0.2Ti0.8Nb0.2O2.9, and d) Sr0.8Na0.2Ti0.8Nb0.2O2.85. The Fermi level is set to zero on
the energy scale. Numbers of electrons shown in the figure indicate the integrated number
of electrons per supercell for the specified DOS area, i.e., states below the Fermi level.
.................................................................................................................................... 141
Figure 6.14 XRD pattern of a) Sr1-xNaxTi0.8Nb0.2O3 powder and b) Sr0.8-xNaxLa0.2TiO3
powder after solid state reactions at 1250 oC in air. ...................................................... 143
Figure 6.15 Electrical conductivity of Sr1-xNaxTi0.8Nb0.2O3 samples sintered in 5% H2/N2
(pO2~10-22
bar at 800oC) at 1400
oC as a function of temperature and Na content. The
conductivity was measured in H2 with a flow rate of 80 ml min-1
(pO2~10-26
bar at
800oC). ........................................................................................................................ 145
Figure 6.16 Temperature dependence of the conductivity of Sr0.8-xNaxLa0.2TiO3 samples
sintered in 5% H2/N2 at 1400oC. The conductivity was measured in H2 with a flow rate of
80 ml min-1
. ................................................................................................................. 146
Figure 7.1 Surface models with different Fe/Mo configurations a) Plane-Mo surface, b)
Diagonal-Mo surface, and c) Fe-terminated surface ..................................................... 153
Figure 7.2 The Plane-Mo surface model with six oxygen vacancies. The dotted squares
represent the position of oxygen vacancies and the order the oxygen vacancy were
generated are labeled the number in the square. ........................................................... 154
Figure 7.3 a) Calculated phase diagram of the Plane-Mo surface model b) Plane-Mo
surface model with five oxygen vacancies. The dotted squares represent the position of
oxygen vacancies......................................................................................................... 156
Figure 7.4 Proposed pathway for H2 oxidation mechanism on the SFM surface ........... 159

xix
Figure 7.5 Top view of surface intermediates resulting from a) H2 dissociation (SFMH-H)
and b) H transfer (SFMOH2).......................................................................................... 162
Figure 7.6 All possible positions of oxygen vacancies that can be generated in the slab
model to create a) SFMVS intermediates and b) SFMVB intermediates. The yellow oxygen
atoms indicate the possible positions of oxygen vacancies that were created with the
labeled numbers with respect to EVF listed in Table 7.2 ............................................... 163
Figure 7.7 One-dimensional potential energy surface (PES) for H2 oxidation on the SFM
surface (zero-point energy effects not included). .......................................................... 163
Figure 7.8 Free energy profile (in eV) for Mo1 and Fe1-1 pathways of H2 oxidation under
reaction conditions (T = 1100 K, pH2 = pO2 = 1 atm, and pH2O = 0.03 atm). All energies
are with reference to the sum of the energies of the initial state and the reactant gas
molecules. TS1, TS2, and TS3 denote the TS energies of TS of H2 dissociation, H
transfer, and bulk oxygen migration, respectively. G‡H2O↑ represents the TS free energy of
the water desorption process. ....................................................................................... 165
Figure 7.9 Free energy profile (in eV) for Mo1 and Fe1-1 pathways of H2 oxidation under
operating voltage (∆V = 0.7 V) in the reaction conditions (T = 1100 K, pH2 = pO2 = 1
atm, and pH2O = 0.03 atm). All energies are with reference to the sum of the energies of
the initial state and the reactant gas molecules. TS1, TS2, and TS3 denote the TS energies
of TS of H2 dissociation, H transfer, and bulk oxygen migration, respectively. G‡H2O↑
represents the TS free energy of the water desorption process. ..................................... 169
Figure 7.10 Campbell‘s degree of rate control a) as a function of temperature at 0.7 V and
b) as a function of operating voltage at 1100 K. ........................................................... 171
Figure 7.11 Polarization curve of SFM and Ni modified SFM anode electrode [1] ....... 172

1
CHAPTER 1
INTRODUCTION
1.1. Introduction
Fuel cell technology is considered an attractive alternative energy system since it
exhibits higher energy efficiency and lower emissions of greenhouse gases and
conventional pollutants [1-3]. Fuel cells are primarily classified by the electrolyte they
employ. This classification determines the kind of chemical reactions that occur in the
cell, the kind of catalysts required, the temperature range in which the cell operates, the
fuel required, and other factors. There are several types of fuel cells currently being
developed; for example, proton exchange membrane fuel cells (PEMFC), phosphoric acid
fuel cells (PAFC), molten carbonate fuel cells (MCFC), alkaline fuel cells (AFC), and
solid oxide fuel cells (SOFC) [4]. Among these fuel cell technologies, SOFCs are the
most energy efficient and display several advantages over other types of fuel cells, such
as the use of relatively inexpensive materials, a relatively low sensitivity to fuel
impurities, high stability, reliability, durability of operation, and the flexibility of direct
utilization of various fuels such as natural gas, liquid fuels, gasified coal, and biofuels [5-
10]. As a result, SOFC technology has attracted significant attention as a power
generation system over the last years.
2
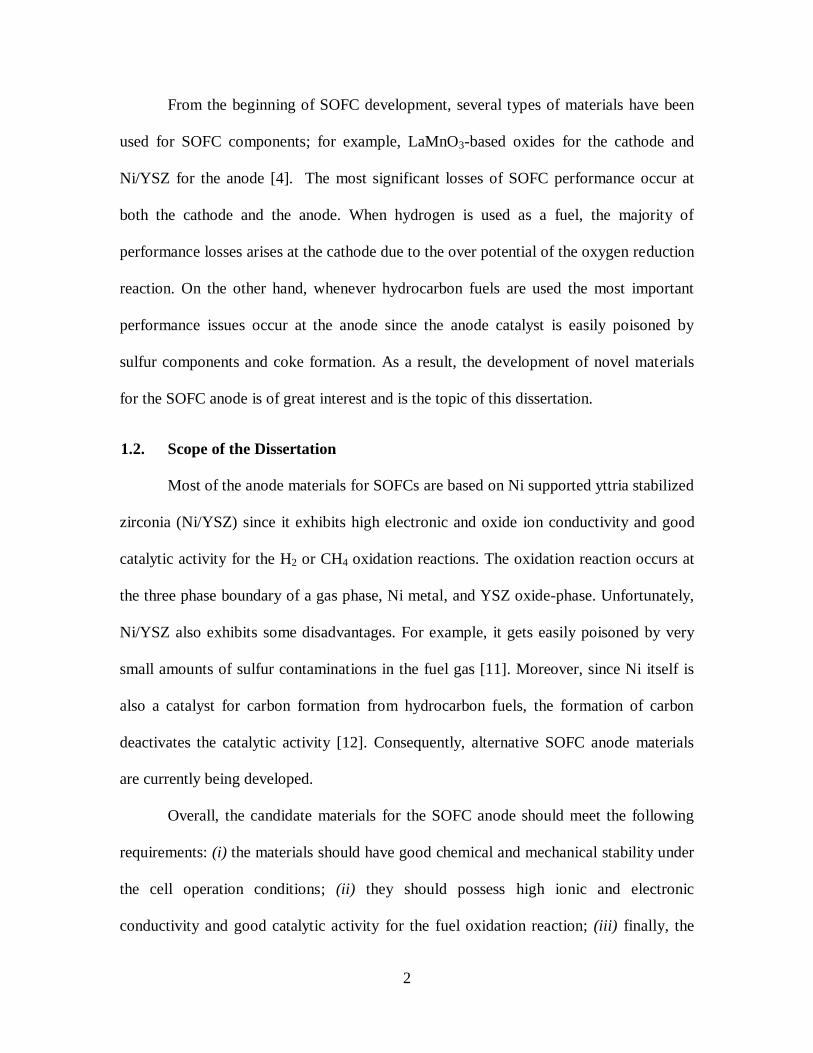
From the beginning of SOFC development, several types of materials have been
used for SOFC components; for example, LaMnO3-based oxides for the cathode and
Ni/YSZ for the anode [4]. The most significant losses of SOFC performance occur at
both the cathode and the anode. When hydrogen is used as a fuel, the majority of
performance losses arises at the cathode due to the over potential of the oxygen reduction
reaction. On the other hand, whenever hydrocarbon fuels are used the most important
performance issues occur at the anode since the anode catalyst is easily poisoned by
sulfur components and coke formation. As a result, the development of novel materials
for the SOFC anode is of great interest and is the topic of this dissertation.
1.2. Scope of the Dissertation
Most of the anode materials for SOFCs are based on Ni supported yttria stabilized
zirconia (Ni/YSZ) since it exhibits high electronic and oxide ion conductivity and good
catalytic activity for the H2 or CH4 oxidation reactions. The oxidation reaction occurs at
the three phase boundary of a gas phase, Ni metal, and YSZ oxide-phase. Unfortunately,
Ni/YSZ also exhibits some disadvantages. For example, it gets easily poisoned by very
small amounts of sulfur contaminations in the fuel gas [11]. Moreover, since Ni itself is
also a catalyst for carbon formation from hydrocarbon fuels, the formation of carbon
deactivates the catalytic activity [12]. Consequently, alternative SOFC anode materials
are currently being developed.
Overall, the candidate materials for the SOFC anode should meet the following
requirements: (i) the materials should have good chemical and mechanical stability under
the cell operation conditions; (ii) they should possess high ionic and electronic
conductivity and good catalytic activity for the fuel oxidation reaction; (iii) finally, the

3
materials should be tolerant to sulfur impurities and coke formation. In recent years,
several alternative anode materials have been developed with fluorite, rutile, tungsten
bronze, pyrochlore, perovskite, and spinel structures [13]. Among these materials,
perovskite based materials have been shown to satisfy most intrinsic SOFC anode
requirements such as high mixed ionic/electronic conductivity, good catalytic activity,
and high thermodynamic stability at anodic conditions [14-20]. Furthermore, perovskite
based materials possess high resistance to sulfur impurities [21-23] and coke formation
[14, 24-26] since both sulfur and carbon species can easily be oxidized at the surface of
the perovskite oxide [27].
It is the objective of this dissertation to utilize modern computational tools to
obtain fundamental understanding of structure-property-performance relationships of
perovskite based anode materials. We further utilize this understanding to rationally
design promising novel anode catalysts for SOFCs. In particular, we performed density
functional theory (DFT) calculations to study the effects of p- and n-dopants to ionic and
electronic conductivity of doped SrTiO3 perovskites. Constrained ab initio
thermodynamic simulations were carried out to determine phase stability and reducibility
of doped structures under synthesized and anodic SOFC conditions. We analyzed the
density of states (DOS) of the most dominant structures in the phase diagrams to evaluate
the number of charge carriers and degree of electronic conduction of each material. The
doped SrTiO3 samples were also experimentally prepared and our experimental partners
confirmed our computational predictions.
Furthermore, we aim to study the electrochemical performance of
Sr2Fe1.5Mo0.5O6-δ (SFM) for the H2 electro-oxidation reaction under anodic SOFC

4
conditions. Again, we employed constrained ab initio thermodynamic calculations to
obtain surface models at realistic reaction conditions. We further conducted a
microkinetic analysis in conjunction with DFT calculations to precisely predict rate
determining steps and the apparent activation energy of the reaction.
1.3. Organization of the Dissertation
This introduction is followed by Chapter 2 ―Literature Reviews‖, which
summarizes the basic knowledge of SOFC operations. The chapter aims to point out the
main reasons why we want to develop novel anode catalysts to replace Ni/YSZ cermet
electrodes. Advantages and disadvantages of various types of alternative anode materials
are explained and discussed. Finally, the chapter thoroughly reviews structural, physical,
and electronic properties of perovskite based anode materials. The electrical and
electrochemical performance of perovskite anodes studied by various groups is also
reviewed.
In Chapter 3, a detailed description of various theoretical methods used
throughout the dissertation is provided (primarily Chapters 4, 5, and 6). The chapters
themselves contain short method sections, which present important information regarding
methodology specific to that particular chapter, as well as references to specific sections
within Chapter 3 for further information.
Chapter 4, ―DFT Study on the Electronic Structure of p- and n-Doped SrTiO3 in a
Reducing Environment‖, presents the results of our density functional theory calculations
of mixed ionic/electronic perovskite conductors. Constrained ab initio thermodynamic
calculations and density of states analysis have been used to investigate the effects of p-
and n-type dopants to the ionic and electronic conductivity of doped SrTiO3 perovskites.
5
The calculations reveal that mixed ionic/electronic conductivity in perovskite oxides can
be obtained using the mixed p- and n-doping approach.
Chapter 5, ―Obtaining Mixed Ionic/Electronic Conductivity in Perovskite Oxides
under Anodic Solid Oxide Fuel Cell Conditions: A Computational Prediction for Doped
SrTiO3‖ confirms the concepts in Chapter 4 that a mixed p- and n-doping strategy can be
used to improve ionic and electronic conductivity in perovskite oxides. The
computational tools and models used in the study of this chapter are very similar to that
of Chapter 4 so that the calculated results can be compared. The computational results
ensure that the p- and n-doping approach is an efficient doping strategy to obtain mixed
ionic/electronic perovskite conductors. The results also suggest that this doping approach
can be efficiently used independent of the n-doping site.
Chapter 6, ―Rational Design of Mixed Ionic and Electronic Conducting
Perovskite Oxides for Solid Oxide Fuel Cell Anode Materials: A Case Study for Doped
SrTiO3‖ is motivated by the findings of Chapter 4 and 5 that p-doping can be used to
improve the ionic conductivity of the material by increasing the oxygen loss in the
structure. Furthermore, n-doping introduces conduction electrons into the lattice and
improves the electronic conductivity. In this chapter, we prove unambiguously that the p-
and n-doping approach can be used to obtain mixed ionic/electronic conductivity in
perovskite materials. Independent of p- and n-doping site, this doping approach can be
successfully used to enhance ionic and electronic conductivity of perovskite oxides under
anodic SOFC conditions. Our computational predictions are also confirmed by
experimental observations.

6
Chapter 7, ―Theoretical Investigation of H2 Oxidation on (001) Sr2Fe1.5Mo0.5O6-
Perovskite Surfaces‖ presents a combined DFT and microkinetic modeling study of the
H2 oxidation on the Sr2Fe1.5Mo0.5O6- surface under anodic SOFC conditions. The surface
model used in this study is described in detail. The derived DFT parameters were used to
construct a microkinetic model which includes the external environmental conditions.
Furthermore, the effect of anode bias potential was included in the model.
Chapter 8 summarizes how the computational tools can be used to rationally
design promising perovskite oxide anode materials for SOFCs. The insights gained from
the first-principle studies permit us to understand and design a novel anode material. An
assessment of how this work has impacted the field of SOFC technology is included.
Furthermore, a detailed description of future research directions of this work is outlined.
1.4. References
[1] R.J. Kee, H.Y. Zhu, D.G. Goodwin, Proceedings of the Combustion Institute 30
(2005) 2379.
[2] M.S. Dresselhaus, I.L. Thomas, Nature 414 (2001) 332.
[3] S. McIntosh, R.J. Gorte, Chemical Reviews 104 (2004) 4845.
[4] Perovskite oxide for solid oxide fuel cells, Springer, New York 2009.
[5] A. Atkinson, S. Barnett, R.J. Gorte, J.T.S. Irvine, A.J. Mcevoy, M. Mogensen, S.C.
Singhal, J. Vohs, Nature Materials 3 (2004) 17.
[6] N.Q. Minh, Journal of the American Ceramic Society 76 (1993) 563.
[7] P. Singh, N.Q. Minh, International Journal of Applied Ceramic Technology 1
(2004) 5.
[8] N.Q. Minh, Solid State Ionics 174 (2004) 271.
[9] Q.M. Nguyen, T. Takahashi, Science and technology of ceramic fuel cells, Elsevier
Science, Amsterdam ; New York 1995.
[10] S.C. Singhal, K. Kendall, High-temperature solid oxide fuel cells : fundamentals,
design, and applicatons, Elsevier Advanced Technology, New York 2003.
[11] Y. Matsuzaki, I. Yasuda, Solid State Ionics 132 (2000) 261.
[12] X. Turrillas, A.P. Sellars, B.C.H. Steele, Solid State Ionics 28 (1988) 465.
[13] S.W. Tao, J.T.S. Irvine, Chemical Record 4 (2004) 83.
[14] S.W. Tao, J.T.S. Irvine, Nature Materials 2 (2003) 320.
[15] Y.H. Huang, R.I. Dass, Z.L. Xing, J.B. Goodenough, Science 312 (2006) 254.

7
[16] D.P. Fagg, V.V. Kharton, A.V. Kovalevsky, A.P. Viskup, E.N. Naumovich, J.R.
Frade, J. Eur. Ceram. Soc. 21 (2001) 1831.
[17] S.Q. Hui, A. Petric, J. Eur. Ceram. Soc. 22 (2002) 1673.
[18] T. Ishihara, H. Matsuda, Y. Takita, J. Am. Chem. Soc. 116 (1994) 3801.
[19] M. Feng, J.B. Goodenough, Eur. J. Solid State Inorg. Chem. 31 (1994) 663.
[20] K.Q. Huang, M. Feng, J.B. Goodenough, M. Schmerling, J. Electrochem. Soc. 143
(1996) 3630.
[21] J. Canales-Vazquez, S.W. Tao, J.T.S. Irvine, Solid State Ionics 159 (2003) 159.
[22] O.A. Marina, N.L. Canfield, J.W. Stevenson, Solid State Ionics 149 (2002) 21.
[23] J. Canales-Vazquez, J.C. Ruiz-Morales, J.T.S. Irvine, W.Z. Zhou, J. Electrochem.
Soc. 152 (2005) A1458.
[24] A. Sin, E. Kopnin, Y. Dubitsky, A. Zaopo, A.S. Arico, L.R. Gullo, D. La Rosa, V.
Antonucci, J. Power Sources 145 (2005) 68.
[25] P. Vernoux, E. Djurado, M. Guillodo, J. Am. Ceram. Soc. 84 (2001) 2289.
[26] Y.B. Lin, Z.L. Zhan, S.A. Barnett, J. Power Sources 158 (2006) 1313.
[27] L. Aguilar, S.W. Zha, Z. Cheng, J. Winnick, M.L. Liu, J. Power Sources 135
(2004) 17.

8
CHAPTER 2
LITERATURE REVIEW
2.1 Solid Oxide Fuel Cell Overview
A solid oxide fuel cell (SOFC) is an electrochemical conversion device that
produces electricity directly by oxidizing fuel. It operates at very high temperatures,
typically between 500 and 1000 oC, which allows the solid electrolyte and electrode to
promote rapid kinetics and leads to an overall high electrochemical activity.
Theoretically, the efficiency of a SOFC cell can be as high as 60 percent [1]. Due to the
high operating temperature though, only selected materials are stable which again led to
the development of low cost ceramic materials that can easily be fabricated.
Unlike most other types of fuel cells, solid oxide fuel cells allow the use of a wide
range of fuels. Because of the relatively high operating temperatures, light hydrocarbon
fuels including methane, propane and butane can be internally reformed at the anode.
The cell can also be fueled by externally reformed hydrocarbons, such as gasoline, diesel,
jet fuel or biofuels. The efficiency of the system can be enhanced by harnessing the heat
released from the exothermic electrochemical oxidation within the fuel cell for the
endothermic steam reforming process.

9
A solid oxide fuel cell is made up of three major components including the
electrolyte, the cathode, and the anode. Hundreds of cells are connected in series to form
the SOFC stack. This SOFC stack contains an electrical interconnect, which links
individual cells together. The cell operates at a high temperature which allows the
ceramic materials to become electrically and ionically conductive.
Next, the electrochemical reactions occurring in the SOFC are discussed and
illustrated. At the cathode, oxygen molecules from the air are reduced into oxide ions on
the porous surface by electrons. These oxide ions are charge carriers that conduct through
the ceramic electrolyte to the fuel rich porous anode where the oxide ions react with the
fuel to generate electrons. The electrons travel through the external circuit providing
electric power and producing some heat. The reactions at the anode and cathode are
shown in equation 1.1 and 1.2. Figure 2.1 shows a schematic diagram of SOFC operation.
Anode: 𝐶𝑛𝐻2𝑛+2 + 3𝑛 + 1 𝑂2− → 𝑛𝐶𝑂2 + 𝑛 + 1 𝐻2𝑂 + (6𝑛 + 2)𝑒− (1.1)
Cathode: 1
2𝑂2 + 2𝑒− → 𝑂2− (1.2)
Figure 2.1 Schematic diagram showing the working principle of a solid oxide fuel cell

10
Typically, SOFCs use solid oxide ceramics as electrolytes. These electrolyte
materials must possess high ionic conductivity, be dense in order to separate the air and
fuel compartments, and be an electronic insulator [2]. Moreover, the electrolyte must
maintain these properties over a wide range of oxygen partial pressure since the partial
pressure of oxygen deviates from 1 atm at the cathode to 10-20
atm at the anode [3]. In the
1980s, Nernst [4] realized that certain perovskites and stabilized zirconia provide
promisingly effective ionic conductivity. Baur and Preis [5] already demonstrated in 1943
that such electrolytes could be used as oxide ion conductors in a fuel cell. Recently,
yttrium stabilized zirconia (YSZ) is the most commonly used electrolyte for SOFCs. At a
temperature above 700 oC, YSZ provides high ionic conductivity while exhibiting only
minor electronic conductivity [6-8].
To date, YSZ seems to be the material of choice because it is stable at a wide
range of pO2, has good mechanical strength, and is inexpensive. However, many research
groups continue searching for alternative electrolyte materials in order to improve the
overall efficiency of SOFCs (particularly at a lower temperature). One such material is
scandium doped zirconia (SDZ). As depicted in Fig. 2.2 [6-8], SDZ exhibits higher
conductivity than YSZ under reducing conditions at a lower temperature. Other
alternative materials include strontium and magnesium doped lanthanum gallate
perovskite materials discovered by Goodenough [9]. These materials can be used at a
temperature as low as 600 oC even on a thick electrolyte. Finally, some oxide compounds
such as doped ceria and La0.9Sr0.1Ga0.8Mg0.2O2.85 (LSGM) are also considered promising
electrolytes because they have higher ionic conductivities [10].

11
Figure 2.2 Electrolyte conductivity as a function of temperature [6-8]
The cathode materials used in SOFCs must be able to dissociate O2 and be
electronically conductive. Generally, the materials are lanthanum based perovskite
materials. Platinum and other noble metals and even magnetite have also been used as
cathode materials during the early development of SOFCs [10]. However, due to their
chemical and physical instability and incompatibility with most electrolytes, they are no
longer employed in SOFCs. Currently, most cathodes are based on perovskite oxide
materials such as Sr-doped LaMnO3 (LSM) and mixed ionic-electronic conductors
(MIEC), such as La0.6Sr0.4Fe0.8Co0.2O3 [11, 12], Ba0.5Sr0.5Co0.8Fe0.2O3- [13], and
Sm0.5Sr0.5CoO3 [14]. The choice of cathode material should be a compromise between a
number of factors:

12
(i) Chemical stability and relatively low interaction with the electrolyte
(ii) High electronic and ionic conductivity
(iii) Relatively high activity
(iv) Manageable interactions with ceramic interconnects
(v) Thermal expansion coefficients that match that of the electrolyte
The anode not only functions as the site for electrochemical oxidation of the fuel,
but also transfers charge to the material surface. The difference in oxygen chemical
potential between anode and cathode is the driving force for oxygen ion migration
through the electrolyte and to the anode where they are consumed by the fuel oxidation
shown in Eq. 2.1 [2]. A wide range of materials have been considered as anode materials
for SOFCs [10] and most studies use a cermet of nickel supported yttrium stabilized
zirconia (Ni/YSZ). Early on in the development of SOFC anodes, precious metals as well
as pure transition metals such as nickel and iron were used as anode materials. However,
the physical and chemical instability of these materials necessitated the testing of other
materials. Finally in 1970, Spacil [15] identified that a composite of nickel and YSZ
could provide a stable and active anode.
Generally, when H2 is used as the fuel for the SOFC, the biggest loss of the cell
efficiency occurs at the cathode where the oxygen reduction reaction takes place.
However, when hydrocarbon fuel is used, the biggest loss is at the anode since the anode
catalyst is easily poisoned by coke formation and sulfur poisoning. As a result, the
rational design for the anode catalyst is of interest and we review in the next section
potential SOFC anode materials and their properties.

13
2.2 Anode Materials for Solid Oxide Fuel Cells
The development of SOFC anode materials have spanned several years with the
goal of developing materials that can replace Ni which exhibits significant disadvantages
such as a low tolerance to sulfur [16] and carbon deposition [17] when using hydrocarbon
fuels. Moreover, the Ni metal in the cermet tends to agglomerate after operation, causing
a reduction in three phase boundary and increasing cell resistance. As suggested by
Goodenough and Huang [18], a good candidate for SOFC anode materials should meet
five basic requirements:
(i) Catalytic activity. The dissociative chemisorption of hydrocarbon fuels must be
facilitated by the anode catalyst. This dissociative adsorption needs to be
followed by a reaction of dissociative fuel with O2-
ions from the electrolyte. If
the metal catalyst is used as the anode, the dissociative fuel must be transferred
to the three phase boundary (TPB). This TPB consists of a metal catalyst, oxide
electrolyte, and fuel in the gas phase. In this case, the chemisorption process
involves electron transfer from the fuel to the conduction band of the metal
catalyst. On the other hand, if a mixed ionic/electronic conductor (MIEC) is
used, O2-
ions are transported from the electrolyte directly to the anode surface.
Both reactions occur at the material surfaces. The chemisorption involves
transfer of electrons to a mixed-valent redox couple of the MIEC. In addition,
the anode must not be poisoned by sulfur impurities in the feed gas or by
carbonaceous residues if a hydrocarbon fuel is used.
(ii) Electronic conductivity. The anode materials must be electronically conductive
in order to transfer the electrons from the chemical reaction at the material

14
surface to an external circuit. A metallic-screen current collector is used to
reduce the distance that electrons have to travel in the anode since the surface
area of electrolyte is very large. Nonetheless, resistive losses within the anode
still have to be minimized by having a material that is active and electronically
conductive.
(iii) Thermal compatibility. Since a SOFC operates at a high temperature, the
thermal expansion of the anode must be matched to that of the electrolyte with
which it makes chemical contact, and also to that of the current collect with
which it makes physical contact.
(iv) Chemical stability. Since the anode must be exposed to a reducing atmosphere
and is in contact with the electrolyte, it needs to be chemically stable at the
operating temperature. Interface phases that block electron transport from the
anode to the current collector must not be formed over time under operating
conditions. Furthermore, the anode must be chemically stable next to the
electrolyte under the sintering conditions to form a dense ceramic membrane.
(v) Porosity. The anode must be fabricated with a porous structure that maintains its
physical shape over time of operation. The three phase boundary of the anode or
the MIEC surface must make contact with the gaseous fuel over an area as large
as possible. In addition, the current collector that makes the physical contact
with the anode surface must not cover the entire surface.
Upon these constraints, many research groups reported the advantages and
disadvantages of several candidates for anode materials ranging from the traditional
Ni/YSZ cermet to alternative oxide anode materials based on the perovskite structure.

15
2.2.1 Ni supported yttria stabilized zirconia cermet anode materials
For both the direct oxidation and steam reforming reaction of fuels, the Ni in the
cermet anode plays an important role in facilitating the dissociative chemisorption of the
fuel and transferring electrons from the dissociation products to the current collector. The
YSZ is known as an effective oxide ion conductor. In addition to its function as a catalyst
supporter of the Ni metal [3, 10, 19, 20], the YSZ possesses a thermal expansion
coefficient that is compatible with the YSZ electrolyte. As a result, this material fulfills
most requirements of an anode. However, the disadvantages of this material are its poor
redox stability, low tolerance to sulfur impurities [16], carbon deposition when using
hydrocarbon fuels [21-23], and nickel agglomeration after operation.
Several methods have been adopted in order to solve the problem of carbon
deposition when using hydrocarbon fuels. Steele [24] suggested that the carbon
deposition can be avoided by reducing the operating temperature. They found that carbon
arising from the dissociation of methane is not deposited on any materials at temperatures
below 750 oC. Many researchers also reported that the coke formation can be avoided by
improving the anode material. The composite anode consisting of Cu-CeO2-YSZ/SDZ
has been developed for this purpose and it has been demonstrated that the addition of
CeO2 to a Cu-YSZ/SDZ cermet significantly enhances the performance of the cell for
hydrocarbon fuels [25, 26]. However, Cu is not as good as an electrocatalyst when
compared to Ni, and power densities reported for Cu-based anodes are lower than those
of Ni-based anodes. Moreover, Cu has a relatively low melting point and is thus not
compatible with high temperature SOFCs.

16
2.2.2 Fluorite anode materials
Single phase oxide anodes with different structures such as fluorite, perovskite,
pyrochlore, tungsten bronze etc. have been proposed as possible SOFC anode materials.
In the fluorite structure, the coordination numbers for cations and anions are 4 and 8,
respectively [27]. Most SOFC developers used doped ceria as anode materials to lower
the operating temperature. Ceramics based on ceria exhibit the cubic fluorite structure
(Fig. 2.3) with mixed ionic and electronic conductivity in a reducing atmosphere due to
the presence of mixed-valent Ce3+
/Ce4+
. The introduction of lower valent cations (Ce3+
)
into the lattice results in the formation of oxygen vacancies, which allows the oxide ions
to transfer through the material at a high temperature. It is also believed that the excellent
catalytic activity of ceria stems from the oxygen vacancy formation associated with the
reversible CeO2-Ce2O3 transition [28, 29]. The electronic conduction of ceria-based
materials arises from the reduction of Ce4+
to Ce3+
and release of electrons at low oxygen
partial pressure. Therefore, doped or undoped ceria is a MIEC at low pO2 and high
temperatures.
In addition, it has been reported that ceria based anodes exhibit a high resistance
to carbon deposition which permits the use of hydrocarbons as a fuel at the anode [30].
Hibino et al. [31, 32] suggested that a Ru-Ni-GDC (Ce0.9Gd0.1O1.95) anode provides
excellent catalytic activity for the oxidation of hydrocarbon fuels such as methane,
ethane, and propane at 600 oC. They proposed that the Ru metal plays the main role in the
anode reaction. Ruthenium catalysts promote reforming reactions of the unreacted
hydrocarbons. Recently, Ye et al. [33] studied the performance of Cu-CeO2-ScSZ
(Scandia stabilized zirconia) composite anode materials for SOFCs that use ethanol fuel.

17
This anode showed a stable performance at 800 oC for a feed of ethanol and water.
Moreover, there was no carbon deposition on the anode surface after operation.
Unfortunately, the ethanol oxidation mechanism is still not understood.
Hirabayashi et al. [34] suggested that doped Bi-based oxides are potential anode
materials for direct hydrocarbon SOFCs. It has been shown that (Bi2O3)0.85(Ta2O5)0.15
provides a promising candidate at intermediate temperatures. Since the Bi2O3 fraction
can be reduced to BiO and Bi under the reducing atmosphere, the material achieves a
high mixed ionic/electronic conductivity and sufficient catalytic activities to promote
complete oxidation of hydrocarbons.
Figure 2.3 Ceria (CeO2) fluorite structure
2.2.3 Rutile anode materials
The rutile structure is based on a distorted hexagonal close packed anion array
with the octahedral sites occupied by cations. Each octahedron shares an edge with the
next one, as shown in Fig. 2.4. These edge-sharing octahedrals facilitate the electron

18
transfer between the octahedral which is related to the high electronic conductivity in
materials with a rutile structure. It is hard to find oxygen vacancies in a rutile structure
since the octahedra have to be rotated if the produced oxygen vacancies are to jump from
one octahedron to the next one. The rotation of edge sharing octahedra in a rutile lattice is
much harder than the corner sharing octahedra in the perovskite lattice. As a result, the
mobility of oxide ions in the rutile structure is relatively much lower than in lots of other
materials. Rutile anode materials, such as Nb2TiO7, exhibit quite poor anode performance
due to the low ionic conductivity [27]. The thermal expansion coefficient of this material
is relatively low compare to that of YSZ. Therefore, the rutile anode materials are not
ideal anode materials from the points of thermal expansion and ionic conduction.
Figure 2.4 The rutile, MO2 structure

19
2.2.4 Tungsten bronze anode materials
Tungsten bronze type materials have been considered as potential SOFC anodes.
The structure is similar to the perovskite structure. In general, these oxides have the
formula A2BM5O15 (with M = Nb, Ta, Mo, W, and A or B = Ba, Na, etc.) which
correspond to a tetragonal tungsten bronze structure (TTB) or an orthorhombic tungsten
bronze structure (OTB) [35]. These oxides can be described by a framework of MO6
octahedra sharing summits, delimiting tunnels of pentagonal, square and triangular
sections [2]. The structure of tungsten bronze is illustrated in Fig. 2.5 [27]. The distortion
of octahedra means that some M-O bonds are extended and some are shortened. The
connection of the short M-O bond length supplies a percolation path for charge transfer,
which leads to high electronic conductivity.
Figure 2.5 The tungsten bronze structure

20
A wide range of different materials with tungsten bronze structure have been
investigated as potential SOFC anodes. The formula (Ba/Sr/Ca/La)0.6MxNb1-xO3- (M =
Mg, Ni, Mn, Cr, Fe, In, Ti, Sn) exhibits high electronic conductivity at low oxygen partial
pressure at high temperatures [36]. However, Slater et al. [37, 38] reported that materials
with compositions (Ba/Sr/Ca/La)0.6MxNb1-xO3- (M = Cr, Mn, Fe, Ni, Sn) are not suitable
as anode materials because of a poor oxygen exchange kinetics and instability in a
reducing atmosphere and high temperature.
2.2.5 Pyrochlore anode materials
Because of the lack of some small A-sites in the pyrochlore, the pyrochlore
structure is similar to the tungsten bronze structure, as shown in Fig. 2.6. These oxides
have a formula of A2B2O7 and can be regarded as a perovskite phase with extra oxygen in
the lattice. The structure can also be derived from fluorite, by removing 1/8 of the oxygen
sites, ordering the two cations and ordering the oxygen vacancies. Several materials with
pyrochlore structure exhibit high ionic conductivity. The anode material with
(Gd0.98Ca0.02)2Ti2O7 provides comparable ionic conductivity to that of YSZ [39].
Moreover, it also exhibits mixed conductivity. Therefore, it could be a potential parent
phase for a SOFC anode. Mo-doped Ga2Ti2O7 is also considered for use in SOFCs. It was
found that this oxide has a very high mixed ionic/electronic conductivity under reducing
condition [40]. However, this pyrochlore solid solution is only stable in a certain range of
oxygen partial pressure and temperature.

21
Figure 2.6 The Pyrochlore structure [27]
Finally, it was found that mixed ionic/electronic conductivity may be obtained for
zirconates containing cations. Pr2Zr2O7- modified by the multivalent cations Mn and Ce
on Zr site has been investigated as a potential anode material. However, these pyrochlore
phase structures are either redox unstable or poorly conducting. As a result, it seems
difficult to find an ideal redox stable mixed conductor in the pyrochlore system.
2.2.6 Perovskite anode materials
The perovskite oxide has the general formula ABO3 where A is a large cation
with a coordination number of 12 and B is a small cation with a coordination number of
6. These materials can accommodate oxygen vacancies; therefore, several perovskites are
good oxygen ion conductors. When the overall valence of the A- and B-site cation (n+m)
adds up to less than 6, the missing charge is made up by introducing vacancies at the
oxygen lattice sites [41]. Figure 2.7 illustrates the typical structure of the cubic
perovskite ABO3. The small B-site in the perovskite allows multivalent transition metal
elements to be introduced in the lattice. These elements display mixed-valency under
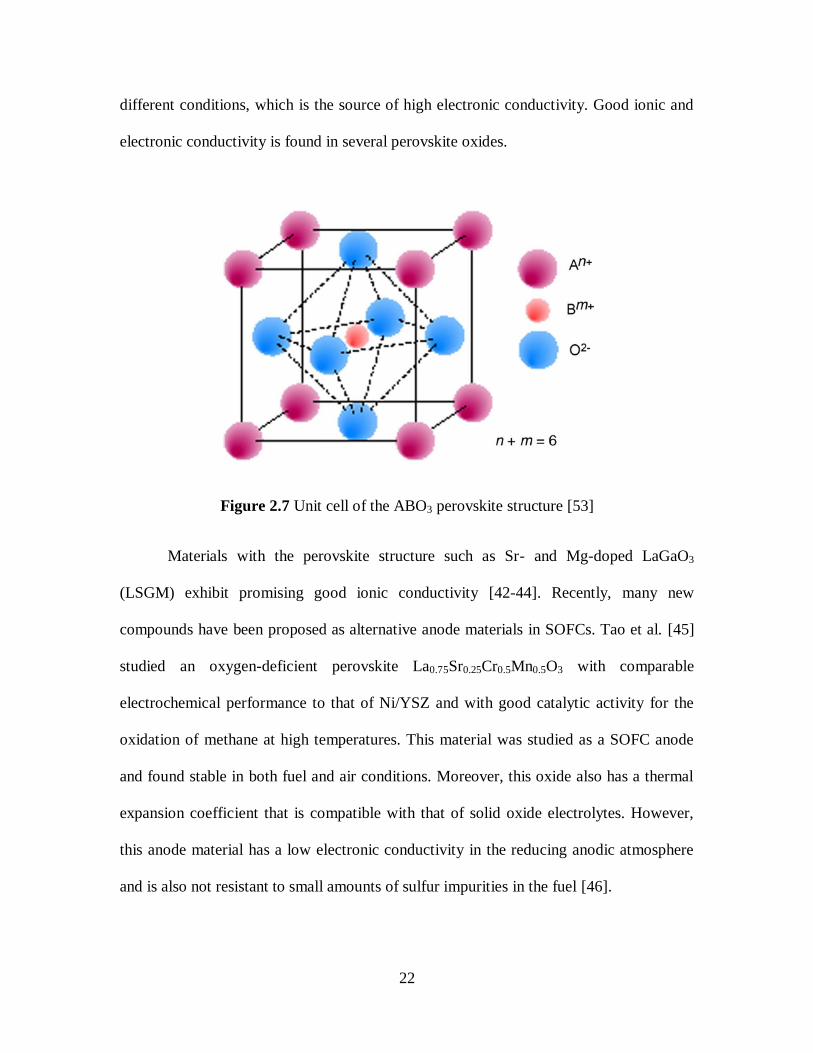
22
different conditions, which is the source of high electronic conductivity. Good ionic and
electronic conductivity is found in several perovskite oxides.
Figure 2.7 Unit cell of the ABO3 perovskite structure [53]
Materials with the perovskite structure such as Sr- and Mg-doped LaGaO3
(LSGM) exhibit promising good ionic conductivity [42-44]. Recently, many new
compounds have been proposed as alternative anode materials in SOFCs. Tao et al. [45]
studied an oxygen-deficient perovskite La0.75Sr0.25Cr0.5Mn0.5O3 with comparable
electrochemical performance to that of Ni/YSZ and with good catalytic activity for the
oxidation of methane at high temperatures. This material was studied as a SOFC anode
and found stable in both fuel and air conditions. Moreover, this oxide also has a thermal
expansion coefficient that is compatible with that of solid oxide electrolytes. However,
this anode material has a low electronic conductivity in the reducing anodic atmosphere
and is also not resistant to small amounts of sulfur impurities in the fuel [46].

23
The perovskite oxide La0.6Sr0.4Co0.2Fe0.8O3 was suggested as a SOFC anode for
intermediate temperatures (550-700 oC) [47]. However, the stability of this anode
material is still in doubt in the lower temperature range. The SrFeCo0.5Ox anode exhibits
both high electronic and ionic conductivities in air and can be used as a ceramic
membrane for gas separation [48]. Although there are still some questions about the exact
structure of this material, it is commonly thought to be related to the perovskite structure
[49].
Recently, Goodenough et al. [50] reported that the double perovskite Sr2Mg1-
xMnxMoO6- can be used with natural gas as a fuel and shows high chemical and physical
stability and tolerance to sulfur. This material is oxygen deficient which allows oxide
ions to transfer through the material. Thus, it exhibits good ionic conductivity. The
mixed valence Mo4+
/Mo5+
sub-array provides electronic conductivity with an ability to
accept electrons from a hydrocarbon. It also promises to be catalytically active for the
oxidation of a hydrocarbon fuel since it can accept electrons while losing oxygen, a
characteristic of MIEC materials. The ability of accepting electrons while losing oxygen
is made possible because Mo4+
and Mo5+
cations are stable in less than six-fold oxygen
coordination, while both Mg2+
and Mn2+
are stable in four-fold as well as six-fold oxygen
coordination [51].
Doped perovskite materials are also promising anode materials. Hui et al. [52]
studied the stability and mixed conductivity of yttrium doped SrTiO3 (SYT) as a potential
SOFC anode material. They investigated the stability, redox behavior, chemical
compatibility with YSZ and LSGM, thermal expansion coefficient, and fuel cell
performance. With the optimized composition Sr0.86Y0.08TiO3-, the electronic

24
conductivity was promising at high temperatures. Also, this material has high structural
stability over a broad range of temperatures and oxygen partial pressures. Fagged et al.
[53] investigated La- and Fe-doped SrTiO3 as an anode material for SOFCs. It was found
that the various compositions of La and Fe affect both physical properties and mixed
conductivity.
Finally, Marina et al. [30] suggested that (La,Sr)TiO3 doped with several
transition metals (Ni, Co, Cu, Cr, and Fe) and Ce provide promising mixed conductivity.
The most effective among these dopants is Ce, which significantly decreases the
polarization resistance. It was also demonstrated that doped SrTiO3 based anodes are
tolerant to an oxygen, carbon and sulfur-containing atmosphere. In addition, it was found
that the conductivity of SrTiO3 in a reducing atmosphere can also be improved by
replacing Ti with Nb.
2.3 Structure and Properties of Perovskite Oxides
In accordance with the discussion of alternative anode materials for SOFCs,
materials with perovskite structures seem to provide promisingly effective mixed
ionic/electronic conductivity. A unique feature of mixed oxide compounds is the display
of a variety of properties that are partially the result of the variety of the structures such
as the mixed electronic and ionic conductivity. In this section, the structure related
properties and some applications of these materials are briefly described.
2.3.1 Structure of perovskite oxides
The typical formula of an ideal perovskite structure is ABO3, where the A-site
cations are larger than the B-site cations and similar in size to the oxide anions. Figure
2.8 illustrates that in this structure, the A cations are surrounded by twelve anions and the

25
B cations are surrounded by six anions in octahedral coordination. The ideal structure
adopts the cubic space group where SrTiO3 is commonly regarded as the prototype of
cubic perovskites. Even though few compounds have this ideal structure, several oxides
exhibit slightly distorted structures with lower symmetry such as, hexagonal and
orthorhombic. Moreover, the majority of synthetic simple ABO3 perovskite group
compounds are distorted derivatives which result from: (1) rotation or tilting of
distortion-free BO6 polyhedra; (2) first order Jahn-Teller distortions of the BO6
octahedra; and (3) second order Jahn-Teller effects on A- and B-cation polyhedra. There
are many types of distortions in the perovskite structure that strongly affect their
properties, in particular, their ferromagnetic properties.
Figure 2.8 The perovskite ABO3 structure
In order to understand the deviations from the ideal cubic structure, the ABO3
oxides are regarded as purely ionic crystals. The ideal cubic structure is characterized by
the relationship between the ionic radii of the A, B and O ions as shown in the following.

26
𝑟𝐴 + 𝑟𝑂 = 2 𝑟𝐵 + 𝑟𝑂 (1.3)
The Goldschmidt tolerance factor [54] t, is used to determine the geometric constraints
necessary for the formation of the perovskite structure which can be expressed as:
𝑡 = (𝑟𝐴 + 𝑟𝑂)/ 2 𝑟𝐵 + 𝑟𝑂 . (1.4)
Generally, the value of the tolerance factor of perovskite compounds lies between
approximately 0.80 and 1.10. The cubic structure occurs if value of t is close to 1. The
observation of the crystal structure related t value reveals that lower values of t will
lower the symmetry of the crystal structure; for example, GdFeO3 with t = 0.81 is
orthorhombic [55] whereas the oxides with 𝑡 ≤ 0.8 are characterized as sesquioxide
structures such as corundum (α-Al2O3) or ilmenite [56]. Furthermore, Giaquinta and zur
Loye [56] suggested that the accuracy of structural phase diagram of ABO3 can be
improved by including the bond ionicities of the A and B cations. Figure 2.9 illustrates
the structural phase diagram of ABO3. The axes are the differences in electronegativity of
A-O and B-O multiplied by the cation to anion ratio, rA/rO and rB/rO, respectively.
The formation of superstructures such as double perovskites is reviewed next.
Ordered double, triple, or complex perovskites are derivatives of the simple perovskite
structure formed when either A- or B-site cations are replaced by combinations of other
cations located at specific crystallographic sites. If cations are ordered at only one site the
compound are commonly referred to as a double perovskite, whereas if the ordering
occurs at both A- and B-site cations they are referred to as complex or quadruple
perovskites. Moreover, if the structures exhibit layered ordering of A-site cations with
some oxygen vacancies located in the layer (often in the rare-earth layer e.g.
YBaFe2O5+x) the structures are referred to as triple perovskites. The majority of ordered
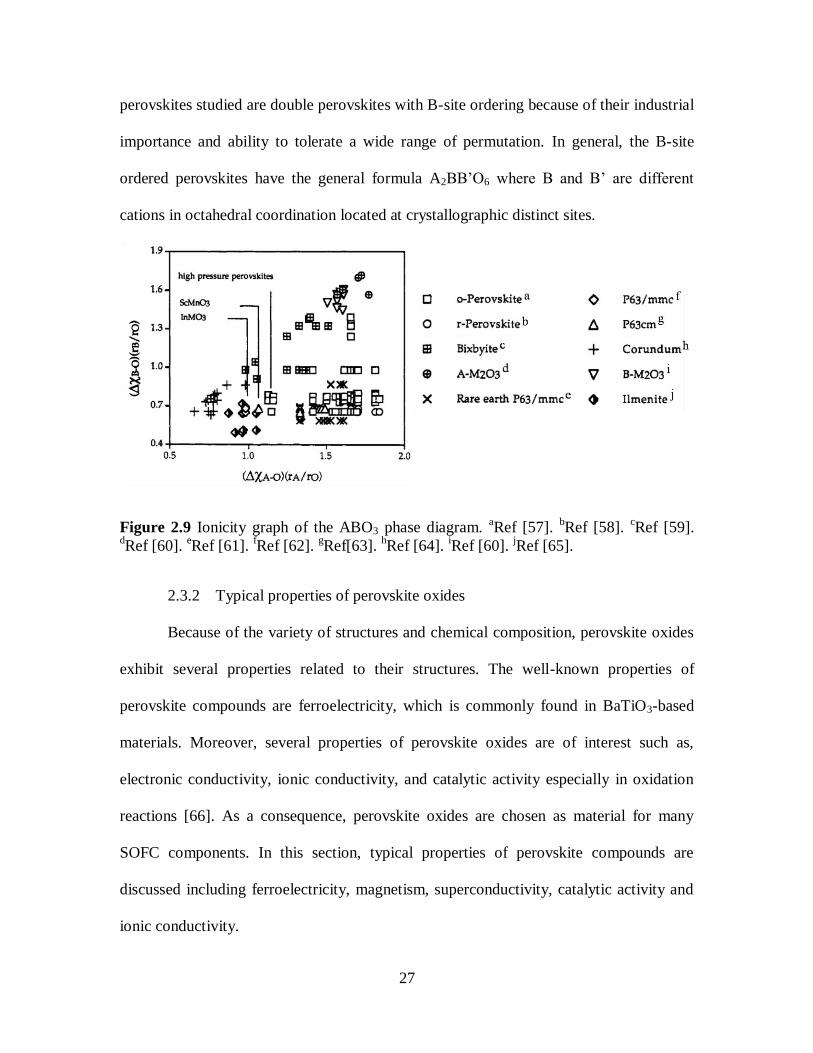
27
perovskites studied are double perovskites with B-site ordering because of their industrial
importance and ability to tolerate a wide range of permutation. In general, the B-site
ordered perovskites have the general formula A2BB‘O6 where B and B‘ are different
cations in octahedral coordination located at crystallographic distinct sites.
Figure 2.9 Ionicity graph of the ABO3 phase diagram. aRef [57].
bRef [58].
cRef [59].
dRef [60].
eRef [61].
fRef [62].
gRef[63].
hRef [64].
iRef [60].
jRef [65].
2.3.2 Typical properties of perovskite oxides
Because of the variety of structures and chemical composition, perovskite oxides
exhibit several properties related to their structures. The well-known properties of
perovskite compounds are ferroelectricity, which is commonly found in BaTiO3-based
materials. Moreover, several properties of perovskite oxides are of interest such as,
electronic conductivity, ionic conductivity, and catalytic activity especially in oxidation
reactions [66]. As a consequence, perovskite oxides are chosen as material for many
SOFC components. In this section, typical properties of perovskite compounds are
discussed including ferroelectricity, magnetism, superconductivity, catalytic activity and
ionic conductivity.

28
Dielectric properties: A variety of special properties related to dielectric materials
such as, ferroelectricity, piezoelectricity, electrostriction, and pyroelectricity, can be
found in perovskite oxides. BaTiO3-based compounds display ferroelectric behavior,
which is the best-known property of perovskite oxides. This property has a strong
relationship with the structure of perovskite materials. Therefore, the crystal structure of
BaTiO3 have been studied and reported in detail. BaTiO3 undergoes three phase
transformations as the temperature increases (from monoclinic to tetragonal to cubic).
The cubic structure is presented at temperatures above 303 K, which does not show
ferroelectric behavior. The very high dielectric constant in BaTiO3 can be explained on
the basis of the anisotropy of the crystal structure. The crystal structure of BaTiO3 is
shown in Figure 2.10 [67]. It is noticed that the large negative potential is localized on the
oxygen atoms. When an electric field is applied, Ba2+
and Ti4+
cations move to the
opposite direction to the oxide anions. Hence, a net dipole moment is produced in the unit
cell.
Figure 2.10 Crystal structure of BaTiO3 using the Ewald method and local density of
charge [68]

29
Electrical conductivity and superconductivity: Superconductivity property was
first reported by Bednorz and Muller in the La-Ba-Cu-O with K2NiF4 structure in 1984
[69]. The presence of square planar sheet of Cu-O was found to be essential for
conductivity to occur. High-temperature oxide superconductor of the YBa2Cu3O7
perovskite was reported in 1987. The material displays a triple perovskite unit cell where
Y and Ba correspond with A-site cations and Cu with B-site cation. The structure
contains a 2:1 layered ordering of Ba and Y and additional oxygen vacancies in the Cu
layers which lie between the Ba layers [70].
The materials with perovskite structure not only show superconductivity behavior,
but also exhibit excellent electronic conductivity. The electronic conductivity of
perovskite oxides is comparable with that of Cu metal. Typical examples are LaCoO3 and
LaMnO3, which are currently used for the cathode in SOFCs. A-site doped perovskite
oxides are also highly effective in enhancing the electronic conductivity because of an
increased number of mobile charge carriers generated by the charge compensation.
Catalytic activity: Perovskite oxides have been extensively studied as catalysts for
several reactions since the material comprises of various elements and exhibits high
chemical stability. There are two types of research trends, which are of interest in the
development of perovskite materials as catalysts. The objective of the first trend is to
develop oxidation catalysts or oxygen-activated catalysts as an alternative catalyst to
replace old-fashioned precious metal catalysts. The second trend‘s objective is the
development of perovskite oxides as a model for active sites. Remarkably, the high
catalytic activity of perovskite oxides is based on both high surface activity to oxygen

30
reduction and oxygen activation resulting from a large number of oxygen vacancies
presented in the structure.
Perovskite oxides are utilized as environmental catalysts since they display
excellent catalytic activity for various reactions such as NO decomposition. Furthermore,
it was reported that perovskite oxides consisting of Cu, Co, Mn, or Fe exhibited excellent
activity for the direct NO decomposition at higher temperatures [71-73]. It was observed
that the key step for NO decomposition (2NO N2 + O2) is the removal of oxygen
molecules from the surface of the catalyst. In addition, it was reported that doping of
perovskite oxides can significantly enhance the NO decomposition activity. A relatively
high NO decomposition activity was reported for Ba(La)Mn(Mg)O3 perovskites under an
oxygen-enriched atmosphere [74].
2.4 Perovskite Oxides for Solid Oxide Fuel Cells
Since perovskite compounds exhibit excellent electronic conductivity, high
chemical stability, and high catalytic activity for several reactions, perovskite oxides are
considered alternative materials for various components of the SOFC. Mainly, the
application of Co- and Mn-containing perovskites as cathodes has been extensively
studied because of their high electronic conductivity and catalytic activity for oxygen
dissociation.
Several applications of perovskite oxides for SOFC technology have been
reported. LaCrO3 is used as a promising interconnect material for tubular-type SOFCs
operating at high temperature. LaCoO3 and LaMnO3 are promising SOFC cathodes, and
LaGaO3-based oxides have been suggested for the electrolyte. In addition, it has been
reported that Cr-based perovskite materials could be potential SOFC anode catalysts.

31
Therefore, an ―all-perovskite SOFC‖ is currently being considered. In this section,
various aspects of perovskite oxides used for SOFCs are briefly discussed.
2.4.1 Oxide ion conductivity in perovskite oxides
Oxides with perovskite structure are well known as effective oxide ion
conductors. In order to achieve high oxygen ion conductivity, the introduction of oxygen
vacancies by the substitution of a lower valent cation is essential. In the case of
perovskite based oxides, when a cation A or B in the ABO3 structure is partially replaced
by a cation M of lower valence, it gives rise to a relatively large number of oxygen
vacancies in the lattice to charge compensate the system. Chemical compositions of
oxygen deficient perovskite oxides can be expressed as A1-xMxBO3- in case of A-site
doping, or AB1-xMxO3- in case of B-site doping, where is an average number of oxygen
efficiencies per unit formula. The oxygen ions can migrate through the crystal lattice with
the assistance of oxygen vacancies. In such materials, if the energy barrier of oxygen ion
migration is not too high, appreciable ion conduction can be expected at elevated
temperatures.
Oxygen ion conduction in perovskite materials was reported for the first time by
Stephenson and Flanagan [75]. Later, Takahashi and Iwahara [76] reported very high
oxygen ion conductivity in Ti- and Al-based perovskite oxides. Similarly, Al- or Mg-
doped CaTiO3 exhibits high conductivity (but still lower than that of YSZ). It was found
that in order to achieve excellent oxygen ion conductivity, the rate of oxygen ion
migration has to be enhanced. A migrating oxygen ion has to pass through the triangular
orifice consisting of two large A- and one small B-site cations in the crystal lattice. As a
result, the ionic size of the A-site cations seems to influence greatly the oxygen ion

32
conductivity, whereas the electric or dielectric properties were strongly dependent on B-
site cations. It is shown in Fig. 2.11 that the electrical conductivity of LaAlO3 based
oxides [43] is improved by increasing the ionic size of the A-site cations. In accordance
with these results, a larger unit cell volume is important for higher oxygen ion
conductivity because of the larger free volume. Therefore, doping with larger cations for
the B-site can improve oxygen ion conductivity. In order to confirm this result, Ga-doped
NdAlO3 was investigated. The addition of Ga3+
, which is larger than Al3+
, to the B-site of
NdAlO3 is effective for improving oxygen ion conductivity [77].
Figure 2.11 Arrhenius plot of (a) the electrical conductivity of Ca-doped LnAlO3 [Ln =
La (□), Pr (●), Nd (○), Sm (▲), Gd (∆), Y (■), Yb (♦)]and (b) electrical conductivity at
1223 K as a function of A-site cation size [4]
In addition to the above results, Ga-doped LaAlO3 perovskite was studied in order
to show the effect of cation size on the lattice structure. It was found that oxygen ion
conductivity increased with increasing amount of Ga which reached a maximum when 50
mol% Ga was doped at Al sites at 1223 K. Since no oxygen vacancy was formed by

33
doping Ga3+
because of its identical valency to Al, higher oxygen ion conductivity is
brought about by improved mobility of the oxygen ion by increasing the free volume in
the unit cell. Although high ionic conductivity was obtained from such perovskite
systems, the oxygen ion conductivity of these compounds is still lower than that of YSZ.
However, it is of great interest that very high oxygen ion conductivity is reported for
LaGaO3-based perovskite oxides.
Perovskite oxides with transition elements at the B-site such as doped LaCoO3
display promisingly effective mixed ionic/electronic conductivity at elevated
temperatures. The electronic conductivity is a few orders of magnitudes higher than that
of the oxygen ion conductivity. This kind of material is therefore a promising candidate
for the SOFC electrode and ceramic membrane reactors.
2.4.2 Thermal expansion behavior and other properties
Thermal expansion is an essential property for SOFC materials. There are many
reports stating that the thermal expansion increased with an increase in the dopant
concentration. Thermal expansion behavior for LaGaO3 and La0.9Sr0.1GaO3 perovskite
oxides were observed around 400 K and were assigned to the phase transition from
orthorhombic to the rhombohedral structure. On the other hand, Sr- and Mg-doped
perovskite oxides exhibit a monotonic expansion; the average thermal expansion
coefficient measured was around 11.5×10⁻⁶
K-1
within the temperature range from 298 to
1273 K. Therefore, the average thermal expansion coefficient is slightly larger than that
of YSZ.
Thermal conductivity of this perovskite material has also been investigated. The
average thermal conductivity of LSGM is somewhat smaller than that of YSZ.

34
Consequently, from the point of view of uniform temperature distribution, LaGaO3-based
perovskites are more desirable to use as a material for several SOFC components.
In summary, several alternative anode materials display various advantages and
disadvantages. Among the reviewed material systems, perovskite based oxide materials
exhibit promisingly high ionic/electronic conductivity and catalytically active for various
oxidation reactions which are relevant for SOFC anodes. However, the understanding of
the structure-property relationship and the role of dopants in these materials are still very
limited. Therefore, it is the objectives of this research to utilize various modern
computational tools to systematically investigate the effect of dopants in the perovskite
structure on various relevant anode properties. The fuel oxidation mechanism on the
perovskite surfaces is also studied to further develop the catalytic activity of perovskite
anode materials.
2.5 References
[1] F. Nagel, Electricity from wood through the combination of gasification and solid
oxide fuel cells Swiss Federal Institute of Technology Zurich, Zurich (2008).
[2] C.W. Sun, U. Stimming, J. Power Sources 171 (2007) 247.
[3] S. McIntosh, R.J. Gorte, Chem. Rev. 104 (2004) 4845.
[4] W. Nernst, Verfahren zur Erzeugung von Elektrischen Glühlicht 104 (1987) 872.
[5] E. Baur, H. Preis, Zeitung für Elektrochemie (1937) 727.
[6] S.R. Wang, T. Kobayashi, M. Dokiya, T. Hashimoto, J. Electrochem. Soc. 147
(2000) 3606.
[7] K.Q. Huang, R.S. Tichy, J.B. Goodenough, J. Am. Ceram. Soc. 81 (1998) 2565.
[8] Y. Arachi, H. Sakai, O. Yamamoto, Y. Takeda, N. Imanishai, Solid State Ionics 121
(1999) 133.
[9] J.B. Goodenough, K. Huang, Lanthanum Gallate as a New SOFC Electrolyte,
Proceedings the FuelCells’97 ReviewMeeting (1997).
[10] S.C. Singhal, K. Kendall, High-temperature solid oxide fuel cells : fundamentals,
design, and applicatons, Elsevier Advanced Technology, New York 2003.
[11] Y. Ji, J. Liu, T.M. He, L.G. Cong, J.X. Wang, W.H. Su, J. Alloys Compd. 353
(2003) 257.
[12] M. Juhl, S. Primdahl, C. Manon, M. Mogensen, J. Power Sources 61 (1996) 173.
[13] Z.P. Shao, S.M. Haile, Nature 431 (2004) 170.
[14] C.R. Xia, W. Rauch, F.L. Chen, M.L. Liu, Solid State Ionics 149 (2002) 11.

35
[15] H.S. Spacil, U.S. (1970).
[16] Y. Matsuzaki, I. Yasuda, Solid State Ionics 132 (2000) 261.
[17] X. Turrillas, A.P. Sellars, B.C.H. Steele, Solid State Ionics 28 (1988) 465.
[18] J.B. Goodenough, Y.H. Huang, J. Power Sources 173 (2007) 1.
[19] A. Atkinson, S. Barnett, R.J. Gorte, J.T.S. Irvine, A.J. Mcevoy, M. Mogensen, S.C.
Singhal, J. Vohs, Nature Materials 3 (2004) 17.
[20] S.P. Jiang, S.H. Chan, J. Mater. Sci. 39 (2004) 4405.
[21] M. Mogensen, K. Kammer, Annual Review of Materials Research 33 (2003) 321.
[22] J.W. Fergus, Solid State Ionics 177 (2006) 1529.
[23] W.Z. Zhu, S.C. Deevi, Materials Science and Engineering a-Structural Materials
Properties Microstructure and Processing 362 (2003) 228.
[24] B.C.H. Steele, Solid State Ionics 129 (2000) 95.
[25] S. McIntosh, J.M. Vohs, R.J. Gorte, Electrochim. Acta 47 (2002) 3815.
[26] C. Lu, W.L. Worrell, R.J. Gorte, J.M. Vohs, J. Electrochem. Soc. 150 (2003)
A354.
[27] S.W. Tao, J.T.S. Irvine, Chemical Record 4 (2004) 83.
[28] C.W. Sun, J. Sun, G.L. Xiao, H.R. Zhang, X.P. Qiu, H. Li, L.Q. Chen, J. Phys.
Chem. B 110 (2006) 13445.
[29] N.V. Skorodumova, S.I. Simak, B.I. Lundqvist, I.A. Abrikosov, B. Johansson,
Phys. Rev. Lett. 89 (2002).
[30] O.A. Marina, N.L. Canfield, J.W. Stevenson, Solid State Ionics 149 (2002) 21.
[31] T. Hibino, A. Hashimoto, K. Asano, M. Yano, M. Suzuki, M. Sano,
Electrochemical and Solid State Letters 5 (2002) A242.
[32] T. Hibino, A. Hashimoto, M. Yano, M. Suzuki, M. Sano, Electrochim. Acta 48
(2003) 2531.
[33] X.F. Ye, B. Huang, S.R. Wang, Z.R. Wang, L. Xiong, T.L. Wen, J. Power Sources
164 (2007) 203.
[34] D. Hirabayashi, A. Hashimoto, T. Hibino, U. Harada, M. Sano, Electrochemical
and Solid State Letters 7 (2004) A108.
[35] M. Tournoux, M. Ganne, Y. Piffard, J. Solid State Chem. 96 (1992) 141.
[36] J.L.B. A. Kaiser, P. R. Slater, J. T. S. Irvine, Solid State Ionics 135 (2000) 519.
[37] P.R. Slater, J.T.S. Irvine, Solid State Ionics 124 (1999) 61.
[38] P.R. Slater, J.T.S. Irvine, Solid State Ionics 120 (1999) 125.
[39] S. Kramer, M. Spears, H.L. Tuller, Solid State Ionics 72 (1994) 59.
[40] O. Porat, C. Heremans, H.L. Tuller, Solid State Ionics 94 (1997) 75.
[41] B.A. Boukamp, Nature Materials 2 (2003) 294.
[42] P.R. Slater, J.T.S. Irvine, T. Ishihara, Y. Takita, Solid State Ionics 107 (1998) 319.
[43] T. Ishihara, H. Matsuda, Y. Takita, J. Am. Chem. Soc. 116 (1994) 3801.
[44] T. Ishihara, H. Matsuda, Y. Takita, Solid State Ionics 79 (1995) 147.
[45] S.W. Tao, J.T.S. Irvine, Nature Materials 2 (2003) 320.
[46] S.W. Zha, P. Tsang, Z. Cheng, M.L. Liu, J. Solid State Chem. 178 (2005) 1844.
[47] A. Hartley, M. Sahibzada, M. Weston, I.S. Metcalfe, D. Mantzavinos, Catal.
Today 55 (2000) 197.
[48] U. Balachandran, B. Ma, P.S. Maiya, R.L. Mieville, J.T. Dusek, J.J. Picciolo, J.
Guan, S.E. Dorris, M. Liu, Solid State Ionics 108 (1998) 363.

36
[49] J.C. Grenier, G. Schiffmacher, P. Caro, M. Pouchard, P. Hagenmuller, J. Solid
State Chem. 20 (1977) 365.
[50] Y.H. Huang, R.I. Dass, Z.L. Xing, J.B. Goodenough, Science 312 (2006) 254.
[51] Y.H. Huang, R.I. Dass, J.C. Denyszyn, J.B. Goodenough, J. Electrochem. Soc. 153
(2006) A1266.
[52] S.Q. Hui, A. Petric, J. Eur. Ceram. Soc. 22 (2002) 1673.
[53] D.P. Fagg, V.V. Kharton, A.V. Kovalevsky, A.P. Viskup, E.N. Naumovich, J.R.
Frade, J. Eur. Ceram. Soc. 21 (2001) 1831.
[54] V.M. Goldschmidt, Mat.-Naturv. Kl. 2 (1926) 117.
[55] C. Schinzer, Distortion of Perovskiutes, (1997).
[56] D.M. Giaquinta, H.C. zur Loye, Chem. Mater. 6 (1994) 365.
[57] S.J. Schneider, R.S. Roth, J.L. Waring, Journal of Research of the National Bureau
of Standards A 65 (1961) 345.
[58] S. Geller, V.B. Bala, Acta Crystallographica 9 (1956) 1019.
[59] A.F. Reid, A.E. Ringwood, Journal of Geophysical Research 80 (1975) 3363.
[60] R.S. Roth, S.J. Schneider, Journal of Research of the National Bureau of Standards
Section a-Physics and Chemistry 64 (1960) 309.
[61] F. Bertaut, Marescha.J, Comptes Rendus Hebdomadaires Des Seances De L
Academie Des Sciences 257 (1963) 867.
[62] D.M. Giaquinta, W.M. Davis, H.C. zur Loye, Acta Crystallographica Section C-
Crystal Structure Communications 50 (1994) 5.
[63] S. Geller, J.B. Jeffries, P.J. Curlander, Acta Crystallographica Section B-Structural
Science 31 (1975) 2770.
[64] P. Villars, Journal of the Less-Common Metals 102 (1984) 199.
[65] A.F. Reid, A.E. Ringwood, Journal of Geophysical Research 74 (1969) 3238.
[66] H. Arai, T. Yamada, K. Eguchi, T. Seiyama, Applied Catalysis 26 (1986) 265.
[67] J.C. Slater, Physical Review 78 (1950) 748.
[68] T. Ishihara, Perovskite oxide for solid oxide fuel cells, Springer, New York 2009.
[69] J.G. Bednorz, K.A. Muller, Zeitschrift Fur Physik B-Condensed Matter 64 (1986)
189.
[70] P.H. Hor, R.L. Meng, Y.Q. Wang, L. Gao, Z.J. Huang, J. Bechtold, K. Forster,
C.W. Chu, Phys. Rev. Lett. 58 (1987) 1891.
[71] S. Shin, H. Arakawa, Y. Hatakeyama, K. Ogawa, K. Shimomura, Mater. Res. Bull.
14 (1979) 633.
[72] Y. Teraoka, T. Harada, S. Kagawa, Journal of the Chemical Society-Faraday
Transactions 94 (1998) 1887.
[73] H. Yasuda, T. Nitadori, N. Mizuno, M. Misono, Bull. Chem. Soc. Jpn. 66 (1993)
3492.
[74] H. Iwakuni, Y. Shinmyou, H. Yano, H. Matsumoto, T. Ishihara, Applied Catalysis
B-Environmental 74 (2007) 299.
[75] C.V. Stephenson, Bull. Am. Phys. Soc. 3 (1958) 299.
[76] T. Takahashi, H. Iwahara, Energy Conversion 11 (1971) 105.
[77] T. Ishihara, H. Matsuda, Y. Mizuhara, Y. Takita, Solid State Ionics 70 (1994) 234.

37
CHAPTER 3
COMPUTATIONAL METHODS
3.1 Density Functional Theory (DFT)
Density functional theory (DFT) methods are based on the Hohenberg-Kohn
theorem, which states that the ground state electronic energy of an atom or molecule can
be expressed as a functional of the electron density of the molecule [1]. The term
―functional‖ refers to a function of a function, which means that the energy has a
functional dependence on , and then is the function of the coordinates of the electrons
[1]. DFT has become increasingly useful for the understanding and calculation of ground
state densities and energies of molecules, clusters and solids. Particularly in past three
decades, DFT has been extensively used by physicists as a tool to calculate the electronic
structure of solids. DFT is an alternative approach to the traditional quantum chemistry
methods which are primarily based on the many-electron wave function.
3.1.1 DFT formalism
In the following, we briefly describe the fundamentals of DFT. To obtain a better
understanding of the Hohenberg-Kohn theorem, the total electronic energy is defined as,

38
𝐸 = 𝑇 + 𝑉𝑛𝑢𝑐𝑙 + 𝑉𝑟𝑒𝑝 + 𝐸𝑋𝐶 , (3.1)
where T is the electronic kinetic energy, 𝑉𝑛𝑢𝑐𝑙 is the interaction of the electron with the
nuclei, 𝑉𝑟𝑒𝑝 is the interelectronic coulomb repulsion, and 𝐸𝑋𝐶 is the exchange correlation
functional. The nuclear attraction and coulomb repulsion interactions can be expressed
as [1]:
𝑉𝑛𝑢𝑐𝑙 = − 𝑍∝𝜌(1)
𝑟1𝛼𝑑𝜏1∝ ; (3.2)
𝑉𝑟𝑒𝑝 =1
2
𝜌 1 𝜌(2)
𝑟12𝑑𝜏1 𝜏2. (3.3)
Equations 3.2 and 3.3 highlight that both 𝑉𝑛𝑢𝑐𝑙 and 𝑉𝑟𝑒𝑝 are functionals of . Although
the exact expression of the kinetic energy T is quite complicated and not completely
known, it can also be expressed in terms of the electron density. For electrons in boxlike
potentials, one can describe the kinetic energy as
𝑇 =3
10(3𝜋2)2/3 𝜌5/3𝑑𝜏. (3.4)
In gradient-corrected DFT theories, the kinetic energy functional is improved by taking
into account the gradient of . These theories are rarely used in applications to the
electronic structure of molecules. The more traditional expression involving the
wavefunction is used instead.
𝑇 = −1
2 𝜓𝑖∇
2𝑖 𝜓𝑖𝑑𝜏 (3.5)
The exchange correlation energy, 𝐸𝑋𝐶 , includes the effects of electron exchange and
correlation. There is no exact expression for 𝐸𝑋𝐶 ; however, several approximate
expressions have been developed in order to describe the exchange correlation energy.
The simplest DFT approximation is the local density approximation (LDA), which is

39
𝐸𝑋𝐶 = −9
8
3
𝜋
1/5
𝛼 𝜌(1)4/3𝑑𝜏1, (3.6)
where is unity when a free-electron gas model is used and values of about 0.7 are
generally used for molecules [1].
In fact, for a molecular system the electron density is typically rather far from
spatially uniformity, so it is believed that the LDA approach has significant limitations.
To improve the correlation functional it is made not only dependent on the local value of
the electron density, but also on the gradient of the density. This approach which includes
a gradient correction is referred to as ‗generalized gradient approximation‘ (GGA) [2].
Most gradient corrected functionals are constructed by adding a correction term to the
LDA functional, i.e.,
𝐸𝑋𝐶𝐺𝐺𝐴 𝜌 𝑟 = 𝐸𝑋𝐶
𝐿𝑆𝐷 𝜌 𝑟 + ∆𝐸𝑋𝐶 ∇𝜌(𝑟)
𝜌43(𝑟)
. (3.7)
Note that the dependence of the correction term is the dimensionless reduced gradient not
the absolute gradient.
In recent years, a variety of gradient-corrected density functional methods have
been developed yielding structures and energetic properties of molecules, which are
significantly better than results from conventional Hartree-Fock (HF) theory. However,
there is no systematic approach for achieving the exact solution to the Schrodinger
equation through the use of a more accurate gradient correction.
If the Eq. 3.2 - 3.4, and 3.6 are combined and substituted into Eq. 3.1, the energy
is expressed only in terms of the electron density which means that there is no need to
determine the wave function. Nevertheless, it is difficult to achieve high accuracy with
this approach; therefore, in practice the self consistent field approach is used to determine
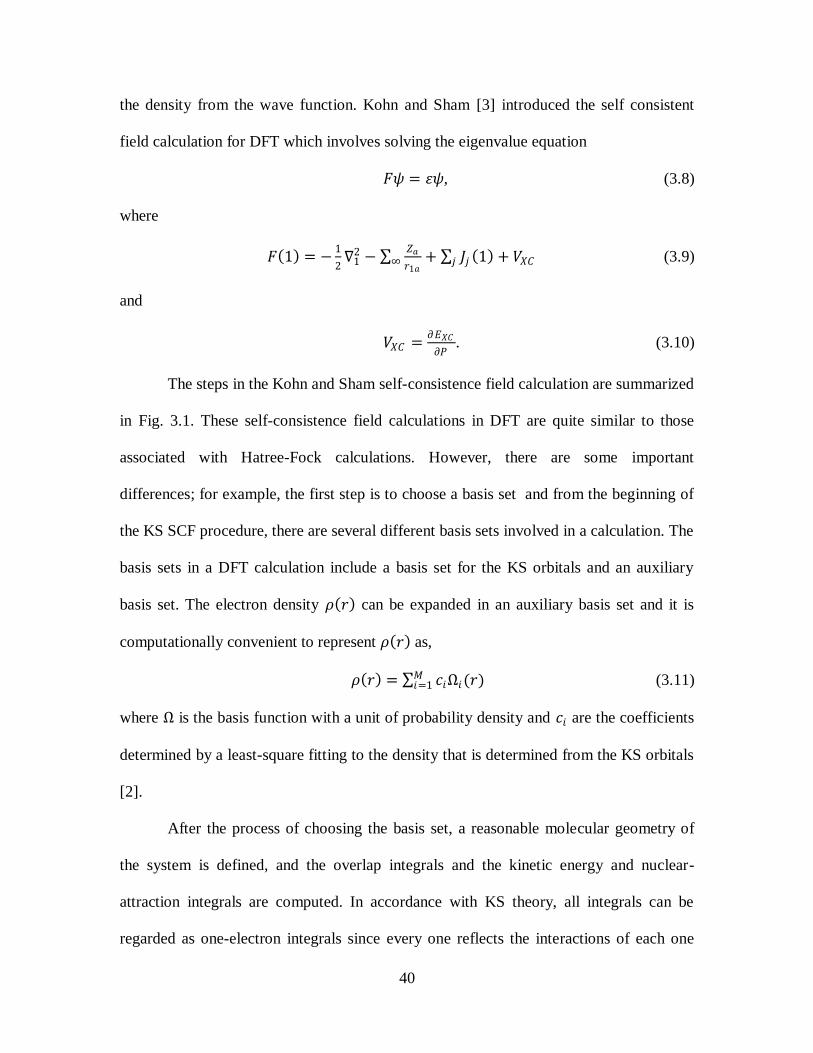
40
the density from the wave function. Kohn and Sham [3] introduced the self consistent
field calculation for DFT which involves solving the eigenvalue equation
𝐹𝜓 = 휀𝜓, (3.8)
where
𝐹 1 = −1
2∇1
2 − 𝑍𝑎
𝑟1𝑎+ 𝐽𝑗 1 + 𝑉𝑋𝐶𝑗∞ (3.9)
and
𝑉𝑋𝐶 =𝜕𝐸𝑋𝐶
𝜕𝑃. (3.10)
The steps in the Kohn and Sham self-consistence field calculation are summarized
in Fig. 3.1. These self-consistence field calculations in DFT are quite similar to those
associated with Hatree-Fock calculations. However, there are some important
differences; for example, the first step is to choose a basis set and from the beginning of
the KS SCF procedure, there are several different basis sets involved in a calculation. The
basis sets in a DFT calculation include a basis set for the KS orbitals and an auxiliary
basis set. The electron density 𝜌 𝑟 can be expanded in an auxiliary basis set and it is
computationally convenient to represent 𝜌 𝑟 as,
𝜌 𝑟 = 𝑐𝑖Ω𝑖(𝑟)𝑀𝑖=1 (3.11)
where Ω is the basis function with a unit of probability density and 𝑐𝑖 are the coefficients
determined by a least-square fitting to the density that is determined from the KS orbitals
[2].
After the process of choosing the basis set, a reasonable molecular geometry of
the system is defined, and the overlap integrals and the kinetic energy and nuclear-
attraction integrals are computed. In accordance with KS theory, all integrals can be
regarded as one-electron integrals since every one reflects the interactions of each one

41
with external potentials. In order to evaluate the remaining integrals, an initial density
must be guessed by constructing a density matrix, which is equivalent to the density
matrix used in HF theory. Next, 𝑉𝑋𝐶 can be constructed from the guessed density and the
fitting coefficients of the auxiliary basis sets. At this point, all integrals in each KS matrix
element have been evaluated. Thereafter, the electron density is obtained from the new
orbitals and compared to the density from the preceding iteration. Once convergence of
this SCF procedure is achieved, the energy is computed and a geometry optimization can
be performed.
The key strength of DFT methods based on the Kohn-Sham procedure is that the
accuracy of the computational result is more reliable than results from HF theory. The HF
method is preferable when dealing with few-atom systems, whereas DFT is preferable
when the system contains more than 5-10 atoms [4]. Besides the concept of
computational expense, DFT and traditional HF methods are theoretically
complementary.
3.1.2 DFT + U methodology
Although the start of Kohn-Sham DFT has enabled accurate first principle
simulations of many-atom systems, there still exist classes of systems or phenomena for
which current forms of DFT fail. This is because of the use of approximate exchange
correlation (XC) functionals. Therefore, the development of computationally efficient
methods that can capture the essential physics missing in approximate XC functionals is
needed [5].
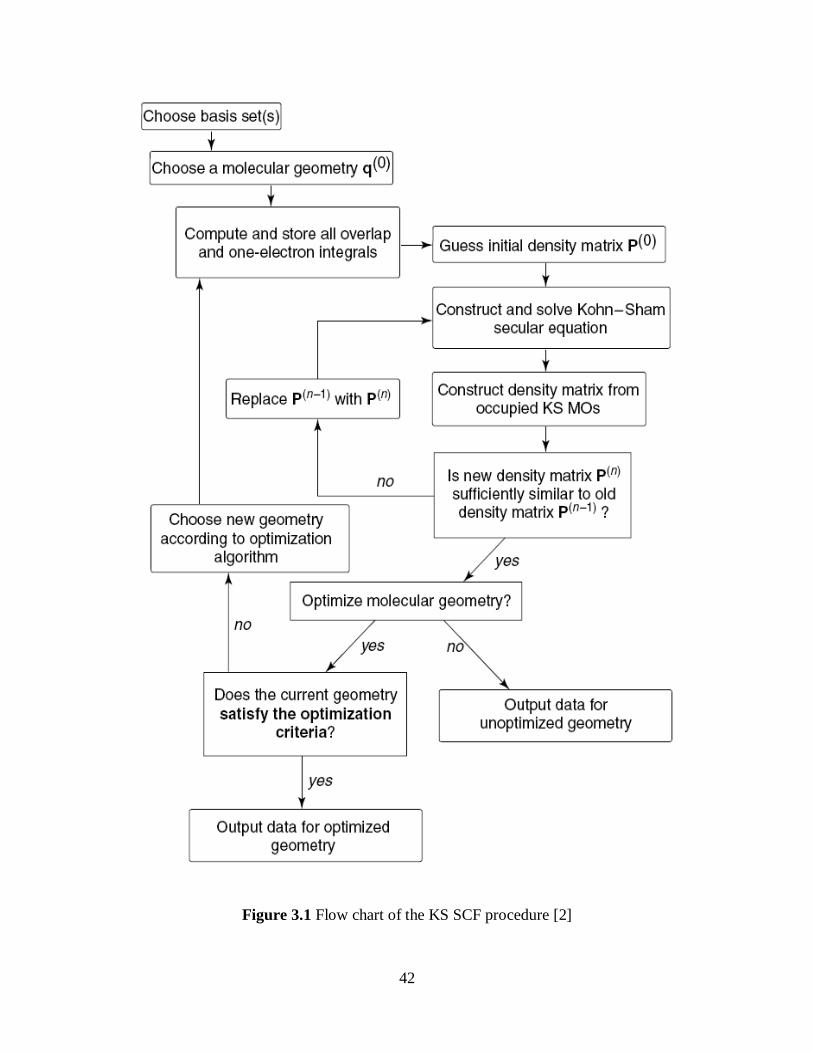
42
Figure 3.1 Flow chart of the KS SCF procedure [2]

43
Strongly correlated electron materials (SCEMs) are one of the most important
classes of materials that are unsuccessfully described by conventional DFT. SCEMs
include actinides and middle-to-late transition metal oxides, which have many electrons
in partially filled d or f shells. These d and f electrons are naturally localized on each
metal atom leading to numerous associated intra-atomic exchange and large Coulomb
energy terms. The electron-electron repulsion in these systems is always predicted to be
way too large because approximate exchange correlation functions implemented in
conventional DFT fail to cancel out the spurious electron self-interaction. Therefore, the
electrons treated by conventional DFT incorrectly delocalize to lessen the repulsion
energy. This is the main reason why conventional DFT predicted a known insulator to be
metallic [5].
A solution to this problem lies on the ability to accurately account for self-
interaction energies that primarily occurs from d and f localized electrons. It is well
known that Hatree-Fock (HF) theory can solve this problem since HF calculations
contain exact exchange and are free of self-interaction. However, these methodologies
are very computationally expensive and have not been implemented for extended crystals
[6, 7]. Currently, DFT + U is the technique most frequently used to treat SCEM systems
[8, 9]. In this approach, the electronic structure is divided into localized and delocalized
states. The interactions between localized electrons on the same atomic center (on-site
interactions) are treated by HF whereas the remaining interactions are treated with DFT.
This is very reasonable since the errors incurred by DFT are due to the intra-atomic self-
interaction error, which should be correctly treated by an HF approach. Practically, a
parameterized Hamiltonian is used to evaluate the on-site interaction energy instead of
44
using an explicit HF calculation. The parameters that enter into the Hamiltonian relate to
the average Coulomb (U) and exchange (J) interactions between electrons of the same
angular momentum that are localized on the same atom. To perform an accurate DFT + U
calculations, one needs to choose suitable values for these parameters. Generally, there
are two different methods for determining the values of these parameters. In one way, one
can tune the values to reproduce known properties of the system of interest. In another
way, one can obtain the values of U and J parameters by performing constrained DFT
calculations of the system.
The DFT + U method utilizes HF theory to evaluate the on-site interactions
between localized electrons and uses DFT to compute all other electronic terms. The total
energy functional can be expressed by the following [5]:
𝐸𝐷𝐹𝑇 +𝑈 = 𝐸𝐷𝐹𝑇 + 𝐸𝑜𝑛−𝑠𝑖𝑡𝑒 − 𝐸𝑑𝑐 , (3.12)
where 𝐸𝐷𝐹𝑇+𝑈 is the total energy of the system, 𝐸𝐷𝐹𝑇 is the DFT calculated energy of the
system based on the total electron density, 𝐸𝑜𝑛−𝑠𝑖𝑡𝑒 is the HF energy calculated from on-
site interactions between localized electrons, and 𝐸𝑑𝑐 is a double counting term which is
used to correct the total energy. According to the approach proposed by Durarev et al.
[10], one can rewrite the total energy form as the following;
𝐸𝐷𝐹𝑇+𝑈 = 𝐸𝐷𝐹𝑇 + 𝑈𝐼𝑙−𝐽 𝐼𝑙
2 𝐼,𝑙 ,𝑚 ,𝜍 𝑛𝐼𝑙𝑚𝜍 − 𝑛𝐼𝑙𝑚𝜍
2 (3.13)
Note that the first term on the right hand side of this equation represents the DFT energy
obtained using the total electron density (on-site interactions included). Since it is known
that conventional DFT miscalculates the total energy of the system, the second term on
the right hand side is used to correct this behavior. The values of U and J are always
positive whereas 𝑛𝐼𝑙𝑚𝜍 ranges from 0 to 1. Eventually, the second term acts as a penalty

45
function that corrects the DFT calculations and leads to an improved description of the
electronic structure. In this way, the energies of the localized states will be shifted from
their DFT values, which results in the increasing of band gap and insulating character of
the system. The values of U and J must be provided in order to perform a DFT + U
calculation. These values are system dependent and need to be determined for each
particular system. Therefore, wisely selecting appropriate values for these parameters is
the key challenge in performing a meaningful DFT + U calculation.
3.2 Ab initio Thermodynamic Simulations
The stability of metals and metal oxides at elevated temperatures has become a
key challenge in several industries such as aerospace, power generation, metallurgical
processing, chemical engineering, and catalysis. For example, one would question if a
catalyst remain stable at reducing condition and elevated temperatures or one would
want to know how the surface of a catalyst looks like under reaction conditions.
3.2.1 Stability of bulk metal oxides [11]
In atomistic studies, one can use a tool called ab initio thermodynamics to
computationally predict the stability of the interested materials. To perform ab initio
thermodynamic calculations, we take into account the environmental conditions (e.g.
temperature and oxygen partial pressure) by combining the total energy of electronic
structure calculations with a thermodynamic description of the system. The general
procedure will be described in the following fashion. Let us consider the phase stability
of a metal, M, in equilibrium with gas phase O2 at specified pressure, pO2, and
temperature, T. In particular, we will determine the thermodynamic stability of Cu and
Cu2O at various oxygen partial pressures and temperatures. In this manner, we would like

46
to know which material minimizes the free energy of a system containing gaseous O2 and
a material at specified conditions. One useful way to perform this is to define the grand
potential related to each crystal structure. We can define the grand potential of a metal
oxide containing 𝑁𝑀 metal atoms and 𝑁𝑜oxygen atoms by the following
Ω 𝑇, 𝜇𝑂 , 𝜇𝑀 = 𝐸 𝑁𝑀 , 𝑁𝑂 − 𝑇𝑆 − 𝜇𝑂𝑁𝑜 − 𝜇𝑀𝑁𝑀 , (3.14)
where E is the electronic DFT energy of the metal oxide, S is the material‘s entropy, and
𝜇𝑎 is the chemical potential of atomic species 𝑎. We can use this expression to calculate
the grand potential of each material, Ω𝑖 . We can then normalize the DFT energy of each
material, 𝐸𝑖 , so that every DFT calculation describes a material with same total number of
atoms. In this way, we can compare the grand potentials of different systems. If we do
this, Eq. 3.14 can be rewritten as
Ωi 𝑇, 𝜇𝑂 = 𝐸𝑖 − 𝑇𝑆𝑖 − 𝜇𝑂𝑁𝑜 ,𝑖 − ΩM , (3.15)
where ΩM is an additive constant that is the same for every material. The chemical
potential of an oxygen atom can be determined by the temperature and pressure of
gaseous O2. From ideal gas law, we can define the chemical potential of gaseous O2 as
the following
𝜇𝑂2= 𝜇𝑂2
𝜊 𝑇, 𝑝𝜊 + 𝑘𝑇𝑙𝑛(𝑝𝑂2/𝑝𝑂2
𝜊 ) , (3.16)
where the superscript 𝜊 denotes a reference pressure, usually take to be 1 atm. The
chemical potential of an oxygen atom can be defined as
𝜇𝑂 =1
2𝜇𝑂2
. (3.17)
When comparing crystalline solids, the differences in the entropic contributions
between different structures are usually insignificant when comparing with the
contributions from electronic DFT energies. Therefore, we can treat the entropic

47
contributions as being approximately constant for all the crystal structures we consider
and the grand potential becomes
Ωi 𝑇, 𝜇𝑂 = 𝐸𝑖 − 𝜇𝑂𝑁𝑜 ,𝑖 − ΩSM , (3.18)
where ΩSM is an additive constant that is the same for every material. Note that we can set
ΩSM to zero without any loss of generality since we are only interested in the material that
provides the lowest grand potential. Now, we can calculate the grand potential which
only involves the DFT-calculated energies of the metals and metal oxides of interest and
the pressure and temperature of gaseous O2. The material that gives the lowest grand
potential is the material that minimizes the free energy of the combination of gaseous O2
and solid.
Figure 3.2 demonstrates the application of Eq. 3.18 for Cu and Ag which shows
the relative stability of M and M2O. The dotted lines in Fig. 3.2(a) show the grand
potential as a function of chemical potential of gaseous O2. The line for pure metal, M,
has a slope of zero because 𝑁𝑜 = 0 in this case whereas the line for metal oxide has a
negative slope. The thick curves denote the structure with lowest grand potential as the
chemical potential is varied. At low oxygen chemical potential, the bulk metal is
thermodynamically stable whereas at high value of chemical potential the metal oxide is
the favored material. This makes a lot physical sense because it is more favorable for a
metal to get oxidized and become a metal oxide at high oxygen chemical potential. The
schematic phase diagram of metal and its oxide is shown in Fig. 3.2(b). This phase
diagram confirms that metal oxides can be reduced to metals by holding the material at
high enough temperature or in a low enough oxygen partial pressure.

48
Figure 3.2 (a) Schematic grand potential diagram for oxidation of metal and its oxide and
(b) the phase diagram defined by the grand potential diagram
Furthermore, we can compare more than one oxide species in ab inito
thermodynamic calculations. Figure 3.3 shows an extension of the grand potential
diagram of bulk metal, M, M2O and M2O3. It can be seen from the diagram that the newly
added species, M2O3 is not favorable since the calculated grand potential of this oxide
lies above the grand potential of another oxide M2O. This means that the phase diagram
shown in Fig. 3.2(b) is still correct even when M2O3 is considered in addition to M and
M2O. It is noteworthy that using this method can only tell us the relative stability of
materials of interest. In other words, we can only compare the thermodynamic stability of
the materials that we performed DFT calculations.

49
Figure 3.3 Extension of the grand potential diagram from Fig. 3.2 with the addition of a
metal oxide M2O3
Figure 3.4 depicts the calculated phase diagram of Au and Cu and their oxides.
The diagram confirms that Ag is much more resistant to oxidation than Cu. It is important
to note that this phase diagram only represents the thermodynamic stability of each
material; it does not provide any information about the kinetic of how fast the material
can reach the equilibrium. Furthermore, it should be expected that the results from
calculated phase diagram are not exact. This is because our calculations neglected the
influence of vibrational contributions to the free energies of the solids. More importantly,
the total energies from DFT calculations include systematic errors because of the inexact
nature of DFT.

50
Figure 3.4 DFT-calculated phase diagram for oxidation of bulk Cu and Ag.
3.2.2 Stability of metal and metal oxide surfaces [12]
In this section, we describe in details the thermodynamic formalism used to
calculate surface phase diagrams of the most stable structures of various surface
terminations as a function of external environmental conditions [13-22]. A basic
assumption is that the surface terminations are in thermodynamic equilibrium with
separate reference phases for each atomic species i at a given temperature, T, and
pressure, p. By adsorption and desorption processes, the surface allows to exchange any
amount of atoms with each reference phase without changing the temperature or pressure
while the total number of atoms, 𝑁𝑖𝑡𝑜𝑡 is held constant. Figure 3.5 illustrates the
schematic of a surface in contact with a reference phase of atomic species i. Gibbs free
energy is the suitable thermodynamic potential for a situation with fixed temperature,

51
pressure, and number of particles. Note that the total number of atoms, 𝑁𝑖𝑡𝑜𝑡 , are equal to
sum of the number of atoms of the surface, 𝑁𝑖 , and number of atoms in the reference
phases, 𝑁𝑖𝑟𝑒𝑓
.
𝑁𝑖 + 𝑁𝑖𝑟𝑒𝑓
= 𝑁𝑖𝑡𝑜𝑡 . (3.19)
Figure 3.5 Schematic illustration of a surface in contact with a reference phase of atomic
species 𝑖 at particular temperature and pressure [12].
In equilibrium, the most stable structure of the surface is the one that minimizes
the total Gibbs free energy of the system:
𝐺𝑠𝑙𝑎𝑏 𝑇, 𝑝, 𝑁𝑖 + 𝐺 𝑖 𝑇, 𝑝, 𝑁𝑖𝑟𝑒𝑓 = 𝑚𝑖𝑛𝑖 , (3.20)
where 𝐺𝑠𝑙𝑎𝑏 𝑇, 𝑝, 𝑁𝑖 is the Gibbs free energy of the surface and 𝐺 𝑖 𝑇, 𝑝, 𝑁𝑖𝑟𝑒𝑓 is the
Gibbs free energy of the reference phases 𝑖. We can transform this equation using the
Euler equation to substitute the Gibbs free energy of the reference phases by chemical
potentials, 𝜇𝑖 𝑇, 𝑝 ;
𝐺 𝑖 𝑇, 𝑝, 𝑁𝑖𝑟𝑒𝑓 = 𝑁𝑖
𝑡𝑜𝑡 − 𝑁𝑖 𝜇𝑖 𝑇, 𝑝 . (3.21)

52
Then, the Gibbs free surface energy, 𝛾(𝑇, 𝑝) is defined by subtracting the total free
energy of the system (Eq. 3.20) by the total free energy of the atoms, 𝑁𝑖𝑡𝑜𝑡
𝑖 𝜇𝑖 𝑇, 𝑝 ,
and normalizing the results to an energy per unit area;
𝛾 𝑇, 𝑝 =1
𝐴 𝐺𝑠𝑙𝑎𝑏 𝑇, 𝑝, 𝑁𝑖 − 𝑁𝑖𝑖 𝜇𝑖 𝑇, 𝑝 . (3.22)
As also shown in Eq. 3.20, the most stable surface configuration is again the one that
minimizes the Gibbs free surface energy. To determine which surface configuration is the
most stable in particular environmental conditions, we calculate the surface free energy
of a series of surface models with different structures and compositions as a function of
the chemical potentials. For a given chemical potential, the surface model that gives the
lowest surface free energy is the most stable surface. Then, we can relate the chemical
potentials to actual temperature and pressure by assuming that the surface is in
thermodynamic equilibrium with the reference phases.
For example, let us consider a simple system with AxBy composition. In this
particular case, there are only two chemical potentials that we have to consider, 𝜇𝐴 and
𝜇𝐵 . However, these two chemical potentials are not independent. Eventually, we can
relate the chemical potentials of each atom to the Gibbs free energy of a bulk unit cell
since we can assume that the surface is always in equilibrium with its own bulk.
𝜇𝐴 𝑇, 𝑝 + 𝜇𝐵 𝑇, 𝑝 = 𝐺𝑏𝑢𝑙𝑘𝐴𝐵 (𝑇, 𝑝) . (3.23)
Therefore, we can eliminate one of the chemical potentials in Eq. 3.22;
𝛾 𝑇, 𝑝 =1
𝐴 𝐺𝑠𝑙𝑎𝑏 𝑇, 𝑝, 𝑁𝐴, 𝑁𝐵 − 𝑁𝐴𝐺𝑏𝑢𝑙𝑘
𝐴𝐵 𝑇, 𝑝 + (𝑁𝐴 − 𝑁𝐵)𝜇𝐵 𝑇, 𝑝 . (3.24)
Since we are only interested in the relative stability of surfaces with different
composition, it is useful to introduce a reference surface structure with Gibbs free energy,

53
𝐺𝑠𝑙𝑎𝑏𝜊 (𝑇, 𝑝), and number of atoms, 𝑁𝐴
𝜊 , 𝑁𝐵𝜊 . Then, we can relate all energies relative to the
reference surface and the change of Gibbs free surface energy can be defined as follows;
Δ𝛾 𝑇, 𝑝 =1
𝐴 𝐺𝑠𝑙𝑎𝑏 𝑇, 𝑝, 𝑁𝐴, 𝑁𝐵 − 𝐺𝑠𝑙𝑎𝑏
𝜊 𝑇, 𝑝 − Δ𝑁𝐴𝐺𝑏𝑢𝑙𝑘𝐴𝐵 𝑇, 𝑝 + (Δ𝑁𝐴 −
Δ𝑁𝐵)𝜇𝐵 𝑇, 𝑝 , (3.25)
where the changes in number of atoms are Δ𝑁𝐴 = 𝑁𝐴 − 𝑁𝐴𝜊 and Δ𝑁𝐵 = 𝑁𝐵 − 𝑁𝐵
𝜊 . Note
that the difference of Gibbs free surface energy is negative when a surface is more stable
than the reference surface structure.
In principle, it seems like we have to calculate all Gibbs free energies of every
surface and bulk species in the system. In practice, however, we can neglect all entropy
and volume effects for the slabs and bulk phases since the vibrational contributions to the
entropy usually cancel out when we calculate the difference of Gibbs free energies [20].
Therefore, it is quite common to replace Gibbs free energy by the internal energy as they
are obtained from the total energy calculations;
Δ𝛾 𝑇, 𝑝 =1
𝐴 𝐸𝑠𝑙𝑎𝑏 𝑁𝐴, 𝑁𝐵 − 𝐸𝑠𝑙𝑎𝑏
𝜊 − Δ𝑁𝐴𝐸𝑏𝑢𝑙𝑘𝐴𝐵 + (Δ𝑁𝐴 − Δ𝑁𝐵)𝜇𝐵 𝑇, 𝑝 . (3.26)
Nevertheless, the chemical potentials are still functions of temperature and pressure
which represent the effect of external environment.
3.3 Kinetic Models for Catalytic Reactions [23]
A mean-field microkinetic model [24] is an efficient tool for consolidation of
fundamental information about a catalytic process. It is used to predict information about
surface coverages under reaction conditions and relative rates of various elementary
steps. The model used calculated DFT results such as activation energies and binding
energies as initial estimates to predict the reaction behavior under a variety of different

54
conditions. Although, the results obtained from this model are dependent on the initial
guesses of various input parameters, the model has true predictive power. In this section,
we briefly describe some important concepts in microkinetic modeling and show how we
can obtain a better understanding of catalytic reactions on the surface from DFT studies.
3.3.1 Rate constant
DFT calculations can be used to define the rates of chemical processes that
involve energy barriers. Transition state theory is usually used to calculate the rate
constant for reactions involving bond-making or bond-breaking whereas collision theory
is used to determine the rate constant for the steps involving adsorption and desorption
processes. In transition state theory, we assume that reactants and an activated complex
are in quasi-equilibrium. Consider an elementary step A* + B* C* + D*, where *
denotes an adsorbed species, the transition state of this elementary step can be determined
using nudge elastic band (NEB) or climbing image nudge elastic band (CI-NEB)
methods. CI-NEB can be used to determine the minimum energy pathway (MEP)
between reactants and products by optimizing several discrete intermediate images. The
saddle point in this MEP represents the transition state (AB‡). As a result, we can express
the elementary reaction as follows:
𝐴∗ + 𝐵∗𝑘𝑓𝑜𝑟
‡
𝐴𝐵‡𝑘𝑓𝑜𝑟 𝐶∗ + 𝐷∗ , (3.27)
𝐶∗ + 𝐷∗𝑘𝑟𝑒𝑣
‡
𝐴𝐵‡𝑘𝑟𝑒𝑣 𝐴∗ + 𝐵∗ . (3.28)
Then, we can calculate the rate of the reaction for this elementary step using the
following equation:
𝑟 = 𝑘𝑓𝑜𝑟 𝜃𝐴𝜃𝐵 − 𝑘𝑟𝑒𝑣𝜃𝐶𝜃𝐷 . (3.29)

55
where 𝑘𝑓𝑜𝑟 and 𝑘𝑟𝑒𝑣 denote the forward and reverse rate constants and 𝜃𝐴 , 𝜃𝐵 , 𝜃𝐶 , and
𝜃𝐷 represent the surface coverages of the species A, B, C, and D, respectively.
Furthermore, we can calculate the equilibrium constant using the following relation:
𝐾 =𝑘𝑓𝑜𝑟
𝑘𝑟𝑒𝑣 . (3.30)
The forward rate constant is given as:
𝑘𝑓𝑜𝑟 = 𝐴𝜊exp −𝐸𝑓
𝑘𝐵𝑇 , (3.31)
where 𝑘𝐵 is the Boltzmann constant, 𝑇 is the reaction temperature, 𝐸𝑓 denotes the energy
barrier of the forward reaction and 𝐴𝜊 is the frequency factor which can be calculated
using the following expression:
𝐴𝜊 =𝑘𝐵𝑇
exp
Δ𝑆𝑓𝑜𝑟𝜊‡
𝑘𝐵 , (3.32)
where Δ𝑆𝑓𝑜𝑟𝜊‡ = 𝑆
𝐴𝐵‡𝜊‡ − (𝑆𝐴∗
𝜊 + 𝑆𝐵∗𝜊 ), is standard entropy change accompanying the
formation of the transition state 𝐴𝐵‡. To calculate the entropy of adsorbed species we can
perform DFT calculations to determine the vibrational modes of each adsorbed species.
The entropy contributions from vibrational modes can be evaluated using the harmonic
normal mode approximation as:
𝑆𝑣𝑖𝑏 = 𝑘𝐵 𝑥𝑖
𝑒𝑥𝑖−1− ln(1 − 𝑒−𝑥𝑖 )
# 𝑜𝑓 𝑚𝑜𝑑𝑒𝑠𝑖 . (3.33)
where 𝑥𝑖 is defined in terms of the vibration frequency, 𝜐𝑖 , as 𝑥𝑖 =𝜐𝑖
𝑘𝐵𝑇 . The same
procedure can be used to calculate the entropy of the transition state, 𝑆𝐴𝐵‡𝜊‡
.
On the other hand, we used collision theory to define rate constants for
adsorption-desorption processes. The rate of adsorption processes is given by [25]:
𝑟𝑓 =𝜍𝜊 (𝑇 ,𝜃)𝑃𝐴
2𝜋𝑚𝐴𝑘𝐵𝑇exp
−𝐸𝑓
𝑘𝐵𝑇 . (3.34)

56
where 𝑟𝑓 represents the adsorption rate, 𝑃𝐴 is the partial pressure of adsorbing species in
the gas phase, and 𝑚𝐴 is molecular weight of the species. The sticking probability,
𝜍𝜊(𝑇, 𝜃), is a function of temperature and surface coverage. The activation energies for
these processes are often zero since the adsorption-desorption processes are non-
activated. The rate is in units of molecules per unit surface area per time. Furthermore,
the turn over frequencies (TOF) can be calculated by multiplying the rates with the area
occupied by active sites (typically 10-15
cm2).
3.3.2 Equilibrium constant
For an elementary reaction 𝐴∗ + 𝐵∗ → 𝐶∗ + 𝐷∗, where * denotes an adsorbed
species, the equilibrium constant is given by:
𝐾 = exp −∆𝐺𝜊
𝑘𝐵𝑇 = exp
−∆𝑆𝜊
𝑘𝐵 exp
−∆𝐻𝜊
𝑘𝐵𝑇 , (3.35)
where ∆𝐺𝜊 , ∆𝑆𝜊 , and ∆𝐻𝜊 are the change in standard-state Gibbs free energy, entropy,
and enthalpy, respectively. DFT calculations provide an efficient way to calculate the
total electronic energy (TE) of a system, which can be used to determine the heat of the
reaction at standard state, ∆𝐻𝜊 . For the case of adsorption of a species on a surface, we
can estimate the heat of the reaction from the binding energy (BE) of the species. The BE
of the adsorbed species is given as BE = TE(adsorbed configuration) – TE(clean slab) –
TE(gas phase species). Thus, we can determine heat of reaction from:
Δ𝐻 = 𝐵𝐸 𝑃𝑟𝑜𝑑𝑢𝑐𝑡𝑠 − 𝐵𝐸 𝑅𝑒𝑎𝑐𝑡𝑎𝑛𝑡𝑠 + Δ𝐻𝑔𝑎𝑠𝑚𝑖=1
𝑛𝑖=1 . (3.36)
where n and m denote the number of product and reactant species, respectively, and
Δ𝐻𝑔𝑎𝑠 is the heat of reaction in the gas phase. We can improve the accuracy of the heat of
the reaction by correcting the binding energy using zero point energies and temperature
57
corrections. These parameters can be obtained from vibrational frequency calculations of
each species. The entropy contributions from Eq. 3.32 can be determined using Eq. 3.30
as previously described.
3.3.3 Rate controlling step
The rate controlling step is the elementary step that provides the maximum effect
to the overall rate of the reaction. We can use DFT-calculated energies and microkinetic
analyses to obtain the rate controlling step of a series of elementary reactions. It has been
suggested by Campbell [26] that the rate determining step of a reaction scheme can be
determined by computing the relative change in the overall reaction rate upon changing
the forward and reverse rate constant of the particular step, while maintaining the same
value of the equilibrium constant for the step. Therefore, we can define the degree of rate
control as:
𝑋𝑅𝐶 =𝑘𝑖
𝑟
𝛿𝑟
𝛿𝑘𝑖 𝐾𝑖 ,𝑘𝑗≠𝑖
. (3.37)
Note that the equilibrium constant for step i and all other rate constants are held constant.
3.3.4 Reaction orders and apparent activation energies
Another way to express the rate of overall reaction is to define it in the form of
Arrhenius rate expression as follows:
𝑟𝑜𝑣𝑒𝑟𝑎𝑙𝑙 = 𝐴𝜊exp −𝐸𝑎𝑝𝑝
𝑅𝑇 𝑃𝑖
𝛼𝑖 (1 − 𝛽)𝑖 , (3.38)
where 𝐴𝜊 denotes the frequency factor, 𝛼𝑖 denotes the reaction orders with respect to
species i , 𝐸𝑎𝑝𝑝 is the apparent activation energy and 𝛽 is the approach to equilibrium.
Note that 𝛽 can be expressed in terms of the net equilibrium constant and the partial
pressure of reactants and products as follows:
58
𝛽 =1
𝐾
𝑃𝑖
𝜍𝑖𝑃𝑟𝑜𝑑𝑢𝑐𝑡𝑠𝑖
𝑃𝑖
𝜍𝑖𝑅𝑒𝑎𝑐𝑡𝑎𝑛𝑡𝑠𝑖
, (3.39)
where 𝜍𝑖 represents stoichiometric coefficients. Such kinetic expressions are very
important to reactor design and optimization. Reaction orders, 𝛼𝑖 , and apparent activation
energy, 𝐸𝑎𝑝𝑝 play a crucial role in determining these kinetic expressions. In this manner,
we can perform a microkinetic analysis to predict how these parameters change upon
reaction conditions using the following equations:
𝛼𝑖 = d ln 𝑟𝑜𝑣𝑒𝑟𝑎𝑙𝑙
d ln 𝑝𝑖 𝑇,𝑝𝑗≠𝑖
, (3.40)
𝐸𝑎𝑝𝑝 = 𝑅𝑇2 d ln 𝑟𝑜𝑣𝑒𝑟𝑎𝑙𝑙
d 𝑇 , (3.41)
where 𝑝𝑖 is the partial pressure of the gas phase species i. Once we obtain various values
of reaction orders and apparent activation energies under different reaction regimes we
can generate explicit rate expressions without actually performing experiments under
these conditions.
3.5 References
[1] M.A. Ratner, G.C. Schatz, An introduction to quantum mechanics in chemistry,
Prentice Hall, Upper Saddle River, NJ 2000.
[2] C.J. Cramer, Essentials of computational chemistry : theories and models, Wiley,
Chichester 2004.
[3] W. Kohn, L.J. Sham, Physical Review 140 (1965) 1133.
[4] W. Kohn, A.D. Becke, R.G. Parr, Journal of Physical Chemistry 100 (1996) 12974.
[5] N.J. Mosey, E.A. Carter, Phys. Rev. B 76 (2007).
[6] P.Y. Ayala, K.N. Kudin, G.E. Scuseria, J. Chem. Phys. 115 (2001) 9698.
[7] C. Pisani, M. Busso, G. Capecchi, S. Casassa, R. Dovesi, L. Maschio, C. Zicovich-
Wilson, M. Schutz, J. Chem. Phys. 122 (2005).
[8] S.L. Dudarev, A.I. Liechtenstein, M.R. Castell, G.A.D. Briggs, A.P. Sutton, Phys.
Rev. B 56 (1997) 4900.
[9] A. VI, F. Aryasetiawan, A.I. Lichtenstein, J. Phys.: Condens. Matter 9 (1997) 767.
[10] S.L. Dudarev, G.A. Botton, S.Y. Savrasov, C.J. Humphreys, A.P. Sutton, Phys.
Rev. B 57 (1998) 1505.
[11] D.S. Sholl, J.A. Steckel, Density functional theory : a practical introduction,
Wiley, Hoboken, N.J. 2009.

59
[12] B. Meyer, In: S.B. J. Grotendorst, D. Marx, Editor, Computational Nanoscience:
Do It Yourself!, John con Neumann Institute for Computing, Julich (2006), pp. 411-418.
[13] E. Kaxiras, Y. Baryam, J.D. Joannopoulos, K.C. Pandey, Phys. Rev. B 35 (1987)
9625.
[14] E. Kaxiras, Y. Baryam, J.D. Joannopoulos, K.C. Pandey, Phys. Rev. B 35 (1987)
9636.
[15] E. Kaxiras, K.C. Pandey, Y. Baryam, J.D. Joannopoulos, Phys. Rev. Lett. 56
(1986) 2819.
[16] J. Padilla, D. Vanderbilt, Phys. Rev. B 56 (1997) 1625.
[17] A. Pojani, F. Finocchi, C. Noguera, Surf. Sci. 442 (1999) 179.
[18] I. Batyrev, A. Alavi, M.W. Finnis, Faraday Discuss. 114 (1999) 33.
[19] I.G. Batyrev, A. Alavi, M.W. Finnis, Phys. Rev. B 62 (2000) 4698.
[20] K. Reuter, M. Scheffler, Surf. Sci. 490 (2001) 20.
[21] K. Reuter, M. Scheffler, Phys. Rev. Lett. 90 (2003).
[22] G. Kresse, O. Dulub, U. Diebold, Phys. Rev. B 68 (2003).
[23] A.A. Gokhale, S. Kandoi, J.P. Greeley, M. Mavrikakis, J.A. Dumesic, Chem. Eng.
Sci. 59 (2004) 4679.
[24] J.A. Dumesic, The Microkinetics of heterogeneous catalysis, American Chemical
Society, Washington, DC 1993.
[25] R.D. Cortright, J.A. Dumesic, Advances in Catalysis, Vol 46 46 (2002) 161.
[26] C.T. Campbell, J. Catal. 204 (2001) 520

60
CHAPTER 4
DFT STUDY ON THE ELECTRONIC STRUCTURE OF P- AND N-DOPED
STRONTIUM TITIVATES IN A REDUCING ENVIRONMENT
4.1 Summary
The electronic conductivity and thermodynamic stability of mixed n-type and p-
type doped SrTiO3 have been investigated at anodic solid oxide fuel cell (SOFC)
conditions using density functional theory (DFT) calculations. In particular, constrained
ab initio thermodynamic calculations have been performed to evaluate the phase stability
and reducibility of various Nb- and Ga-doped SrTiO3 at synthesized and anodic SOFC
conditions. The density of states of these materials was analyzed to study the effects of n-
and p-doping on the electronic conductivity. In agreement with experimental
observations, we find that the transformation from 20% Nb-doped Sr-deficient SrTiO3 to
a non Sr-deficient phase occurs at high temperature and low oxygen partial pressure
which leads to a significant improvement in electronic conductivity. A mixed
ionic/electronic conductor is obtained when doping 20% Nb-doped SrTiO3 with small
amounts of Ga (10%) in a reducing environment and high temperature. Doping with
higher concentrations of Ga, e.g., 20%, diminishes the electronic conductivity of the
material. These findings suggest that independent of the specific dopant, mixed
61
ionic/electronic conductivity can be obtained in perovskite oxides under reducing
conditions and high temperatures by doping the B-site with small amounts of both n-type
and p-type dopants.
4.2 Introduction
As previously described in Chapter 2, finding alternative anode materials to
replace conventional Ni/YSZ electrodes is a key subject for the development of SOFC
technology. Of the novel anode catalysts, perovskite based materials have been shown to
satisfy most intrinsic SOFC anode requirements such as high mixed ionic/electronic
conductivity, good catalytic activity, and high thermodynamic stability at anodic
conditions [1-7]. Furthermore, perovskite based materials possess high resistance to
sulfur impurities [8-10] and coke formation [1, 11-13] since both sulfur and carbon
species can easily be oxidized at the surface of the perovskite oxide [14].
Among the numerous perovskite systems that have been explored, SrTiO3 based
perovskites have been widely used as alternative SOFC anode materials [3, 4, 9, 15].
Indeed, several research groups have reported that SrTiO3 based perovskites exhibit some
advantages over Ni/YSZ anode catalysts, such as promising mixed ionic/electronic
conductivity, adequate thermodynamic stability in a wide range of oxygen partial
pressure, and tolerance to sulfur impurities as well as coke formation [4, 8-10].
Moreover, it has been found that yttrium doped SrTiO3 (SYT) possesses a thermal
expansion coefficient compatible with that of YSZ and Lanthanum Strontium Gallium
Magnesium Oxide (LSGM) based electrolytes [4].
However, stoichiometric SrTiO3 is a band insulator with a band gap of 3.2 eV
[16]. Therefore, various dopants have been introduced to improve the electronic

62
conductivity of this material. It is well known that doping the material with either n- or p-
type dopants can enhance the degree of electronic conduction [17-21]. For example, the
transformation from an insulating state to a metallic state has been observed when doping
SrTiO3 with n-type impurities such as La, Y, and Nb [9, 22-24]. In addition, theoretical
studies have suggested that substituting Ti with n-type dopants can shift the Fermi level
into the conduction band making the system metallic [19, 25].
It is well known that the substitution of n-type dopants in the SrTiO3 lattice
generates a defect with an effective positive charge in the host lattice. Overall
electroneutrality of the lattice can be achieved by two different mechanisms, namely,
electronic compensation and cation-vacancy compensation [26-28]. At low oxygen
chemical potential, the formal charges of n-type dopants are electronically compensated
by creating conduction electrons that travel along the Ti–O–Ti bridge where Ti remains
mixed-valent Ti3+
/Ti4+
[29]. This electron transferring process is considered to be the
origin of the electronic conductivity of the material.[30] On the other hand, at higher
oxygen chemical potential the excess positive charge can be compensated by generating
Sr2+
cation vacancies [31]. This type of electron compensation provides no conduction
electrons and there is no improvement in electronic conductivity. For example,
Kolodiazhnyi and Petric [24] found that TiO2 and niobium oxide second phases were
formed when sintering the Sr1-x/2Ti1-xNbxO3 (x = 0.17) at low oxygen partial pressure and
high temperature. This transformation can be expressed with the following equation:
𝑆𝑟1−𝑥
2𝑇𝑖1−𝑥𝑁𝑏𝑥𝑂3 → 𝑆𝑟1−
𝑥
2𝑇𝑖1−𝑥−𝑦𝑁𝑏𝑥−𝑦𝑂3−4𝑦 + 𝑦𝑇𝑖𝑂2 + 𝑦𝑁𝑏𝑂2 (4.1)
where 𝑦 < 𝑥 ≤ 0.2.

63
Furthermore, they observed a very high electronic conductivity of Sr0.9Ti0.8Nb0.2O3 and
Sr0.88Y0.08TiO3 when these samples were sintered in forming gas [24].
In contrast to n-type doping, p-type dopants create an effective negative charge in
the lattice. One way to neutralize the charge is introducing oxygen vacancies in the
lattice. This mechanism of charge neutralization can take place at moderate oxygen
chemical potentials and does generally not lead to improved electronic conductivity since
there is no transfer of charges or electrons into the lattice. However, lowering the oxygen
chemical potential can result in more oxygen vacancies, leading to an excess electron
density in the lattice. The reduction reaction takes place at the surface of the material and
delivers electrons to the lattice [32].
𝑂𝑂× ⇌
1
2𝑂2 𝑔 + 𝑉𝑂
°° + 2𝑒 ′ (4.2)
These conduction electrons can often be transferred to neighboring atoms such as Ti
which can be mixed-valent Ti3+
/Ti4+
. As a result, the electrical conductivity of the
material is again improved.
The addition of p-type impurities not only improves the electronic conductivity
but also enhances the ionic conductivity by increasing the reducibility and number of
oxygen vacancies in the material. Furthermore, the amount of available oxygen vacancies
plays an essential role in the enhancement of the oxide ion diffusivity (𝐷𝑂2) in the lattice
as evidenced by the following equation [33]:
𝐷𝑂2= 𝛽[𝑉𝑂 ]𝑎
2𝜈0𝑒−∆𝐻𝑚 /𝑅𝑇 (4.3)
where 𝑉𝑂 is the concentration of mobile vacancies, 𝑎 is the cell parameter, 𝜈0 is a
characteristic lattice frequency, ∆𝐻𝑚 is the enthalpy of vacancy migration, T is
temperature, R is the ideal gas constant, and 𝛽 =𝑧
6𝑓𝑒Δ𝑆𝑚 /𝑅 is a function of the number of

64
equivalent near-neighbor sites, z, the entropy of ion migration, Δ𝑆𝑚 , and a correction
factor, f (≈ 1). It is noted that the mobile vacancy concentration is usually smaller than
the stoichiometric concentration due to vacancy trapping or vacancy ordering [34, 35].
Recently, various research groups reported that the catalytic activity and mixed
ionic/electronic conductivity of n-type doped SrTiO3 can be modified by B-site doping
with p-type impurities such as Sc, Mn and Ga.[36] For example, Li et al. [37, 38]
suggested that doping with Sc and Co at the B-site of La0.3Sr0.7TiO3 can improve its ionic
conductivity. Similarly, Xiao et al.[39] and Neagu and Irvine [40] proposed a similar
doping strategy to improve the conductivity of n-type doped SrTiO3 by enhancing bulk
oxide ion mobility. In particular, they studied the effects of Ga dopants on the reducibility
and conductivity of n-type doped SrTiO3 systems by varying the concentration of Ga.
They found that Ga doping promotes fast reduction and improves the phase stability of
the material in an oxidizing environment. Impressive improvements in total conductivity
were observed when doping with small amounts of Ga.
It is the objective of this theoretical study to further investigate the effect of
concurrent n- and p-doping on the number of oxygen vacancies and the electronic
conductivity of SrTiO3 perovskites. In particular, we performed density functional theory
(DFT) calculations of Nb- and Ga-doped SrTiO3 and analyzed the electronic structure of
the resulting materials. To evaluate the thermodynamic stability of doped SrTiO3 phases
at synthesized and anodic SOFC conditions, we furthermore performed constrained ab
initio thermodynamic simulations.

65
4.3 Computational Details
4.3.1 Crystallographic data of SrTiO3
Stoichiometric SrTiO3 develops an ideal cubic perovskite structure at room
temperature with Pm3m space group. The structural phase transition from cubic to
tetragonal and to orthorhombic occurs at 110 and 65 K, respectively [41]. The cubic unit
cell includes one molecular unit of SrTiO3. As shown in Fig. 4.1, the structure contains
12-coordinated strontium ions occupying corner positions of the cube whereas the
titanium ion, at the center of the cubic cell, is surrounded by six oxygen ions forming a
TiO6 octahedral unit. The octahedral units are connected by a sharing Ti-O-Ti bridge,
forming a three-dimensional framework.
Figure 4.1 Unit cell of SrTiO3 perovskite oxide
4.3.2 Computational method
To investigate the bulk electronic properties of stoichiometric and doped SrTiO3,
we initially optimized the lattice parameter of the SrTiO3 unit cell and created a 100 atom
supercell containing twenty unit cells (5×2×2). To generate doped structures we replaced

66
B-site cations (Ti) with various amounts of n-type (Nb) and p-type (Ga) dopants.
Substitution of two Ti atoms with two dopants yields 10% B-site doped SrTiO3, etc. In
order to better understand the charge compensation mechanism in n- and p-type doped
systems, both A-site deficient and reduced structures were created by generating
strontium vacancies and oxygen vacancies, respectively. In this study, we considered up
to two strontium vacancies and three oxygen vacancies in each structure. For all doped
structures, we employed the lattice parameter of 20% Nb-doped SrTiO3 and tried close to
all ion position possibilities to identify the lowest energy structures.
All calculations performed for this study are based on the plane wave density
functional theory implementation of the Vienna Ab initio Simulation Package (VASP
4.6) [42, 43]. We used the projector-augmented wave (PAW) method to represent the
inner core potentials [42] and treated the Sr 4s4p5s, Ti 3d4s, O 2s2p, Nb 4p5s4d, and Ga
4s4p as valence electrons. The cutoff of the kinetic energy was set for all calculations to
400 eV. Exchange correlation is described within the generalized gradient approximation
(GGA) with the Perdew-Burke-Ernzerhof (PBE) functional [44]. All calculations are
spin-polarized and Brillouin zone integration was performed with a 2×5×5 Monkhorst-
Pack k-point mesh [45]. For density of state (DOS) calculations we used a 4×10×10 k-
mesh. In all structure optimizations, all atoms are fully relaxed until the Hellman-
Feynman forces are less than 0.02 eV Å-1
.
Our calculated stoichiometric SrTiO3 bulk unit cell has an optimized lattice
constant of 3.948(8) Å which is in reasonable agreement to the experimental value of
3.901(1) Å [46]. The optimized supercell of 20% Nb-doped SrTiO3 exhibits only a very
small change in lattice parameters (3.949(4) Å) to that of stoichiometric SrTiO3.

67
Computations predict a Sr-O and Ti-O bond distance of 2.792(2) and 1.974(4) Å,
respectively. As illustrated in Fig. 4.2, the density of states of stoichiometric SrTiO3
exhibits insulating behavior with a band gap of 1.80 eV. It should be noted that while
DFT within the GGA approximations is known to underestimate band gaps, several
studies showed excellent agreement in the predicted electronic behavior of doped oxides
computed by DFT within the GGA approximation and experimental observation [47-49].
Figure 4.2 DOS of stoichiometric SrTiO3 with calculated band gap of 1.80 eV
4.4 Results and Discussion
In this work, we are most interested in the electronic properties of n- and p-type
doped SrTiO3. Kolodiazhnyi and Petric [24] observed experimentally that
Sr0.9Ti0.8Nb0.2O3 exhibits a very high conductivity at low oxygen chemical potential and
Xiao et al. [39] suggested that the reducibility of this material can be promoted by doping
with a certain (small) amount of p-type dopant (Ga). Therefore, we performed three
different sets of calculations based on the concentration of B-site dopants, i.e., 20% Nb-
doped SrTiO3, 10% Ga- and 20% Nb-doped SrTiO3, and 20% Ga- and 20% Nb-doped
68
SrTiO3. In this way we can systematically study the effect of Ga (p-type) doping on Nb
(n-type) doped SrTiO3 on the reducibility/phase stability and electronic
conductivity/density of states of the resulting materials.
For all structures we first performed constrained ab initio thermodynamic
calculations to evaluate the relative thermodynamic stability of the systems. This ab initio
thermodynamic approach allows us to calculate the free energy of different systems as a
function of oxygen chemical potential, i.e., temperature and oxygen partial pressure, and
construct phase diagrams. The reaction energies of the most dominant structures in the
phase diagrams are summarized in Table 4.1. Next, the DOS related to the most dominant
structures in the phase diagram were evaluated and analyzed with respect to the relative
electronic conductivity.
4.4.1 Electronic structure and phase diagram of 20% Nb-doped SrTiO3
In this set of calculations we substituted four Ti atoms with four Nb atoms in the
5×2×2 supercell to obtain a model for 20% Nb-doped SrTiO3 (Sr20Ti16Nb4O60 or
SrTi0.8Nb0.2O3). In addition, we generated structures with one or two Sr vacancies to
create partial (5%) A-site deficient (Sr19Ti16Nb4O60 or Sr0.95Ti0.8Nb0.2O3) and full (10%)
A-site deficient 20% Nb-doped SrTiO3 (Sr18Ti16Nb4O60 or Sr0.9Ti0.8Nb0.2O3) model
structures, respectively. Fig. 4.3 depicts the most stable structures of 20% Nb-doped
SrTiO3 system. From the configuration of the most stable structures, we observe that Nb
impurities prefer to be as far apart as possible due to the repulsion of the extra electrons
from the Nb5+
cations that can be transferred to neighboring Ti atoms that are mixed-
valent Ti3+
/Ti4+
. In contrast when there are Sr vacancies in the structure, Nb prefers to
stay close to the vacancies since the charges originating from the Nb atoms can be
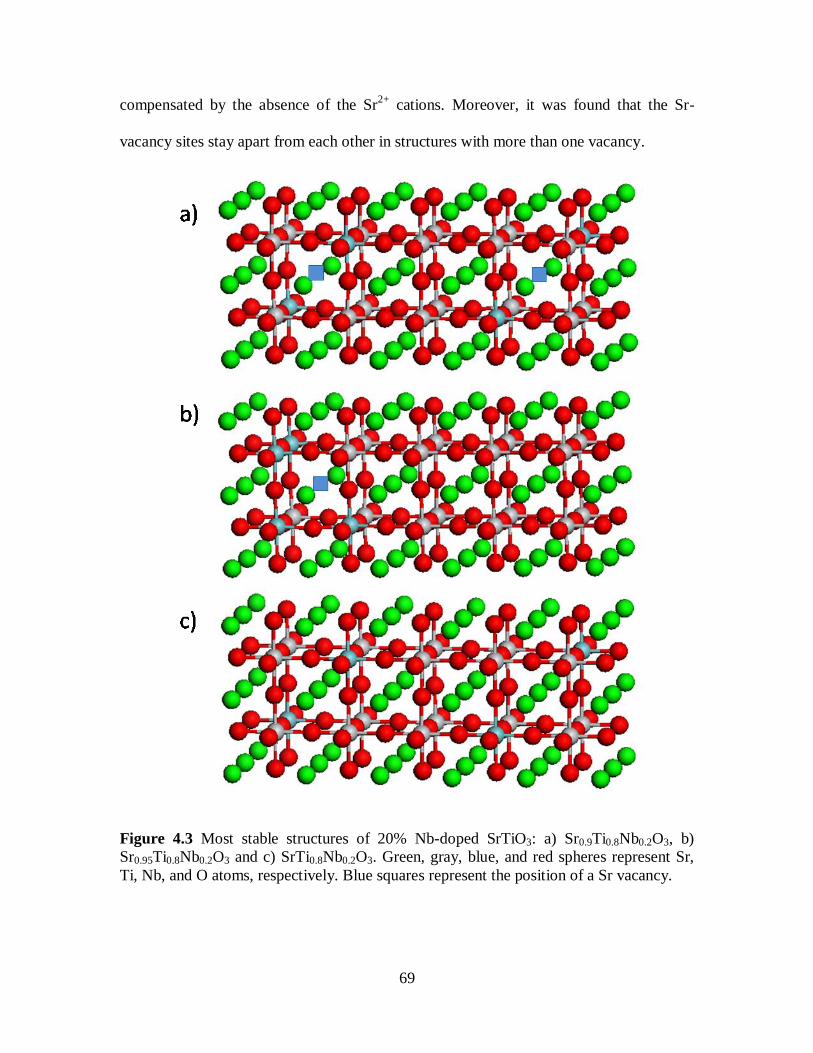
69
compensated by the absence of the Sr2+
cations. Moreover, it was found that the Sr-
vacancy sites stay apart from each other in structures with more than one vacancy.
Figure 4.3 Most stable structures of 20% Nb-doped SrTiO3: a) Sr0.9Ti0.8Nb0.2O3, b)
Sr0.95Ti0.8Nb0.2O3 and c) SrTi0.8Nb0.2O3. Green, gray, blue, and red spheres represent Sr,
Ti, Nb, and O atoms, respectively. Blue squares represent the position of a Sr vacancy.

70
Table 4.1 Summary of reaction energies used in constrained ab initio thermodynamic
calculations
Phase Diagram Reaction E (eV)
Nb2O5/NbO2 Nb2O5 --> 2NbO2 + 1/2O2 3.71
20% Nb-doped SrTiO3 with SrO rich phase
Sr20Ti16Nb4O60 + 1/2O2 --> Sr19Ti16Nb4O60 + SrO -1.94
Sr20Ti16Nb4O60 + O2 --> Sr18Ti16Nb4O60 + 2SrO -3.49
20% Nb-doped SrTiO3 with TiO2/niobium oxide rich phases
19Sr18Ti16Nb4O60 --> 18Sr19Ti16Nb4O60 + 16TiO2 + 2Nb2O5 + 9O2 2.58
10Sr18Ti16Nb4O60 --> 9Sr20Ti16Nb4O60 + 16TiO2 + 2Nb2O5 + 9O2 5.24
19Sr18Ti16Nb4O60 --> 18Sr19Ti16Nb4O60 + 16TiO2 + 4NbO2 + 10O2 2.97
10Sr18Ti16Nb4O60 --> 9Sr20Ti16Nb4O60 + 16TiO2 + 4NbO2 + 10O2 5.98
10% Ga- and 20% Nb-doped SrTiO3 with SrO rich phase
Sr20Ti14Nb4Ga2O60 + 1/2O2 --> Sr19Ti14Nb4Ga2O60 + SrO -1.74
Sr20Ti14Nb4Ga2O60 --> Sr20Ti14Nb4Ga2O59 + 1/2O2 4.54
Sr20Ti14Nb4Ga2O60 --> Sr20Ti14Nb4Ga2O58 + O2 9.01
Sr20Ti14Nb4Ga2O60 --> Sr20Ti14Nb4Ga2O57 + 3/2O2 14.16
10% Ga- and 20% Nb-doped SrTiO3 with TiO2/Ga2O3/ niobium oxide rich phases
19Sr18Ti14Nb4Ga2O60 --> 18Sr19Ti14Nb4Ga2O60 + 14TiO2 + 2Nb2O5 + Ga2O3 + 19/2O2
-1.29
10Sr18Ti14Nb4Ga2O60 --> 9Sr20Ti14Nb4Ga2O60 + 14TiO2 + 2Nb2O5 + Ga2O3 + 19/2O2
1.28
10Sr18Ti14Nb4Ga2O60 --> 9Sr20Ti14Nb4Ga2O59 + 14TiO2 + 2Nb2O5 + Ga2O3 + 14O2
5.37
10Sr18Ti14Nb4Ga2O60 --> 9Sr20Ti14Nb4Ga2O58 + 14TiO2 + 2Nb2O5 + Ga2O3 + 37/2O2
9.39
10Sr18Ti14Nb4Ga2O60 --> 9Sr20Ti14Nb4Ga2O57 + 14TiO2 + 2Nb2O5 + Ga2O3 + 23O2
14.03
20% Ga- and 20% Nb-doped SrTiO3
10Sr18Ti12Nb4Ga4O60 --> 9Sr20Ti12Nb4Ga4O60 + 12TiO2 + 2Nb2O5 + 2Ga2O3 + 10O2
-2.81
10Sr18Ti12Nb4Ga4O60 --> 9Sr20Ti12Nb4Ga4O59 + 12TiO2 + 2Nb2O5 + 2Ga2O3 + 29/2O2
1.21
10Sr18Ti12Nb4Ga4O60 --> 9Sr20Ti12Nb4Ga4O58 + 12TiO2 + 2Nb2O5 + 2Ga2O3 + 19O2
5.21
10Sr18Ti12Nb4Ga4O60 --> 9Sr20Ti12Nb4Ga4O57 + 12TiO2 + 2Nb2O5 + 2Ga2O3 + 47/2O2
9.82

71
Constrained ab initio thermodynamic calculations of 20% Nb-doped SrTiO3
systems were performed to determine the phase stability of these structures at various
temperatures and oxygen partial pressures. We employed two different types of
calculations based on the main products that were generated when the phase transition
occurred. First, we calculated the free energies of 20% Nb-doped SrTiO3 with a SrO rich
second phase experimentally obtained by cooling SrTi0.8Nb0.2O3.
𝑆𝑟20𝑇𝑖16𝑁𝑏4𝑂60 +𝑥
2𝑂2 → 𝑆𝑟20−𝑥𝑇𝑖16𝑁𝑏4𝑂60 + 𝑥𝑆𝑟𝑂 (4.4)
Where 𝑥 represents the number of Sr-vacancy sites in the structure (𝑥 = 1, 2) and free
energies are given by
∆𝐺 = 𝐸𝑆𝑟−𝑣𝑎𝑐𝑎𝑛𝑐𝑦 + 𝑥𝐸𝑆𝑟𝑂 − 𝐸𝑓𝑢𝑙𝑙 − 𝑥 𝐸𝑂 + ∆𝜇𝑂 𝑇, 𝑃 (4.5)
with 𝐸𝑆𝑟−𝑣𝑎𝑐𝑎𝑛𝑐𝑦 being the DFT-calculated electronic energy of the structure with Sr-
vacancy, 𝐸𝑓𝑢𝑙𝑙 is the DFT-calculated electronic energy of the structure without Sr-
vacancy, 𝐸𝑆𝑟𝑂 is the DFT-calculated electronic energy of the SrO lattice, and 𝐸𝑂 is a half
of the energy of an oxygen molecule, 𝐸𝑂2, which is obtained from the H2O splitting
reaction using the experimental reaction energy and calculated DFT energies of H2 and
H2O in the gas phase [50, 51],
𝐸𝑂2= 2 𝐸𝐻2𝑂
𝐷𝐹𝑇 + 𝐸𝐻2𝑂𝑍𝑃𝐸 − 𝐸𝐻2
𝐷𝐹𝑇 + 𝐸𝐻2
𝑍𝑃𝐸 − 𝐸𝑜𝑓 − 𝐸𝑂2
𝑍𝑃𝐸 , (4.6)
where EZPE
is the experimental zero point energy[52], Ehof is the experimental heat of
formation of a gas-phase H2O molecule[52], and EDFT
is the energy calculated with PBE
functional. The chemical potential of O, which includes the temperature- and pressure-
dependent free energy contributions of the O2 molecule, is described by ∆𝜇𝑂(𝑇, 𝑃) and
has been calculated from first principles and the rotational, translational, and vibrational
partition functions of the O2 molecule. We note that we neglect all zero point energies in

72
Eq. 4.5 and assume that entropic contributions from the solids to the free energy
difference are insignificant [53-55]. Also, the pressure dependence of ∆𝜇𝑂(𝑇, 𝑃) is
obtained assuming that the gas phase is ideal.[54]
∆𝜇𝑂 𝑇, 𝑃 =1
2 ∆𝜇𝑂2
𝑇, 𝑃0 + 𝑘𝑏𝑇𝑙𝑛 𝑃
𝑃0 (4.7)
Next, we employed the same ab initio thermodynamic approach to investigate the
thermodynamic stability of 20% Nb-doped SrTiO3 with TiO2 and niobium oxide rich
second phases that can experimentally be obtained by heating Sr-deficient 20% Nb-doped
SrTiO3. Considering that Nb2O5 can be reduced to NbO2 in a reducing environment at
high temperature [56], we first performed ab initio thermodynamic calculations of the
Nb2O5/NbO2 system
𝑁𝑏2𝑂5 → 2𝑁𝑏𝑂2 +1
2𝑂2 (4.8)
and Fig. 4.4 illustrates that at low temperature Nb2O5 is the dominant phase whereas the
NbO2 phase predominates at higher temperatures.
In the following, we performed ab initio thermodynamic calculations of the Nb-
doped SrTiO3 system according to the dominant phase in the Nb2O5/NbO2 phase
diagram, i.e., whenever the Nb2O5 phase is preferred we calculate the free energies of the
system according to Eq. 4.9,
20 − 𝑥 𝑆𝑟18𝑇𝑖16𝑁𝑏4𝑂60 →
18𝑆𝑟20−𝑥𝑇𝑖16𝑁𝑏4𝑂60 + 32 − 16𝑥 𝑇𝑖𝑂2 + 4 − 2𝑥 𝑁𝑏2𝑂5 + (18 − 9𝑥)𝑂2 (4.9)
and whenever NbO2 is preferred, we calculate the free energies of the system according
to Eq. 4.10,
20 − 𝑥 𝑆𝑟18𝑇𝑖16𝑁𝑏4𝑂60 →

73
18𝑆𝑟20−𝑥𝑇𝑖16𝑁𝑏4𝑂60 + 32 − 16𝑥 𝑇𝑖𝑂2 + 8 − 4𝑥 𝑁𝑏𝑂2 + (20 − 10𝑥)𝑂2 (4.10)
where x is the number of Sr vacancies with 𝑥 = 0, 1. Figure 4.5 shows the calculated
phase diagrams of 20% Nb-doped SrTiO3 with SrO rich second phase and TiO2 and
niobium oxide rich second phases. The phase transformation from 10% Sr-deficient
(Sr0.9Ti0.8Nb0.2O3) to 5% Sr-deficient (Sr0.95Ti0.8Nb0.2O3) to non Sr-deficient structures
(SrTi0.8Nb0.2O3) occurs with increasing temperature and decreasing oxygen partial
pressure. We note that an oxygen deficient structure is thermodynamically unstable in the
considered temperature and oxygen partial pressure range.
Figure 4.4 Calculated phase diagram of Nb2O5/NbO2. Differently shaded areas mark the
stability regions of various structures for a given temperature and partial pressure of
oxygen. The hatched area decribes possible changes in the phase diagram if computed
reaction energies shown in Table 4.1 are off by ±0.2 eV (our estimated error bar). Green
and red areas symbolize stability of Nb2O5 and NbO2, respectively.

74
Figure 4.5 Calculated phase diagram of 20% Nb-doped SrTiO3 with a) SrO rich phase
and b) TiO2/niobium oxide rich phases. Differently shaded areas mark the stability
regions of various structures for a given temperature and partial pressure of oxygen. The
hatched area decribes possible changes in the phase diagram if computed reaction
energies shown in Table 4.1 are off by ±0.2 eV (our estimated error bar). Green, yellow,
and red areas symbolize stability of Sr0.9Ti0.8Nb0.2O3, Sr0.95Ti0.8Nb0.2O3, and
SrTi0.8Nb0.2O3, respectively.

75
The electronic conductivity of these materials can to a first approximation be
analyzed from their electronic structures. As illustrated in Fig. 4.6(a), the DOS of a 10%
Sr-deficient material (Sr0.9Ti0.8Nb0.2O3) exhibits insulating behavior with a band gap of
1.80 eV. The charges from the four Nb dopants are compensated by the presence of two
Sr vacancies. The DOS of the 5% Sr-deficient structure (Sr0.95Ti0.8Nb0.2O3) shows a slight
improvement in electronic conductivity (Fig. 4.6(b)). The Fermi energy shifts inside the
conduction band with two conduction electrons per supercell below the Fermi level. An
even greater improvement in the electronic conductivity occurs when the material is fully
electronically compensated. As depicted in Fig. 4.6(c), the DOS of 20% Nb-doped
SrTiO3 with no Sr vacancies (SrTi0.8Nb0.2O3) exhibits metallic character with four
delocalized electrons at the Fermi level. Figure 4.7 illustrates the calculated electronic
band structure of SrTi0.8Nb0.2O3 which confirms that the material is indeed metallic.
It is interesting to note that the simulation results are in agreement with
experimental observations from Kolodiazhnyi and Petric [24]. They reported that the
transformation of cation vacancy compensated materials to electronically compensated
materials (and corresponding change in electronic conductivity) occurred when the
materials were equilibrated at high temperature and low oxygen partial pressure. This
condition corresponds to anodic SOFC conditions with temperatures between 1000 and
1200 K and oxygen partial pressures in the range of 10-20
bar.
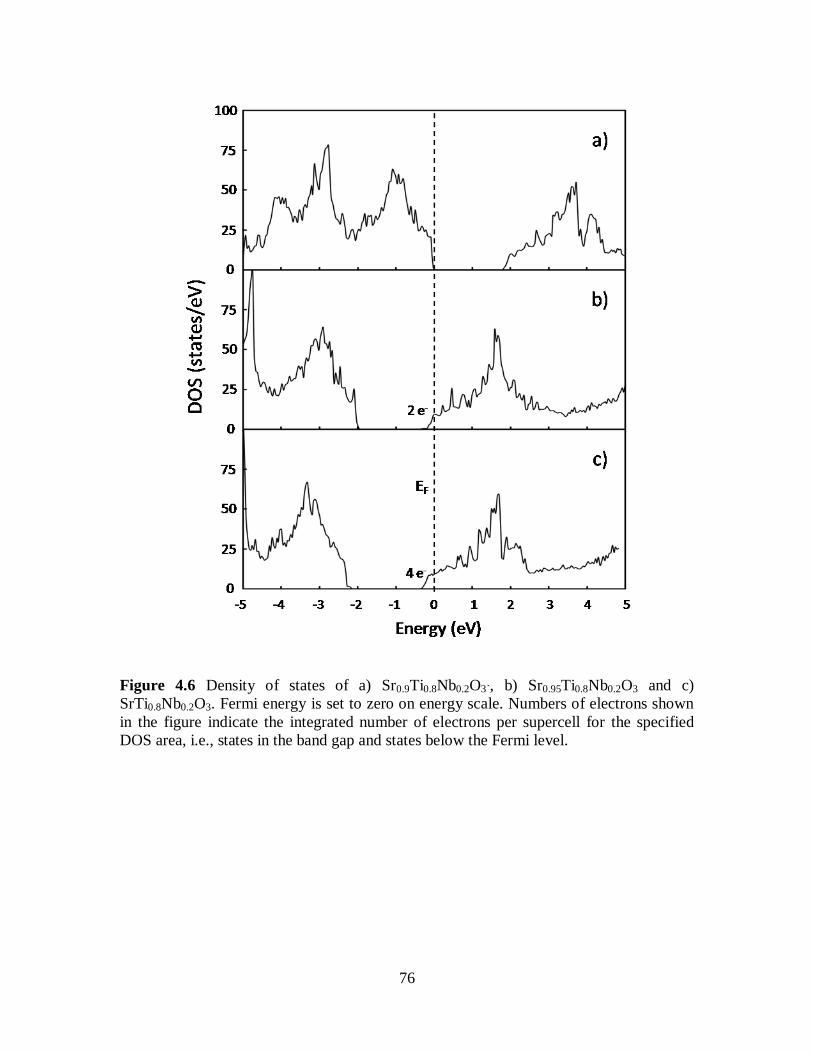
76
Figure 4.6 Density of states of a) Sr0.9Ti0.8Nb0.2O3`, b) Sr0.95Ti0.8Nb0.2O3 and c)
SrTi0.8Nb0.2O3. Fermi energy is set to zero on energy scale. Numbers of electrons shown
in the figure indicate the integrated number of electrons per supercell for the specified
DOS area, i.e., states in the band gap and states below the Fermi level.

77
Figure 4.7 Electronic band structure and density of states of SrTi0.8Nb0.2O3.
4.4.2 Electronic structure and phase diagram of 10% Ga- and 20% Nb-doped
SrTiO3
Substitution of two Ti atoms with two Ga atoms in our 20% Nb-doped SrTiO3
model leads to 10% Ga- and 20% Nb-doped SrTiO3. The presence of Sr and oxygen
vacancies in the structure was investigated in a similar manner as described above. Figure
4.8 shows the most stable structures of 10% Ga- and 20% Nb-doped SrTiO3 system. It is
found that Ga atoms prefer to be next to Nb atoms since the extra electron from the Nb
dopant can be compensated by the electron hole generated from the Ga dopant. At high
temperatures and low oxygen partial pressures oxygen vacancies start to form. The first
oxygen vacancy is created by removing an oxygen atom from the Ga-O-Ti bridge
forming GaO5 units whereas the second vacancy is positioned next to the same Ga atom
generating a GaO4 unit. Upon removal of the third oxygen atom another GaO5 unit is
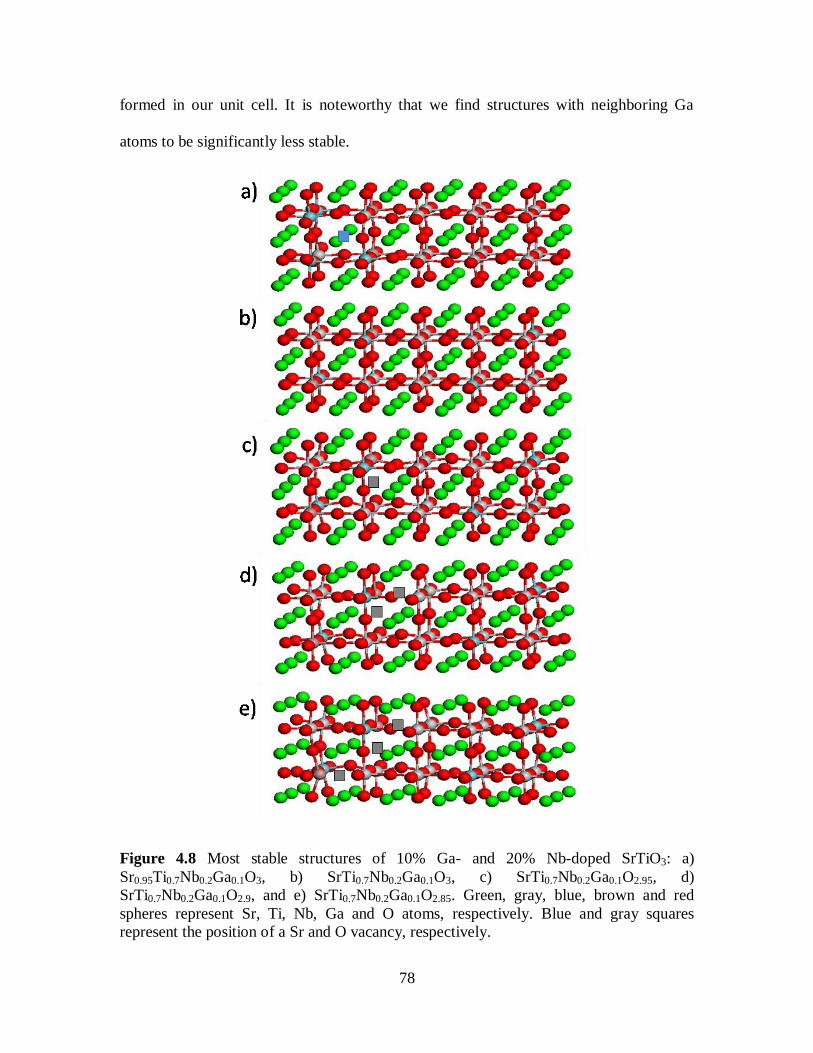
78
formed in our unit cell. It is noteworthy that we find structures with neighboring Ga
atoms to be significantly less stable.
Figure 4.8 Most stable structures of 10% Ga- and 20% Nb-doped SrTiO3: a)
Sr0.95Ti0.7Nb0.2Ga0.1O3, b) SrTi0.7Nb0.2Ga0.1O3, c) SrTi0.7Nb0.2Ga0.1O2.95, d)
SrTi0.7Nb0.2Ga0.1O2.9, and e) SrTi0.7Nb0.2Ga0.1O2.85. Green, gray, blue, brown and red
spheres represent Sr, Ti, Nb, Ga and O atoms, respectively. Blue and gray squares
represent the position of a Sr and O vacancy, respectively.

79
Figure 4.9(a) and 4.9(b) illustrate the phase diagram for 10% Ga- and 20% Nb-
doped SrTiO3 as a function of temperature and partial pressure of oxygen corresponding
to the formation of SrO and TiO2/Ga2O3/niobium oxide rich second phases, respectively.
In the presence of Ga, we find that the reduced structures (SrTi0.7Nb0.2Ga0.1O2.95,
SrTi0.7Nb0.2Ga0.1O2.90, and SrTi0.7Nb0.2Ga0.1O2.85) are stable in the studied high
temperature and low oxygen partial pressure range. The existence of a reduced structure
indicates that Ga doping improves the reducibility of the materials as previously reported
in Neagu and Irvine‘s work [40].
More interestingly, Ga and Nb dopants do not seem to compensate each other
with respect to electronic conductivity. Figure 4.10 illustrates the density of states of the
most important structures. While Sr0.95Ti0.7Nb0.2Ga0.1O3 exhibits insulating behavior with
a band gap of 1.80 eV (the charges from the Nb dopants are compensated by the Sr
vacancies and Ga dopants), SrTi0.7Nb0.2Ga0.1O3, SrTi0.7Nb0.2Ga0.1O2.95,
SrTi0.7Nb0.2Ga0.1O2.90, and SrTi0.7Nb0.2Ga0.1O2.85 exhibit metallic behavior with up to four
conduction electrons at the Fermi level (the same number as in the absence of Ga). In
SrTi0.7Nb0.2Ga0.1O3, the two Ga atoms in the supercell compensate for two of the Nb
atoms, leaving the remaining two Nb atoms to contribute two conduction electrons at the
Fermi level (Fig. 4.10(b)). In SrTi0.7Nb0.2Ga0.1O2.95, one oxygen atom connected to a Ga
atom is removed, compensating the hole doping effect of two Ga atoms. Thus, we see
the effect of 20% Nb doping in this structure (Fig. 4.10(c)). In SrTi0.7Nb0.2Ga0.1O2.9 and
SrTi0.7Nb0.2Ga0.1O2.85, the electrons generated by creating further oxygen vacancies are
localized mainly on the Ga atoms and an extra peak is observed in the DOS (Fig. 4.10(d)
and 4.10(e)) between the valence band and the conduction band.

80
Figure 4.9 Calculated phase diagram of 10% Ga- and 20% Nb-doped SrTiO3 with a) SrO
rich phase and b) TiO2/Ga2O3/niobium oxide rich phases. Differently shaded areas mark
the stability regions of various structures for a given temperature and partial pressure of
oxygen. The hatched area decribes possible changes in the phase diagram if computed
reaction energies shown in Table 4.1 are off by ±0.2 eV (our estimated error bar). Blue,
green, yellow, and red areas symbolize stability of Sr0.95Ti0.7Nb0.2Ga0.1O3,
SrTi0.7Nb0.2Ga0.1O3, SrTi0.7Nb0.2Ga0.1O2.9, and SrTi0.7Nb0.2Ga0.1O2.85, respectively. The
hatched violet area symbolizes the possible stability of a SrTi0.7Nb0.2Ga0.1O2.95 phase.

81
Figure 4.10 Density of states of a) Sr0.95Ti0.7Nb0.2Ga0.1O3, b) SrTi0.7Nb0.2Ga0.1O3, c)
SrTi0.7Nb0.2Ga0.1O2.95, d) SrTi0.7Nb0.2Ga0.1O2.9 and e) SrTi0.7Nb0.2Ga0.1O2.85. Fermi energy
is set to zero on energy scale. Numbers of electrons shown in the figure indicate the
integrated number of electrons per supercell for the specified DOS area, i.e., states in the
band gap and states below the Fermi level.
A partial density of states (PDOS) analysis and electron density integration for
SrTi0.7Nb0.2Ga0.1O2.9, as illustrated in Fig. 4.11(a), shows that there are two electrons in
this peak which contains predominantly contributions from the oxygen PDOS. We see no
reason for these two electrons to be delocalized and believe that these states do not
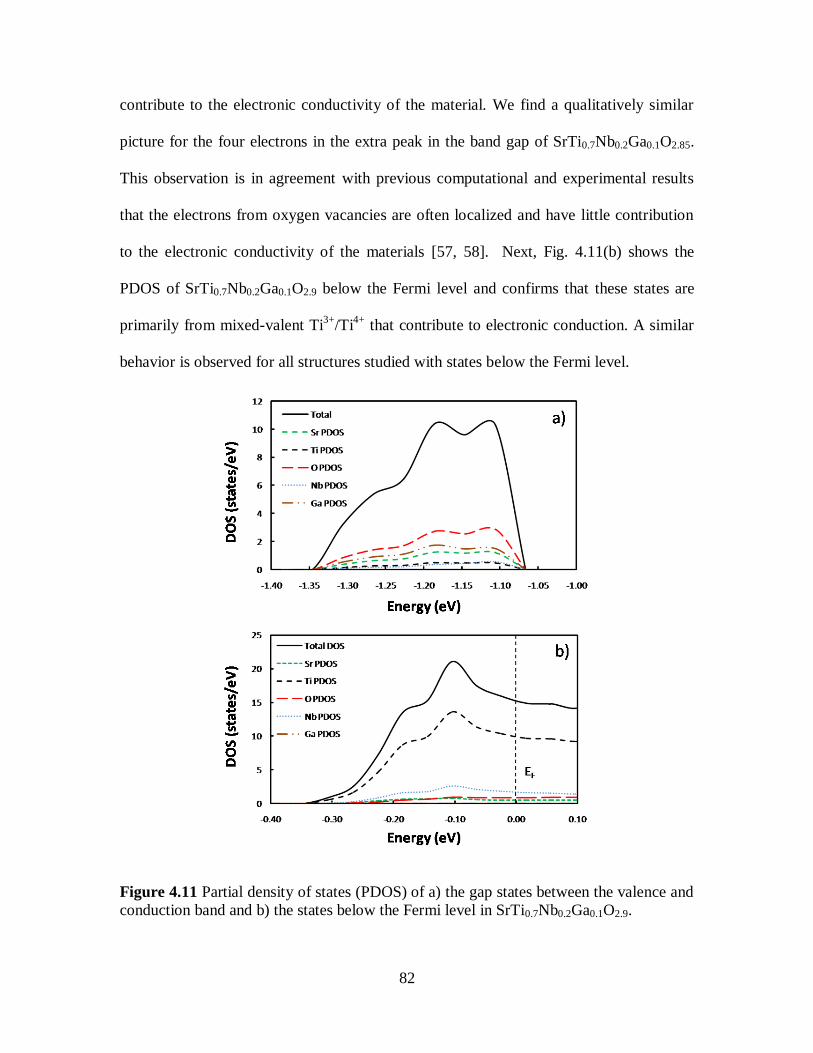
82
contribute to the electronic conductivity of the material. We find a qualitatively similar
picture for the four electrons in the extra peak in the band gap of SrTi0.7Nb0.2Ga0.1O2.85.
This observation is in agreement with previous computational and experimental results
that the electrons from oxygen vacancies are often localized and have little contribution
to the electronic conductivity of the materials [57, 58]. Next, Fig. 4.11(b) shows the
PDOS of SrTi0.7Nb0.2Ga0.1O2.9 below the Fermi level and confirms that these states are
primarily from mixed-valent Ti3+
/Ti4+
that contribute to electronic conduction. A similar
behavior is observed for all structures studied with states below the Fermi level.
Figure 4.11 Partial density of states (PDOS) of a) the gap states between the valence and
conduction band and b) the states below the Fermi level in SrTi0.7Nb0.2Ga0.1O2.9.

83
To conclude, further doping of 20% Nb-doped SrTiO3 with 10% Ga leads to a
comparable degree of electronic conductivity to that of only 20% Nb-doped SrTiO3 under
anodic SOFC conditions. Further, Ga promotes ionic conductivity by enhancing the
reducibility of the material. These results support the experimental observations reported
by several groups [39, 40] that Ga doped titanates possess a high number of oxygen
vacancies and good oxide ion conduction.
4.4.3 Electronic structure and phase diagram of 20% Ga- and 20% Nb-doped
SrTiO3
Replacing another two Ti atoms with Ga atoms in 10% Ga- and 20% Nb-doped
SrTiO3 we obtain a model for 20% Ga- and 20% Nb-doped SrTiO3. The most stable
structures in this set of calculations are illustrated in Fig. 4.12. These structures suggest
that Ga atoms prefer to position close to Nb atoms. Up to three oxygen vacancies were
generated in this structure to study the effect of reducing conditions. It is preferable to
create the first two oxygen vacancies at the Ga-O-Ti bridge where two vacancies share
the same Ga atom forming a GaO4 unit, whereas the third oxygen vacancy is again
positioned at a Ga-O-Ti bridge forming a GaO5 unit.
Constrained ab initio thermodynamic calculations of this system were carried out
to determine the phase stability at various temperatures and oxygen partial pressures. In
some respects, the phase transition of this system is quite similar to that of the 10% Ga
doped system. In particular, the presence of a reduced phase of both the 10% and 20% Ga
doped systems occurs at approximately the same temperature and oxygen partial pressure
range, indicating that increasing the concentration of Ga does not significantly improve
the reducibility of the material. However, the phase diagram of the 20% Ga doped system
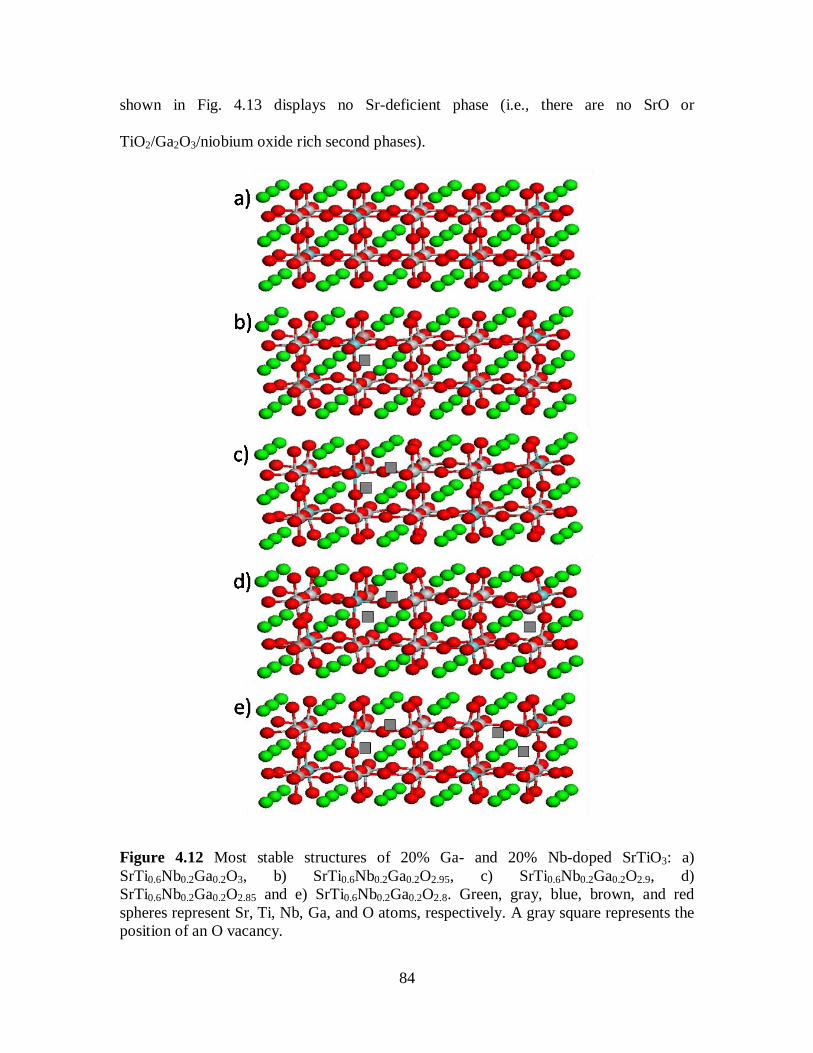
84
shown in Fig. 4.13 displays no Sr-deficient phase (i.e., there are no SrO or
TiO2/Ga2O3/niobium oxide rich second phases).
Figure 4.12 Most stable structures of 20% Ga- and 20% Nb-doped SrTiO3: a)
SrTi0.6Nb0.2Ga0.2O3, b) SrTi0.6Nb0.2Ga0.2O2.95, c) SrTi0.6Nb0.2Ga0.2O2.9, d)
SrTi0.6Nb0.2Ga0.2O2.85 and e) SrTi0.6Nb0.2Ga0.2O2.8. Green, gray, blue, brown, and red
spheres represent Sr, Ti, Nb, Ga, and O atoms, respectively. A gray square represents the
position of an O vacancy.

85
Figure 4.13 Calculated phase diagram of 20% Ga- and 20% Nb-doped SrTiO3.
Differently shaded areas mark the stability regions of various structures for a given
temperature and partial pressure of oxygen. The hatched area decribes possible changes
in the phase diagram if computed reaction energies shown in Table 4.1 are off by ±0.2 eV
(our estimated error bar). Blue, yellow, and red areas symbolize stablity of
SrTi0.6Nb0.2Ga0.2O3, SrTi0.6Nb0.2Ga0.2O2.9, and SrTi0.6Nb0.2Ga0.2O2.85, respectively. The
hatched green area symbolizes the stability of a SrTi0.6Nb0.2Ga0.2O2.95 phase.
Furthermore, we observe from the DOS (Fig.4.14) a reduction in the electronic
conductivity with increase in Ga doping. As shown in Fig. 4.14(c) and 4.14(d), the DOS
of SrTi0.6Nb0.2Ga0.2O2.90 and SrTi0.6Nb0.2Ga0.2O2.85 exhibit only two conduction electrons
at the Fermi level. It seems that doping with 20% Ga (and 20% Nb) and removing the
first oxygen atom in our supercell leads to a compensation of the hole doping effect of
two Ga atoms and generation of two conduction electrons from two uncompensated Nb
atoms at the Fermi level (Fig. 4.14(b)). In contrast, removing one or two more oxygen
atoms from the supercell leads to localized electrons observed in an extra peak in the
DOS between the valence and conduction band and no compensation of the hole doping
effect of the remaining two Ga atoms, and thus, no increase in charge carrier density (Fig.

86
4.14(c) and 4.14(d)). Interestingly, creating a fourth oxygen vacancy under very reducing
conditions (usually not encountered in SOFC operation and therefore not included in the
phase diagram), leads again to a full compensation of the hole doping effect of all four
Ga atoms and generation of four conduction electrons from the four Nb atoms at the
Fermi level (see Fig. 4.12(e)). Thus, while doping with 20% Ga improves the ionic
conductivity, the electronic conductivity of the material is likely diminished under
realistic fuel cell operating conditions.
Figure 4.14 Density of states of a) SrTi0.6Nb0.2Ga0.2O3, b) SrTi0.6Nb0.2Ga0.2O2.95, c)
SrTi0.6Nb0.2Ga0.2O2.9, and d) SrTi0.6Nb0.2Ga0.2O2.85. Fermi energy is set to zero on the
energy scale. Numbers of electrons shown in the figure indicate the integrated number of
electrons per supercell for the specified DOS area, i.e., states in the band gap and states
below the Fermi level.

87
4.5 Conclusions
We have investigated the electronic properties and thermodynamic stability of Nb
(n-type) and Ga (p-type) doped SrTiO3 perovskites using density functional theory and
constrained ab initio thermodynamic simulations. We find that cation vacancy
compensated 20% Nb-doped Sr-deficient SrTiO3 (Sr0.9Ti0.8Nb0.2O3) transforms to an
electronically compensated non Sr-deficient phase (SrTi0.8Nb0.2O3) at high temperature
and low oxygen partial pressure which leads to a significant improvement in electronic
conductivity. This result is in excellent agreement with the defect chemistry model and
experimental observations reported by Kolodiazhnyi and Petric [24]. Doping 20% Nb-
doped SrTiO3 with 10% Ga enhances the ionic conductivity of the material by creating
oxygen vacancies. The electronic conductivity is not reduced by small amounts of Ga so
that a mixed ionic/electronic conductor is formed. However, doping with 20% Ga
decreases the electronic conductivity of the material. This result supports the
experimental observations [39, 40] that doping with a small amount of Ga improves the
conductivity and promotes fast reduction of the material. From both experimental
observations and our calculations, we propose that a mixed n-type and p-type doping
strategy could be a general approach to obtaining mixed ionic/electronic conductivity in
perovskite oxide materials.
4.6 References
[1] S.W. Tao, J.T.S. Irvine, Nature Materials 2 (2003) 320.
[2] Y.H. Huang, R.I. Dass, Z.L. Xing, J.B. Goodenough, Science 312 (2006) 254.
[3] D.P. Fagg, V.V. Kharton, A.V. Kovalevsky, A.P. Viskup, E.N. Naumovich, J.R.
Frade, J. Eur. Ceram. Soc. 21 (2001) 1831.
[4] S.Q. Hui, A. Petric, J. Eur. Ceram. Soc. 22 (2002) 1673.
[5] T. Ishihara, H. Matsuda, Y. Takita, J. Am. Chem. Soc. 116 (1994) 3801.
[6] M. Feng, J.B. Goodenough, Eur. J. Solid State Inorg. Chem. 31 (1994) 663.

88
[7] K.Q. Huang, M. Feng, J.B. Goodenough, M. Schmerling, J. Electrochem. Soc. 143
(1996) 3630.
[8] J. Canales-Vazquez, S.W. Tao, J.T.S. Irvine, Solid State Ionics 159 (2003) 159.
[9] O.A. Marina, N.L. Canfield, J.W. Stevenson, Solid State Ionics 149 (2002) 21.
[10] J. Canales-Vazquez, J.C. Ruiz-Morales, J.T.S. Irvine, W.Z. Zhou, J. Electrochem.
Soc. 152 (2005) A1458.
[11] A. Sin, E. Kopnin, Y. Dubitsky, A. Zaopo, A.S. Arico, L.R. Gullo, D. La Rosa, V.
Antonucci, J. Power Sources 145 (2005) 68.
[12] P. Vernoux, E. Djurado, M. Guillodo, J. Am. Ceram. Soc. 84 (2001) 2289.
[13] Y.B. Lin, Z.L. Zhan, S.A. Barnett, J. Power Sources 158 (2006) 1313.
[14] L. Aguilar, S.W. Zha, Z. Cheng, J. Winnick, M.L. Liu, J. Power Sources 135
(2004) 17.
[15] P.R. Slater, D.P. Fagg, J.T.S. Irvine, J. Mater. Chem. 7 (1997) 2495.
[16] J.A. Noland, Physical Review 94 (1954) 724.
[17] J.F. Schooley, W.R. Hosler, E. Ambler, J.H. Becker, M.L. Cohen, C.S. Koonce,
Phys. Rev. Lett. 14 (1965) 305.
[18] Y. Aiura, H. Bando, I. Hase, S. Nishihara, Y. Haruyama, H. Suzuki, Superlattices
Microstruct. 21 (1997) 321.
[19] N. Shanthi, D.D. Sarma, Phys. Rev. B 57 (1998) 2153.
[20] T. Yokoya, T. Sato, H. Fujisawa, T. Takahashi, A. Chainani, M. Onoda, Phys.
Rev. B 59 (1999) 1815.
[21] T. Jarlborg, Phys. Rev. B 61 (2000) 9887.
[22] S. Lee, G. Kim, J.M. Vohs, R.J. Gorte, J. Electrochem. Soc. 155 (2008) B1179.
[23] H. Kurokawa, L.M. Yang, C.P. Jacobson, L.C. De Jonghe, S.J. Visco, J. Power
Sources 164 (2007) 510.
[24] T. Kolodiazhnyi, A. Petric, J. Electroceram. 15 (2005) 5.
[25] W. Luo, W. Duan, S.G. Louie, M.L. Cohen, Phys. Rev. B 70 (2004) 214109.
[26] U. Balachandran, N.G. Eror, J. Electrochem. Soc. 129 (1982) 1021.
[27] A.M.J. Seuter, Philips Res. Repts (1974) 1.
[28] R. Moos, K.H. Hardtl, J. Am. Ceram. Soc. 80 (1997) 2549.
[29] J.B. Goodenough, Y.H. Huang, J. Power Sources 173 (2007) 1.
[30] R. Moos, A. Gnudi, K.H. Härdtl, J. Appl. Phys. 78 (1995) 5042.
[31] R. Moos, T. Bischoff, W. Menesklou, K.H. Hardtl, J. Mater. Sci. 32 (1997) 4247.
[32] M.J. Akhtar, Z.U.N. Akhtar, R.A. Jackson, C.R.A. Catlow, J. Am. Ceram. Soc. 78
(1995) 421.
[33] T. Ishihara, Perovskite oxide for solid oxide fuel cells, Springer, New York 2009.
[34] K. Vidyasagar, A. Reller, J. Gopalakrishnan, C.N.R. Rao, J. Chem. Soc. Chem.
Comm. (1985) 7.
[35] J.A. Kilner, Solid State Ionics 129 (2000) 13.
[36] J.C. Ruiz-Morales, J. Canales-Vazquez, C. Savaniu, D. Marrero-Lopez, W.Z.
Zhou, J.T.S. Irvine, Nature 439 (2006) 568.
[37] X. Li, H.L. Zhao, F. Gao, N. Chen, N.S. Xu, Electrochem. Commun. 10 (2008)
1567.
[38] X. Li, H.L. Zhao, N.S. Xu, X. Zhou, C.J. Zhany, N. Chen, Int. J. Hydrogen Energy
34 (2009) 6407.
[39] X. Guoliang, X. Dong, K. Huang, F. Chen, Mater. Res. Bull. 46 (2011) 57.

89
[40] D. Neagu, J.T.S. Irvine, Chem. Mater. 23 (2011) 1607.
[41] F.W. Lytle, J. Appl. Phys. 35 (1964) 2212.
[42] G. Kresse, J. Furthmuller, Phys. Rev. B 54 (1996) 11169.
[43] G. Kresse, D. Joubert, Phys. Rev. B 59 (1999) 1758.
[44] J.P. Perdew, K. Burke, M. Ernzerhof, Phys. Rev. Lett. 77 (1996) 3865.
[45] H.J. Monkhorst, J.D. Pack, Phys. Rev. B 13 (1976) 5188.
[46] Y.A. Abramov, V.G. Tsirelson, V.E. Zavodnik, S.A. Ivanov, B.I. D., Acta
Crystallogr. B 51 (1995) 942.
[47] K. van Benthem, C. Elsasser, R.H. French, J. Appl. Phys. 90 (2001) 6156.
[48] J. Robertson, K. Xiong, S.J. Clark, Thin Solid Films 496 (2006) 1.
[49] C. Zhang, C.L. Wang, J.C. Li, K. Yang, Y.F. Zhang, Q.Z. Wu, Mater. Chem. Phys.
107 (2008) 215.
[50] S.C. Ammal, A. Heyden, J. Chem. Phys. 133 (2010) 164703.
[51] J.K. Norskov, J. Rossmeisl, A. Logadottir, L. Lindqvist, J.R. Kitchin, T. Bligaard,
H. Jonsson, J. Phys. Chem. B 108 (2004) 17886.
[52] P.W. Atkins, Physical Chemistry, Oxford University Press, Oxford 1998.
[53] S. Laursen, S. Linic, PCCP 11 (2009) 11006.
[54] S. Laursen, S. Linic, J. Phys. Chem. C 113 (2009) 6689.
[55] J. Rogal, K. Reuter, M. Scheffler, Phys. Rev. B 75 (2007) 205433.
[56] C.K. Gupta, A.K. Suri, Extractive metallurgy of niobium, CRC Press, Boca Raton
1994.
[57] K. Kuroda, W. Sugimoto, M. Shirata, M. Takemoto, S. Hayami, Y. Sugahara,
Solid State Ionics 108 (1998) 315.
[58] J.N. Yun, Z.Y. Zhang, J.F. Yan, W. Zhao, J. Appl. Phys. 107 (2010).

90
CHAPTER 5
OBTAINING MIXED IONIC/ELECTRONIC CONDUCTIVITY IN PEROVSKITE
OXIDES UNDER ANODIC SOLID OXIDE FUEL CELL CONDITIONS: A
COMPUTATIONAL PREDICTION FOR DOPED STRONTIUM TITANATES
5.1 Summary
The electronic conductivity and thermodynamic stability of mixed p- and n-doped
SrTiO3 perovskites have been investigated under anodic solid oxide fuel cell conditions
using density functional theory (DFT). In particular, constrained ab initio thermodynamic
calculations have been performed to evaluate the phase stability of various Ga- and La-
doped SrTiO3 at synthesized and anodic SOFC conditions. The density of states (DOS) of
these materials were analyzed to determine the number of charge carriers and the degree
of electronic conductivity. We find that a mixed ionic/electronic conductor can be
obtained when doping SrTiO3 perovskite oxide with both p-type and n-type dopants.
Calculations show that 10% Ga- and 20% La-doped SrTiO3 exhibit mixed
ionic/electronic conductivity at high temperature and low oxygen partial pressure
whereas doping with higher concentrations of Ga, e.g., 20%, diminishes the electronic
conductivity of the material. Furthermore, changing the n-dopant from La (A-site) to Nb
(B-site) does not significantly affect the reducibility and number of charge carriers in p-

91
and n-doped SrTiO3. However, a higher degree of oxygen vacancy clustering is observed
for the La-doped material which reduces the oxygen ion diffusion rate and traps
electrons. Nevertheless, our findings suggest that independent of doping site, mixed
ionic/electronic conductivity can be obtained in SrTiO3 perovskite oxides under reducing
conditions and high temperatures when using a mixed p- and n-type doping strategy that
uses a p-dopant concentration smaller than the n-dopant concentration.
5.2 Introduction
It is known that mixed ionic/electronic conductivity of perovskite based anodes
plays an important role in enhancing SOFC performance. A mixed oxide ion and electron
conducting perovskite has the advantage of efficiently collecting current while increasing
the electrochemically active surface area for fuel oxidation [4]. As a result, several
doping strategies to improve MIEC are currently being tested. In Chapter 4, we proposed
that mixed p- and n-doping approach could be an efficient doing strategy to obtain mixed
ionic/electronic conductivity in perovskite oxides under anodic SOFC conditions. Our
calculated results suggest that ionic and electronic conductivity of doped SrTiO3
perovskites are remarkably improved when doping with Ga and Nb dopants by using a
Ga concentration smaller than the Nb concentration. This must be because the hole
doping effect of Ga dopants are compensated by the presence of oxygen vacancies in the
lattice. This result is in excellent agreement with experimental observations from Xiao et
al. [2] Moreover, mixed ionic/electronic conductors with A-site and B-site co-doping
have been reported. Li et al. [5, 6] and Neagu and Irvine [3] suggested that n-type (La)
and p-type (Sc, Co, and Ga) co-doped SrTiO3 can promote fast reduction and improve
ionic and electronic conductivity of the material.

92
In this Chapter, we aim to show that mixed p- and n-doping is indeed an efficient
strategy to obtain mixed ionic/electronic conductivity in perovskite materials. By using
computational tools, we prove unambiguously that this mixed doping strategy is valid
and independent of the doping site in the SrTiO3 perovskite structure. In particular, we
performed constrained ab initio thermodynamic simulations to evaluate the
thermodynamic stability of Ga- and La-doped SrTiO3 phases at synthesized and anodic
SOFC conditions, we analyzed the electronic structure of the resulting materials, and we
compared the results to our previous study of Ga- and Nb-doped SrTiO3 perovskites.
5.3 Computational Details
To investigate the bulk electronic properties of stoichiometric and doped SrTiO3,
we initially optimized the lattice parameter of the SrTiO3 unit cell and created a 100 atom
supercell containing twenty unit cells (5×2×2). To generate doped structures we replaced
A-site cations (Sr) with n-type dopants (La) and substituted B-site cations (Ti) with p-
type dopants (Ga). Substitution of two cations on the A-site (B-site) in the host lattice
with two dopants yields 10% A-site (B-site) doped SrTiO3 etc. To study the charge
compensation mechanism in p- and n-doped systems, both A-site deficient and reduced
structures were created by generating strontium vacancies and oxygen vacancies,
respectively. In this work, we considered up to two strontium vacancies and three oxygen
vacancies in each structure. For all doped structures, we employed the reoptimized lattice
parameters of 20% La-doped SrTiO3 and tried all meaningful configurations (over one
hundred configurations were tested in this study) to identify the lowest energy structures.
All calculations performed for this study are based on the plane wave density
functional theory implementation of the Vienna Ab initio Simulation Package (VASP
93
4.6) [7, 8]. We used the projector-augmented wave (PAW) method to represent the inner
core potentials [7] and treated the Sr 4s4p5s, Ti 3d4s, O 2s2p, La 5s5p5d6s, and Ga 4s4p
as valence electrons. The cutoff of the kinetic energy was set for all calculations to 400
eV. Exchange correlation is described within the generalized gradient approximation
(GGA) with the Perdew-Burke-Ernzerhof (PBE) functional [9]. All calculations are spin-
polarized and Brillouin zone integration was performed with a 2×5×5 Monkhorst-Pack k-
point mesh [10]. For density of state (DOS) calculations we used a 4×10×10 k-mesh. In
all structure optimizations, all atoms are fully relaxed until the Hellman-Feynman forces
are less than 0.02 eV Å-1
.
The optimized supercell of 20% La-doped SrTiO3 exhibits only a very small
change in lattice parameter (3.921 Å) to that of stoichiometric SrTiO3. Computations
predict a Sr-O and Ti-O bond distance of 2.792 and 1.974 Å, respectively. As shown
previously, the density of states of stoichiometric SrTiO3 exhibits insulating behavior
with a band gap of 1.80 eV [11]. While DFT within the GGA approximation is known to
underestimate band gaps, several studies showed excellent agreement in the predicted
electronic behavior of doped oxides computed by DFT within the GGA approximation
with the experimental observations [12-14]. Moreover, it has been shown that GGA-DFT
can be used to predict formation energies and phase stabilities of several transition metal
oxides [15].
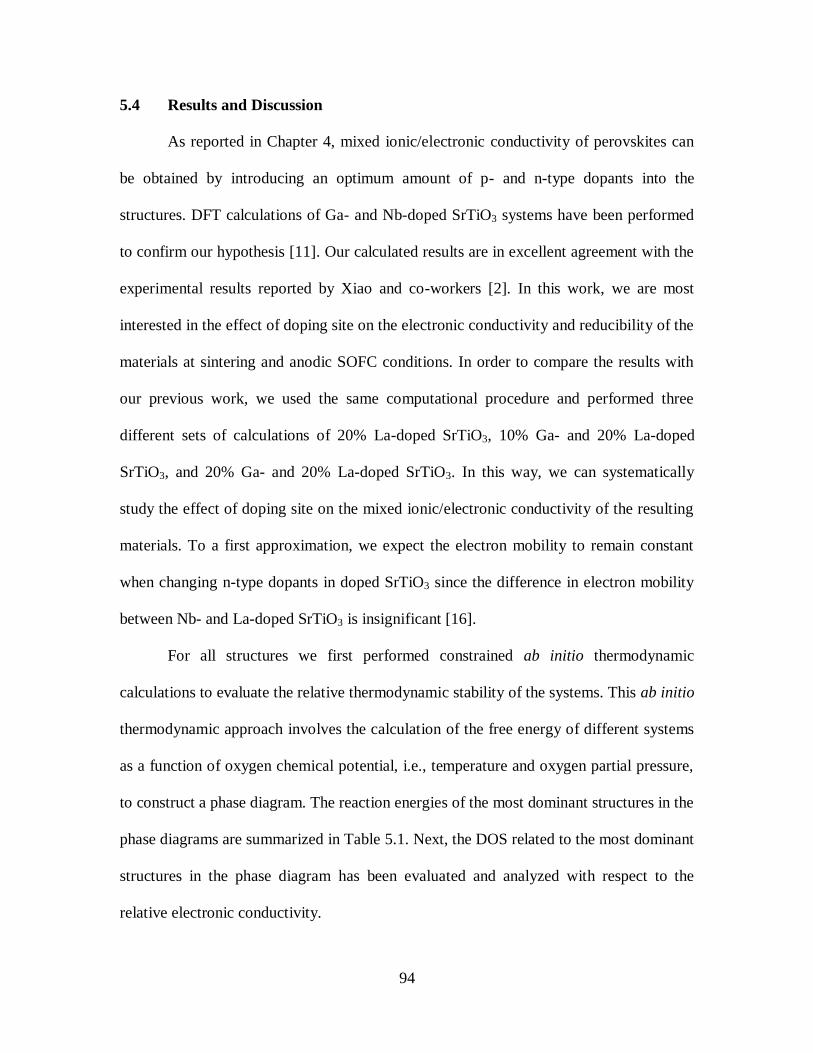
94
5.4 Results and Discussion
As reported in Chapter 4, mixed ionic/electronic conductivity of perovskites can
be obtained by introducing an optimum amount of p- and n-type dopants into the
structures. DFT calculations of Ga- and Nb-doped SrTiO3 systems have been performed
to confirm our hypothesis [11]. Our calculated results are in excellent agreement with the
experimental results reported by Xiao and co-workers [2]. In this work, we are most
interested in the effect of doping site on the electronic conductivity and reducibility of the
materials at sintering and anodic SOFC conditions. In order to compare the results with
our previous work, we used the same computational procedure and performed three
different sets of calculations of 20% La-doped SrTiO3, 10% Ga- and 20% La-doped
SrTiO3, and 20% Ga- and 20% La-doped SrTiO3. In this way, we can systematically
study the effect of doping site on the mixed ionic/electronic conductivity of the resulting
materials. To a first approximation, we expect the electron mobility to remain constant
when changing n-type dopants in doped SrTiO3 since the difference in electron mobility
between Nb- and La-doped SrTiO3 is insignificant [16].
For all structures we first performed constrained ab initio thermodynamic
calculations to evaluate the relative thermodynamic stability of the systems. This ab initio
thermodynamic approach involves the calculation of the free energy of different systems
as a function of oxygen chemical potential, i.e., temperature and oxygen partial pressure,
to construct a phase diagram. The reaction energies of the most dominant structures in the
phase diagrams are summarized in Table 5.1. Next, the DOS related to the most dominant
structures in the phase diagram has been evaluated and analyzed with respect to the
relative electronic conductivity.

95
5.4.1 Electronic structure and phase diagram of 20% La-doped SrTiO3
In this set of calculations, we replaced four Sr atoms with four La atoms in the
5×2×2 supercell to obtain a model for 20% La-doped SrTiO3 (Sr0.8La0.2TiO3). In addition,
we created structures with one or two Sr vacancies to form 5% A-site deficient
(Sr0.75La0.2TiO3) and 10% A-site deficient 20% La-doped SrTiO3 (Sr0.7La0.2TiO3) model
structures, respectively. Substitution of Sr atoms with La atoms at an A-site does not
significantly alter the lattice structure. There is no preference for the arrangement of La
atoms and Sr vacancies in the lattice since the energy difference between the most stable
structures are insignificant (lower than 2 meV/atom). The structures of the most stable
configurations are illustrated in Fig. 5.1.
Constrained ab initio thermodynamic calculations of 20% La-doped SrTiO3
systems were performed to determine the phase stability of these structures at various
temperatures and oxygen partial pressures. We employed two different types of
calculations based on the main products that are generated when a phase transition
occurs, namely, SrO rich second phase and TiO2 and La2O3 rich second phases. We use
the approach described in Chapter 4 to calculate Gibbs free energies of reactions and
construct the phase diagram. Figure 5.2 shows the calculated phase diagrams of 20% La-
doped SrTiO3 with SrO rich second phase and TiO2 and La2O3 rich second phases. The
phase transformation from 10% Sr-deficient (Sr0.7La0.2TiO3) to a non Sr-deficient
structure (Sr0.8La0.2TiO3) occurs with increasing temperature and decreasing oxygen
partial pressure. An oxygen deficient structure is thermodynamically unstable in the
considered temperature and oxygen partial pressure range.

96
Table 5.1 Summary of reaction energies used in constrained ab initio thermodynamic
calculations
Phase Diagram Reaction E (eV)
20% La-doped SrTiO3 with SrO rich
phase
Sr16La4Ti20O60 + 1/2O2 --> Sr15La4Ti20O60 + SrO -1.88
Sr16La4Ti20O60 + O2 --> Sr14La4Ti20O60 + 2SrO -3.78
20% La-doped SrTiO3 with
TiO2/La2O3 rich phases
15Sr14La4Ti20O60 --> 14Sr15La4Ti20O60 + 20TiO2 + 2La2O3 + 7O2 2.98
8Sr14La4Ti20O60 --> 7Sr16La4Ti20O60 + 20TiO2 + 2La2O3 + 7O2 5.58
10% Ga- and 20% La-doped SrTiO3
with SrO rich phase
Sr16La4Ti18Ga2O60 + 1/2O2 --> Sr15La4Ti18Ga2O60 + SrO -1.59
Sr16La4Ti18Ga2O60 --> Sr16La4Ti18Ga2O58 + O2 8.86
Sr16La4Ti18Ga2O60 --> Sr16La4Ti18Ga2O57 + 3/2O2 14.07
10% Ga- and 20% La-doped SrTiO3
with TiO2/Ga2O3/La2O3
rich phases
15Sr14La4Ti18Ga2O60 --> 14Sr15La4Ti18Ga2O60 + 18TiO2 + 2La2O3 + Ga2O3 + 15/2O2
-1.24
8Sr14La4Ti18Ga2O60 --> 7Sr16La4Ti18Ga2O60 + 18TiO2 + 2La2O3 + Ga2O3 + 15/2O2
1.24
8Sr14La4Ti18Ga2O60 --> 7Sr16La4Ti18Ga2O58 + 18TiO2 + 2La2O3 + Ga2O3 + 29/2O2
8.99
8Sr14La4Ti18Ga2O60 --> 7Sr16La4Ti18Ga2O57 + 18TiO2 + 2La2O3 + Ga2O3 + 18O2
13.55
20% Ga- and 20% La-doped SrTiO3
Sr16La4Ti16Ga4O60 --> Sr16La4Ti16Ga4O58 + O2 8.57
Sr16La4Ti16Ga4O60 --> Sr16La4Ti16Ga4O57 + 3/2O2 13.09

97
Figure 5.1 Most stable structures of 20% La-doped SrTiO3: a) Sr0.7La0.2TiO3 and b)
Sr0.8La0.2TiO3 Green, gray, blue, and red spheres represent Sr, Ti, La, and O atoms,
respectively. Blue squares represent the position of Sr vacancies.
The electronic conductivity of each structure in the phase diagram can to a first
approximation be analyzed from its electronic structure. We find that a very significant
improvement in electronic conductivity of the materials occurs when the material is
electronically compensated at high temperature and low oxygen partial pressure. As
depicted in Fig. 5.3(a), the DOS of a 10% Sr-deficient phase (Sr0.7La0.2TiO3) exhibits
insulating behavior since the extra charge from La dopants are compensated by the
presence of Sr vacancies. In contrast, the DOS of a non Sr-deficient phase

98
(Sr0.8La0.2TiO3) displays metallic character as the Fermi energy shifts inside the
conduction band with four conduction electrons per supercell below the Fermi level.
Note that our simulation results are in agreement with several experimental
observations. For example, it has been reported that A-site deficient n-doped SrTiO3
exhibits a significant improvement in electronic conductivity when the material is pre-
reduced or sintered in a reducing environment and high temperature. Neagu and Irvine
found that this drastic enhancement in conductivity in La-doped SrTiO3 occurs when
sintering the material in H2 atmosphere at 1650 oC [17]. Moreover, a promising
conductivity of A-site deficient Y-doped SrTiO3 can be achieved when the material is
pre-reduced in 7% H2/Ar at 1400 oC [18].
5.4.2 Electronic structure and phase diagram of 10% Ga- and 20% La-doped
SrTiO3
Substitution of two Ti atoms with two Ga atoms in our 20% La-doped SrTiO3
model leads to 10% Ga- and 20% La-doped SrTiO3. The presence of Sr and oxygen
vacancies in the structure was investigated in a similar manner as described above. It is
found that the arrangement of two Ga atoms in the stoichiometric structures is fairly
random since the energy differences of the most stable structures are insignificant (lower
than 2 meV/atom). At high temperatures and low oxygen partial pressures, structures
with up to three oxygen vacancies are studied. In the reduced structure, the oxygen
vacancies tend to cluster together. In addition, a configuration with two Ga atoms next to
an oxygen vacancy is more favorable than a structure with the Ga atoms separated from
the oxygen vacancies since the extra electrons from the oxygen vacancy can be partially
compensated by the holes created by the Ga atoms in the structure. The configurations of
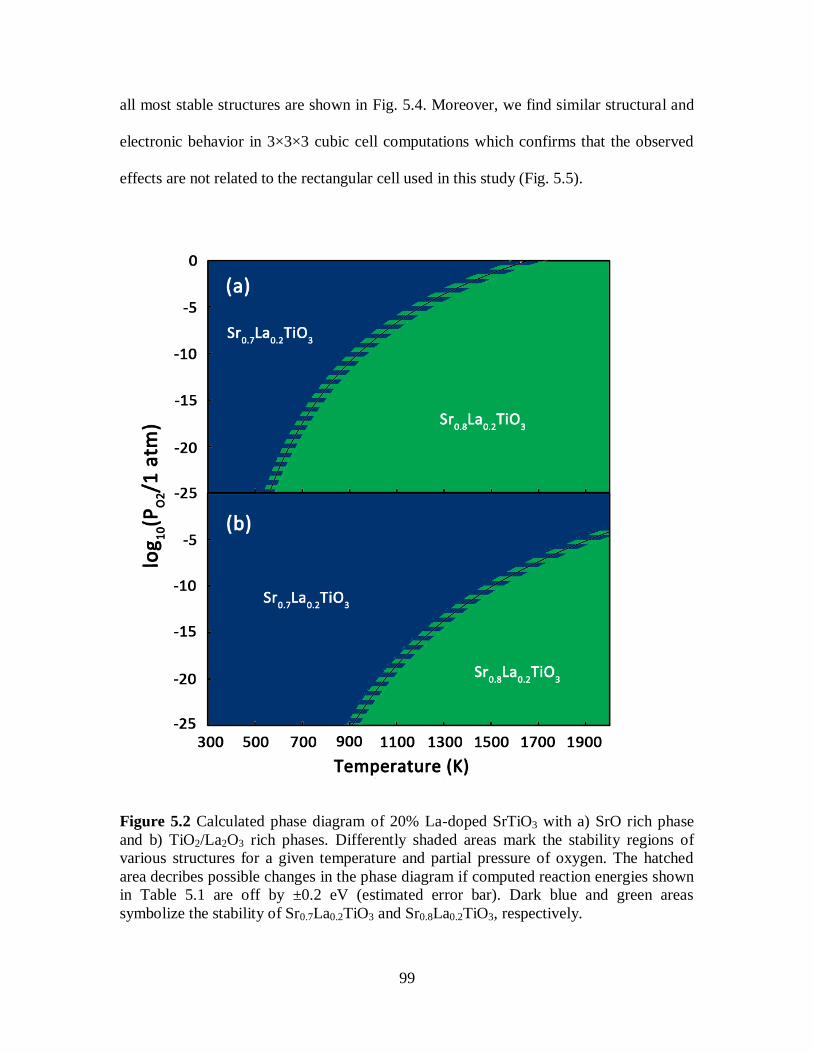
99
all most stable structures are shown in Fig. 5.4. Moreover, we find similar structural and
electronic behavior in 3×3×3 cubic cell computations which confirms that the observed
effects are not related to the rectangular cell used in this study (Fig. 5.5).
Figure 5.2 Calculated phase diagram of 20% La-doped SrTiO3 with a) SrO rich phase
and b) TiO2/La2O3 rich phases. Differently shaded areas mark the stability regions of
various structures for a given temperature and partial pressure of oxygen. The hatched
area decribes possible changes in the phase diagram if computed reaction energies shown
in Table 5.1 are off by ±0.2 eV (estimated error bar). Dark blue and green areas
symbolize the stability of Sr0.7La0.2TiO3 and Sr0.8La0.2TiO3, respectively.
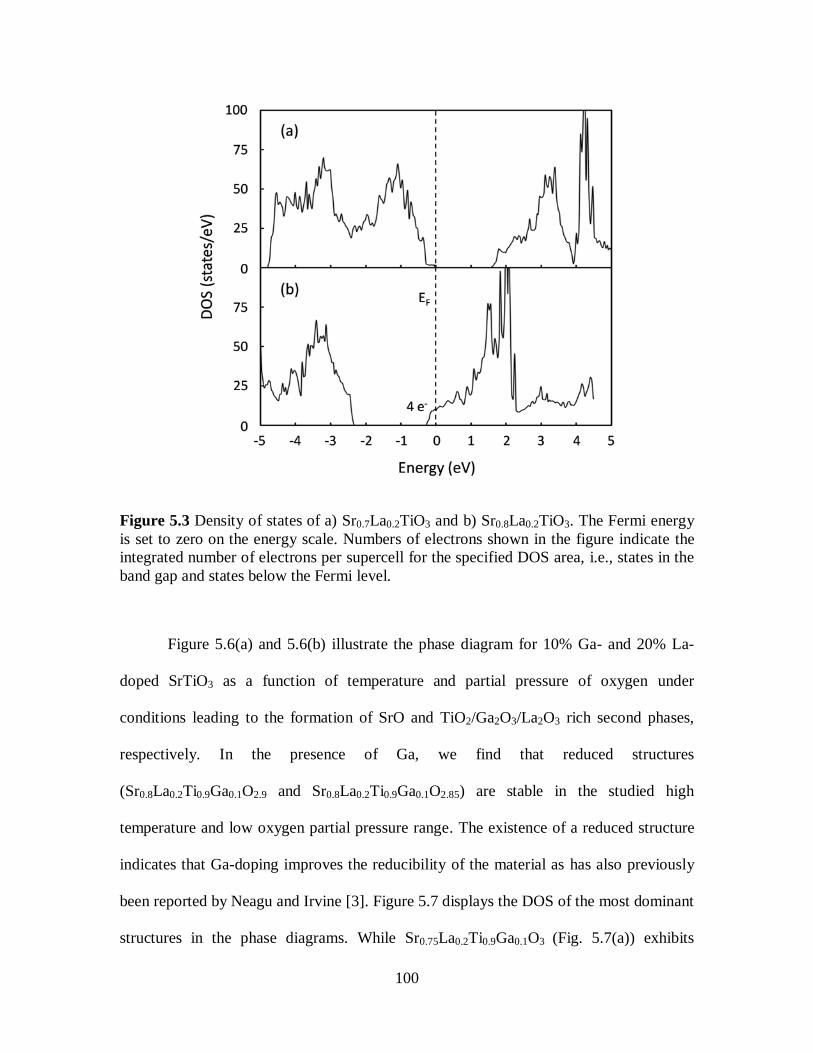
100
Figure 5.3 Density of states of a) Sr0.7La0.2TiO3 and b) Sr0.8La0.2TiO3. The Fermi energy
is set to zero on the energy scale. Numbers of electrons shown in the figure indicate the
integrated number of electrons per supercell for the specified DOS area, i.e., states in the
band gap and states below the Fermi level.
Figure 5.6(a) and 5.6(b) illustrate the phase diagram for 10% Ga- and 20% La-
doped SrTiO3 as a function of temperature and partial pressure of oxygen under
conditions leading to the formation of SrO and TiO2/Ga2O3/La2O3 rich second phases,
respectively. In the presence of Ga, we find that reduced structures
(Sr0.8La0.2Ti0.9Ga0.1O2.9 and Sr0.8La0.2Ti0.9Ga0.1O2.85) are stable in the studied high
temperature and low oxygen partial pressure range. The existence of a reduced structure
indicates that Ga-doping improves the reducibility of the material as has also previously
been reported by Neagu and Irvine [3]. Figure 5.7 displays the DOS of the most dominant
structures in the phase diagrams. While Sr0.75La0.2Ti0.9Ga0.1O3 (Fig. 5.7(a)) exhibits

101
insulating behavior (the charge from the La dopants are compensated by Sr vacancies and
Ga dopants), Sr0.8La0.2Ti0.9Ga0.1O3 (Fig. 5.7(b)), Sr0.8La0.2Ti0.9Ga0.1O2.9 (Fig. 5.7(c)), and
Sr0.8La0.2Ti0.9Ga0.1O2.85 (Fig. 5.7(d)) exhibit metallic behavior with up to four conduction
electrons at the Fermi level per supercell. It can be seen that charge compensation of the
La (n-type) and Ga (p-type) dopants is absent when the material is reduced presumably
because the hole doping effect of Ga is compensated by the presence of oxygen vacancies
as described in our previous work [11]. More interestingly, the formation of an oxygen
vacancy cluster in the structure results in localized states within the energy gap of the
DOS of Sr0.8La0.2Ti0.9Ga0.1O2.85 (Fig. 5.7(d)).
Figure 5.4 Most stable structures of 10% Ga- and 20% La-doped SrTiO3: a)
Sr0.75La0.2Ti0.9Ga0.1O3, b) Sr0.8La0.2Ti0.9Ga0.1O3, c) Sr0.8La0.2Ti0.9Ga0.1O2.9, and d)
Sr0.8La0.2Ti0.9Ga0.1O2.85. Green, gray, blue, brown and red spheres represent Sr, Ti, La, Ga
and O atoms, respectively. Blue and black squares represent the position of a Sr and O
vacancy, respectively.

102
Figure 5.5 (a) The structure of Sr0.81La0.19Ti0.89Ga0.11O2.89 with 3×3×3 supercell. Green,
gray, blue, brown and red spheres represent Sr, Ti, La, Ga and O atoms, respectively.
Black squares represent the position of O vacancies. (b) The DOS of
Sr0.81La0.19Ti0.89Ga0.11O2.89. Fermi energy is set to zero on the energy scale. Numbers of
electrons shown in the figure indicate the integrated number of electrons per supercell for
the specified DOS area, i.e., states in the band gap and states below the Fermi level.

103
Figure 5.6 Calculated phase diagram of 10% Ga- and 20% La-doped SrTiO3 with a) SrO
rich phase and b) TiO2/Ga2O3/La2O3 rich phases. Differently shaded areas mark the
stability regions of various structures for a given temperature and partial pressure of
oxygen. The hatched area decribes possible changes in the phase diagram if computed
reaction energies shown in Table 5.1 are off by ±0.2 eV (estimated error bar). Dark blue,
green, yellow, and red areas symbolize the stability of Sr0.75La0.2Ti0.9Ga0.1O3,
Sr0.8La0.2Ti0.9Ga0.1O3, Sr0.8La0.2Ti0.9Ga0.1O2.9, and Sr0.8La0.2Ti0.9Ga0.1O2.85, respectively.

104
Figure 5.7 Density of states of a) Sr0.75La0.2Ti0.9Ga0.1O3, b) Sr0.8La0.2Ti0.9Ga0.1O3, c)
Sr0.8La0.2Ti0.9Ga0.1O2.9, and d) Sr0.8La0.2Ti0.9Ga0.1O2.85. The Fermi energy is set to zero on
the energy scale. Numbers of electrons shown in the figure indicate the integrated number
of electrons per supercell for the specified DOS area, i.e., states in the band gap and states
below the Fermi level.
A partial density of states (PDOS) analysis and band decomposition charge
density calculations for Sr0.8La0.2Ti0.9Ga0.1O2.85, as illustrated in Fig. 5.8(a), show that
there are two states within the gap between the valence and conduction bands. Each state
contains two electrons which are mostly localized around the Ga atoms and vacancy sites.
This observation is in agreement with previous computational and experimental results

105
that vacancy clustering can occur in perovskite oxides and that the electrons from the
vacancies are often localized and do not contribute to the electronic conductivity of the
material [19, 20]. Next, Fig. 5.8(b) shows the PDOS of Sr0.8La0.2Ti0.9Ga0.1O2.85 below the
Fermi level and confirms that these states are primarily from mixed-valent Ti3+
/Ti4+
that
contribute to electronic conduction. A similar behavior is observed for all structures
studied with states below the Fermi level.
Figure 5.8 (a) Partial density of states of the gap states between the valence band and
conduction band of Sr0.8La0.2Ti0.9Ga0.1O2.85. The insets describe the charge density of the
localized states which are located at the oxygen vacancy sites. (b) Partial density of states
of Sr0.8La0.2Ti0.9Ga0.1O2.85 below the Fermi level. The inset illustrates the charge density
of delocalized states from mixed-valent Ti3+
/Ti4+
.

106
To conclude, doping of 20% La-doped SrTiO3 with 10% Ga leads to a
comparable degree of electronic conductivity to that of only 20% La-doped SrTiO3 under
anodic SOFC conditions. Furthermore, Ga promotes ionic conductivity by enhancing the
reducibility of the material. These results support the experimental observations reported
by several groups that Ga-doped titanates possess a high number of oxygen vacancies and
good oxide ion conduction [2, 3]. However, the ordering of oxygen vacancies might
reduce the ionic and electronic conductivity since the association of vacancies can impair
diffusion and trap electrons.
5.4.3 Electronic structure and phase diagram of 20% Ga- and 20% La-doped
SrTiO3
Substitution of four Ti atoms with Ga atoms in our 20% La-doped SrTiO3 model
leads to a 20% Ga- and 20% La-doped SrTiO3 model. Although the position of the four
Ga atoms in the stoichiometric structure is nearly random, the most stable reduced
structures have oxygen vacancy clusters surrounded by four Ga atoms (Fig. 5.9). Such
preferred configurations confirm that the charge compensation mechanism plays an
essential role in the arrangement of impurities in the structure.
Constrained ab initio thermodynamic calculations of this system were carried out
to determine the phase stability and the reducibility of the materials at various
temperatures and oxygen partial pressure. The phase transitions of this system are similar
to those of the 10% Ga-doped system, i.e., the presence of a reduced phase of both the
10% Ga- and 20% Ga-doped systems occurs at approximately the same temperature and
oxygen partial pressure range. This indicates that increasing the concentration of Ga does
not significantly improve the reducibility of the material. However, the phase diagram of

107
the 20% Ga-doped system shown in Fig. 5.10 depicts the absence of a Sr-deficient phase
(i.e., there are no SrO or TiO2/Ga2O3/La2O3 rich second phases).
Figure 5.9 Most stable structures of 20% Ga- and 20% La-doped SrTiO3: a)
Sr0.8La0.2Ti0.8Ga0.2O3, b) Sr0.8La0.2Ti0.8Ga0.2O2.9, and c) Sr0.8La0.2Ti0.8Ga0.2O2.85. Green,
gray, blue, brown and red spheres represent Sr, Ti, La, Ga and O atoms, respectively.
Black squares represent the position of O vacancies.

108
Figure 5.10 Calculated phase diagram of 20% Ga- and 20% La-doped SrTiO3.
Differently shaded areas mark the stability regions of various structures for a given
temperature and partial pressure of oxygen. The hatched area decribes possible changes
in the phase diagram if computed reaction energies shown in Table 5.1 are off by ±0.2 eV
(estimated error bar). Dark blue, yellow, and red areas symbolize stablity of
Sr0.8La0.2Ti0.8Ga0.2O3, Sr0.8La0.2Ti0.8Ga0.2O2.9, and Sr0.8La0.2Ti0.8Ga0.2O2.85, respectively.
Moreover, it can be seen from the DOS (Fig. 5.11) that increasing the Ga
concentration leads to a reduction in the electronic conductivity. As shown in Fig.
5.11(b), the DOS of Sr0.8La0.2Ti0.8Ga0.2O2.9 exhibits only two delocalized electrons in the
conduction band. Although the DOS of Sr0.8La0.2Ti0.8Ga0.2O2.85 (Fig. 5.11(c)) displays
four electrons below the Fermi level in the conduction band, the PDOS and charge
density shown in Fig. 5.12 reveal that there are only two electrons uniformly distributed
on all Ti atoms in the supercell while the other two electrons seem to be localized on
oxygen vacancy sites and Ga atoms. These localized electrons do not contribute to
electronic conduction. Instead, they tend to trap electrons and could further decrease the
electronic conductivity of the material. Thus, while doping with 20% Ga improves the
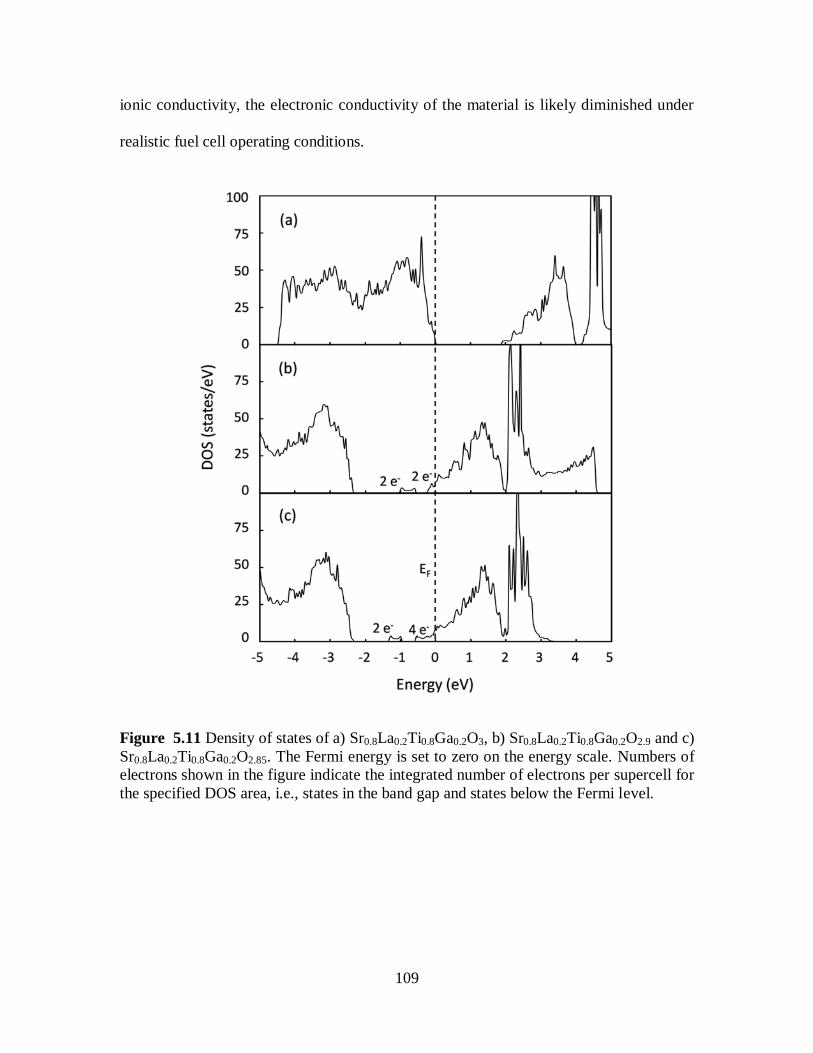
109
ionic conductivity, the electronic conductivity of the material is likely diminished under
realistic fuel cell operating conditions.
Figure 5.11 Density of states of a) Sr0.8La0.2Ti0.8Ga0.2O3, b) Sr0.8La0.2Ti0.8Ga0.2O2.9 and c)
Sr0.8La0.2Ti0.8Ga0.2O2.85. The Fermi energy is set to zero on the energy scale. Numbers of
electrons shown in the figure indicate the integrated number of electrons per supercell for
the specified DOS area, i.e., states in the band gap and states below the Fermi level.

110
Figure 5.12 (a) Partial density of states of the gap states between the valence and
conduction band of Sr0.8La0.2Ti0.8Ga0.2O2.85. The insets describe the charge density of the
localized states which are located at the oxygen vacancy sites. (b) Partial density of states
of Sr0.8La0.2Ti0.9Ga0.1O2.85 below the Fermi level. The inset illustrates the charge density
of the localized states in the lower energy region and charge density of delocalized states
from mixed-valent Ti3+
/Ti4+
near the Fermi level.

111
5.4.4 Effects of n-doping site on mixed ionic/electronic conductivity of mixed
p- and n-doped SrTiO3
In this section, we compare the simulation results of our previous work (Ga- and
Nb-doped SrTiO3) [11] with the present work (Ga- and La-doped SrTiO3) to study the
effects of n-doping site on the reducibility and electronic structure of mixed p- and n-
doped SrTiO3 perovskites. In particular, we compare the phase diagrams and DOS of the
10% Ga- and 20% Nb-doped SrTiO3 and 10% Ga- and 20% La-doped SrTiO3 systems
since these compositions are claimed to lead to promising mixed ionic/electronic
conductors. We find that altering the n-dopant from Nb (B-site) to La (A-site) does not
significantly affect the phase stability and reducibility of the materials. As shown in Fig.
5.13, the presence of the reduced phases occurs in both phase diagrams, within our
computational accuracy of about 0.2 eV, at the same temperature and oxygen partial
pressure ranges. As a result, we expect the ionic conductivity of both systems to be
comparable.
Furthermore, comparing the number of charge carriers obtained from the DOS
computations, we observe that the numbers of charge carriers are equivalent in both
systems (Fig. 5.14). Therefore, their electronic conductivity is expected to be similar.
However, a higher degree of oxygen vacancy clustering is observed in our La-doped
systems which should reduce the oxygen diffusion rate and trap electrons. Therefore, the
mixed ionic/electronic conductivity of La-doped systems could be lower than that of Nb-
doped systems.
Finally, in 20% Ga-doped systems, we find that the reducibility and numbers of
charge carriers in 20% Ga- and 20% Nb-doped SrTiO3 and 20% Ga- and 20% La-doped

112
SrTiO3 are very similar. Therefore, independent of n-dopant a maximum in mixed
ionic/electronic conductivity of the materials is observed when the p-dopant
concentration is smaller than the n-dopant concentration.
Figure 5.13 Calculated phase diagram of a) 10% Ga- and 20% Nb-doped SrTiO3 and b)
10% Ga- and 20% La-doped SrTiO3. Differently shaded areas mark the stability regions
of various structures for a given temperature and partial pressure of oxygen. The hatched
area decribes possible changes in the phase diagram if computed reaction energies shown
in Table 5.1 are off by ±0.2 eV (our estimated error bar). In Fig. 5.13(a), Dark blue,
green, yellow, and red areas symbolize stability of Sr0.95Ti0.7Nb0.2Ga0.1O3,
SrTi0.7Nb0.2Ga0.1O3, SrTi0.7Nb0.2Ga0.1O2.9, and SrTi0.7Nb0.2Ga0.1O2.85, respectively. The
hatched violet area symbolizes the possible stability of a SrTi0.7Nb0.2Ga0.1O2.95 phase. In
Fig. 5.13(b), blue, green, yellow, and red areas symbolize the stability of
Sr0.75La0.2Ti0.9Ga0.1O3, Sr0.8La0.2Ti0.9Ga0.1O3, Sr0.8La0.2Ti0.9Ga0.1O2.9, and
Sr0.8La0.2Ti0.9Ga0.1O2.85, respectively.

113
Figure 5.14 Density of states of a) SrTi0.7Nb0.2Ga0.1O2.9, b) SrTi0.7Nb0.2Ga0.1O2.85, c)
Sr0.8La0.2Ti0.9Ga0.1O2.9, and d) Sr0.8La0.2Ti0.9Ga0.1O2.85. The Fermi energy is set to zero on
the energy scale. Numbers of electrons shown in the figure indicate the integrated number
of electrons per supercell for the specified DOS area, i.e., states in the band gap and states
below the Fermi level.
5.5 Conclusions
In this work, the thermodynamic stability and electronic properties of Ga (p-type)
and La (n-type) doped SrTiO3 perovskites have been studied using density functional
theory and constrained ab initio thermodynamic simulations. The calculations reveal that
the cation vacancy compensated 20% La-doped Sr-deficient SrTiO3 transforms to an

114
electronically compensated phase at high temperature and low oxygen partial pressure
which leads to a significant improvement in electronic conductivity. This result is in
agreement with the defect chemistry model and experimental observations. Doping 20%
La-doped SrTiO3 with 10% Ga enhances the ionic conductivity of the material by
creating oxygen vacancies. The electronic conductivity is maintained since the hole
doping effect is compensated by the presence of oxygen vacancies so that a mixed
ionic/electronic conductor is formed. However, doping with 20% Ga decreases the
electronic conductivity of the material. This result supports the experimental observation
that doping with a small amount of Ga improves the conductivity and promotes fast
reduction of the material. [2, 3] Altering the n-dopant from La (A-site) to Nb (B-site) has
only a small effect on the ionic and electronic conductivity of the mixed p- and n-doped
material. The conductivity of the La-doped systems is likely reduced due to a higher
degree of oxygen vacancy ordering compared to the Nb-doped systems. Independent of
doping site, mixed ionic/electronic conductivity can be achieved with a mixed p- and n-
doping approach.
5.6 References
[1] T. Kolodiazhnyi, A. Petric, J. Electroceram. 15 (2005) 5.
[2] X. Guoliang, X. Dong, K. Huang, F. Chen, Mater. Res. Bull. 46 (2011) 57.
[3] D. Neagu, J.T.S. Irvine, Chem. Mater. 23 (2011) 1607.
[4] R.J. Gorte, J.M. Vohs, Current Opinion in Colloid & Interface Science 14 (2009)
236.
[5] X. Li, H.L. Zhao, F. Gao, N. Chen, N.S. Xu, Electrochem. Commun. 10 (2008)
1567.
[6] X. Li, H.L. Zhao, N.S. Xu, X. Zhou, C.J. Zhany, N. Chen, Int. J. Hydrogen Energy
34 (2009) 6407.
[7] G. Kresse, J. Furthmuller, Phys. Rev. B 54 (1996) 11169.
[8] G. Kresse, D. Joubert, Phys. Rev. B 59 (1999) 1758.
[9] J.P. Perdew, K. Burke, M. Ernzerhof, Phys. Rev. Lett. 77 (1996) 3865.
[10] H.J. Monkhorst, J.D. Pack, Phys. Rev. B 13 (1976) 5188.

115
[11] S. Suthirakun, S.C. Ammal, G. Xiao, F. Chen, H.C. zur Loye, A. Heyden, Phys.
Rev. B 84 (2011).
[12] K. van Benthem, C. Elsasser, R.H. French, J. Appl. Phys. 90 (2001) 6156.
[13] J. Robertson, K. Xiong, S.J. Clark, Thin Solid Films 496 (2006) 1.
[14] C. Zhang, C.L. Wang, J.C. Li, K. Yang, Y.F. Zhang, Q.Z. Wu, Mater. Chem. Phys.
107 (2008) 215.
[15] G. Hautier, S.P. Ong, A. Jain, C.J. Moore, G. Ceder, Phys. Rev. B 85 (2012)
155208.
[16] S. Ohta, T. Nomura, H. Ohta, K. Koumoto, J. Appl. Phys. 97 (2005) 034106.
[17] D. Neagu, J.T.S. Irvine, Chem. Mater. 22 (2010) 5042.
[18] S.Q. Hui, A. Petric, J. Eur. Ceram. Soc. 22 (2002) 1673.
[19] K. Kuroda, W. Sugimoto, M. Shirata, M. Takemoto, S. Hayami, Y. Sugahara,
Solid State Ionics 108 (1998) 315.
[20] J.N. Yun, Z.Y. Zhang, J.F. Yan, W. Zhao, J. Appl. Phys. 107 (2010).

116
CHAPTER 6
RATIONAL DESIGN OF MIXED IONIC AND ELECTRONIC CONDUCTING
PEROVSKITE OXIDES FOR SOLID OXIDE FUEL CELL ANODE MATERIALS:
A CASE STUDY FOR DOPED STRONTIUM TITANATES
6.1 Summary
The effect of p- and n-type dopants on ionic and electronic conductivity of SrTiO3
based perovskites were investigated both computationally and experimentally.
Specifically, we performed density functional theory (DFT) calculations of Na- and La-
doped SrTiO3 and Na- and Nb-doped SrTiO3 systems. Constrained ab initio
thermodynamic calculations were used to evaluate the phase stability and reducibility of
doped SrTiO3 under both oxidizing and reducing synthesis conditions, as well as under
anodic solid oxide fuel cell (SOFC) conditions. The density of states (DOS) of these
materials was analyzed to study the effects of p- and n-doping on the electronic
conductivity. Furthermore, Na- and La-doped SrTiO3 and Na- and Nb-doped SrTiO3
samples were experimentally prepared and the conductivity was measured to confirm our
computational predictions. The experimental observations are in very good agreement
with the theoretical predictions that doping n-doped SrTiO3 with small amounts of p-type
dopants promotes both the ionic and electronic conductivity of the material. This doping

117
strategy is valid independent of p- and n-doping site and permits the synthesis of
perovskite based mixed ionic/electronic conductors.
6.2 Introduction
Since the Ni metal in Ni-based electrodes is the component that exhibits
instability and low tolerance to sulfur impurities and coking, it has been suggested to
remove the Ni metal and use only ceramic components for electron transport and fuel
oxidation [1]. Furthermore, to maximize the electrochemically active surface area for fuel
oxidation, the anode electrode should consist of only mixed ionic/electronic conducting
materials. Among the ceramic anode materials, perovskite based oxides (ABO3) are of
great interest because they can accommodate various dopants and incorporate cations
with multiple oxidation states, which permits tuning the electro-catalytic activity and
provides a mechanism for tailoring electronic and ionic conductivity [2]. In addition,
perovskite oxides have been shown to satisfy most intrinsic SOFC anode requirements
such as high thermodynamic stability under anodic conditions [3-9] and strong resistance
to carbon deposition [3, 10-12] and sulfur poisoning [13-15].
In Chapter 4 and 5, we have shown that a mixed p- and n-doping approach can be
used to improve mixed ionic/electronic conductivity in perovskite oxides. This doping
strategy is efficient when doping with p-type dopants at the B-site and n-type dopants at
either the A- or B-site of SrTiO3 perovskites [16, 17]. In this Chapter, we used
computational and experimental tools to we illustrate that mixed p- and n-doping is
indeed an efficient strategy independent of doping site in the SrTiO3 perovskite structure.
In particular, we performed constrained ab initio thermodynamic calculations to evaluate
the thermodynamic stability of Na- and La-doped SrTiO3 and Na- and Nb-doped SrTiO3

118
phases at synthesized under oxidizing and under reducing anodic SOFC conditions. We
analyzed the electronic structure of the resulting materials and compared the results to
our previous study of Ga- and La-doped SrTiO3 and Ga- and Nb-doped SrTiO3. Finally,
we synthesized several compositions of Na- and La-doped SrTiO3 and Na- and Nb-doped
SrTiO3 perovskites and measured their conductivities to confirm our computational
predictions.
6.3 Methods
6.3.1 Computational approach
To investigate the bulk electronic properties of stoichiometric and doped SrTiO3,
we initially optimized the lattice parameter of the SrTiO3 unit cell and created a 100 atom
supercell containing twenty unit cells (5×2×2). Doped structures were generated by
substituting A- or B-site cations with various amount of n-type (La, Nb) and p-type (Na)
dopants. Substitution of two Ti atoms with two dopants yields 10% B-site doped SrTiO3,
etc. In order to better understand the charge compensation mechanism in the p- and n-
doped systems, both A-site deficient and reduced structures were created by generating
Sr vacancies and oxygen vacancies, respectively. In this study, we considered up to two
Sr vacancies and three oxygen vacancies in each structure. The reoptimized lattice
parameters of the 20% La-doped SrTiO3 and 20% Nb-doped SrTiO3 were employed for
all La-doped and Nb-doped structures, respectively. We tried all meaningful
configurations (over one hundred configurations were tested in this study) to identify the
lowest energy structures.
Spin-polarized density functional theory was employed in this study using the
projector-augmented wave approach [18] with Perdew-Burke-Ernzerhof (PBE) functional

119
[19]. All calculations were performed with the VASP 5.2 code [18, 20]. We use a kinetic
energy cutoff of 400 eV for the planewave basis and a 2×5×5 Monkhorst-Pack k-point
mesh for Brillouin zone integration [21]. For density of state (DOS) calculations we used
a 4×10×10 k-mesh. In all structure optimizations, all atoms are fully relaxed until the
Hellman-Feynman forces are less than 0.02 eV Å-1
.
6.3.2 Experimental approach
Sr1-xNaxTi0.8Nb0.2O3 (x = 0, 0.05, 0.10, 0.20) and Sr0.8-xNaxLa0.2TiO3 (x = 0, 0.10,
0.20) powders were synthesized by standard solid state reactions. The starting materials
include SrCO3 (99%), TiO2 (99.9%), Nb2O5 (99.9%, for Nb-doped samples), La2O3 (99%,
for La-doped samples), and Na2CO3 (99%). The chemical constituents were carefully
weighed according to the stoichiometry and mixed in a mortar. The mixed powder was
calcined at 900 C for 6 h in air. The powder was then ground, pressed into pellets and
calcined at 1250 C in air for 20 h. This step was repeated to improve the phase purity.
The obtained powder was finally pressed into bar samples and sintered in 5% H2/N2 at
1400 C for 10 h.
All samples were characterized by powder X-ray diffraction using a D/MAX-3C
X-ray diffractometer with graphite-monochromatized Cu Kα radiation in the 2 range of
20-80. Resistance of all bar samples with dimension of 35×5×1 mm3 was recorded using
a multimeter (Keithley model 2001 7-1/2 DDM) in a standard four probe configuration in
H2 with a flow rate of 80 mL/min. The samples were held at each temperature for 1 h
before the data was collected.
120
6.4 Results and Discussion
Previous theoretical studies performed by us [16, 17] suggest that independent of
n-doping site, mixed ionic/electronic conductivity of perovskites can be obtained when
using a mixed p- and n-doping approach that uses a p-dopant concentration smaller than
the n-dopant concentration. In this work, we aim to further prove that this doping strategy
can be employed independent of p-doping site. Therefore, we performed DFT
calculations of Na- and La-doped SrTiO3 and Na- and Nb-doped SrTiO3. We used the
same computational procedure as in our previous studies which permits us to
systematically investigate the effects of doping site on the electronic conductivity and
reducibility of the resulting structures at synthesized and anodic SOFC conditions. To a
first approximation, we expect the electron mobility to remain constant when changing n-
type dopants in doped SrTiO3 since the difference in electron mobility between Nb- and
La-doped SrTiO3 is insignificant [22].
We first investigated the relative thermodynamic stability of all doped structures
in each system using constrained ab initio thermodynamic simulations. The phase
diagrams were constructed by calculating the free energy of different systems as a
function of oxygen chemical potential, i.e., temperature and oxygen partial pressure. We
neglect entropic contributions from the solids to the free energy differences and note that
a reasonable estimate of the error in the calculated phase diagram is 0.2 eV considering
that phonon contributions and configurational entropy likely only change on the order of
0.1 to 0.2 eV [23-25]. The reaction energies of the most dominant structures in the phase
diagrams are summarized in Table 6.1. Next, the DOS related to the most dominant

121
structures in the phase diagram were evaluated and analyzed with respect to relative
electronic conductivity.
Table 6.1 Summary of reaction energies used in constrained ab initio thermodynamic
calculations.
Phase diagram Reaction ∆E (eV)
10% Na and 20% Nb-doped SrTiO3 with
SrO rich second phase
Sr18Na2Ti16Nb4O60 + 1/2O2 Sr17Na2Ti16Nb4O60 + SrO -2.08
Sr18Na2Ti16Nb4O60 Sr18Na2Ti16Nb4O59 + 1/2O2 4.84
Sr18Na2Ti16Nb4O60 Sr18Na2Ti16Nb4O58 + O2 10.00
Sr18Na2Ti16Nb4O60 Sr18Na2Ti16Nb4O57 + 3/2O2 15.36
10% Na and 20% Nb-doped SrTiO3 with
TiO2/Na2O/Nb2O5 rich second phases
17Sr16Na2Ti16Nb4O60 16Sr17Na2Ti16Nb4O60 + 16TiO2 + 2Nb2O5 + Na2O + 17/2O2
-1.53
9Sr16Na2Ti16Nb4O60 8Sr18Na2Ti16Nb4O60 + 16TiO2 + 2Nb2O5 + Na2O + 17/2O2
1.51
9Sr16Na2Ti16Nb4O60 8Sr18Na2Ti16Nb4O59 + 16TiO2 + 2Nb2O5 + Na2O + 25/2O2
5.81
9Sr16Na2Ti16Nb4O60 8Sr18Na2Ti16Nb4O58 + 16TiO2 + 2Nb2O5 + Na2O + 33/2O2
10.40
9Sr16Na2Ti16Nb4O60 8Sr18Na2Ti16Nb4O57 + 16TiO2 + 2Nb2O5 + Na2O + 41/2O2
15.17
20% Na and 20% Nb-doped SrTiO3
Sr16Na4Ti16Nb4O60 Sr16Na4Ti16Nb4O59 + 1/2O2 4.06
Sr16Na4Ti16Nb4O60 Sr16Na4Ti16Nb4O58 + O2 9.07
Sr16Na4Ti16Nb4O60 Sr16Na4Ti16Nb4O57 + 3/2O2 14.26
10% Na and 20% La-doped SrTiO3 with
SrO rich second phase
Sr14La4Na2Ti20O60 + 1/2O2 Sr13La4Na2Ti20O60 + SrO -1.46
Sr14La4Na2Ti20O60 Sr14La4Na2Ti20O58 + O2 10.03
Sr14La4Na2Ti20O60 Sr14La4Na2Ti20O57 + 3/2O2 15.39
10% Na and 20% La-doped SrTiO3 with
TiO2/Na2O/La2O3 rich second phases
13Sr12La4Na2Ti20O60 12Sr13La4Na2Ti20O60 + 20TiO2 + 2La2O3 + Na2O + 13/2O2
0.57
7Sr12La4Na2Ti20O60 6Sr14La4Na2Ti20O60 + 20TiO2 + 2La2O3 + Na2O + 13/2O2
4.68
7Sr12La4Na2Ti20O60 6Sr14La4Na2Ti20O58 + 20TiO2 + 2La2O3 + Na2O + 25/2O2
13.46
7Sr12La4Na2Ti20O60 6Sr14La4Na2Ti20O57 + 20TiO2 + 2La2O3 + Na2O + 31/2O2
18.15
20% Na and 20% La-doped SrTiO3
Sr12La4Na4Ti20O60Sr12La4Na4Ti20O59 + 1/2O2 4.46
Sr12La4Na4Ti20O60 Sr12La4Na4Ti20O58 + O2 9.43
Sr12La4Na4Ti20O60 Sr12La4Na4Ti20O57 + 3/2O2 14.54
122
6.4.1 Electronic structures and phase diagrams of 10% Na- and 20% La-doped
SrTiO3.
To obtain a model of 10% Na- and 20% La-doped SrTiO3, we first replaced four
Sr atoms with four La atoms in the 5×2×2 supercell to create a structure of 20% La-
doped SrTiO3. Next, we substituted another two Sr atoms with two Na atoms to generate
a 10% Na- and 20% La-doped SrTiO3 model. Furthermore, we removed one or two Sr
atoms to create partial (5%) A-site deficient and full (10%) A-site deficient model
structures, respectively. From the configuration of the most stable structures, we conclude
that there is no long-range site preference for any Sr cation substitution with La or Na
atoms since the energy differences of the most stable structures are insignificant (lower
than 2 meV/atom). Only in the Sr-deficient structures do La atoms prefer to be close to Sr
vacancies since the charge of the La dopants can be compensated by the presence of Sr
vacancies. In an environment of low oxygen chemical potential (anodic SOFC
conditions), the materials are reduced and oxygen vacancies start to form. We find that
under these reducing conditions there is a tendency for oxygen vacancies to cluster close
to nearby Na atoms. The extra electrons from the oxygen vacancies can be partially
compensated by the holes created by the Na atoms in the structure. The configurations of
all most stable structures are shown in Fig. 6.1
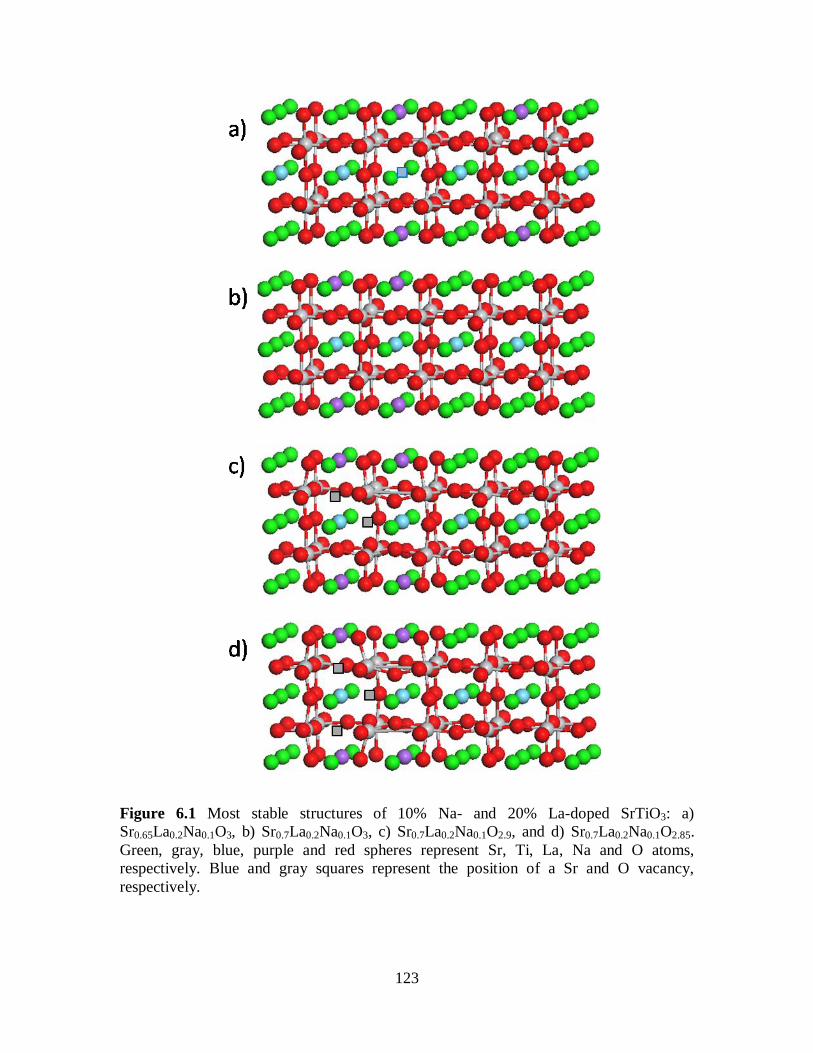
123
Figure 6.1 Most stable structures of 10% Na- and 20% La-doped SrTiO3: a)
Sr0.65La0.2Na0.1O3, b) Sr0.7La0.2Na0.1O3, c) Sr0.7La0.2Na0.1O2.9, and d) Sr0.7La0.2Na0.1O2.85.
Green, gray, blue, purple and red spheres represent Sr, Ti, La, Na and O atoms,
respectively. Blue and gray squares represent the position of a Sr and O vacancy,
respectively.
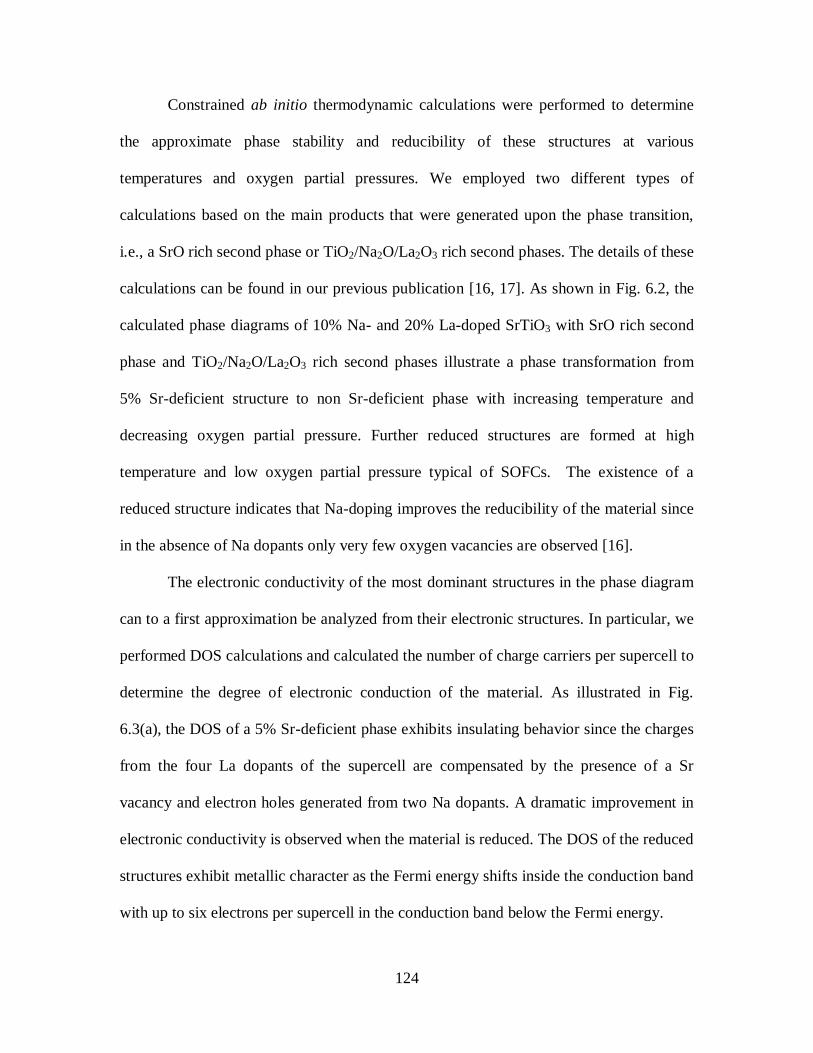
124
Constrained ab initio thermodynamic calculations were performed to determine
the approximate phase stability and reducibility of these structures at various
temperatures and oxygen partial pressures. We employed two different types of
calculations based on the main products that were generated upon the phase transition,
i.e., a SrO rich second phase or TiO2/Na2O/La2O3 rich second phases. The details of these
calculations can be found in our previous publication [16, 17]. As shown in Fig. 6.2, the
calculated phase diagrams of 10% Na- and 20% La-doped SrTiO3 with SrO rich second
phase and TiO2/Na2O/La2O3 rich second phases illustrate a phase transformation from
5% Sr-deficient structure to non Sr-deficient phase with increasing temperature and
decreasing oxygen partial pressure. Further reduced structures are formed at high
temperature and low oxygen partial pressure typical of SOFCs. The existence of a
reduced structure indicates that Na-doping improves the reducibility of the material since
in the absence of Na dopants only very few oxygen vacancies are observed [16].
The electronic conductivity of the most dominant structures in the phase diagram
can to a first approximation be analyzed from their electronic structures. In particular, we
performed DOS calculations and calculated the number of charge carriers per supercell to
determine the degree of electronic conduction of the material. As illustrated in Fig.
6.3(a), the DOS of a 5% Sr-deficient phase exhibits insulating behavior since the charges
from the four La dopants of the supercell are compensated by the presence of a Sr
vacancy and electron holes generated from two Na dopants. A dramatic improvement in
electronic conductivity is observed when the material is reduced. The DOS of the reduced
structures exhibit metallic character as the Fermi energy shifts inside the conduction band
with up to six electrons per supercell in the conduction band below the Fermi energy.

125
Figure 6.2 Calculated phase diagram of 10% Na- and 20% La-doped SrTiO3 with a) SrO
rich phase and b) TiO2/La2O3/Na2O rich phases. Differently shaded areas mark the
stability region of various structures for a given temperature and partial pressure of
oxygen. The hatched areas describe possible changes in the phase diagram if computed
reaction energies shown in Table 6.1 are off by ±0.2 eV (estimated error bar). Dark blue,
green, yellow and red areas symbolize the stability of Sr0.65La0.2Na0.1TiO3,
Sr0.7La0.2Na0.1TiO3, Sr0.7La0.2Na0.1TiO2.9, and Sr0.7La0.2Na0.1TiO2.85, respectively.

126
Furthermore, partial density of states (PDOS) analyses were performed to
evaluate the behavior of the electrons below the Fermi level in the conduction band and
in the gap state. As reported in our previous studies, electrons in the gap state are mostly
localized around the oxygen vacancies and thus do not contribute to the electronic
conductivity of the material [16, 17]. More interestingly, we observe that not all electrons
below the Fermi energy in the conduction band are conductive. Figure 6.4 depicts the
PDOS and their respective charge densities obtained from band decomposition charge
density calculations of Sr0.7La0.2Na0.1TiO2.9. It can be seen that the electrons act
differently in the two different energy regions. In the lower energy range (-0.3 to -0.2
eV), the electrons are mostly localized around oxygen vacancies and surrounded atoms
whereas the electrons in the higher energy range (-0.2 to 0 eV) are delocalized throughout
the Ti atoms in the lattice. These localized electrons in the low energy region do not
contribute to the electronic conductivity of the material and therefore, we do not take
these electrons into account when we calculate the number of charge carriers. Hence, the
exact number of charge carriers can be calculated by considering only the states on the Ti
atoms and the calculated number of charge carriers for the Sr0.7La0.2Na0.1TiO2.9 and
Sr0.7La0.2Na0.1TiO2.85 structures are 4.03 and 4.35, respectively. The calculated number of
charge carriers for all p- and n-doped SrTiO3 structures considered in this work are
summarized in Table 6.2.
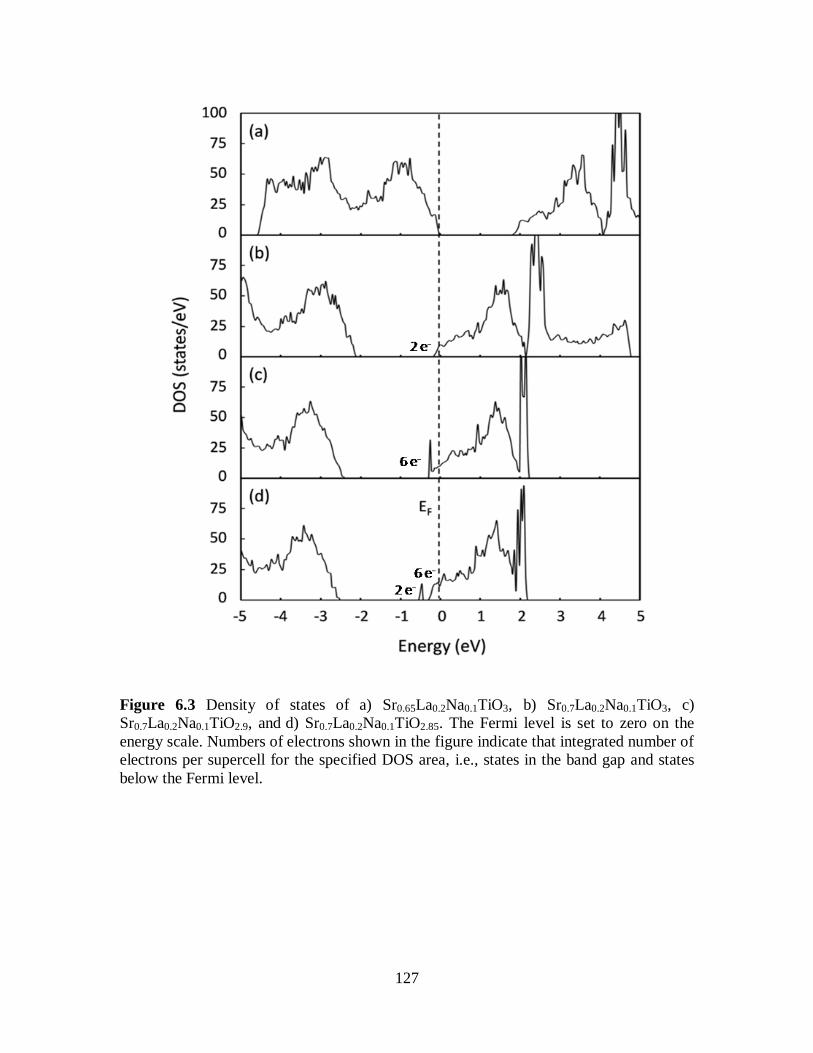
127
Figure 6.3 Density of states of a) Sr0.65La0.2Na0.1TiO3, b) Sr0.7La0.2Na0.1TiO3, c)
Sr0.7La0.2Na0.1TiO2.9, and d) Sr0.7La0.2Na0.1TiO2.85. The Fermi level is set to zero on the
energy scale. Numbers of electrons shown in the figure indicate that integrated number of
electrons per supercell for the specified DOS area, i.e., states in the band gap and states
below the Fermi level.

128
Figure 6.4 Partial density of states of Sr0.7La0.2Na0.1TiO2.9 below the Fermi level in the
conduction band. The left inset illustrates the charge density of the localized states which
are located at the oxygen vacancy (energy ranges between -0.3 and -0.2 eV). The right
inset describes the charge density of delocalized states from mixed-valent Ti3+
/Ti4+
found
in the energy range between -0.2 to 0 eV.
6.4.2 Electronic structures and phase diagrams of 20% Na- and 20% La-doped
SrTiO3.
Substitution of four Sr atoms with four Na atoms in 20% La-doped structures
leads to 20% Na- and 20% La-doped SrTiO3. The presence of Sr and oxygen vacancies in
the structure was investigated in a similar manner as described above. The most dominant
structures display a random configuration of La and Na atoms since the energy difference
of the lowest energy structures is insignificant (lower than 2 meV/atom). On the other
hand, the most stable reduced structures have oxygen vacancies surrounded by the four
Na atoms of the supercell (see supporting information for structures). Such preferred
configurations confirm that the charge compensation mechanism plays an essential role

129
in the arrangement of impurities in the structure. The structures found most stable of 20%
Na- and 20% La-doped SrTiO3 are illustrated in Fig. 6.5
Figure 6.5 Most stable structures of 20% Na- and 20% La-doped SrTiO3: a)
Sr0.6La0.2Na0.2TiO3, b) Sr0.6La0.2Na0.2TiO2.95, c) Sr0.6La0.2Na0.2TiO2.9, and d)
Sr0.6La0.2Na0.2TiO2.85. Green, gray, blue, purple, and red spheres represent Sr, Ti, La, Na,
and O atoms, respectively. A gray square represents the position of an O vacancy.

130
Table 6.2 Summary of integrated number of electrons below the Fermi level in the
conduction band computed from partial density of states (PDOS) of various p- and n-
doped SrTiO3 structures. Mobile charge carriers are assumed to originate only from Ti
and Nb.
Structure
Integrated number of electrons below Fermi level in conduction band (#/supercell)
Number of mobile charge carriers
(#/supercell) Sr Ti O Nb/La Ga/Na
20% Nb-doped SrTiO3 0.17 2.62 0.15 0.48 - 3.10
10% Ga- and 20% Nb-doped SrTiO3
SrTi0.7Nb0.2Ga0.1O2.95 0.14 2.56 0.18 0.51 0.00 3.08
SrTi0.7Nb0.2Ga0.1O2.90 0.16 2.59 0.18 0.55 0.00 3.14
SrTi0.7Nb0.2Ga0.1O2.85 0.16 2.61 0.18 0.54 0.00 3.14
20% Ga- and 20% Nb-doped SrTiO3
SrTi0.6Nb0.2Ga0.2O2.95 0.08 1.24 0.13 0.25 0.00 1.50
SrTi0.6Nb0.2Ga0.2O2.90 0.09 1.26 0.13 0.24 0.00 1.49
SrTi0.6Nb0.2Ga0.2O2.85 0.09 1.26 0.13 0.23 0.00 1.50
10% Na- and 20% Nb-doped SrTiO3
Sr0.9Na0.1Ti0.8Nb0.2O2.95 0.14 2.69 0.19 0.68 0.00 3.37
Sr0.9Na0.1Ti0.8Nb0.2O2.90 0.15 2.69 0.19 0.68 0.00 3.38
Sr0.9Na0.1Ti0.8Nb0.2O2.85 0.37 3.56 0.32 0.71 0.00 4.27
20% Na- and 20% Nb-doped SrTiO3
Sr0.8Na0.2Ti0.8Nb0.2O2.95 0.07 1.26 0.07 0.30 0.00 1.56
Sr0.8Na0.2Ti0.8Nb0.2O2.90 0.13 2.56 0.17 0.55 0.00 3.10
Sr0.8Na0.2Ti0.8Nb0.2O2.85 0.13 2.56 0.17 0.54 0.00 3.11
20% La-doped SrTiO3 0.14 3.15 0.14 0.02 - 3.15
10% Ga- and 20% La-doped SrTiO3
Sr0.8La0.2Ti0.9Ga0.1O2.90 0.13 3.14 0.17 0.02 0.00 3.14
Sr0.8La0.2Ti0.9Ga0.1O2.85 0.13 3.15 0.16 0.02 0.00 3.15
20% Ga- and 20% La-doped SrTiO3
Sr0.8La0.2Ti0.8Ga0.2O2.90 0.06 1.81 0.10 0.01 0.00 1.81
Sr0.8La0.2Ti0.8Ga0.2O2.85 0.23 1.84 0.54 0.04 0.37 1.84
10% Na- and 20% La-doped SrTiO3
Sr0.7La0.2Na0.1TiO2.90 0.28 4.03 0.33 0.07 0.00 4.03
Sr0.7La0.2Na0.1TiO2.85 0.21 4.35 0.29 0.05 0.00 4.35
20% Na- and 20% La-doped SrTiO3
Sr0.6La0.2Na0.2TiO2.95 0.05 1.61 0.07 0.01 0.00 1.61
Sr0.6La0.2Na0.2TiO2.90 0.09 2.90 0.20 0.03 0.00 2.90
Sr0.6La0.2Na0.2TiO2.85 0.11 3.00 0.18 0.03 0.00 3.00
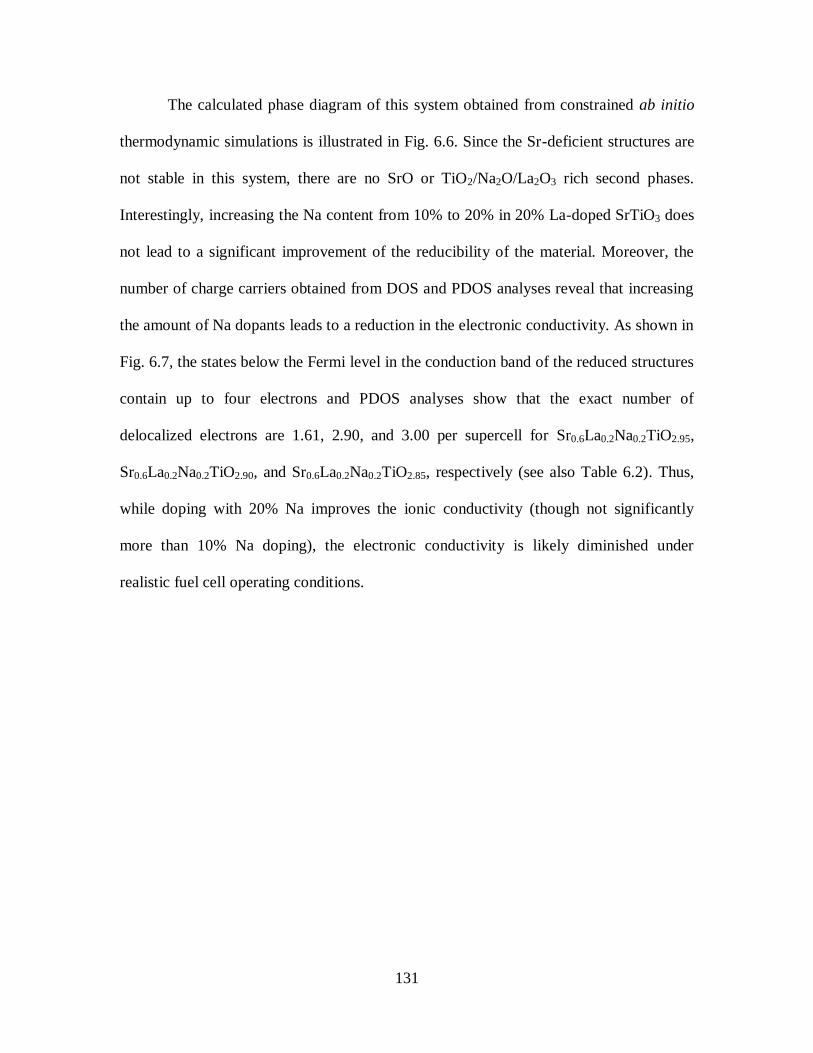
131
The calculated phase diagram of this system obtained from constrained ab initio
thermodynamic simulations is illustrated in Fig. 6.6. Since the Sr-deficient structures are
not stable in this system, there are no SrO or TiO2/Na2O/La2O3 rich second phases.
Interestingly, increasing the Na content from 10% to 20% in 20% La-doped SrTiO3 does
not lead to a significant improvement of the reducibility of the material. Moreover, the
number of charge carriers obtained from DOS and PDOS analyses reveal that increasing
the amount of Na dopants leads to a reduction in the electronic conductivity. As shown in
Fig. 6.7, the states below the Fermi level in the conduction band of the reduced structures
contain up to four electrons and PDOS analyses show that the exact number of
delocalized electrons are 1.61, 2.90, and 3.00 per supercell for Sr0.6La0.2Na0.2TiO2.95,
Sr0.6La0.2Na0.2TiO2.90, and Sr0.6La0.2Na0.2TiO2.85, respectively (see also Table 6.2). Thus,
while doping with 20% Na improves the ionic conductivity (though not significantly
more than 10% Na doping), the electronic conductivity is likely diminished under
realistic fuel cell operating conditions.

132
Figure 6.6 Calculated phase diagram of 20% Na- and 20% La-doped SrTiO3. Differently
shaded areas mark the stability region of various structures for a given temperature and
partial pressure of oxygen. The hatched areas describe possible changes in the phase
diagram if computed reaction energies shown in Table 6.1 are off by ±0.2 eV (estimated
error bar). Dark blue, green, yellow, and red areas symbolize the stability of
Sr0.6La0.2Na0.2TiO3, Sr0.6La0.2Na0.2TiO2.95, Sr0.6La0.2Na0.2TiO2.9, and Sr0.6La0.2Na0.2TiO2.85,
respectively.

133
Figure 6.7 Density of states of a) Sr0.6La0.2Na0.2TiO3, b) Sr0.6La0.2Na0.2TiO2.95, c)
Sr0.6La0.2Na0.2TiO2.9, and d) Sr0.6La0.2Na0.2TiO2.85. The Fermi level is set to zero on the
energy scale. Numbers of electrons shown in the figure indicate the integrated number of
electrons per supercell for the specified DOS area, i.e., states in the band gap and states
below the Fermi level.
6.4.3 Electronic structures and phase diagrams of 10% Na- and 20% Nb-
doped SrTiO3.
In this set of calculations, we first created a 20% Nb-doped SrTiO3 structure by
replacing four Ti atoms with four Nb atoms in the 5×2×2 supercell. Next, we substituted
two Sr atoms with two Na atoms in the 20% Nb-doped SrTiO3 structure to obtain a model

134
of 10% Na- and 20% Nb-doped SrTiO3. To study the cation vacancy compensation
mechanism, we created up to two Sr vacancies in the lattice to obtain Sr-deficient
structures as described previously. As shown in Fig. 6.8, the most stable structures reveal
that Nb and Na impurities prefer to be in close proximity since the extra electron from the
Nb dopants can be compensated by the electron holes generated from the Na dopants.
This preferred configuration is also observed in the presence of Sr vacancies. Up to three
oxygen vacancies were generated in the structure to study the effect of a reducing
environment typical of anodic SOFC conditions. The most stable first vacancy is created
by removing an oxygen atom from a Ti-O-Ti bridge close to Na dopants whereas the
second oxygen vacancy is positioned next to the same Ti atom. Upon removal of the third
oxygen, a row of oxygen vacancies is formed along the TiO6 octahedra framework.
Figure 6.9 displays the calculated phase diagrams of 10% Na- and 20% Nb-doped
SrTiO3 under synthesized and anodic SOFC conditions leading to the formation of a SrO
rich second phase (Fig. 7(a)) and TiO2/Nb2O5/NaO rich second phases (Fig 7(b)). It can
be seen from the phase diagrams that the phase transitions of this system are very similar
to those of the 10% Na- and 20% La-doped system, i.e., the presence of 5% Sr-deficient,
non Sr-deficient, and reduced phases of both systems occur at approximately the same
temperature and oxygen partial pressure. Again, the presence of the reduced phases in
this system confirms that Na facilitates oxide ion conduction as the reducibility of the
material has been improved. The electronic structures of the reduced phases exhibit up to
six electrons per supercell below the Fermi energy in the conduction band. As shown in
Fig. 6.10, the DOS of 10% Na- and 20% Nb-doped SrTiO3 reveal that the electronic
conductivity is remarkably improved when the material is reduced under anodic SOFC
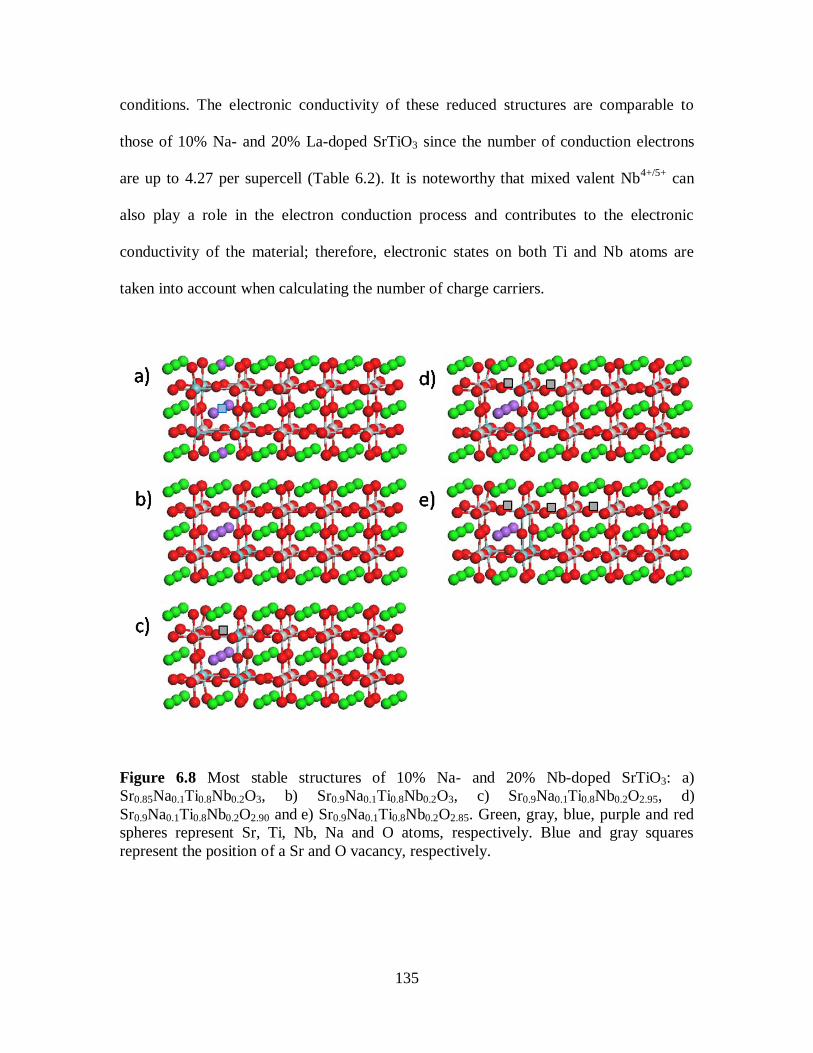
135
conditions. The electronic conductivity of these reduced structures are comparable to
those of 10% Na- and 20% La-doped SrTiO3 since the number of conduction electrons
are up to 4.27 per supercell (Table 6.2). It is noteworthy that mixed valent Nb4+/5+
can
also play a role in the electron conduction process and contributes to the electronic
conductivity of the material; therefore, electronic states on both Ti and Nb atoms are
taken into account when calculating the number of charge carriers.
Figure 6.8 Most stable structures of 10% Na- and 20% Nb-doped SrTiO3: a)
Sr0.85Na0.1Ti0.8Nb0.2O3, b) Sr0.9Na0.1Ti0.8Nb0.2O3, c) Sr0.9Na0.1Ti0.8Nb0.2O2.95, d)
Sr0.9Na0.1Ti0.8Nb0.2O2.90 and e) Sr0.9Na0.1Ti0.8Nb0.2O2.85. Green, gray, blue, purple and red
spheres represent Sr, Ti, Nb, Na and O atoms, respectively. Blue and gray squares
represent the position of a Sr and O vacancy, respectively.
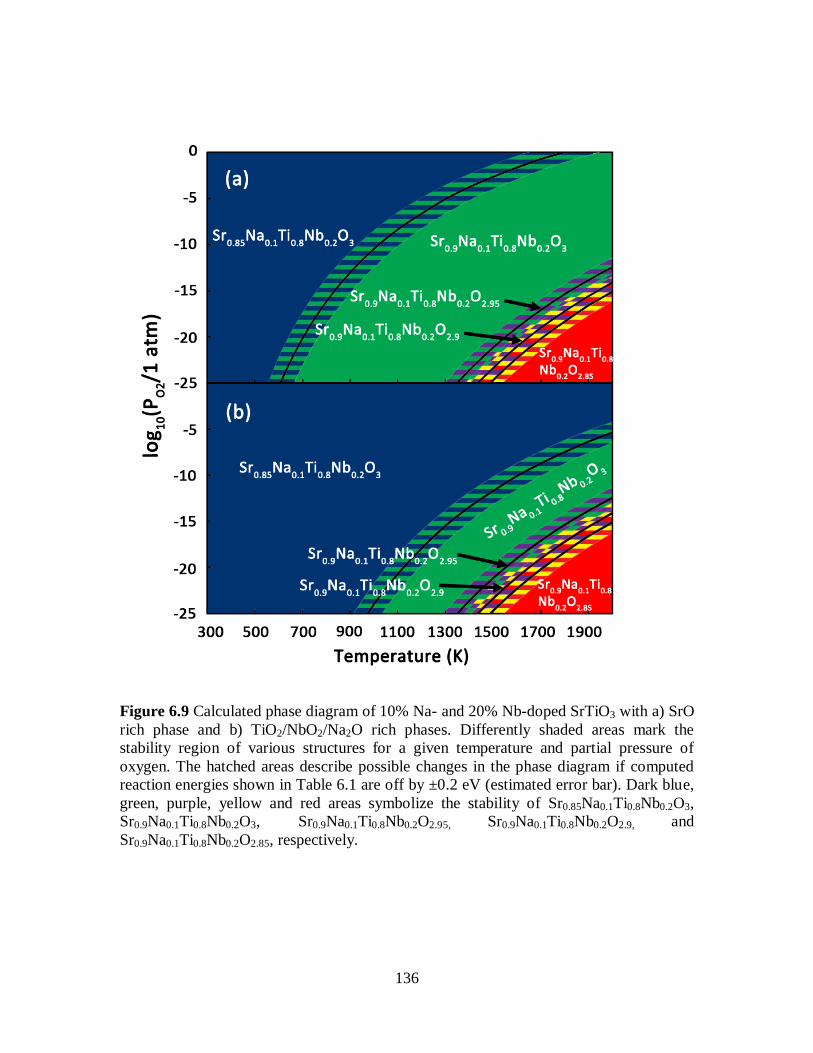
136
Figure 6.9 Calculated phase diagram of 10% Na- and 20% Nb-doped SrTiO3 with a) SrO
rich phase and b) TiO2/NbO2/Na2O rich phases. Differently shaded areas mark the
stability region of various structures for a given temperature and partial pressure of
oxygen. The hatched areas describe possible changes in the phase diagram if computed
reaction energies shown in Table 6.1 are off by ±0.2 eV (estimated error bar). Dark blue,
green, purple, yellow and red areas symbolize the stability of Sr0.85Na0.1Ti0.8Nb0.2O3,
Sr0.9Na0.1Ti0.8Nb0.2O3, Sr0.9Na0.1Ti0.8Nb0.2O2.95, Sr0.9Na0.1Ti0.8Nb0.2O2.9, and
Sr0.9Na0.1Ti0.8Nb0.2O2.85, respectively.

137
Figure 6.10 Density of states of a) Sr0.85Na0.1Ti0.8Nb0.2O3, b) Sr0.9Na0.1Ti0.8Nb0.2O3, c)
Sr0.9Na0.1Ti0.8Nb0.2O2.95, d) Sr0.9Na0.1Ti0.8Nb0.2O2.90 and e) Sr0.9Na0.1Ti0.8Nb0.2O2.85. The
Fermi level is set to zero on the energy scale. Numbers of electrons shown in the figure
indicate the integrated number of electrons per supercell for the specified DOS area, i.e.,
states in the band gap and states below the Fermi level.

138
6.4.4 Electronic structures and phase diagrams of 20% Na- and 20% Nb-doped
SrTiO3.
Substitution of four Sr atoms with four Na atoms in the 20% Nb-doped SrTiO3
structure yields a model of 20% Na- and 20% Nb-doped SrTiO3. Sr-deficient and reduced
structures were created to investigate the charge compensation mechanism in the
presence of Sr vacancies and oxygen vacancies. The most stable structures (Fig. 6.11) in
this set of calculations have Na atoms close to Nb atoms. Again, it is preferable to create
the first and second oxygen vacancies at the Ti-O-Ti bridge where two oxygen vacancies
share the same Ti atom forming a TiO4 unit, whereas the third oxygen vacancy is
positioned at another Ti-O-Ti bridge nearby generating a TiO5 unit. These three oxygen
vacancies are close to the Na atoms, which confirms that electrons from oxygen
vacancies are partially compensated by holes generated from the Na dopants.
Figure 6.12 illustrates the phase diagram for 20% Na- and 20% Nb-doped SrTiO3
as a function of temperature and oxygen partial pressure. Unlike Na- and La-doped
SrTiO3, increasing the Na concentration in this system does improve the reducibility of
the material. As seen in the phase diagram, at an oxygen partial pressure of 10-20
atm the
reduced phases of 20% Na- and 20% Nb-doped SrTiO3 start to develop 200 K below
when those are formed for the 10% Na-doped system. However, adding too much Na
results in a decreasing electronic conductivity. The DOS of the reduced structures of this
system (Fig. 6.13) exhibit states below the Fermi level in the conduction band that
contain up to four electrons per supercell. Nevertheless, PDOS calculations show that the
degree of electronic conductivity of this system is generally lower than that of the 10%

139
Na-doped system (Table 6.2). The concentration of conduction electrons in the lattice is
reduced by the large amounts of electron holes from the Na dopants.
Figure 6.11 Most stable structures of 20% Na- and 20% Nb-doped SrTiO3: a)
Sr0.8Na0.2Ti0.8Nb0.2O3, b) Sr0.8Na0.2Ti0.8Nb0.2O2.95, c) Sr0.8Na0.2Ti0.8Nb0.2O2.9, and d)
Sr0.8Na0.2Ti0.8Nb0.2O2.85. Green, gray, blue, purple and red spheres represent Sr, Ti, Nb,
Na and O atoms, respectively. A gray square represent the position of an O vacancy.

140
Figure 6.12 Calculated phase diagram of 20% Na- and 20% Nb-doped SrTiO3.
Differently shaded areas mark the stability region of various structures for a given
temperature and partial pressure of oxygen. The hatched areas describe possible changes
in the phase diagram if computed reaction energies shown in Table 6.1 are off by ±0.2 eV
(estimated error bar). Dark blue, green, yellow, and red areas symbolize the stability of
Sr0.8Na0.2Ti0.8Nb0.2O3, Sr0.8Na0.2Ti0.8Nb0.2O2.95, Sr0.8Na0.2Ti0.8Nb0.2O2.9, and
Sr0.8Na0.2Ti0.8Nb0.2O2.85, respectively.
6.4.5 Experimental verification of computational predictions
To study the effect of p-doping on the mixed ionic/electronic conductivity and to
confirm our computational predictions, Na- and Nb-doped SrTiO3 and Na- and La-doped
SrTiO3 samples were prepared at 1250 oC in air and reduced in 5% H2/N2 at 1400
oC.
Powder X-ray diffraction (PXRD) patterns of Sr1-xNaxTi0.8Nb0.2O3 (where x = 0, 0.05,
0.10, 0.20) and Sr0.8-xNaxLa0.2Ti0.8Nb0.2O3 (where x = 0, 0.10, 0.20) calcined under
oxidizing conditions are depicted in Fig. 6.14(a) and 6.14(b), respectively. The presence
of impurity peaks for all samples other than Sr0.8Na0.2Ti0.8Nb0.2O3 indicates that due to a
lack of charge compensation, these compositions cannot form under oxidizing conditions

141
where titanium and niobium are in their highest oxidation states. Since the extra charges
from the n-type dopants (Nb or La) cannot be electronically compensated under oxidizing
Figure 6.13 Density of states of a) Sr0.8Na0.2Ti0.8Nb0.2O3, b) Sr0.8Na0.2Ti0.8Nb0.2O2.95, c)
Sr0.8Na0.2Ti0.8Nb0.2O2.9, and d) Sr0.8Na0.2Ti0.8Nb0.2O2.85. The Fermi level is set to zero on
the energy scale. Numbers of electrons shown in the figure indicate the integrated number
of electrons per supercell for the specified DOS area, i.e., states below the Fermi level.
conditions, these extra electrons are instead neutralized by creating Sr vacancies in the
lattice (cation vacancy compensation), which creates Sr rich impurity phases. The main
impurity phase in Fig. 6.14(a) can be attributed to Sr5Nb4O15 (JCPDS file no. 48-0421).

142
In La-doped SrTiO3, it has been reported that under oxidizing conditions the extra oxygen
can be accommodated by La2Ti2O7-type layers. No cation vacancy is required in this
mechanism. At low doping concentrations, for example 20% in our work, the impurity
peaks in XRD are less evident [26]. Increasing the concentration of Na (p-type) dopants
leads eventually to charge compensation and stable phases since now the extra electrons
from the n-type dopants are compensated by electron holes generated from the Na
dopants. In agreement with this observation, it has been reported that p-type doping
significantly promotes oxygen loss from the structure and enhances oxygen diffusion in
the materials [27, 28]. These experimental findings are in an excellent agreement with
our theoretical predictions, suggesting that p-doping (Na or Ga) improves the reducibility
of the materials [28].
To perform conductivity measurements, all samples were pressed into bar
samples and sintered in reducing atmosphere at 1400 oC. The conductivities of the doped
SrTiO3 samples were then measured under reducing conditions. We find that p-type
doping allows not only for the formation of a stable, reduced phase, but also enhances the
electrical conductivity of the samples. Figure 6.15 illustrates the electrical conductivity of
Na- and Nb-doped SrTiO3 as a function of Na concentration at different temperatures. In
a reducing atmosphere at high temperatures, Na- and Nb-doped SrTiO3 samples exhibit
metallic behavior as their conductivity decreases when the temperature increases. The
conductivity shows a maximum at 5% Na concentration and decreases abruptly when
increasing the doping concentration to 10% and 20%. At high Na concentration the
conduction electrons from the Nb dopants seem to be mostly compensated by the hole
doping effect of Na leading to a reduction in the electronic conductivity, in excellent

143
qualitative agreement with our calculations that doping with only small amounts of Na
significantly improves the electronic conductivity since a small concentration of electron
holes can be compensated by the presence of oxygen vacancies in the lattice.
Figure 6.14 XRD pattern of a) Sr1-xNaxTi0.8Nb0.2O3 powder and b) Sr0.8-xNaxLa0.2TiO3
powder after solid state reactions at 1250 oC in air.

144
It is interesting to note that stoichiometric and A-site deficient 20% La-doped
SrTiO3 samples do not exhibit metallic behavior as expected. Instead, these samples show
semiconducting behavior with low conductivity as shown in Fig. 6.15. We believe this
behavior can be explained by the poor phase stability of the La-doped SrTiO3 samples
[26] which leads to the low incorporation of La in the samples even when these samples
were exposed to a reducing atmosphere at high temperatures. Since the concentration of
conduction electrons depends strongly on the level of La dopants in the lattice, the
samples with low La concentration exhibit a small concentration of conduction electrons.
According to Mott‘s theory [26, 29], a transition from semiconducting to metallic
behavior may occur if the concentration of conduction electrons exceeds a critical value.
In this particular case, the number of conduction electrons that 20% La-doped SrTiO3
samples possess may not surpass this value and we observe semiconducting behavior and
low conductivity for these samples. This semiconducting behavior has also been reported
in Y-doped SrTiO3 systems [26].
We want to emphasize that Na-doping improves the formation, reducibility, and
mixed ionic/electronic conductivity of the materials. Figure 6.16 shows that doping 20%
La-doped SrTiO3 with small amounts of Na remarkably increases the conductivity of the
materials. The improvement in conductivity originates from the improved reducibility
and increased number of charge carriers (as discussed above) of the Na-doped materials.
Note that small amounts of Na do not diminish the electronic conductivity of the
materials since the hole doping effect from Na dopants is compensated by the presence of
oxygen vacancies in the material.

145
Figure 6.15 Electrical conductivity of Sr1-xNaxTi0.8Nb0.2O3 samples sintered in 5% H2/N2
(pO2~10-22
bar at 800oC) at 1400
oC as a function of temperature and Na content. The
conductivity was measured in H2 with a flow rate of 80 ml min-1
(pO2~10-26
bar at
800oC).
Furthermore, the number of oxygen vacancies produced in the lattice could
support oxide ion conductivity of the material. As a result, the materials become mixed
ionic/electronic conductors. However, as predicted above adding too much Na diminishes
the electronic conductivity because the concentration of charge carriers in the lattice is
reduced by the effects of electron-hole compensation due to the large amount of Na
dopants in the materials. As can be seen from Fig. 6.16, the conductivity drops by a half
when increasing the concentration of Na from 10% to 20%. Moreover, using Na as a p-
type dopant in p- and n-doped SrTiO3 results in a higher conductivity than using Ga [16,
17]. As shown in Table 6.2, the calculated number of charge carriers in Na- and n- (La or
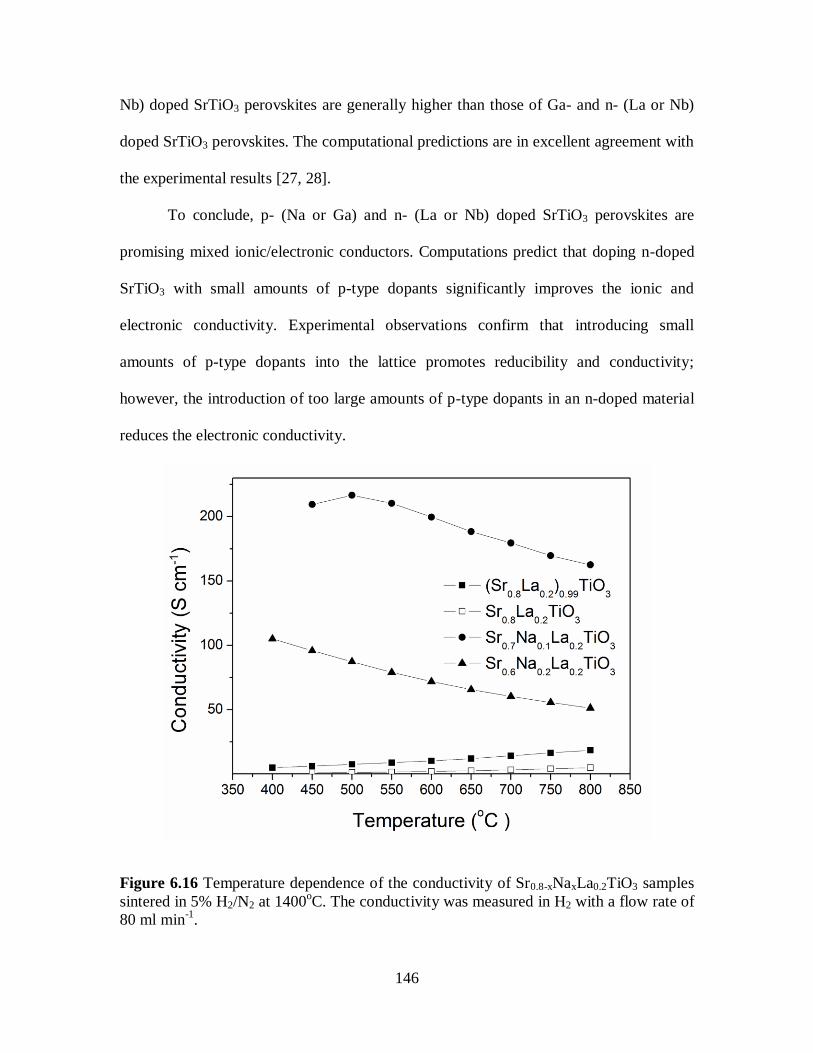
146
Nb) doped SrTiO3 perovskites are generally higher than those of Ga- and n- (La or Nb)
doped SrTiO3 perovskites. The computational predictions are in excellent agreement with
the experimental results [27, 28].
To conclude, p- (Na or Ga) and n- (La or Nb) doped SrTiO3 perovskites are
promising mixed ionic/electronic conductors. Computations predict that doping n-doped
SrTiO3 with small amounts of p-type dopants significantly improves the ionic and
electronic conductivity. Experimental observations confirm that introducing small
amounts of p-type dopants into the lattice promotes reducibility and conductivity;
however, the introduction of too large amounts of p-type dopants in an n-doped material
reduces the electronic conductivity.
Figure 6.16 Temperature dependence of the conductivity of Sr0.8-xNaxLa0.2TiO3 samples
sintered in 5% H2/N2 at 1400oC. The conductivity was measured in H2 with a flow rate of
80 ml min-1
.

147
6.5 Conclusions
We utilized computational and experimental tools to develop a mixed p- and n-
type doping strategy to obtain mixed ionic/electronic conductivity in SrTiO3 based
perovskite oxides. First, we performed DFT calculations of various Na- and Nb-doped
SrTiO3 and Na- and La-doped SrTiO3 systems. In particular, we performed constrained
ab initio thermodynamic simulations to determine the phase stability and reducibility of
doped SrTiO3 under synthesized and anodic SOFC conditions. Then, we analyzed the
DOS of the most dominant structures in the phase diagrams to compute the number of
charge carriers per supercell. The calculations reveal that doping 20% n- (La or Nb)
doped SrTiO3 with small amounts of Na (e.g. 10%) enhances the ionic conductivity of the
material by creating oxygen vacancies. The electronic conductivity is improved since the
hole doping effect is compensated by the presence of oxygen vacancies such that a mixed
ionic/electronic conductor is formed. However, increasing the Na concentration further
(e.g. 20%) diminishes the electronic conductivity of the material because the
concentration of conduction electrons is reduced by excessive electron holes from the Na
dopants. These theoretical predictions are confirmed by experimental observations.
Experimentally, we find that introducing small amounts of Na in n-doped SrTiO3
dramatically enhances the total conductivity. In addition to the reasons suggested
theoretically, we also observe an improved stability of the materials. From computational
predictions and experimental observations we confirm that a mixed p- and n-doping
approach is an efficient doping strategy to obtain mixed ionic/electronic conductivity in
perovskite oxides; which could be one of the reasons why a large number of elements can
be found in most high performance perovskite electrodes for SOFCs. We note that this
148
doping approach is valid independent of p- and n-doping site since either altering the n-
type dopant from La (A-site) to Nb (B-site) or changing the p-type dopant from Ga (B-
site) to Na (A-site) does not significantly affect the ionic and electronic conductivity of
the doped material.
6.6 References
[1] R.J. Gorte, J.M. Vohs, Current Opinion in Colloid & Interface Science 14 (2009)
236.
[2] D. Neagu, J.T.S. Irvine, Chem. Mater. 22 (2010) 5042.
[3] S.W. Tao, J.T.S. Irvine, Nature Materials 2 (2003) 320.
[4] Y.H. Huang, R.I. Dass, Z.L. Xing, J.B. Goodenough, Science 312 (2006) 254.
[5] D.P. Fagg, V.V. Kharton, A.V. Kovalevsky, A.P. Viskup, E.N. Naumovich, J.R.
Frade, J. Eur. Ceram. Soc. 21 (2001) 1831.
[6] S.Q. Hui, A. Petric, J. Eur. Ceram. Soc. 22 (2002) 1673.
[7] T. Ishihara, H. Matsuda, Y. Takita, J. Am. Chem. Soc. 116 (1994) 3801.
[8] M. Feng, J.B. Goodenough, Eur. J. Solid State Inorg. Chem. 31 (1994) 663.
[9] K.Q. Huang, M. Feng, J.B. Goodenough, M. Schmerling, J. Electrochem. Soc. 143
(1996) 3630.
[10] Y.B. Lin, Z.L. Zhan, S.A. Barnett, J. Power Sources 158 (2006) 1313.
[11] A. Sin, E. Kopnin, Y. Dubitsky, A. Zaopo, A.S. Arico, L.R. Gullo, D. La Rosa, V.
Antonucci, J. Power Sources 145 (2005) 68.
[12] P. Vernoux, E. Djurado, M. Guillodo, J. Am. Ceram. Soc. 84 (2001) 2289.
[13] J. Canales-Vazquez, S.W. Tao, J.T.S. Irvine, Solid State Ionics 159 (2003) 159.
[14] O.A. Marina, N.L. Canfield, J.W. Stevenson, Solid State Ionics 149 (2002) 21.
[15] J. Canales-Vazquez, J.C. Ruiz-Morales, J.T.S. Irvine, W.Z. Zhou, J. Electrochem.
Soc. 152 (2005) A1458.
[16] S. Suthirakun, S.C. Ammal, G.L. Xiao, F.L. Chen, K.V. Huang, H.C. zur Loye, A.
Heyden, Solid State Ionics 228 (2012) 37.
[17] S. Suthirakun, S.C. Ammal, G.L. Xiao, F.L. Chen, H.C. zur Loye, A. Heyden,
Phys. Rev. B 84 (2011) 205102.
[18] G. Kresse, J. Furthmuller, Phys. Rev. B 54 (1996) 11169.
[19] J.P. Perdew, K. Burke, M. Ernzerhof, Phys. Rev. Lett. 77 (1996) 3865.
[20] G. Kresse, D. Joubert, Phys. Rev. B 59 (1999) 1758.
[21] H.J. Monkhorst, J.D. Pack, Phys. Rev. B 13 (1976) 5188.
[22] S. Ohta, T. Nomura, H. Ohta, K. Koumoto, J. Appl. Phys. 97 (2005) 034106.
[23] S. Laursen, S. Linic, PCCP 11 (2009) 11006.
[24] S. Laursen, S. Linic, J. Phys. Chem. C 113 (2009) 6689.
[25] J. Rogal, K. Reuter, M. Scheffler, Phys. Rev. B 75 (2007) 205433.
[26] Q.L. Ma, F. Tietz, D. Stover, Solid State Ionics 192 (2011) 535.
[27] G. Xiao, X. Dong, K. Huang, F. Chen, Mater. Res. Bull. 46 (2011) 57.
[28] D. Neagu, J.T.S. Irvine, Chem. Mater. 23 (2011) 1607.
[29] N.F. Mott, Reviews of Modern Physics 40 (1968) 677.

149
CHAPTER 7
THEORETICAL INVESTIGATION OF HYDROGEN OXIDATION ON THE
Sr2Fe1.5Mo0.5O6-δ (001) PEROVSKITE SURFACE UNDER
ANODIC SOLID OXIDE FUEL CELL CONDITIONS
7.1 Summary
In this work, we used density functional theory and microkinetic modeling to
investigate the oxidation mechanism of H2 fuel on the (001) surface of the
Sr2Fe1.5Mo0.5O6-δ (SFM) perovskite under anodic solid oxide fuel cell conditions. The
model predicts that in the absence of a bias potential H2 dissociation and H transfer are
the rate limiting steps for H2 oxidation on Mo and Fe sites on the SFM surface,
respectively. However, the rate determining step for H2 oxidation on both Mo and Fe
sites become the H transfer when the anode bias potential is included in the model. The
overall rates and apparent activation barriers are computed under the assumption of a fast
cathode reaction. The model predictions are in a very good agreement with experimental
observations that adding a transition metal on the SFM surface improves the
electrochemical performance of the anode catalyst. The presence of a transition metal on
the surface facilitates the H transfer process and leads to a dramatic improvement in
SOFC performance.
150
7.2 Introduction
Sr2Fe1+xMo1-xO6-δ (SFM) based perovskites [1, 2] have been proposed as
promising anode materials for SOFCs since they exhibit high mixed ionic and electronic
conductivity under SOFC operating conditions. The mixed valence Mo6+
/Mo5+
and
Fe4+
/Fe3+
provide electronic conductivity whereas their characteristic of oxygen
deficiency leads to high ionic conductivity in the material. Experiments have shown that
this material can be used with H2 fuel and natural gas with high thermodynamic stability
and tolerance to sulfur. Furthermore, it was reported that SFM displayed good thermal
compatibility with La0.9Sr0.1Ga0.8Mg0.2O3-δ (LSGM) electrolyte [1]. Although SFM
perovskite anode materials display several advantages over conventional Ni/YSZ
cermets, their electrochemical activity is not satisfactory. Relatively low electrochemical
activity of Sr2Fe1.5Mo0.5O6-δ has been reported when using H2 or methane as a fuel. The 2
wt.% Ni content in the anode was necessary to obtain good performance, indicating that a
small amount of Ni provides a significant electrocatalytic effect while not causing coking
[1].
Despite the considerable experimental work cited above, the oxidation of H2 on
the SFM surface has not been treated theoretically. Understanding the mechanism of H2
oxidation is crucial for aiding the development of SFM perovskite anode catalysts. In this
Chapter, we aim at illustrating how a combination of density functional theory (DFT) and
mean-field microkinetic modeling [3] can be used to gain insight into the catalytic
reaction mechanism of H2 oxidation on the SFM surfaces. First, constrained ab initio
thermodynamic calculations were carried out to create surface models at realistic SOFC
conditions. Then, we used the obtained realistic surface model to perform a mechanistic
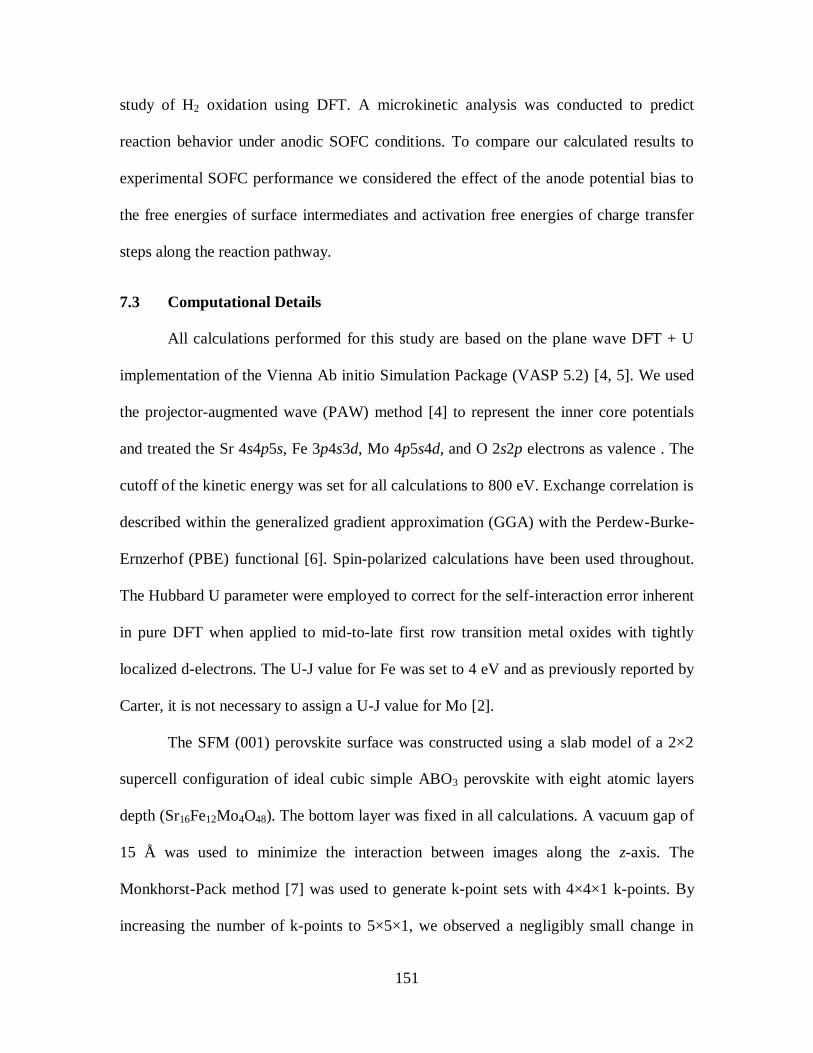
151
study of H2 oxidation using DFT. A microkinetic analysis was conducted to predict
reaction behavior under anodic SOFC conditions. To compare our calculated results to
experimental SOFC performance we considered the effect of the anode potential bias to
the free energies of surface intermediates and activation free energies of charge transfer
steps along the reaction pathway.
7.3 Computational Details
All calculations performed for this study are based on the plane wave DFT + U
implementation of the Vienna Ab initio Simulation Package (VASP 5.2) [4, 5]. We used
the projector-augmented wave (PAW) method [4] to represent the inner core potentials
and treated the Sr 4s4p5s, Fe 3p4s3d, Mo 4p5s4d, and O 2s2p electrons as valence . The
cutoff of the kinetic energy was set for all calculations to 800 eV. Exchange correlation is
described within the generalized gradient approximation (GGA) with the Perdew-Burke-
Ernzerhof (PBE) functional [6]. Spin-polarized calculations have been used throughout.
The Hubbard U parameter were employed to correct for the self-interaction error inherent
in pure DFT when applied to mid-to-late first row transition metal oxides with tightly
localized d-electrons. The U-J value for Fe was set to 4 eV and as previously reported by
Carter, it is not necessary to assign a U-J value for Mo [2].
The SFM (001) perovskite surface was constructed using a slab model of a 2×2
supercell configuration of ideal cubic simple ABO3 perovskite with eight atomic layers
depth (Sr16Fe12Mo4O48). The bottom layer was fixed in all calculations. A vacuum gap of
15 Å was used to minimize the interaction between images along the z-axis. The
Monkhorst-Pack method [7] was used to generate k-point sets with 4×4×1 k-points. By
increasing the number of k-points to 5×5×1, we observed a negligibly small change in

152
oxygen vacancy formation energy (<0.01 eV) suggesting a very good convergence of
reaction energies with respect to k-point density. The contribution of dipole interactions
along the z-axis is subtracted from the total energy. Test calculations on a symmetric slab
display a negligible difference of less than 0.07 eV in oxygen vacancy formation energy
which indicates that the dipole correction scheme implemented in VASP can be used to
adjust dipole interactions in our asymmetric system and i.e., it confirms that our
asymmetric slab model with dipole correction scheme can be used to accurately predict
energies of redox reactions on the surface.
Transition states (TS) and minimum energy reaction paths of various elementary
steps were studied using the climbing image nudge-elastic band (CI-NEB) [8] and Dimer
method [9]. The DFT-derived parameters were employed in a microkinetic model to
calculate the surface coverage of adsorbed species under anodic SOFC conditions to
determine the rate limiting step. A detailed description of the microkinetic modeling
approach is described in the results and discussion section.
7.4 Results and Discussion
7.4.1 Surface model development
It has previously been shown that the BO2 terminated (001) surface of simple
cubic ABO3 perovskite is the most stable of the various surfaces under reducing
conditions [10, 11]. As a result, we considered the (Fe/Mo)O2 terminated (001) surface to
be a starting point for the examination of the baseline activity of fuel oxidation on SFM
surfaces. The possibilities of Fe and Mo distribution in the 3-dimentional space
contribute to differences in surface configurations. Figure 7.1 illustrates three different
surface configurations that are considered in this study, namely, Plane-Mo (Fig. 7.1(a)),

153
Diagonal-Mo (Fig. 7.1(b)), and FeO2-terminated surfaces (Fig. 7.1(c)). Our preliminary
study revealed that the Plane-Mo surface exhibits the lowest surface energy among the
other surfaces. Therefore, we chose this surface configuration to be our surface model for
the mechanistic H2 oxidation.
Figure 7.1 Surface models with different Fe/Mo configurations a) Plane-Mo surface, b)
Diagonal-Mo surface, and c) Fe-terminated surface
To obtain a realistic surface model under anodic SOFC conditions we build a
reduced slab model by creating up to six oxygen vacancies in the stoichiometric slab
model. Figure 7.2 depicts the reduced slab model with six oxygen vacancies. The first
two oxygen vacancies are positioned on the top-most layer, which allow a significant
surface reconstruction in the top two layers of the model. The third and fourth oxygen
vacancies are located in the second bottom layer between Fe atoms generating a row of
vacancies. It is preferred to create the fifth oxygen vacancy in the (Fe/Mo)O2 layer
between Fe and Mo atoms whereas the sixth oxygen vacancy is positioned on the top
most layer of the surface model. It is important to note that since SFM exhibits

154
antiferromagetic behavior we need to perform an optimization of the magnetic
configuration of Fe spins to minimize the energy. This can be done by manually assign a
spin configuration (up or down) on every Fe atoms in the surface model. We tried up to
twelve different configurations and the one that minimizes the total electronic energy
exhibits the most stable magnetic configuration. This approach was applied to optimize
the magnetic configuration of all stoichiometric and reduced surface models.
Figure 7.2 The Plane-Mo surface model with six oxygen vacancies. The dotted squares
represent the position of oxygen vacancies and the order the oxygen vacancy were
generated are labeled the number in the square.
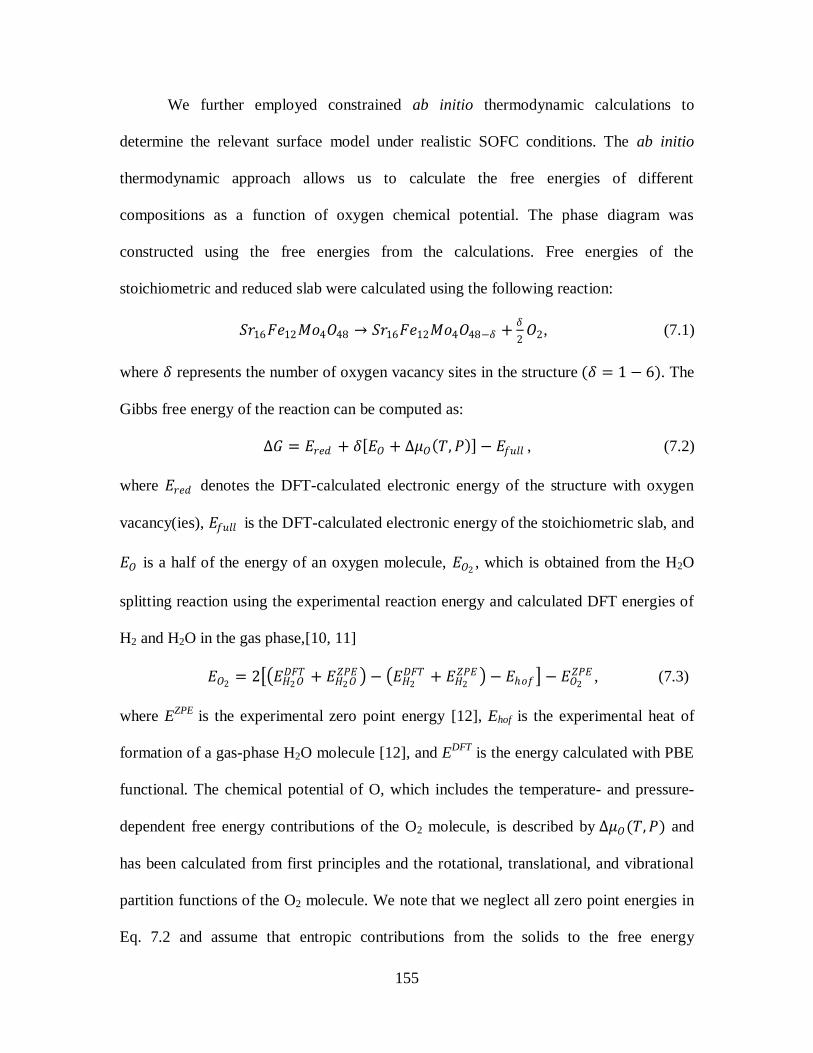
155
We further employed constrained ab initio thermodynamic calculations to
determine the relevant surface model under realistic SOFC conditions. The ab initio
thermodynamic approach allows us to calculate the free energies of different
compositions as a function of oxygen chemical potential. The phase diagram was
constructed using the free energies from the calculations. Free energies of the
stoichiometric and reduced slab were calculated using the following reaction:
𝑆𝑟16𝐹𝑒12𝑀𝑜4𝑂48 → 𝑆𝑟16𝐹𝑒12𝑀𝑜4𝑂48−𝛿 +𝛿
2𝑂2, (7.1)
where 𝛿 represents the number of oxygen vacancy sites in the structure (𝛿 = 1 − 6). The
Gibbs free energy of the reaction can be computed as:
∆𝐺 = 𝐸𝑟𝑒𝑑 + 𝛿 𝐸𝑂 + ∆𝜇𝑂 𝑇, 𝑃 − 𝐸𝑓𝑢𝑙𝑙 , (7.2)
where 𝐸𝑟𝑒𝑑 denotes the DFT-calculated electronic energy of the structure with oxygen
vacancy(ies), 𝐸𝑓𝑢𝑙𝑙 is the DFT-calculated electronic energy of the stoichiometric slab, and
𝐸𝑂 is a half of the energy of an oxygen molecule, 𝐸𝑂2, which is obtained from the H2O
splitting reaction using the experimental reaction energy and calculated DFT energies of
H2 and H2O in the gas phase,[10, 11]
𝐸𝑂2= 2 𝐸𝐻2𝑂
𝐷𝐹𝑇 + 𝐸𝐻2𝑂𝑍𝑃𝐸 − 𝐸𝐻2
𝐷𝐹𝑇 + 𝐸𝐻2
𝑍𝑃𝐸 − 𝐸𝑜𝑓 − 𝐸𝑂2
𝑍𝑃𝐸 , (7.3)
where EZPE
is the experimental zero point energy [12], Ehof is the experimental heat of
formation of a gas-phase H2O molecule [12], and EDFT
is the energy calculated with PBE
functional. The chemical potential of O, which includes the temperature- and pressure-
dependent free energy contributions of the O2 molecule, is described by ∆𝜇𝑂(𝑇, 𝑃) and
has been calculated from first principles and the rotational, translational, and vibrational
partition functions of the O2 molecule. We note that we neglect all zero point energies in
Eq. 7.2 and assume that entropic contributions from the solids to the free energy

156
difference are insignificant [13-15]. Also, the pressure dependence of ∆𝜇𝑂(𝑇, 𝑃) is
obtained assuming that the gas phase is ideal [14].
∆𝜇𝑂 𝑇, 𝑃 =1
2 ∆𝜇𝑂2
𝑇, 𝑃0 + 𝑘𝑏𝑇𝑙𝑛 𝑃
𝑃0 (7.4)
Figure 7.3(a) shows the calculated phase diagram of the reduced slab model. It
can be seen that the reduced slab model consists of five oxygen vacancies under anodic
SOFC conditions (pO2 ~ 10-20
atm, 1000 K). This reduced slab model (Fig. 7.3(b)) was
then used as our surface model to study the oxidation of H2.
Figure 7.3 a) Calculated phase diagram of the Plane-Mo surface model b) Plane-Mo
surface model with five oxygen vacancies. The dotted squares represent the position of
oxygen vacancies.
7.4.2 Reaction pathways
In this section, we describe the catalytic mechanism of H2 oxidation on the SFM
anode surface. The overall electrochemical oxidation of H2 at the anode can be expressed
as:

157
𝐻2(𝑔) + 𝑂𝑂2− → 𝐻2𝑂(𝑔) + 2𝑒𝑆𝐹𝑀
− + 𝑉𝑂2+ , (7.5)
where 𝑉𝑂2+ denotes a doubly charged oxygen vacancy on the SFM surface and the two
electrons of 𝑂𝑂2− (oxygen on the surface) are transferred through the M-O-M (M = Fe,
Mo) bridge to the current collector. Figure 7.4 illustrates our proposed reaction scheme.
First, a H2 molecule in the feed gas adsorbs dissociatively on a metal site and an oxygen
site on the surface.
𝑆𝐹𝑀 + 𝐻2 𝑔 → 𝑆𝐹𝑀H−H (step I)
where 𝑆𝐹𝑀 and 𝑆𝐹𝑀H−H denote the SFM surface model and the surface with two H
atoms adsorbed on the surface. Then, the H atom on the metal site is transferred to the
hydroxyl species (-OH) leading to a formation of a water molecule on the surface.
𝑆𝐹𝑀H−H → 𝑆𝐹𝑀OH 2 (step II)
where 𝑆𝐹𝑀OH 2 represents the surface with a water molecule. After that, the desorption of
the water molecule takes place creating an oxygen vacancy on the surface.
𝑆𝐹𝑀OH 2→ 𝑆𝐹𝑀VS (step III)
where 𝑆𝐹𝑀VS denotes the surface model with an oxygen vacancy on the top most layer.
Next, oxygen ions from the SFM bulk (anode) are transferred to the anode surface:
𝑆𝐹𝑀VS → 𝑆𝐹𝑀VB (step IV)
where 𝑆𝐹𝑀VB represents the surface model with an oxygen vacancy in the second top
most layer. The electrochemical reaction of step IV can be written as:
𝑂𝑆𝐹𝑀2− + 𝑉𝑂
2+ → 𝑂𝑂2− + 𝑉𝑆𝐹𝑀
2+ , (7.6)
where 𝑂𝑆𝐹𝑀2− and 𝑉𝑆𝐹𝑀
2+ represent the doubly charged oxygen and the vacancy in the SFM
bulk. Finally, the SFM bulk vacancies are filled by oxygen ions from the cathode which
are obtained by the reduction of oxygen at the cathode side:

158
𝑆𝐹𝑀VB +1
2𝑂2 𝑔 (𝑐𝑎𝑡𝑜𝑑𝑒) → 𝑆𝐹𝑀. (step V)
This process consists of two elementary steps. First, the replenishment of the SFM bulk
vacancies by oxygen ions from cathode:
𝑂𝑐𝑎𝑡2− + 𝑉𝑆𝐹𝑀
2+ → 𝑂𝑆𝐹𝑀2− + 𝑉𝑐𝑎𝑡
2+ , (7.7)
where 𝑂𝑐𝑎𝑡2− and 𝑉𝑐𝑎𝑡
2+ denote the doubly charged oxygen and vacancy in the cathode.
Then, the oxygen vacancies at the cathode are filled by the reduction of oxygen at the
cathode side:
1
2𝑂2(𝑔) + 𝑉𝑐𝑎𝑡
2+ + 2𝑒−(𝑐𝑎𝑡𝑜𝑑𝑒) → 𝑂𝑐𝑎𝑡2− . (7.8)
In this study, we explicitly calculated the oxygen migration from the SFM bulk to the
anode surface (step IV) and we used the literature value for bulk oxygen diffusion in
SFM (step V). To a first approximation, we assume that the current collection and oxygen
reduction reaction at the cathode are fast which is the case at high temperatures.
7.4.3 Reaction intermediates and energy barriers
To investigate the most favorable pathway of H2 oxidation on the surface, all
possible reaction intermediates were considered. We assume that the spin configuration
of Fe atoms in our surface model does not change along the reaction coordinate and we
used the optimized spin configuration of our surface model to describe the magnetic
behavior of all intermediates. All structural configurations of 𝑆𝐹𝑀H−H and 𝑆𝐹𝑀OH 2
intermediates are illustrated in Fig 7.5.

159
Figure 7.4 Proposed pathway for H2 oxidation mechanism on the SFM surface
Geometric and energetic information for the reaction intermediates resulting from
the H2 dissociation and water formation on the surface are listed in Table 7.1 and Table
7.2, respectively. It can be seen that the active sites of the SFM surface involve a metal
(Fe or Mo) site and an oxygen site. Note that the dissociative adsorption of H2 is not
stable on the Fe1-2 site and we did not include these intermediates in this study. The
𝑆𝐹𝑀H−H intermediates exhibit an average bond distance of Mo-H of 1.73 Å which is
similar to that of Fe-H (1.81 Å) whereas the average bond distance of O-H is 0.98 Å. The
H atom from the metal site is transferred to the hydroxyl site forming a water molecule
on the surface, 𝑆𝐹𝑀OH 2. The 𝑆𝐹𝑀OH 2
intermediates display an average bond distance of
O-H (H2O) of 0.99 Å and an average bond angle of 106.85 degree. We notice that the O
atom of the water molecule on the surface model is preferred to be connected to an Fe
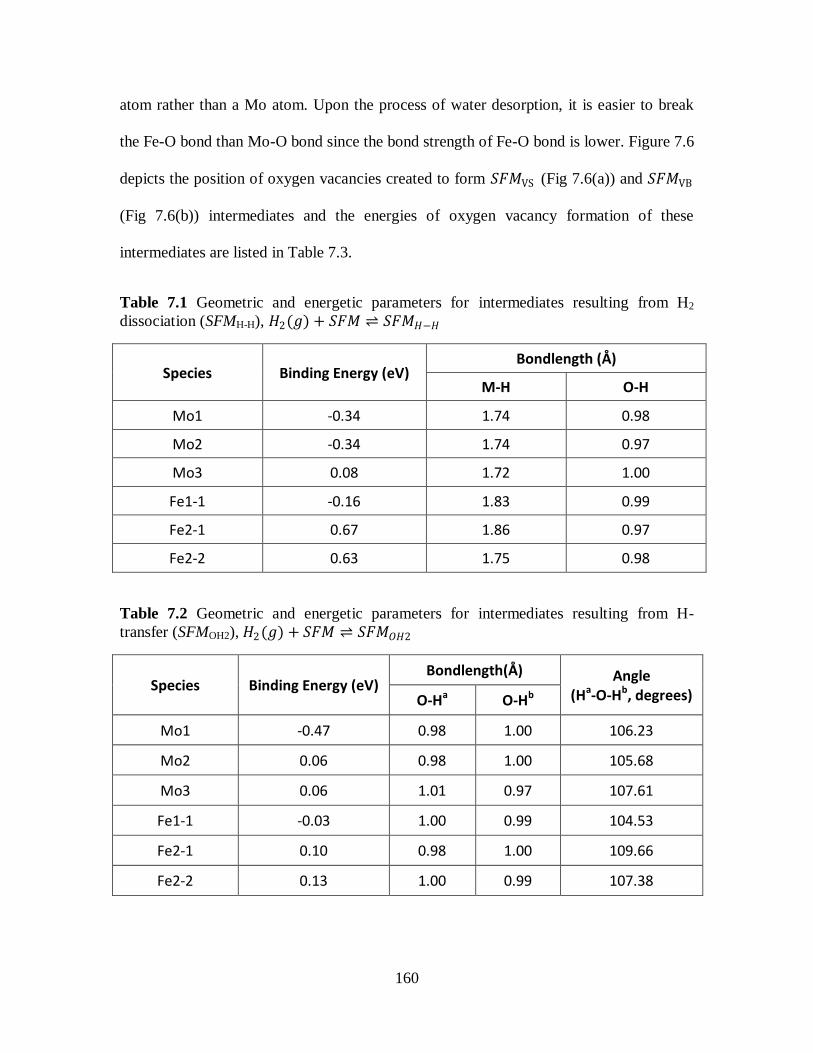
160
atom rather than a Mo atom. Upon the process of water desorption, it is easier to break
the Fe-O bond than Mo-O bond since the bond strength of Fe-O bond is lower. Figure 7.6
depicts the position of oxygen vacancies created to form 𝑆𝐹𝑀VS (Fig 7.6(a)) and 𝑆𝐹𝑀VB
(Fig 7.6(b)) intermediates and the energies of oxygen vacancy formation of these
intermediates are listed in Table 7.3.
Table 7.1 Geometric and energetic parameters for intermediates resulting from H2
dissociation (SFMH-H), 𝐻2(𝑔) + 𝑆𝐹𝑀 ⇌ 𝑆𝐹𝑀𝐻−𝐻
Species Binding Energy (eV) Bondlength (Å)
M-H O-H
Mo1 -0.34 1.74 0.98
Mo2 -0.34 1.74 0.97
Mo3 0.08 1.72 1.00
Fe1-1 -0.16 1.83 0.99
Fe2-1 0.67 1.86 0.97
Fe2-2 0.63 1.75 0.98
Table 7.2 Geometric and energetic parameters for intermediates resulting from H-
transfer (SFMOH2), 𝐻2(𝑔) + 𝑆𝐹𝑀 ⇌ 𝑆𝐹𝑀𝑂𝐻2
Species Binding Energy (eV) Bondlength(Å) Angle
(Ha-O-Hb, degrees) O-Ha O-Hb
Mo1 -0.47 0.98 1.00 106.23
Mo2 0.06 0.98 1.00 105.68
Mo3 0.06 1.01 0.97 107.61
Fe1-1 -0.03 1.00 0.99 104.53
Fe2-1 0.10 0.98 1.00 109.66
Fe2-2 0.13 1.00 0.99 107.38

161
Table 7.3 Energies of oxygen vacancy formation of SFMVS and SFMVB intermediates
Intermediates Position of oxygen vacancy
wrt Fig. 7.6 EVF (eV)
SFMVS
1 4.53
2 3.95
3 3.95
4 4.56
5 4.14
6 4.14
SFMVB
1 4.02
2 4.46
3 4.00
4 4.46
The TS of the H2 dissociation process (step I) and H-transfer (step II) were
located using the CI-NEB method and the reaction energy barriers of selected pathway
were calculated. We calculated the energy barriers for the Mo1, Mo2, Mo3, and Fe1-1
pathways to determine the most favorable pathway of H2 oxidation on the SFM surface.
The energy barriers of Fe2-1 and Fe2-2 were not computed because the energies of their
𝑆𝐹𝑀H−H intermediates are less stable than the most stable one by 1.02 and 0.98 eV,
respectively, and it is expected that H2 dissociation on these sites is not preferred. Figure
7.7 illustrates the one-dimensional potential energy surface (PES) for the H2 oxidation
mechanism on the SFM surface which was constructed using the DFT calculated energies
of all stable intermediates. The PES shows that the H2 oxidation on Mo1 and Fe1-1 are
competitive and could be energetically favorable; therefore, we performed dimer
calculations to determine a more accurate TS structure and energy. The calculated energy
barriers of Mo1 and Fe1-1 are 0.58 and 0.06 for step I and 0.74 and 0.86 for step II,
respectively. Furthermore, since Mo1 and Fe1-1 involve the same oxygen site, only one

162
TS of the oxygen migration process (step IV) is calculated. The NEB calculation did not
identify any TS for this process, suggesting that the TS is product-like and the energy
barrier is similar to the energy of reaction.
Figure 7.5 Top view of surface intermediates resulting from a) H2 dissociation (SFMH-H)
and b) H transfer (SFMOH2)

163
Figure 7.6 All possible positions of oxygen vacancies that can be generated in the slab
model to create a) SFMVS intermediates and b) SFMVB intermediates. The yellow oxygen
atoms indicate the possible positions of oxygen vacancies that were created with the
labeled numbers with respect to EVF listed in Table 7.2
Figure 7.7 One-dimensional potential energy surface (PES) for H2 oxidation on the SFM
surface (zero-point energy effects not included).

164
7.4.4 Microkinetic modeling
The thermochemical data and activation barriers for the elementary steps suggest
that H2 oxidation on Mo1 or Fe1-1 could be the most favorable pathway. However, we
cannot deduce the most favorable pathway from DFT calculations alone since the relative
rates of these pathways depend on reaction conditions. Therefore, we continue to conduct
the microkinetic analysis for the H2 oxidation mechanism on Mo1 and Fe1-1 sites to
further investigate the reaction behavior under realistic SOFC conditions. We used the
results from the DFT calculations as initial estimates for the parameters of the
microkinetic model. Zero-point corrected reaction energies and zero-point corrected
energy barriers (calculated using DFT frequencies) for all elementary steps of Mo1 and
Fe1-1 pathways are given in Table 7.4. The zero point energy (ZPE) is calculated as
𝑍𝑃𝐸 = 1
2𝑣𝑖 , where 𝑣𝑖 denotes the different vibrational modes of the species.
Figure 7.8 depicts the free energy profile of H2 oxidation on Mo1 and Fe1-1 sites
on the SFM surface model. In this free energy profile, we take into account the
contributions from ZPE, temperature, and pressure of the environmental conditions to
correct the calculated DFT energies. The free energy profile of the two possible pathways
indicates that the H2 oxidation on Mo1 site seems to be less favorable since it exhibits the
highest TS energy (Mo1-TS1) which is 0.24 eV higher than the highest TS energy of
Fe1-1 (TS2).

165
Table 7.4 Zero-point energy corrected reaction energies and forward activation barriers
for the elementary steps considered in the Mo1 and Fe1-1 pathways of the H2 oxidation
mechanism.
Elementary step
Mo1 Pathway Fe1-1 Pathway
∆𝑬𝒁𝑷𝑬 (eV) ∆𝑬𝒁𝑷𝑬𝒂𝒄𝒕 (eV) ∆𝑬𝒁𝑷𝑬 (eV) ∆𝑬𝒁𝑷𝑬
𝒂𝒄𝒕 (eV)
SFM + H2 --> SFMH-H -0.10 0.76 -0.04 0.16
SFMH-H --> SFMOH2 -0.05 0.68 0.32 0.88
SFMOH2 --> SFMVS + H2O 1.13 0.00 0.71 0.00
SFMVS --> SFMVB 0.37 0.00 0.37 0.00
SFMVB + 1/2O2 --> SFM -3.83 0.33 -3.83 0.33
Figure 7.8 Free energy profile (in eV) for Mo1 and Fe1-1 pathways of H2 oxidation
under reaction conditions (T = 1100 K, pH2 = pO2 = 1 atm, and pH2O = 0.03 atm). All
energies are with reference to the sum of the energies of the initial state and the reactant
gas molecules. TS1, TS2, and TS3 denote the TS energies of TS of H2 dissociation, H
transfer, and bulk oxygen migration, respectively. G‡H2O↑ represents the TS free energy of
the water desorption process.

166
The set of 5 steps described in section 7.4.2 constitutes the backbone of the
microkinetic model. The reaction energies (calculated from binding energies), activation
barriers, entropies of surface intermediates, and frequency factors are the parameters
required for describing the model. Collision and transition state theories have been used
to calculate the forward and reverse rate constants for these elementary steps. Table 7.5
lists the calculated forward rate and equilibrium constants of all elementary steps. These
calculated rate constants are used to solve the steady-state equations which give the
fractional surface coverages of all adsorbed species and the fraction of free sites. The
temperature range used in this model is between 900 and 1300 K, and the partial pressure
of the feed gas at the anode are typical experimental conditions of pH2 = 1 atm, and
pH2O = 0.03 atm whereas the oxygen partial pressure at the cathode is 1 atm. The
calculated rates and other insights obtained from the microkinetic model at a
representative temperature of 1100 K are summarized in Table 7.6. The model predicts
that under the SOFC anodic conditions the Fe1-1 pathway exhibits a significantly higher
reaction rate than that of Mo1 pathway. Campbell‘s degree of rate control analysis
indicates that the H2 dissociation is the rate-determining process for the Mo1 pathway
whereas the H transfer process is rate-limiting for the Fe1-1 pathway. Furthermore,
Campbell‘s degree of thermodynamic rate control analysis reveals that the overall rate is
sensitive mostly to the stability of the reactant structure (SFM) for both Mo1 and Fe1-1
pathways. The apparent activation energy for H2 oxidation on Mo1 and Fe1-1 sites are
calculated to be 0.66 and 0.83 eV, respectively.
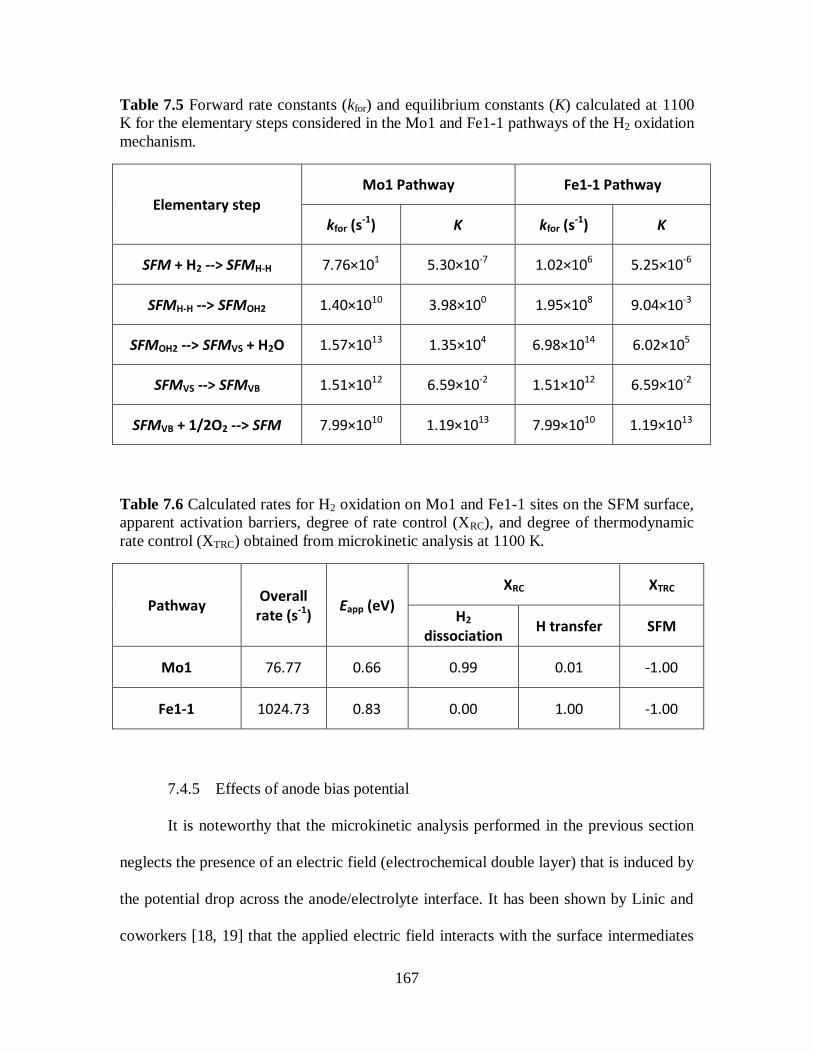
167
Table 7.5 Forward rate constants (kfor) and equilibrium constants (K) calculated at 1100
K for the elementary steps considered in the Mo1 and Fe1-1 pathways of the H2 oxidation
mechanism.
Elementary step
Mo1 Pathway Fe1-1 Pathway
kfor (s-1) K kfor (s
-1) K
SFM + H2 --> SFMH-H 7.76×101 5.30×10⁻⁷ 1.02×10⁶ 5.25×10⁻⁶
SFMH-H --> SFMOH2 1.40×10¹⁰ 3.98×100 1.95×10⁸ 9.04×10⁻³
SFMOH2 --> SFMVS + H2O 1.57×10¹³ 1.35×10⁴ 6.98×10¹⁴ 6.02×10⁵
SFMVS --> SFMVB 1.51×10¹² 6.59×10⁻² 1.51×10¹² 6.59×10⁻²
SFMVB + 1/2O2 --> SFM 7.99×10¹⁰ 1.19×10¹³ 7.99×10¹⁰ 1.19×10¹³
Table 7.6 Calculated rates for H2 oxidation on Mo1 and Fe1-1 sites on the SFM surface,
apparent activation barriers, degree of rate control (XRC), and degree of thermodynamic
rate control (XTRC) obtained from microkinetic analysis at 1100 K.
Pathway Overall
rate (s-1) Eapp (eV)
XRC XTRC
H2 dissociation
H transfer SFM
Mo1 76.77 0.66 0.99 0.01 -1.00
Fe1-1 1024.73 0.83 0.00 1.00 -1.00
7.4.5 Effects of anode bias potential
It is noteworthy that the microkinetic analysis performed in the previous section
neglects the presence of an electric field (electrochemical double layer) that is induced by
the potential drop across the anode/electrolyte interface. It has been shown by Linic and
coworkers [18, 19] that the applied electric field interacts with the surface intermediates

168
and changes their adsorption energies. Their calculations reveal that the field effect on the
binding energies of O and OH on Ni is less than 0.15 eV and there is no effect on the
adsorption energy of H in the presence of typical electric field strengths expected in
SOFCs. In addition to the effect of electric fields to the adsorption energies, the free
energy of surface intermediates is also influenced by the anode potential bias. The
reaction free energies of elementary steps that involve charge species are directly affected
by the potential bias. It has been reported that the chemical potential of the charged
species is shifted by the amount of charge multiplied by the electrical potential [19]. For
example, for the H2 dissociation process (step I) [H2 + * [H-H*]2+
+ 2e-], where a H2
molecule in the feed gas dissociatively adsorbs on the surface and gives 2 electrons to the
metal, the Gibbs free energy is calculated as;
∆𝐺𝑠𝑡𝑒𝑝𝐼 = 𝐺H−H∗ + 2𝑒∆𝑉 − 𝐺𝐻2 − 𝐺∗ , (7.9)
where 𝐺H−H∗ is the free energy of the H-H* adsorbed species, 𝐺𝐻2 is the free energy of a
H2 molecule in the gas phase, e is the magnitude of charge of an electron (1.6×10⁻¹⁹
C),
and ∆𝑉 is the cell voltage which is the difference between the cathode potential (fixed to
be at 1.16 V) and the anode potential (∆𝑉 = 𝑉𝑐𝑎𝑡𝑜𝑑𝑒 − 𝑉𝑎𝑛𝑜𝑑𝑒 ). From Eq. 7.9, we can
see that an increase in the anode potential lowers the free energy of the elementary step
that involved charge species (ions or electrons). Furthermore, the activation barrier of the
charge transfer step is influenced by the anode bias potential. Increasing the anode
potential, 𝑉𝑎𝑛𝑜𝑑𝑒 , lowers the cell voltage, ∆𝑉, and the free energy of activation, ∆𝐺‡ is
calculated as:
∆𝐺‡ = ∆𝐺0,‡ + 𝑛𝑖𝛽Δ𝑉 , (7.10)

169
where ∆𝐺0,‡ is the free energy of activation of the elementary step at short circuit
conditions (without the effect of bias potential), 𝑛𝑖 represents the number of transferring
electrons in the charge transfer step, and 𝛽 denotes the symmetry coefficient (range from
0 to 1, in this study 𝛽 = 0.5). The forward, 𝑘𝑓 , and reverse 𝑘𝑏 rate constant of the charge
transfer step are then calculated as:
𝑘𝑓 = 𝐴𝑓𝑒𝑥𝑝 −∆𝐺𝑓
0,‡−𝑛 𝑖𝛽Δ𝑉
𝑅𝑇 , (7.11)
𝑘𝑏 = 𝐴𝑏𝑒𝑥𝑝 −∆𝐺𝑏
0,‡−𝑛 𝑖(1−𝛽)Δ𝑉
𝑅𝑇 , (7.12)
where 𝐴𝑓 and 𝐴𝑏 denote the frequency factors of the forward and reverse rates,
respectively. Figure 7.9 illustrates the free energy profile of H2 oxidation on Mo1 and
Fe1-1 sites in the presence of bias potential at a cell voltage of 0.7 V.
Figure 7.9 Free energy profile (in eV) for Mo1 and Fe1-1 pathways of H2 oxidation
under operating voltage (∆V = 0.7 V) in the reaction conditions (T = 1100 K, pH2 = pO2
= 1 atm, and pH2O = 0.03 atm). All energies are with reference to the sum of the energies
of the initial state and the reactant gas molecules. TS1, TS2, and TS3 denote the TS
energies of TS of H2 dissociation, H transfer, and bulk oxygen migration, respectively.
G‡H2O↑ represents the TS free energy of the water desorption process.

170
Under operating voltage (∆V = 0.7 V), the bias potential shifts the free energies of all
charge transfer steps upwards by 0.7n where n is the number of charges involving in the
elementary steps (Eq. 7.9). We employed Bader charge analysis to identify the charge
transfer steps and we find that an electron is transferred from the H2 molecule to the
adsorbed oxygen site when it dissociatively adsorbs on the surface (step I). Another
electron is transfer from the adsorbed H atom to the metal site when this H migrates to
the hydroxyl site to from a water molecule (step II). The change of free energy of
activation of the charge transfer step is then calculated using Eq. 7.10. Unlike the free
energy profiles at short circuit, the free energy profiles at operating voltage indicate that
the highest energy TS is TS2 of the Fe1-1 pathway.
Next, we used the parameters obtained from the updated free energy profiles to
conduct a microkinetic analysis. The model was constructed to further investigate the
effect of anode bias potential to the reaction behavior. The rate-controlling step, apparent
activation energy, and overall rate of reaction in the presence of a cell potential of ∆V =
0.7 V are given in Table 7.7. The overall rate and apparent activation energy are clearly
more favorable for Mo1 than for Fe1-1 which suggested that H2 oxidation on Mo1 site is
indeed the most favorable pathway under operating voltage. Campbell‘s degree of rate
control analysis indicates that the reaction behavior of the Mo1 pathway depends strongly
on the operating voltage and temperature. As shown in Fig. 7.10, the degree of rate
control of the Mo1 pathway changes when operating voltage or temperatures are varied.
In contrast, the degree of rate control of Fe1-1 pathway is exactly unity for the H-transfer
process within the considered temperature and operating voltage. Overall, at relevant
operating conditions (Δ𝑉 = 0.7 V and T = 1100 K) the H-transferring process is the
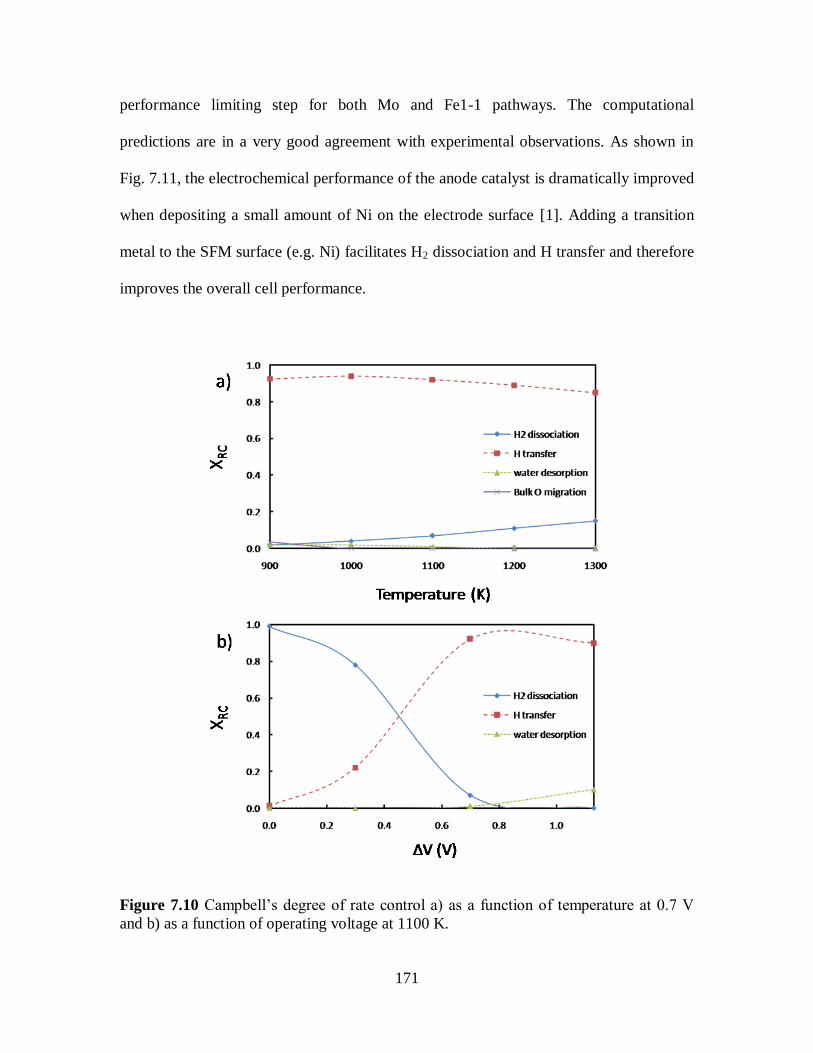
171
performance limiting step for both Mo and Fe1-1 pathways. The computational
predictions are in a very good agreement with experimental observations. As shown in
Fig. 7.11, the electrochemical performance of the anode catalyst is dramatically improved
when depositing a small amount of Ni on the electrode surface [1]. Adding a transition
metal to the SFM surface (e.g. Ni) facilitates H2 dissociation and H transfer and therefore
improves the overall cell performance.
Figure 7.10 Campbell‘s degree of rate control a) as a function of temperature at 0.7 V
and b) as a function of operating voltage at 1100 K.

172
Table 7.7 Calculated rates for H2 oxidation on Mo1 and Fe1-1 sites on the SFM surface,
apparent activation barriers, and degree of rate control (XRC) obtained from microkinetic
analysis at operating voltage of 0.7 V and 1100 K.
Pathway Overall rate
(s-1) Eapp (eV)
XRC
H2 dissociation
H transfer water
desorption
Mo1 0.11 1.56 0.07 0.92 0.01
Fe1-1 0.02 2.40 0.00 1.00 0.00
Figure 7.11 Polarization curve of SFM and Ni modified SFM anode electrode [1]
7.5 Conclusions
Our microkinetic model based on DFT-derived parameters was able to accurately
predict the experimentally observed reaction behavior and provide significant insights
into the rate-limiting process of the H2 oxidation on the SFM (001) surface. We
employed constrained ab initio thermodynamic calculations to construct a surface model

173
under realistic reaction conditions. The surface model was used to investigate the
thermochemistry and reaction barriers of the elementary steps leading to H2 oxidation on
the anode surface. The H2 oxidation mechanism involved the H2 dissociation, H-transfer,
water desorption, bulk-to-surface oxygen migration, and oxygen replenishment process.
A microkinetic analysis was conducted to include the effect of reaction conditions. In
addition, the anode bias potential is included in the model to study the effect of the bias
potential to the reaction behavior. Overall, the model predicts that at relevant operating
voltage and realistic SOFC conditions the H-transfer is the performance limiting process.
The calculated results agree very well with the experimental observations that the
electrochemical performance of the SFM anode can be improved when adding small
amounts of Ni on the catalyst surface. Adding a transition metal to the SFM surface (e.g.
Ni) facilitates the H transfer process and therefore improves the overall cell performance.
7.6 References
[1] G.L. Xiao, F.L. Chen, Electrochem. Commun. 13 (2011) 57.
[2] A.B. Munoz-Garcia, D.E. Bugaris, M. Pavone, J.P. Hodges, A. Huq, F.L. Chen,
H.C. zur Loye, E.A. Carter, J. Am. Chem. Soc. 134 (2012) 6826.
[3] J.A. Dumesic, The Microkinetics of heterogeneous catalysis, American Chemical
Society, Washington, DC 1993.
[4] G. Kresse, J. Furthmuller, Phys. Rev. B 54 (1996) 11169.
[5] G. Kresse, D. Joubert, Phys. Rev. B 59 (1999) 1758.
[6] J.P. Perdew, K. Burke, M. Ernzerhof, Phys. Rev. Lett. 77 (1996) 3865.
[7] H.J. Monkhorst, J.D. Pack, Phys. Rev. B 13 (1976) 5188.
[8] G. Henkelman, B.P. Uberuaga, H. Jonsson, J. Chem. Phys. 113 (2000) 9901.
[9] A. Heyden, A.T. Bell, F.J. Keil, J. Chem. Phys. 123 (2005).
[10] R.I. Eglitis, Integrated Ferroelectrics 108 (2009) 11.
[11] Y.F. Zhukovskii, E.A. Kotomin, S. Piskunov, D.E. Ellis, Solid State Commun. 149
(2009) 1359.
[12] S.C. Ammal, A. Heyden, J. Chem. Phys. 133 (2010) 164703.
[13] J.K. Norskov, J. Rossmeisl, A. Logadottir, L. Lindqvist, J.R. Kitchin, T. Bligaard,
H. Jonsson, J. Phys. Chem. B 108 (2004) 17886.
[14] P.W. Atkins, Physical Chemistry, Oxford University Press, Oxford 1998.
[15] S. Laursen, S. Linic, PCCP 11 (2009) 11006.
[16] S. Laursen, S. Linic, J. Phys. Chem. C 113 (2009) 6689.

174
[17] J. Rogal, K. Reuter, M. Scheffler, Phys. Rev. B 75 (2007) 205433.
[18] D.B. Ingram, S. Linic, J. Electrochem. Soc. 156 (2009) B1457.
[19] J. Mukherjee, S. Linic, J. Electrochem. Soc. 154 (2007) B919.

175
CHAPTER 8
CONCLUSIONS AND FUTURE OUTLOOK
8.1 Conclusions
This work presents a case study for the application of density functional theory
calculations to the rational design of heterogeneous functional materials. Specifically, the
design of alternative perovskite-based SOFC anode materials has been the focus of this
research. Obtaining ionic conductivity, electronic conductivity, and catalytic activity in
perovskite based anode materials has been a major challenge for the development of
SOFC technology. The main conclusions derived from this work are:
The effects of p- and n-type dopants to the mixed ionic/electronic conductivity of
SrTiO3 based perovskite oxides were investigated using density functional theory
calculations. We find that n-doping generates effective positive charges to the
lattice. These extra charges can be electronically compensated by introducing
conduction electrons which travel through the Ti-O-Ti bridge in the SrTiO3
perovskites. This electron transferring process contributes to an improvement in
electronic conductivity.
We find that p-doping generates negative charges to the lattice. Oxygen vacancies
were created to neutralize the extra negative charges at moderate and low oxygen

176
chemical potential. Increasing the number of oxygen vacancies in the structure
leads to an enhanced ionic conductivity.
A mixed p- and n-dope strategy was used to obtain mixed ionic/electronic
conductivity in perovskite anode materials. This doping approach is efficient and
completely independent of doping site. The concentration of p-type dopant should
be lower than n-type dopant so that the hole doping effect from the p-type dopants
can be compensated by the presence of oxygen vacancies in the structure and as
such do not lead to a decrease in electronic conductivity.
The electro-catalytic mechanism of the H2 fuel oxidation on the SFM surface was
investigated using a combination of DFT and microkinetic analysis. The derived
DFT parameters were used to construct a microkinetic model. The model predicts
that at relevant operating voltage in anodic SOFC conditions H transfer is the
performance limiting step. The calculated results are in a very good agreement
with experimental observations that the electrochemical performance of the anode
catalyst is remarkably improved when adding small amounts of a transition metal
like Ni on the catalyst surface.
The work presented in this thesis is significant to the field of high
temperature electro-catalysis since it demonstrates the value of DFT as a
predictive tool in the design of electrodes. The application of DFT did not only
explain experimentally observed phenomena but also permitted the generation of
fundamental understanding regarding an electrochemical process that led to the
development of novel electro-catalysts.
177
8.2 Future Research Directions
In this dissertation, we have mainly focused on the investigation of the H2
oxidation on the SFM surface under anodic SOFC conditions. Another challenging
problem for SOFCs is the syngas fuel oxidation where CO oxidation occurs on the anode
surface. A similar approach to the one utilized in this dissertation, combined DFT and
microkinetic modeling, can be used to predict the reaction behavior of CO on the SFM
anode surface.
Another extension of the work presented in this dissertation would be to utilize
the tools employed herein to investigate the oxidation mechanism of more complex fuels
(e.g. CH4) on the SFM anode surface. The surface model description could be very
similar to the one used in the present work. However, the challenge of this study could be
the complexity of the reaction network and the numbers of possibilities to abstract the H
from a CH4 molecule. Again, a microkinetic model would have to be developed to predict
the reaction behavior under reaction conditions.
Finally, sulfur poisoning of the anode electrocatalysts is another important
problem that has been considered for the past few years [1]. It has been shown that small
amounts of sulfur impurities in the feed gas can dramatically deactivate the anode
catalyst [2-4]. Future research should focus on identifying the SFM surface model under
the presence of various amounts of sulfur impurities. This can be done by using
constrained ab initio thermodynamic simulations. The effects of sulfur impurities can
thus be included in the surface model which can then be used to study the fuel oxidation
mechanism with a combination of DFT and microkinetic modeling. The results from the

178
model predictions can be utilized to identify ways to improve the electrochemical activity
of the anode catalyst under the environment of sulfur impurities.
8.3 References
[1] Y. Matsuzaki, I. Yasuda, Solid State Ionics 132 (2000) 261.
[2] K. Sasaki, K. Susuki, A. Iyoshi, M. Uchimura, N. Imamura, H. Kusaba, Y. Teraoka,
H. Fuchino, K. Tsujimoto, Y. Uchida, N. Jingo, J. Electrochem. Soc. 153 (2006) A2023.
[3] S.W. Zha, Z. Cheng, M.L. Liu, J. Electrochem. Soc. 154 (2007) B201.
[4] S.W. Zha, P. Tsang, Z. Cheng, M.L. Liu, Journal of Solid State Chemistry 178
(2005) 1844.

179
REFERENCES
A. Kaiser, J. L. B., P. R. Slater, J. T. S. Irvine (2000). "Tetragonal tungsten bronze type
phases (Sr1−xBax)0.6Ti0.2Nb0.8O3−δ: Material characterisation and performance as
SOFC anodes " Solid State Ionics 135: 519.
Abramov, Y. A., V. G. Tsirelson, et al. (1995). "The chemical bond and atomic
displacements in SrTiO3 from X-ray diffraction analysis." Acta Crystallographica
Section B 51: 942-951.
Aguilar, L., S. W. Zha, et al. (2004). "A solid oxide fuel cell operating on hydrogen
sulfide (H2S) and sulfur-containing fuels." Journal of Power Sources 135(1-2):
17-24.
Aiura, Y., H. Bando, et al. (1997). "Effects of doping on the electronic structure of
LaxSr1-xTiO3." Superlattices and Microstructures 21(3): 321-324.
Akhtar, M. J., Z. U. N. Akhtar, et al. (1995). "Computer-Simulation Studies of Strontium-
Titanate." Journal of the American Ceramic Society 78(2): 421-428.
Ammal, S. C. and A. Heyden (2010). "Modeling the noble metal/TiO2 (110) interface
with hybrid DFT functionals: A periodic electrostatic embedded cluster model
study." Journal of Chemical Physics 133(16): 164703.
Arachi, Y., H. Sakai, et al. (1999). "Electrical conductivity of the ZrO2-Ln2O3 (Ln =
lanthanides) system." Solid State Ionics 121(1-4): 133-139.
Arai, H., T. Yamada, et al. (1986). "Catalytic Combustion of Methane over Various
Perovskite-Type Oxides." Applied Catalysis 26(1-2): 265-276.
Atkins, P. W. (1998). "Physical Chemistry". Oxford, Oxford University Press.
Atkinson, A., S. Barnett, et al. (2004). "Advanced anodes for high-temperature fuel
cells." Nature Materials 3(1): 17-27.
Ayala, P. Y., K. N. Kudin, et al. (2001). "Atomic orbital Laplace-transformed second-
order Moller-Plesset theory for periodic systems." Journal of Chemical Physics
115(21): 9698-9707.
Balachandran, U. and N. G. Eror (1982). "Electrical-Conductivity in Lanthanum-Doped
Strontium-Titanate." Journal of the Electrochemical Society 129(5): 1021-1026.

180
Balachandran, U., B. Ma, et al. (1998). "Development of mixed-conducting oxides for
gas separation." Solid State Ionics 108(1-4): 363-370.
Batyrev, I., A. Alavi, et al. (1999). "Ab initio calculations on the Al2O3(0001) surface."
Faraday Discussions 114: 33-43.
Batyrev, I. G., A. Alavi, et al. (2000). "Equilibrium and adhesion of Nb/sapphire: The
effect of oxygen partial pressure." Physical Review B 62(7): 4698-4706.
Baur, E., H. Preis (1937). Zeitung für Elektrochemie: 727.
Bednorz, J. G. and K. A. Muller (1986). "Possible High-Tc Superconductivity in the Ba-
La-Cu-O System." Zeitschrift Fur Physik B-Condensed Matter 64(2): 189-193.
Boukamp, B. A. (2003). "The amazing Perovskite anode." Nature Materials 2(5): 294-
296.
Campbell, C. T. (2001). "Finding the rate-determining step in a mechanism - Comparing
DeDonder relations with the "degree of rate control"." Journal of Catalysis
204(2): 520-524.
Canales-Vazquez, J., J. C. Ruiz-Morales, et al. (2005). "Sc-substituted oxygen excess
titanates as fuel electrodes for SOFCs." Journal of the Electrochemical Society
152(7): A1458-A1465.
Canales-Vazquez, J., S. W. Tao, et al. (2003). "Electrical properties in La2Sr4Ti6O19-delta:
a potential anode for high temperature fuel cells." Solid State Ionics 159(1-2):
159-165.
Cortright, R. D. and J. A. Dumesic (2002). "Kinetics of heterogeneous catalytic reactions:
Analysis of reaction schemes." Advances in Catalysis, Vol 46 46: 161-264.
Cramer, C. J. (2004). "Essentials of computational chemistry : theories and models".
Chichester, Wiley.
D. P. Fagg, V. V. K., A. V. Kovalevsky, A. P. Viskup, E. N. Naumovich, J. R. Frade
(2001). "The stability and mixed conductivity in La and Fe doped SrTiO3 in the
search for potential SOFC anode materials " Journal of the European Ceramic
Society 21: 1831.
Dresselhaus, M. S. and I. L. Thomas (2001). "Alternative energy technologies." Nature
414(6861): 332-337.
Dudarev, S. L., G. A. Botton, et al. (1998). "Electron-energy-loss spectra and the
structural stability of nickel oxide: An LSDA+U study." Physical Review B 57(3):
1505-1509.

181
Dudarev, S. L., A. I. Liechtenstein, et al. (1997). "Surface states on NiO (100) and the
origin of the contrast reversal in atomically resolved scanning tunneling
microscope images." Physical Review B 56(8): 4900-4908.
Dumesic, J. A. (1993). "The Microkinetics of heterogeneous catalysis". Washington, DC,
American Chemical Society.
Eglitis, R. I. (2009). "Ab Initio Calculations of SrTiO3, BaTiO3, PbTiO3, CaTiO3 and
BaZrO3 (001) and (011) Surfaces." Integrated Ferroelectrics 108: 11-20.
Fagg, D. P., V. V. Kharton, et al. (2001). "The stability and mixed conductivity in La and
Fe doped SrTiO3 in the search for potential SOFC anode materials." Journal of
the European Ceramic Society 21(10-11): 1831-1835.
Feng, M. and J. B. Goodenough (1994). "A Superior Oxide-Ion Electrolyte." European
Journal of Solid State and Inorganic Chemistry 31(8-9): 663-672.
Fergus, J. W. (2006). "Oxide anode materials for solid oxide fuel cells." Solid State
Ionics 177(17-18): 1529-1541.
Gokhale, A. A., S. Kandoi, et al. (2004). "Molecular-level descriptions of surface
chemistry in kinetic models using density functional theory." Chemical
Engineering Science 59(22-23): 4679-4691.
Goodenough, J. B. and Y. H. Huang (2007). "Alternative anode materials for solid oxide
fuel cells." Journal of Power Sources 173(1): 1-10.
Goodenough, J. B., K. Huang (1997). "Lanthanum Gallate as a New SOFC Electrolyte".
Proceedings the FuelCells‘97 ReviewMeeting.
Gorte, R. J. and J. M. Vohs (2009). "Nanostructured anodes for solid oxide fuel cells."
Current Opinion in Colloid & Interface Science 14(4): 236-244.
Grenier, J. C., G. Schiffmacher, et al. (1977). "X-Ray-Diffraction Study and Electron-
Microscopy of System CaTiO3-Ca2Fe2O5." Journal of Solid State Chemistry
20(4): 365-379.
Guoliang, X., X. Dong, et al. (2011). "Synthesis and characterizations of A-site deficient
perovskite." Materials Research Bulletin 46: 57-61.
Gupta, C. K. and A. K. Suri (1994). "Extractive metallurgy of niobium". Boca Raton,
CRC Press.
Hartley, A., M. Sahibzada, et al. (2000). "La0.6Sr0.4Co0.2Fe0.8O3 as the anode and cathode
for intermediate temperature solid oxide fuel cells." Catalysis Today 55(1-2): 197-
204.

182
Hautier, G., S. P. Ong, et al. (2012). "Accuracy of density functional theory in predicting
formation energies of ternary oxides from binary oxides and its implication on
phase stability." Physical Review B 85(15): 155208.
Henkelman, G., B. P. Uberuaga, et al. (2000). "A climbing image nudged elastic band
method for finding saddle points and minimum energy paths." Journal of
Chemical Physics 113(22): 9901-9904.
Heyden, A., A. T. Bell, et al. (2005). "Efficient methods for finding transition states in
chemical reactions: Comparison of improved dimer method and partitioned
rational function optimization method." Journal of Chemical Physics 123(22).
Hibino, T., A. Hashimoto, et al. (2002). "An intermediate-temperature solid oxide fuel
cell providing higher performance with hydrocarbons than with hydrogen."
Electrochemical and Solid State Letters 5(11): A242-A244.
Hibino, T., A. Hashimoto, et al. (2003). "Ru-catalyzed anode materials for direct
hydrocarbon SOFCs." Electrochimica Acta 48(17): 2531-2537.
Hirabayashi, D., A. Hashimoto, et al. (2004). "Bi-based oxide anodes for direct
hydrocarbon SOFCs at intermediate temperatures." Electrochemical and Solid
State Letters 7(5): A108-A110.
Hor, P. H., R. L. Meng, et al. (1987). "Superconductivity above 90 K in the Square-
Planar Compound System A2Cu3O6+x with a = Y, La, Nd, Sm, Eu, Gd, Ho, Er,
and Lu." Physical Review Letters 58(18): 1891-1894.
Huang, K. Q., M. Feng, et al. (1996). "Characterization of Sr-doped LaMnO3 and
LaCoO3 as cathode materials for a doped LaGaO3 ceramic fuel cell." Journal of
the Electrochemical Society 143(11): 3630-3636.
Huang, K. Q., R. S. Tichy, et al. (1998). "Superior perovskite oxide-ion conductor;
strontium- and magnesium-doped LaGaO3: I, phase relationships and electrical
properties." Journal of the American Ceramic Society 81(10): 2565-2575.
Huang, Y. H., R. I. Dass, et al. (2006). "Synthesis and characterization of Sr2MgMoO6-
delta - An anode material for the solid oxide fuel cell." Journal of the
Electrochemical Society 153(7): A1266-A1272.
Huang, Y. H., R. I. Dass, et al. (2006). "Double perovskites as anode materials for solid-
oxide fuel cells." Science 312(5771): 254-257.
Hui, S. Q. and A. Petric (2002). "Evaluation of yttrium-doped SrTiO3 as an anode for
solid oxide fuel cells." Journal of the European Ceramic Society 22(9-10): 1673-
1681.

183
Ingram, D. B. and S. Linic (2009). "First-Principles Analysis of the Activity of Transition
and Noble Metals in the Direct Utilization of Hydrocarbon Fuels at Solid Oxide
Fuel Cell Operating Conditions." Journal of the Electrochemical Society 156(12):
B1457-B1465.
Ishihara, T. (2009). "Perovskite oxide for solid oxide fuel cells". New York, Springer.
Ishihara, T., H. Matsuda, et al. (1994). "Improved Oxygen-Ion Conductivity of NdAlO3
Perovskite-Type Oxide by Doping with Ga." Solid State Ionics 70: 234-238.
Ishihara, T., H. Matsuda, et al. (1994). "Doped LaGaO3 Perovskite-Type Oxide as a New
Oxide Ionic Conductor." Journal of the American Chemical Society 116(9): 3801-
3803.
Ishihara, T., H. Matsuda, et al. (1995). "Effects of Rare-Earth Cations Doped for La Site
on the Oxide Ionic-Conductivity of LaGaO3-Based Perovskite-Type Oxide." Solid
State Ionics 79: 147-151.
Iwakuni, H., Y. Shinmyou, et al. (2007). "Direct decomposition of NO into N2 and O2 on
BaMnO3-based perovskite oxides." Applied Catalysis B-Environmental 74(3-4):
299-306.
Jarlborg, T. (2000). "Tuning of the electronic screening and electron-phonon coupling in
doped SrTiO3 and WO3." Physical Review B 61(15): 9887-9890.
Ji, Y., J. Liu, et al. (2003). "Single intermedium-temperature SOFC prepared by glycine-
nitrate process." Journal of Alloys and Compounds 353(1-2): 257-262.
Jiang, S. P. and S. H. Chan (2004). "A review of anode materials development in solid
oxide fuel cells." Journal of Materials Science 39(14): 4405-4439.
Juhl, M., S. Primdahl, et al. (1996). "Performance/structure correlation for composite
SOFC cathodes." Journal of Power Sources 61(1-2): 173-181.
Kanamura, F. (1997). "Perovskite Related Compound." Kikan Kagaku Sosetsu 32: 9.
Kaxiras, E., Y. Baryam, et al. (1987). "Abinitio Theory of Polar Semiconductor Surfaces
.1. Methodology and the (2x2) Reconstructions of Gaas(111)." Physical Review B
35(18): 9625-9635.
Kaxiras, E., Y. Baryam, et al. (1987). "Ab initio Theory of Polar Semiconductor Surfaces
.2. (2x2) Reconstructions and Related Phase-Transitions of GaAs(111)." Physical
Review B 35(18): 9636-9643.

184
Kaxiras, E., K. C. Pandey, et al. (1986). "Role of Chemical-Potentials in Surface
Reconstruction - a New Model and Phase-Transition on GaAs(111)2x2." Physical
Review Letters 56(26): 2819-2822.
Kee, R. J., H. Y. Zhu, et al. (2005). "Solid-oxide fuel cells with hydrocarbon fuels."
Proceedings of the Combustion Institute 30: 2379-2404.
Kilner, J. A. (2000). "Fast oxygen transport in acceptor doped oxides." Solid State Ionics
129(1-4): 13-23.
Kohn, W., A. D. Becke, et al. (1996). "Density functional theory of electronic structure."
Journal of Physical Chemistry 100(31): 12974-12980.
Kohn, W. and L. J. Sham (1965). "Self-Consistent Equations Including Exchange and
Correlation Effects." Physical Review 140(4A): 1133-&.
Kolodiazhnyi, T. and A. Petric (2005). "The applicability of Sr-deficient n-type SrTiO3
for SOFC anodes." Journal of Electroceramics 15(1): 5-11.
Kramer, S., M. Spears, et al. (1994). "Conduction in Titanate Pyrochlores - Role of
Dopants." Solid State Ionics 72: 59-66.
Kresse, G., O. Dulub, et al. (2003). "Competing stabilization mechanism for the polar
ZnO(0001)-Zn surface." Physical Review B 68(24).
Kresse, G. and J. Furthmuller (1996). "Efficient iterative schemes for ab initio total-
energy calculations using a plane-wave basis set." Physical Review B 54(16):
11169-11186.
Kresse, G. and D. Joubert (1999). "From ultrasoft pseudopotentials to the projector
augmented-wave method." Physical Review B 59(3): 1758-1775.
Kuroda, K., W. Sugimoto, et al. (1998). "Synthesis and structures of carrier doped
titanates with the Ruddlesden-Popper structure (Sr0.95La0.05)(n+1)TinO3n+1 (n = 1,
2)." Solid State Ionics 108(1-4): 315-319.
Kurokawa, H., L. M. Yang, et al. (2007). "Y-doped SrTiO3 based sulfur tolerant anode
for solid oxide fuel cells." Journal of Power Sources 164(2): 510-518.
Laursen, S. and S. Linic (2009). "Geometric and electronic characteristics of active sites
on TiO2-supported Au nano-catalysts: insights from first principles." Physical
Chemistry Chemical Physics 11(46): 11006-11012.
Laursen, S. and S. Linic (2009). "Strong Chemical Interactions Between Au and Off-
Stoichiometric Defects on TiO2 as a Possible Source of Chemical Activity of
Nanosized Au Supported on the Oxide." Journal of Physical Chemistry C
113(16): 6689-6693.
185
Lee, S., G. Kim, et al. (2008). "SOFC anodes based on infiltration of La0.3Sr0.7TiO3."
Journal of the Electrochemical Society 155(11): B1179-B1183.
Li, X., H. L. Zhao, et al. (2008). "La and Sc co-doped SrTiO3 as novel anode materials
for solid oxide fuel cells." Electrochemistry Communications 10(10): 1567-1570.
Li, X., H. L. Zhao, et al. (2009). "Electrical conduction behavior of La, Co co-doped
SrTiO3 perovskite as anode material for solid oxide fuel cells." International
Journal of Hydrogen Energy 34(15): 6407-6414.
Lin, Y. B., Z. L. Zhan, et al. (2006). "Improving the stability of direct-methane solid
oxide fuel cells using anode barrier layers." Journal of Power Sources 158(2):
1313-1316.
Lu, C., W. L. Worrell, et al. (2003). "SOFCs for direct oxidation of hydrocarbon fuels
with samaria-doped ceria electrolyte." Journal of the Electrochemical Society
150(3): A354-A358.
Luo, W., W. Duan, et al. (2004). "Structural and electronic properties of n-doped and p-
doped SrTiO3." Physical Review B 70: 214109.
Lytle, F. W. (1964). "X-Ray Diffractometry of Low-Temperature Phase Transformations
in Strontium Titanate." Journal of Applied Physics 35(7): 2212-&.
Ma, Q. L., F. Tietz, et al. (2011). "Nonstoichiometric Y-substituted SrTiO3 materials as
anodes for solid oxide fuel cells." Solid State Ionics 192(1): 535-539.
Marina, O. A, N. L. Canfield, et al. (2002). "Thermal, electrical, and electrocatalytical
properties of lanthanum-doped strontium titanate." Solid State Ionics 149(1-2):
21-28.
Marina, O. A. and M. Mogensen (1999). "High-temperature conversion of methane on a
composite gadolinia-doped ceria-gold electrode." Applied Catalysis a-General
189(1): 117-126.
Matsuzaki, Y. and I. Yasuda (2000). "The poisoning effect of sulfur-containing impurity
gas on a SOFC anode: Part I. Dependence on temperature, time, and impurity
concentration." Solid State Ionics 132(3-4): 261-269.
McIntosh, S. and R. J. Gorte (2004). "Direct hydrocarbon solid oxide fuel cells."
Chemical Reviews 104(10): 4845-4865.
McIntosh, S., J. M. Vohs, et al. (2002). "An examination of lanthanide additives on the
performance of Cu-YSZ cermet anodes." Electrochimica Acta 47(22-23): 3815-
3821.

186
Meyer, B. (2006). Surface Phase Diagrams from Ab Initio Thermodynamics.
Computational Nanoscience: Do It Yourself! S. B. J. Grotendorst, D. Marx.
Julich, John con Neumann Institute for Computing. 31: 411-418.
Minh, N. Q. (1993). "Ceramic Fuel-Cells." Journal of the American Ceramic Society
76(3): 563-588.
Minh, N. Q. (2004). "Solid oxide fuel cell technology—features and applications." Solid
State Ionics 174(1-4): 271.
Mogensen, M. and K. Kammer (2003). "Conversion of hydrocarbons in solid oxide fuel
cells." Annual Review of Materials Research 33: 321-331.
Monkhorst, H. J. and J. D. Pack (1976). "Special Points for Brillouin-Zone Integrations."
Physical Review B 13(12): 5188-5192.
Moos, R., T. Bischoff, et al. (1997). "Solubility of lanthanum in strontium titanate in
oxygen-rich atmospheres." Journal of Materials Science 32(16): 4247-4252.
Moos, R., A. Gnudi, et al. (1995). "Thermopower of Sr1−xLaxTiO3 ceramics." Journal of
Applied Physics 78(8): 5042.
Moos, R. and K. H. Hardtl (1997). "Defect chemistry of donor-doped and undoped
strontium titanate ceramics between 1000 degrees and 1400 degrees C." Journal
of the American Ceramic Society 80(10): 2549-2562.
Mosey, N. J. and E. A. Carter (2007). "Ab initio evaluation of Coulomb and exchange
parameters for DFT+U calculations." Physical Review B 76(15).
Mott, N. F. (1968). "Metal-Insulator Transition." Reviews of Modern Physics 40(4): 677
Mukherjee, J. and S. Linic (2007). "First-principles investigations of electrochemical
oxidation of hydrogen at solid oxide fuel cell operating conditions." Journal of the
Electrochemical Society 154(9): B919-B924.
Munoz-Garcia, A. B., D. E. Bugaris, et al. (2012). "Unveiling Structure-Property
Relationships in Sr2Fe1.5Mo0.5O6-delta, an Electrode Material for Symmetric
Solid Oxide Fuel Cells." Journal of the American Chemical Society 134(15):
6826-6833.
Nagel, F. (2008). Electricity from wood through the combination of gasification and solid
oxide fuel cells. Zurich, Swiss Federal Institute of Technology Zurich. Ph.D. .
Neagu, D. and J. T. S. Irvine (2010). "Structure and Properties of La0.4Sr0.4TiO3 Ceramics
for Use as Anode Materials in Solid Oxide Fuel Cells." Chemistry of Materials
22(17): 5042-5053.

187
Neagu, D. and J. T. S. Irvine (2011). "Enhancing Electronic Conductivity in Strontium
Titanates through Correlated A and B-Site Doping." Chemistry of materials 23(6):
1607.
Nernst, W. (1987). Verfahren zur Erzeugung von Elektrischen Glühlicht 104: 872.
Nguyen, Q. M. and T. Takahashi (1995). "Science and technology of ceramic fuel cells".
Amsterdam ; New York, Elsevier Science.
Noland, J. A. (1954). "Optical Absorption of Single-Crystal Strontium Titanate."
Physical Review 94(3): 724-724.
Norskov, J. K., J. Rossmeisl, et al. (2004). "Origin of the overpotential for oxygen
reduction at a fuel-cell cathode." Journal of Physical Chemistry B 108(46):
17886-17892.
Ohta, S., T. Nomura, et al. (2005). "High-temperature carrier transport and thermoelectric
properties of heavily La- or Nb-doped SrTiO3 single crystals." Journal of Applied
Physics 97(3): 034106.
Padilla, J. and D. Vanderbilt (1997). "Ab initio study of BaTiO3 surfaces." Physical
Review B 56(3): 1625-1631.
Perdew, J. P., K. Burke, et al. (1996). "Generalized gradient approximation made
simple." Physical Review Letters 77(18): 3865-3868.
Pisani, C., M. Busso, et al. (2005). "Local-MP2 electron correlation method for
nonconducting crystals." Journal of Chemical Physics 122(9).
Pojani, A., F. Finocchi, et al. (1999). "Polarity on the SrTiO3 (111) and (110) surfaces."
Surface Science 442(2): 179-198.
Porat, O., C. Heremans, et al. (1997). "Stability and mixed ionic electronic conduction in
Gd-2(Ti1-xMox)(2)O-7 under anodic conditions." Solid State Ionics 94(1-4): 75-
83.
Ratner, M. A. and G. C. Schatz (2000). "An introduction to quantum mechanics in
chemistry". Upper Saddle River, NJ, Prentice Hall.
Reuter, K. and M. Scheffler (2001). "Surface core-level shifts at an oxygen-rich Ru
surface: O/Ru(0001) vs. RuO2(110)." Surface Science 490(1-2): 20-28.
Reuter, K. and M. Scheffler (2003). "First-principles atomistic thermodynamics for
oxidation catalysis: Surface phase diagrams and catalytically interesting regions."
Physical Review Letters 90(4).

188
Robertson, J., K. Xiong, et al. (2006). "Band gaps and defect levels in functional oxides."
Thin Solid Films 496(1): 1-7.
Rogal, J., K. Reuter, et al. (2007). "CO oxidation at Pd(100): A first-principles
constrained thermodynamics study." Physical Review B 75(20): 205433.
Ruiz-Morales, J. C., J. Canales-Vazquez, et al. (2006). "Disruption of extended defects in
solid oxide fuel cell anodes for methane oxidation." Nature 439(7076): 568-571.
Sasaki, K., K. Susuki, et al. (2006). "H2S poisoning of solid oxide fuel cells." Journal of
the Electrochemical Society 153(11): A2023-A2029.
Schooley, J. F., W. R. Hosler, et al. (1965). "Dependence of Superconducting Transition
Temperature on Carrier Concentration in Semiconducting SrTiO3." Physical
Review Letters 14(9): 305-&.
Seuter, A. M. J. (1974). "Defect Chemistry and Electrical Transport Properties of
Barium-Titanate." Philips Research Reports: 1-84.
Shanthi, N. and D. D. Sarma (1998). "Electronic structure of electron doped SrTiO3:
SrTiO3-delta and Sr1-xLaxTiO3." Physical Review B 57(4): 2153-2158.
Shao, Z. P. and S. M. Haile (2004). "A high-performance cathode for the next generation
of solid-oxide fuel cells." Nature 431(7005): 170-173.
Shin, S., H. Arakawa, et al. (1979). "Absorption of No in the Lattice of an Oxygen-
Deficient Perovskite Srfeo3-X and the Infrared Spectroscopic Study of the System
No - Srfeo3-X." Materials Research Bulletin 14(5): 633-639.
Shiqiang Hui, A. P. (2002). "Evaluation of yttrium-doped SrTiO3 as an anode for solid
oxide fuel cells " Shiqiang Hui and Anthony Petric(22): 1673.
Sholl, D. S. and J. A. Steckel (2009). "Density functional theory : a practical
introduction". Hoboken, N.J., Wiley.
Sin, A., E. Kopnin, et al. (2005). "Stabilisation of composite LSFCO-CGO based anodes
for methane oxidation in solid oxide fuel cells." Journal of Power Sources 145(1):
68-73.
Singh, P. and N. Q. Minh (2004). "Solid Oxide Fuel Cells: Technology Status."
International Journal of Applied Ceramic Technology 1(1): 5.
Singhal, S. C. and K. Kendall (2003). "High-temperature solid oxide fuel cells :
fundamentals, design, and applicatons". New York, Elsevier Advanced
Technology.

189
Skorodumova, N. V., S. I. Simak, et al. (2002). "Quantum origin of the oxygen storage
capability of ceria." Physical Review Letters 89(16): -.
Slater, J. C. (1950). "The Lorentz Correction in Barium Titanate." Physical Review 78(6):
748-761.
Slater, P. R., D. P. Fagg, et al. (1997). "Synthesis and electrical characterisation of doped
perovskite titanates as potential anode materials for solid oxide fuel cells."
Journal of Materials Chemistry 7(12): 2495-2498.
Slater, P. R. and J. T. S. Irvine (1999). "Niobium based tetragonal tungsten bronzes as
potential anodes for solid oxide fuel cells: synthesis and electrical
characterisation." Solid State Ionics 120(1-4): 125-134.
Slater, P. R. and J. T. S. Irvine (1999). "Synthesis and electrical characterisation of the
tetragonal tungsten bronze type phases, (Ba/Sr/Ca/La)0 6MxNb1-xO3-delta (M = Mg,
Ni, Mn, Cr, Fe, In, Sn): evaluation as potential anode materials for solid oxide
fuel cells." Solid State Ionics 124(1-2): 61-72.
Slater, P. R., J. T. S. Irvine, et al. (1998). "The structure of the oxide ion conductor
La0.9Sr0.1Ga0.8Mg0.2O2.85 by powder neutron diffraction." Solid State Ionics 107(3-
4): 319-323.
Steele, B. C. H. (2000). "Appraisal of Ce1-yGdyO2-y/2 electrolytes for IT-SOFC operation
at 500 degrees C." Solid State Ionics 129(1-4): 95-110.
Sun, C. W. and U. Stimming (2007). "Recent anode advances in solid oxide fuel cells."
Journal of Power Sources 171(2): 247-260.
Sun, C. W., J. Sun, et al. (2006). "Mesoscale organization of nearly monodisperse
flowerlike ceria microspheres." Journal of Physical Chemistry B 110(27): 13445-
13452.
Suthirakun, S., S. C. Ammal, et al. (2011). "Density functional theory study on the
electronic structure of n- and p-type doped SrTiO3 at anodic solid oxide fuel cell
conditions." Physical Review B 84(20).
Suthirakun, S., S. C. Ammal, et al. (2012). "Obtaining mixed ionic/electronic
conductivity in perovskite oxides in a reducing environment: A computational
prediction for doped SrTiO3." Solid State Ionics 228: 37-45.
Suthirakun, S., S. C. Ammal, et al. (2011). "Density functional theory study on the
electronic structure of n- and p-type doped SrTiO3 at anodic solid oxide fuel cell
conditions." Physical Review B 84(20): 205102.

190
Takahash.T and H. Iwahara (1971). "Ionic Conduction in Perovskite-Type Oxide Solid
Solution and Its Application to Solid Electrolyte Fuel Cell." Energy Conversion
11(3): 105-&.
Tao, S. W. and J. T. S. Irvine (2003). "A redox-stable efficient anode for solid-oxide fuel
cells." Nature Materials 2(5): 320-323.
Tao, S. W. and J. T. S. Irvine (2004). "Discovery and characterization of novel oxide
anodes for solid oxide fuel cells." Chemical Record 4(2): 83-95.
Teraoka, Y., T. Harada, et al. (1998). "Reaction mechanism of direct decomposition of
nitric oxide over Co- and Mn-based perovskite-type oxides." Journal of the
Chemical Society-Faraday Transactions 94(13): 1887-1891.
Tournoux, M., M. Ganne, et al. (1992). "Htb-Like 6-Membered Rings of Octahedra in
Some New Oxides - Structural Aspects and Related Properties." Journal of Solid
State Chemistry 96(1): 141-153.
Turrillas, X., A. P. Sellars, et al. (1988). "Oxygen Ion Conductivity in Selected Ceramic
Oxide Materials." Solid State Ionics 28: 465-469.
Van Benthem, K., C. Elsasser, et al. (2001). "Bulk electronic structure of SrTiO3:
Experiment and theory." Journal of Applied Physics 90(12): 6156-6164.
Vernoux, P., E. Djurado, et al. (2001). "Catalytic and electrochemical properties of doped
lanthanum chromites as new anode materials for solid oxide fuel cells." Journal of
the American Ceramic Society 84(10): 2289-2295.
VI, A., F. Aryasetiawan, et al. (1997). "First-principles calculations of the electronic
structure and spectra of strongly correlated systems: The LDA+U method."
Journal of Physics-Condensed Matter 9(4): 767-808.
Vidyasagar, K., A. Reller, et al. (1985). "Oxygen Vacancy Ordering in Superlattices of
the 2 Novel Oxides, La2Ni2O5 and La2Co2O5, Prepared by Low-Temperature
Reduction of the Parent Perovskites." Journal of the Chemical Society-Chemical
Communications(1): 7-8.
Wang, S. R., T. Kobayashi, et al. (2000). "Electrical and ionic conductivity of Gd-doped
ceria." Journal of the Electrochemical Society 147(10): 3606-3609.
Xia, C. R., W. Rauch, et al. (2002). "Sm0.5Sr0.5CoO3 cathodes for low-temperature
SOFCs." Solid State Ionics 149(1-2): 11-19.
Xiao, G., X. Dong, et al. (2011). "Synthesis and characterizations of A-site deficient
perovskite Sr0.9Ti0.8-xGaxNb0.2O3." Materials Research Bulletin 46(1): 57-61.

191
Xiao, G. L. and F. L. Chen (2011). "Ni modified ceramic anodes for direct-methane solid
oxide fuel cells." Electrochemistry Communications 13(1): 57-59.
Yasuda, H., T. Nitadori, et al. (1993). "Catalytic Decomposition of Nitrogen Monoxide
over Valency-Controlled La2CuO4-Based Mixed Oxides." Bulletin of the
Chemical Society of Japan 66(11): 3492-3502.
Ye, X. F., B. Huang, et al. (2007). "Preparation and performance of a Cu-CeO2-ScSZ
composite anode for SOFCs running on ethanol fuel." Journal of Power Sources
164(1): 203-209.
Yokoya, T., T. Sato, et al. (1999). "Electronic structure of Ce1-xSrxTiO3: Comparison
between substitutional and vacancy doping." Physical Review B 59(3): 1815-
1818.
Yun, J. N., Z. Y. Zhang, et al. (2010). "First-principles study of structural stability and
electronic structure of La-doped Sr1.9375La0.0625TiO3.968 (75)." Journal of Applied
Physics 107(10).
Zha, S. W., Z. Cheng, et al. (2007). "Sulfur poisoning and regeneration of Ni-based
anodes in solid oxide fuel cells." Journal of the Electrochemical Society 154(2):
B201-B206.
Zha, S. W., P. Tsang, et al. (2005). "Electrical properties and sulfur tolerance of
La0.75Sr0.25Cr1-xMnxO3 under anodic conditions." Journal of Solid State Chemistry
178(6): 1844-1850.
Zhang, C., C. L. Wang, et al. (2008). "Substitutional position and insulator-to-metal
transition in Nb-doped SrTiO3." Materials Chemistry and Physics 107(2-3): 215-
219.
Zhu, W. Z. and S. C. Deevi (2003). "A review on the status of anode materials for solid
oxide fuel cells." Materials Science and Engineering a-Structural Materials
Properties Microstructure and Processing 362(1-2): 228-239.
Zhukovskii, Y. F., E. A. Kotomin, et al. (2009). "A comparative ab initio study of bulk
and surface oxygen vacancies in PbTiO3, PbZrO3 and SrTiO3 perovskites." Solid
State Communications 149(33-34): 1359-1362.