
Rajat Kathuria Sahana Roy Chowdhury Mansi Kedia …icrier.org/pdf/appreport.pdfMansi Kedia Sugandha...
52
An Inquiry into the Impact of India’s App Economy Rajat Kathuria Sahana Roy Chowdhury Mansi Kedia Sugandha Srivastav April 2015 INDIAN COUNCIL FOR RESEARCH ON INTERNATIONAL ECONOMIC RELATIONS
-
Upload
nguyenhuong -
Category
Documents
-
view
216 -
download
0
Transcript of Rajat Kathuria Sahana Roy Chowdhury Mansi Kedia …icrier.org/pdf/appreport.pdfMansi Kedia Sugandha...

1
36
An Inquiry into the Impact of India’s App Economy
Rajat Kathuria
Sahana Roy Chowdhury
Mansi Kedia
Sugandha Srivastav
April 2015
INDIAN COUNCIL FOR RESEARCH ON INTERNATIONAL ECONOMIC RELATIONS

i
Table of Contents
1. Introduction ................................................................................................................................ 1
1.1 The App Revolution – An Opportunity for India .......................................................................... 2
2. The App Ecosystem ..................................................................................................................... 5
2.1 Core Activities of the App Ecosystem .......................................................................................... 6
2.1.1 Development ............................................................................................................................... 6
2.1.2 Distribution.................................................................................................................................. 7
2.1.3 Demand ....................................................................................................................................... 8
2.2 Drivers of the App Ecosystem ...................................................................................................... 8
2.2.1 Network Infrastructure ............................................................................................................... 8
2.2.2 Devices ........................................................................................................................................ 9
2.2.3 Operating Systems (OS) ............................................................................................................ 10
3. Impact Analysis ......................................................................................................................... 10
3.1 Literature Review on employment and growth multipliers of the App Economy ..................... 10
3.2 Estimating the employment multiplier for India’s App Economy ............................................. 13
4. Survey Analysis .......................................................................................................................... 16
4.1 Introduction ............................................................................................................................... 16
4.2 Who? The App Developer in India ............................................................................................ 17
4.3 What? The Preference of Users and Developers in India .......................................................... 18
4.4 Why? The Business of Apps in India .......................................................................................... 21
4.5 How? The Future of Apps in India ............................................................................................ 22
5. Case Studies .............................................................................................................................. 23
6. Conclusions and Policy Recommendations ............................................................................... 27
Bibliography .......................................................................................................................................... 30
Appendix 1: .............................................................................................. Error! Bookmark not defined.
Appendix 2A: ......................................................................................................................................... 34
Appendix 2B: ......................................................................................................................................... 35
Appendix 3: ........................................................................................................................................... 36
Appendix 4: ........................................................................................................................................... 38
Appendix 5: ........................................................................................................................................... 39
5.3 eGov AppStore ................................................................................................................................ 41
5.4 Make My Trip ............................................................................................................................ 43
5.5 Micromax ........................................................................................................................................ 45
5.6 Samsung .......................................................................................................................................... 45
5.7 Vodafone India .......................................................................................................................... 47
5.8 Firefox OS .................................................................................................................................. 48

ii
List of Figures, Tables and Boxes
Figure 1: The App Ecosystem ................................................................................................. 5
Figure 2: Selected Stakeholders across the Indian App Ecosystem .................................. 25
Table 1: Assumptions for different scenarios of the App Industry in the future ............ 14
Table 2: Multiplier Estimates under different scenarios ................................................... 15
Table 3: Estimates for change in employment for 50000 change in direct employment . 15
Table 4: No of app developers in cities................................................................................. 18
Table 5: Distribution of app developers in cities based on organization type .................. 18
Table 6: Number of Apps developed under each category ................................................ 19
Table 7: Number of developers by choice of operating system ......................................... 20
Table 8: Number of developers by choice of device ............................................................ 20
Table 9: Source of Financing for Application Developers ................................................. 21
Table 10: Choice of revenue models ..................................................................................... 22
Table 11: Barriers facing India’s app economy .................................................................. 23
Table 12: Intellectual Property Right (IPR) Protection in the App Industry .................. 23
Box 1: Truecaller........................................................................ Error! Bookmark not defined.
Box 2: Studies estimating employment potential of the app economy .............................. 12

1
1. Introduction
With close to a billion mobile subscribers in India, around three-quarters of the population
have access to a mobile phone. Mobiles are arguably the most ubiquitous modern technology
in some developing countries, more people have access to a mobile phone than to a bank
account, electricity or even clean water. In India mobile communications have been the most
visible manifestation of the extraordinary digital accomplishments seen in the past decade—
from providing basic access to education and health related information to making cash
payments to crowd sourcing- the growing list firmly establishes us as a ‘mobile first’
economy. Legacy communications systems i.e. fixed line access have been virtually
supplanted by mobile systems in India and in the rest of the developing world, as opposed to
being supplemented by them in richer countries. Not surprisingly therefore many mobile
innovations—such as multi-SIM card phones, low-value recharges and mobile payments—
have acquired the soubriquet of ‘reverse innovation’, having taken root in developing
economies and spreading from there. Our work shows that new mobile applications that are
embedded in local realities have a much better chance of success in addressing development
challenges compared to applications transplanted from elsewhere. In particular, locally
developed applications are much more likely to address existential concerns such as digital
literacy and affordability, among others.
One positive fallout of the success of mobile communications has been the rapid
development of highly innovative bite sized software programmes called mobile software
applications or simply ‘apps’ resident on smart hand held devices. These apps use data-
stream either continuously or on a one-off basis to deliver information and perform specific
functions.1 These functions enable gaming, social networking, navigation, utilities, health,
and education, among others, and are revolutionising the way phones are used. Apps differ
from traditional mobile value added services (MVAS) since they are palpably richer in
content, typically operate on smart devices and mostly depend on the internet to function2. It
is now convention to group SMS, MMS, call related services and data access as standard
services that lie outside the domain of what is classified as mobile application software or
apps.3
That the rapid growth of apps can have a transformative impact on livelihoods and businesses
is supported by empirical evidence that is being carefully collected across the world.4 By
making phones more powerful, apps, aided by high-speed networks and innovation can have
important productivity enhancing impacts throughout the economy. This new evidence on the 1 Kathuria, R. & Srivastav S. (2014) The Indian App Ecosystem. LirneAsia.The Ford Foundation. Retrieved
fromhttp://broadbandasia.info/wp-content/uploads/2013/03/The-Indian-App-Ecosystem-Final-
Report_afterEF2014.pdf 2 In connectivity constrained environments, developers are working on applications that are saved on a phone’s
secure digital card/ memory card with occasional need for internet based updates. For example, the Pink
Army Application developed by Mobile Harvest 3 TRAI (2012), Recommendations on Application Services. Retrieved from
http://www.trai.gov.in/WriteReadData/Recommendation/Documents/AS140512.pdf 4 For example, Qiang, Yamamichi, Hausman, and Altman, 2011, “ Mobile Applications for the Health Sector”,
ICT Sector Unit, World Bank and Qiang, Kuek, Dymond, and Esselaar, 2011, “Mobile Applications for
Agriculture and Rural Development”, ICT Sector Unit, World Bank among several other

2
‘app’ economy comes close on the heels of similar evidence for mobiles and internet that is
now firmly established as part of telecom folklore5.
It is useful to understand the value of a sound and competitive telecommunications system to
fully appreciate the route through which app impacts are created and transmitted. It has been
repeatedly shown that access to telecommunications improves productivity by, inter alia,
reducing information asymmetries and containing transactions costs. Because mobiles
substitute for fixed lines in developing economies, the growth impact of mobile phones is
higher than that for developed economies. 6 Evidence of the impacts of apps could be
expected to be along similar lines for developing economies. Unlike simple mobile
telephony, the app economy prospers only in the presence of an ecosystem rather than in
isolation.
The app economy shares complementarities with India’s well established IT software
services industry. The economic crisis of 2008 brought the industry under pressure and
companies resorted to layoffs and/or a slowdown in fresh recruitment. The challenge from
Chinese and Russian firms exacerbated the situation 7 . The upcoming app economy can
become a ready solution for graduating computer engineers/ experienced IT professionals in
India. With adequate training and orientation, India’s talented software engineers can be
absorbed in this steadily expanding sector. For the United States, apps are credited to have
created 519,000 jobs as of April 20128. The purpose of this study is to estimate the direct,
indirect and induced employment multipliers for India’s app economy and to identify
constraints in the development, distribution and usage of apps. No other study has so far
attempted to capture the economic and social impacts of apps in India.
1.1 The App Revolution – An Opportunity for India
Origins of the ‘app economy’ can be traced back to the launch of the iPhone in 2007 followed
by the App Store in 2008. Since then, the global market for apps has been growing at
unprecedented rates. Analysts estimate app downloads have increased from $ 24.9 billion in
2011 to $ 81.4 billion in 2013. This number is expected to rise up to $ 310 billion by 20169.
The App Store was one of the first commercially successful digital distribution platforms
because it challenged the monopoly of the ‘walled garden’ through which mobile operators 5For India, every 10% increase in mobile penetration rate leads to 1.5% increase in GDP with evidence of
network effects which magnify the economic impact when the level of mobile penetration exceeds a critical
mass of around 25%. On the other hand, the corresponding growth impact of internet has been lower; for
every 10% increase in the number of internet subscribers, there is an estimated 1.08% point increase in GDP
for India. Globally, the relative magnitudes of growth dividends of different communication technologies
establish a sort of hierarchy of impacts, with fixed being the lowest and broadband being the highest. See
Kathuria and Kedia, 2012, “India: Impact of Internet”, ICRIER 6 Qiang and Rossotto, ‘Economic Impacts of Broadband, Information and Communications for Development
2009: Extending Reach and increasing impact’ World Bank 2009 7 http://www.thenavigatorsindia.com/Docs/Software%20Industry%20Trends%20in%20India.pdf 8 Mandel and Scherer, 2012, “The Geography of the App Economy”, CTIA The Wireless Association 9 Gartner and MobiThinking retrieved from http://mobithinking.com/mobile-marketing-tools/latest-mobile-
stats/e#lotsofapps

3
controlled content. Mobile operators forced users to interface with their network for access
to apps and other value added services that were delivered on the operator’s network. Thus
operators were the gatekeepers, and content providers paid disproportionate amounts to
operators to feature their applications.
Competition triggered by technological advancements such as the development of Wi-FI
enabled smartphones and the emergence of special online stores allowed bypass of an
operators’ network. This weakened their grip on the app ecosystem. These developments
encouraged the shift from a telecom-operator controlled network to Wi-Fi as a means of
content delivery. This marked the inflexion point for the app revolution. On its part, Apple
permitted any developer from the public domain to design apps for the App Store and offered
a flat 70 percent of the total revenue to developers. By contrast, telecom operators had
adopted a 30:70 revenue share model in their favour. In 2011, Vodafone offered higher
revenue shares to developers to popularise apps. Content thus became more easily
discoverable and the App Store represented a one-stop-shop which interfaced between many
developers and buyers. The model of having a single platform to disseminate and facilitate
the payment of apps has been so successful that Apple’s competitors which include Google,
Nokia 10 , Research in Motion and Microsoft launched their own app stores. 11 Other
aggregators12 such as Vserv provide app developers with fresh avenues for monetization.
Apple helped advance a paradigm in which mobile devices evolved from being simply tools
for text and voice communication to pocket personal computers. As users wished to do more
with their mobile devices, the supply of apps kept pace with the increasing and diverse
demand. There are apps now that help users learn new languages, read music, navigate cities,
share files, read the news, learn recipes, and record important health-related information
among many other things. The proliferation of apps across many verticals and functions
underlines why this sector is regarded as an ‘economy’ in itself. It is also indicative of the
high degree of competition that exists amongst developers. It also demonstrates the shift in
value from handsets to apps, as users place more value on mobile software than hardware.13
India is a source of enormous demand for apps. Even though smartphone penetration is
estimated at just 10 percent of total mobile users,14 India experiences 100 million downloads
per month15 placing it amongst the top five regions for Google Play, the official Android
app store.16 The number of 3G SIMS in India is also expected to increase from 35 million in
10 Nokia, now acquired by Microsoft encourages software development on Windows as compared to Symbian.
However, some app developers continue to work on Symbian. Please refer to Section 4 on survey data
analysis. 11 Kathuria, R. & Srivastav S. (2014). The Indian App Ecosystem. LirneAsia.The Ford Foundation. Retrieved
from http://broadbandasia.info/wp-content/uploads/2013/03/The-Indian-App-Ecosystem-Final-
Report_afterEF2014.pdf 12 Aggregators consolidate ad inventory - various apps and space therein as well as the mobile websites 13 Pappas A. (2013). App Economy Forecasts 2013-2016, Vision Mobile. Retrieved from
http://www.visionmobile.com/product/app-economy-forecasts-2013-2016/ 14 Avendus Estimates 15 Law, Abhishek. "Developing India's app market." The Hindu [New Delhi] 1 Aug. 2012: The Hindu Business
Line. Web. 20 Jan. 2014. 16 App Annie Data

4
2012 to an impressive 272 million by 2017.17 India also significantly contributes to app
development as roughly ten percent of apps worldwide are developed by Indians either based
abroad or at home.18 In 2010, Indian service providers debuted in app distribution when
Bharti launched the Airtel App Central online store. The success however was limited due to
the uncompetitive revenue sharing contracts mentioned above. App distribution in India is
therefore, dominated by international app stores such as Android’s Google Play, Nokia’s Ovi
Store and Apple’s App Store. This is in sharp contrast to other Asian economies such as
South Korea and China where local app stores play an equal, if not greater role, in the
dissemination and payment of apps than their international counterparts.19
India’s rapidly expanding middle class will inevitably make the switch from feature phones
to smartphones creating vast opportunities for new entrants. 20 Today, over half of Indian
smartphone users access the internet daily through their device and nearly all never leave
their homes without it. 21 This shows the growing importance of smartphones to Indian
society. Affordability of mobile data is another key factor driving this trend. According to
the International Telecommunication Union (ITU) India is one the cheapest countries for a
phone plan with data.22
India also represents an opportunity at the ‘Bottom of the Pyramid’ users due to the huge
potential demand for affordable smartphones and apps from this segment. Unlike developed
markets where the Android/Apple duopoly on the OS level is firmly established due to the
high penetration of Apple iPhones and Samsung smartphones, India offers space for other
operating systems, particularly those that are designed to operate on lower-end devices (OS
platforms such as Symbian still enjoy significant market share in India and the Firefox OS is
expected to gain traction). 23 Other platforms such as Android One are also targeted at
smartphone first timers, but yet to take off in India. There is a corresponding opportunity for
handset manufacturers to design and manufacture devices that can support apps at suitable
price-points for this segment. India has been acknowledged as a highly price sensitive market
that explains in part the dominance of the Android OS24. As stated above, India features
among the top five download regions for Google Play by number25 However, by revenue it is
17 According to Analysys Mason 3G users in India will touch 272 million by 2017 from 35 million in 2012
Refer to http://www.telecomlead.com/3g/3g-users-in-india-to-touch-272-million-by-2017-from-35-million-in-
2012-analysys-mason-38292/ Web.Jan 20, 2014. 18 VisionMobile 19 Salz P. (2014) Apponomics. InMobi 20 As of 2013, there were 51 million smartphone users in India but this number is likely to mushroom to 104
million by the end of 2014. The shipment of smartphones increased by 166 percent (in quarter 2, 2013)
making India the fastest growing smartphone market in the world. Figures are from IDC. 21 Google Our Mobile Planet 22 The average phone plan with 500MB of data costs 85 USD in the United States whereas the same plan
costs, on average, only 10 USD in terms of US dollar Purchasing-power Parity (PPP) in a country like India 23 Saxena, Anupam. "Mozilla partners Spice and Intex to launch $25 Firefox phones in India." The Times of
India [New Delhi] 11 June. 2014: Web. 12 June. 2014. 24 According to IDC, Google's mobile operating system has a 91% market share in the country, giving it an
overwhelming lead over its competitors. Android totally dominates the market because it is used by all major
smartphone players in India. Local vendors like Micromax and Karbonn have adopted it. Android powers
phones costing Rs 3,000 to Rs 45,000 and that helps it attract a lot of consumers 25 App Annie Data

5
not among the top ten 26 thereby demonstrating the challenge of monetizing its large base of
downloads. Challenge, as the cliché suggests is another course to opportunity that in this case
can be exploited by handset manufacturers, OS companies and app developers alike, given
the sheer scale of the local Indian market.
That data will be the centrepiece of India’s second telecommunication revolution is a widely
held and an eminently justifiable view the promise of the app economy within this paradigm
needs therefore to be better understood. For example, how apps will contribute to India’s
employment, especially of its youth, is an important issue worthy of rigorous investigation.
The presence of a large, skilled pool of young software developers coupled with high growth
rates in the smartphone and data markets suggests that the Indian app economy has reached
the point of inflexion. According to experts familiar with apps, the next break-through
innovation in apps will be Indian.27
2. The App Ecosystem
The app economy is part of the internet ecosystem which consists of network infrastructure,
devices, content and users. Apps are a subset of content and can add to the attractiveness of
the broadband network by providing services that are of considerable practical use. Since it is
part of a highly networked and interdependent ecosystem, the app economy cannot be viewed
in isolation. Its functioning depends on the existence of a robust network infrastructure,
appropriate devices and a supportive OS landscape. Its general purpose nature makes it
ubiquitous across several verticals of which healthcare, education, business and governance,
among others, generate considerable interest due to their ability to address pervasive supply
side bottlenecks.
Figure 1: The App Ecosystem
Source: Adapted from Kathuria and Srivastav
26 Ibid. 27 "Next Breakthrough App Will Come from India: Microsoft." The Economic Times [New Delhi] 3 April.
2014: Web. 12 June. 2014.

6
Figure 1 captures the different dimensions of an app ecosystem. The app economy consists of
three principal activities which are app development, distribution and demand represented by
the nodes of the pyramid. The three main factors that influence the core activities of the app
economy are network infrastructure, devices and the OS represented as different layers of the
pyramid. Each of these dimensions is discussed below.
2.1 Core Activities of the App Ecosystem
2.1.1 Development
Most app stores allow almost anyone to submit an app for consideration. While development
of an app could be inexpensive, the challenge lies in overcoming the last mile constraint to
reach the final user. App developers design apps either on a contractual basis (i.e. for specific
clients) or independently - either as free-lance developers or as start ups. According to Vision
Mobile’s Developer Segmentation model,28 app developers are a heterogeneous lot-they can
be classified in terms of their main objectives. The first category of developers makes apps in
the pursuit of creativity. This category often includes the youth, free-lance developers and
hobbyists. The second category of app developers is motivated by revenue generation. This
category includes large gaming companies such as Rovio and Zynga as well as companies
such as Zomato which design apps keeping in mind a strategic business model. Such profit-
maximising developers engage in contractual app development which may be commissioned
by business enterprises. They typically comprise 42 percent of the developer population and
48 percent of the app economy revenues globally.29 This group also represents the “mobile
internet only” or “mobile first” businesses. The final category of developers make, or get
made, apps for the purpose of extending a business. This category includes known names
such as Microsoft, Adobe, Make My Trip and The Economist among others who wish to
establish presence on mobile. There is an emerging overlap between the second and third
category of app developers. The activities of these different developers are supported by a
host of secondary services that include app analytics, mobile advertising, testing, API and
cloud computing services.
India has a vibrant developer community and locally hosts an estimated 75,000 developers.30
VisionMobile, which conducts the most extensive quarterly app developer survey in the
world, found that after the US, the largest nationality of developers is Indian,31 although
roughly half of them are based outside India.32 Of those who operate within India, it is
unclear how many create apps that are ‘local’ in nature (in terms of language and catering to
local needs and tastes). The local market for apps is constrained by a restraining cycle in
which inadequate local content leads domestic users to consume international apps, which in
turn further discourages Indian developers to create and market local content.
28 Voskoglou C. (2013). Developer Segmentation 2013. VisionMobile. Retreived from
http://www.visionmobile.com/product/developer-segmentation-2013/ 29 Voskoglou C. (2013). Developer Segmentation 2013. VisionMobile. Retreived from
http://www.visionmobile.com/product/developer-segmentation-2013/Ibid. 30 Industry estimates 31 VisionMobile: State of Developer the Nation Series. 32 Ibid.

7
Appendix 1 lists the ten most popular Facebook linked33 app developers headquartered in
India by monthly average usage (MAU), as reported by Metrics Monk - an app analytics
firm.34 Most of these apps are an extension of existing services to a mobile platform or
gaming apps. Also, the majority user base for these apps developed in India comes from
within India with one exception being Hashcube, for which users are primarily from the US.
2.1.2 Distribution
The second element of the app economy’s core activities is app distribution. Due to the vast
numbers of independent app developers, a platform that aggregates apps and facilitates
payment will enhance efficiency in distribution. It would also help in new app discovery.
Currently, Android and iOS control over ninety percent of the smartphone market share
globally.35 Google Play hosts about 1300000 apps globally. The corresponding number for
Apple App Store is 120000036. While Apple only allows the official App Store to function
on its devices, Google operates on an open source ecosystem that allows access to any app
store. In several Asian economies, particularly those where local content is in high demand,
telecom operator managed app stores running on Google’s Android OS play a big role in
facilitating dissemination and payment for apps. For example in South Korea, T-store, “the
home-grown Android app store run by the local mobile operator, SK telecom”37 has a bigger
share than Google Play with 19 million registered users as of January 2013. 38 Another
appealing example of app distribution is the world’s first app store for government services.
Smart Apps Shop is an Emirati app store that runs on both the Android and iOS platforms. It
features over 100 apps that have been developed by UAE government agencies.39 “MyGov”40
is India’s initiative in this space.
International app stores continue to dominate the distribution of apps in India. An innovative
offline app distribution platform called Apps Daily addresses the current impediments of
inadequate connectivity and burdensome payments systems in the ecosystem. However, it is
unlikely to become the principal platform. Local app distribution platforms must attain
critical scale to incentivise app developers to create relevant content. The government has
33 Facebook-linked apps are those which are accessed or advertised via Facebook. 34 These statistics cover software developers who use the Facebook Platform (Facebook APIs) to design apps
that interact with Facebook features such as data storage and log in. To obtain demographic and geographical
data on Facebook-linked apps, Metricsmonk collects three data sets. The first data set consists of publicly
available data, such as app and publisher names, rankings, Facebook tiers and ratings. The second data set
consists of more specific user data which is obtained from multiple sources and verified using an algorithmic
approach. The third data set consists of historical data (Facebook historical real numbers) that provides
information on the conformation of the application ranking curve. Active users are then calculated based on
algorithms that regularly sample the data sets. The results are continuously verified against “real numbers” of
Metricmonk’s partners.
35 Gartner (Q2, 2013). 36 Statista, The Statistics Portal 37 Salz P. (2014) Apponomics. InMobi 38 Ibid. 39 Basu, Medha. “UAE launches world’s first smart government app store” Asia Pacific FutureGov. 31 March
2014: Web. 12 June. 2014. http://www.futuregov.asia/articles/2014/mar/31/uae-launches-worlds-first-smart-
government-app-sto/ 40 http://mygov.in/
8
taken a right step in this direction by launching its Mobile Seva Appstore41which has won the
UN Public Service Award 2014 under category 3 for “Promoting Whole of Government
Approaches in the Information Age”
2.1.3 Demand
The consumers of apps include enterprises, government agencies and individual users. Users
in India, like those globally show preference for communication, gaming and social
networking apps. 42 The average smartphone user in India has 17 apps on her device 43
compared to the average Android smartphone user in the OECD who has 26 apps and the
average Japanese user who has 41.44 Although low, app usage in India is set to grow as
digital technology becomes pervasive and acceptable. .
The most popular age group for app users in India is 18-25.45 Besides, there is a perceptible
gender skew since roughly 80 percent of the smartphone users are male, although it is likely
to become more equitable in the future. 46 Appendix 2A and 2B list the most popular
Facebook linked apps in the general and gaming categories respectively. 47 WhatsApp
Messenger and Facebook are the top free apps in India for Google Play while Teen Patti and
Candy Crush Saga are the top grossing. 48 Social Networking and Entertainment are the
popular genres. Indians also have a unique appetite for astrology/devotional apps. Among
popular apps in India, some are completely focused towards the Indian market (e.g.
Truecaller). The popularity of OperaMini, a browsing app which compresses websites to save
users’ data costs, illustrates the price sensitivity of the Indian consumer.
The potential for India to leverage the app ecosystem to achieve certain developmental goals
is still underutilised as app usage is skewed towards entertainment, gaming and social
networking. Apps that focus on initiatives such as agriculture, health, and education have not
scaled adequately because the ecosystem is itself underdeveloped.
2.2 Drivers of the App Ecosystem
2.2.1 Network Infrastructure
A robust network infrastructure in terms of both coverage and capability is necessary
(although not sufficient) to support growth of the app based economy. Internet penetration in
India is 17.4 percent,49 lowest among the BRICS (Brazil 50%, Russia 53%, China 42%,
41 https://apps.mgov.gov.in/index.jsp 42 Metrics Monk 43 Google, Our Mobile Planet, India 44 OECD (2013), “The App Economy”, OECD Digital Economy Papers, No. 230, OECD
Publishing.http://dx.doi.org/10.1787/5k3ttftlv95k-en 45 Ibid. 46 Google, Our Mobile Planet, India 47 The data presented in these tables are limited to being Facebook linked, however they do capture the major
trend in India. Similar data from Google Playstore or the Apple App Store can further build on some of these
findings. 48 Metrics Monk 49 EMarketer Report, May 2014. Retrieved from http://www.emarketer.com/Article.aspx?R=1010893

9
South Africa 41%).50 In particular, mobile broadband, at only 5 percent penetration 51 limits
scale. 92 percent of India’s subscribers access internet on wireless devices, the quality of
which is constrained by chronic spectrum shortage and deployment of dated wireless
technologies.52 2G and 3G wireless services have shown deterioration in recent times,53 and
4G is yet to mature. While there are apps that function offline, connectivity is vital for initial
downloads and for a significant number of apps that continuously depend on real time data
(e.g. WhatsApp, Skype, Facebook, Google Maps, Find my Friends etc.). The demand for
high bandwidth and therefore spectrum will increase as apps inevitably diversify to
education, healthcare and e-commerce. Moreover, with the introduction of HTML5, more
apps will be hosted on the cloud thereby necessitating a rise in mobile broadband coverage
and capability. The government recognises the need to improve internet connectivity through
deployment of the National Optical Fibre Network (NOFN) that seeks to provide high speed
internet to over 238,000 gram panchayats.54 A high speed fibre link to villages will help spur
uptake of 3G and newer generation technologies since backhaul vastly benefits from the
existence of a fibre based network. Meanwhile the market has stepped in to overcome the
weak network infrastructure through innovations such as dongles, community internet and
public hot spots etc. But ultimately connectivity on fibre is essential.
2.2.2 Devices
In India the penetration of smartphones currently stands at a negligible ten percent but it is
increasing rapidly. 55 The penetration of smartphones facilitates the growth of the app
economy since apps require devices with advanced computing capabilities and features such
as Wifi connectivity, touch screens, GPS, web browsing, graphic displays etc. Given
technological advances, mobile devices can now function as a wallet, camera, television,
alarm clock, calculator, address book, calendar, newspaper, gyroscope, and navigational
device combined56. Price of smartphones is critical for greater penetration and there is no
doubt that device prices are declining while becoming more powerful at the same time.
Penetration is thus set to grow but the app economy also requires scale to become viable.
Thus demand-side policies ought to also take into account growth of broadband-enabled
services to be effective.
Devices play a major role in influencing app development since the latter have to conform to
the characteristics of the mobile device. In India, the device ecosystem is rather fragmented
as companies cater to a market of multiple price points and several different types of mobile
devices. The high degree of fragmentation can potentially create interoperability issues for
app developers as they must ensure that their app functions optimally across different screen
sizes and hardware characteristics. Local content development requires app developers to
50 ITU 2013 51 Ibid. 52 TRAI Performance Indicators Report, December 2013 53 TRAI Performance Indicators Report, December 2013 54 DoT, National Broadband Policy, 2012. Delay in deployment of NOFN is well recognized. 55 According to IDC, smartphone shipments to India grew by 186% in Q1, 2014. 56 Maximisng Mobile World Bank 2012

10
collaborate with handset manufacturers and ensure that Indic scripts can be supported.
Smartphone manufacturers have responded to the local challenge and some progress is visible
towards leveraging the vast promise of local content and apps, although the full scope and
scale of these opportunities is yet to emerge57.
2.2.3 Operating Systems (OS)
The OS of mobile devices constitutes the software platform atop which apps operate.58 A
developer has to ensure that apps are compatible with the targeted OS platforms. Since
Android has the widest reach it is a popular choice for developers althoughApple is a good
choice for revenue generation.59 However, an app developer typically targets several OS
platforms. App distribution is closely linked to the OS landscape since OS managed app
stores are amongst the most popular. For users there is a potential lock-in due to the
switching costs associated with purchasing apps and learning to use them on a particular OS.
The incidence of lock-in is relatively more severe for Apple which operates a closed,
propriety system as opposed to Android which is open source.
The life cycle of an app is shaped by its lure at each stage, namely development, distribution
and consumption (demand). Each stage is inextricably linked to the supporting ecosystem
which consists of network infrastructure, mobile devices and OS platforms. Competition at
each node influences the life cycle of an app while policies provide the supportive
framework. This analytic structure allows us to explore the various levers of the app
ecosystem and how they interact with each other to deliver growth. The fragmentation that
arises from multiple operating systems and platforms continue to challenge India’s app
ecosystem.
3. Impact Analysis
3.1 Literature Review on employment and growth multipliers of the App Economy
Early studies estimated employment and growth effects of apps by primarily focusing on app
store sales and mobile advertising. With the app economy becoming more pervasive, a
realistic estimate of the impact must include spillover effects i.e. the jobs (and revenue) that
gets created outside app stores.60 When this factor is included, the estimates show that within
the app ecosystem contractual development generates the most revenue, followed by app
stores. In 2013, Vision Mobile estimated that contract development was responsible for 56%
57 Micromax, an Indian device manufacturer has launched Micromax Unite 2 which supports 21 vernacular
languages 58 Kathuria, R. & Srivastav S. (2014) The Indian App Ecosystem. LirneAsia.The Ford Foundation. Retrieved
from http://broadbandasia.info/wp-content/uploads/2013/03/The-Indian-App-Ecosystem-Final-
Report_afterEF2014.pdf 59 59 Pappas A. (2014) Developer Economics Q1 2014: State of the Developer Nation, VisionMobile. Retrieved
from http://www.visionmobile.com/product/developer-economics-q1-2014-state-developer-nation/ 60 According to Vision Mobile, revenue sources for the global App Economy in 2013 was majorly contributed
by contract development (Euro 27.8 bn), followed by non-app store subscriptions, licensing fees (Euro 10.5
bn), then app store sales (Euro 9.1 bn), in-app advertising (Euro 3.7 bn), and finally e-commerce sales (Euro
1 bn)

11
of the app economy revenue. Besides, 26% of app developers are engaged in developing apps
on commission61. Other revenue generating activities include in-app advertising, e-commerce
and other activities that support app development such as app analytics which are a small but
rapidly growing segment of the app economy.62
Given the newness of the app economy and its linkages with several other industries,
estimating its employment impact using standard econometric approaches is difficult. The
app economy’s networked nature makes it clear that employment generated in this sunrise
sector is not limited to developers but more significantly spills over upstream and
downstream to telecom, internet service providers, mobile device manufacturers, etc. which
comprise the app ecosystem. CTIA – The Wireless Association and the Application
Developers Alliance published a report in 2012 estimating that the app economy in the US
has created 519,000 jobs as of April 2012. 63 CTIA used online want ads that were looking for
app economy skills. A list of key words64 and phrases were put together to identify ads
related to app economy jobs. A sample based validation was carried out for the selected ads
to ensure that they truly represented app economy jobs. The study found that each ad
corresponded to roughly 7.2 core app economy jobs. 65 In addition, non-tech jobs were
estimated to be almost equal in number.66 Replicating this methodology for India would be
impractical since there isn’t any comparable sophisticated source of information for
employment opportunities that could help isolate demand for app related jobs. Web based
companies like Naukri and Monster at best provide trends in the job market. Arriving at
results using data from these sources will result in a specious estimate.
The other estimate of employment attributable to apps is the ACT4Apps study for Europe67.
It shows that the app economy created 794,000 jobs in 28 EU countries, of which 529,000 or
two-thirds are direct jobs. The remainder includes a host of non-technology jobs such as
management, sales, customer service, accounts, finance, etc.This is in contrast to the US
where half the jobs are direct68. In the US study a multiplier of 1.5 was assumed to quantify
the spill over into other sectors. For the EU, the assumed multiplier is 0.66 and both these
might be underestimates as higher employment impacts have been estimated in other studies.
In particular, a survey based analysis by Mulligan and Card69 finds that the EU app-developer
workforce stands at 1 million and the total app market employment is 1.8 million as per 2013
data reflecting a multiplier of 1.8.
61 Vision Mobile, Developer Economics Q1 2014, State of the Developer Nation, Retrieved from
http://www.visionmobile.com/product/developer-economics-q1-2014-state-developer-nation/ 62 Ibid. 63 Mandel, M. and Schere J. (2012), “The Geography of the App Economy”, CTIA – The Wireless Association
and Application Developers Alliance 64 Some of these words included Android, Blackberry API, iOS, IpAd, IPhone, etc. 65 Core App Economy jobs correspond to Direct Employment in the App economy. It refers to job profiles
related to developing, maintaining, and supporting applications for different platforms. 66 Several limitations to this study have been identified, including sample size, time of survey, etc. 67 The European App Economy: Creating Jobs and Driving Growth, September 2013 by Vision Mobile and
Plum Consulting. Study sponsored by ACT4Apps 68 The findings of the ACT 4 Apps report is based on Vision Mobile’s Q3 2013 Developer Economics global
survey which consists of more than 6000 responses 69 Mark Mulligan and David Card (2014), “Sizing the EU App Economy” Gigaom Research

12
While estimating a multiplier based on a deep understanding of the sector is helpful, it still is
not compelling enough for policy action. The approach to quantifying the relationship
between ICT indicators such as broadband (Internet) and macro variables such as
employment (GDP) that are popular rely on either the input-output method or the
multivariate regression technique or both. Raul Katz,70for example uses both multivariate
regression modelling and input-output analysis to estimate employment multipliers for
broadband. International cross sectional studies usually deploy regression models,71 but
those for regional economies use both input-output analysis and multi-variate regression72.
ICRIER’s studies on the growth dividend of increasing mobile and internet penetration for
India used the simultaneous equation regression technique to arrive at the growth
multipliers73.
In this study we use the Social Accounting Matrix (SAM), an extension of the input-output
model to estimate the direct, indirect and induced employment multipliers of the app
economy in India. The methodology follows closely the methodology of Katz and
Crandall.74 Please refer to Appendix 3 for details on methodology. Box 1 below explains how
70 Katz, Raul, and Stephan Suter. "Estimating the economic impact of the broadband stimulus plan." Columbia
institute for tele-information working paper (2009). 71 Gentzoglanis, A. (2007). International Competitiveness in the Telecommunications and ICT Sectors: A Cross-
Country Comparison. Centre interuniversitaire de recherche sur la science et la technologie and Koutroumpis,
P. (2009). The economic impact of broadband on growth: A simultaneous approach. Telecommunications
Policy, 33(9), 471-485. 72 See: Kim, Y., Kelly, T., & Raja, S. (2010). Building broadband: Strategies and policies for the developing
world. World Bank Publications and Ford, G. S., & Koutsky, T. M. (2005). Broadband and economic
development: A municipal case study from Florida. Review of urban & regional development studies, 17(3),
216-229. 73 Kathuria et al. (2009) “Impact of Mobile” ICRIER and Kathuria and Kedia-Jaju, (2012) “India: Impact of
Internet” ICRIER 74 See: Katz, Raul, and Stephan Suter. "Estimating the economic impact of the broadband stimulus
plan." Columbia institute for tele-information working paper (2009).
Katz, Raul L. "Estimating broadband demand and its economic impact in Latin America." Proceedings of the
3rd ACORN-REDECOM Conference Mexico City May. Vol. 22. No. 23rd. 2009.
Katz, Raúl L. "II. The contribution of broadband to economic development."Fast-tracking the digital
revolution: Broadband for Latin America and the Caribbean: 49.,. pdf (2003).
Crandall, Robert, Charles Jackson, and Hal Singer. "The effect of ubiquitous broadband adoption on
investment, jobs, and the US economy." Criterion Economics, LLC Released by New Millennium Research
Council. Available at http://newmillenniumresearch. org/archive/bbstudyreport_091703. pdf (2003).
Box 1: Studies estimating employment potential of the app economy
The Geography of the App Economy by CTIA (2012): This study estimated that the app economy in the US had created
519,000 jobs as of April 2012. Estimation of employment was based on existing research on job multipliers. The ratio
between core app economy jobs and indirect app economy jobs was also estimated using anecdotal data. The assumed
multiplier in this study from core app economy jobs to core plus indirect jobs was 2. The new studies on the US App
economy use multipliers that range between 2.4 and 3.4.
Creating Jobs and Driving Growth by Vision Mobile and Plum Consulting (2013): This study estimated that the app economy
created 794,000 jobs in EU (28 countries), of which two-thirds were direct jobs. This study also assumes a multiplier of 1.5 to
estimate spill over into other sectors. The authors acknowledge that as the app economy becomes more entrenched in
everyday businesses, spill over effects will increase, and the multiplier should accordingly be revised upwards.
Our study on estimating the employment potential of app economy in India is a departure from the studies mentioned above
that estimate total employment in the app economy by assuming multipliers. The focus of this study is to use an input output
model to estimate the multipliers for India’s app economy. The estimated Type I and Type II multipliers range between 1.2 to
7.2, given different business and policy environments.

13
this study is a departure from the existing literature on estimation of employment potential.
3.2 Estimating the employment multiplier for India’s App Economy
For the app economy the total employment can be viewed as the sum of three parts- direct
jobs, indirect jobs and jobs on the demand side. Direct employment arises due to making of
apps, indirect employment due to supply of associated inputs/services and induced
employment (due to increase in household incomes). In other words, the app economy can be
viewed as a source of employment opportunities on both the supply and demand sides. The
contribution to employment and entrepreneurship is important to assess because the app
economy is likely to drive India’s imminent data revolution and also a play a vital role in
creating efficiencies and lowering transaction and information costs. Direct Employment gets
created due to the development and maintenance of apps. Thus software engineers, user
interface developers, designers and any other IT professionals who are directly involved in
creating the app would qualify for this cohort. Indirect Employment is related to non-IT jobs
involving sales and marketing, customer relationship management and finance and accounts.
Moreover, specific apps such as those that offer location based services engage geo-
information engineers with specific expertise. Our survey however reveals that such content
is either available for free or for a nominal license fee. Induced Employment is a demand spill
over outside the industry driven by increased income of those engaged in the app economy.
Mathematically the employment multipliers can be represented as follows:
Type I 𝑑𝑖𝑟𝑒𝑐𝑡+𝑖𝑛𝑑𝑖𝑟𝑒𝑐𝑡
𝑑𝑖𝑟𝑒𝑐𝑡
Type II 𝑑𝑖𝑟𝑒𝑐𝑡+𝑖𝑛𝑑𝑖𝑟𝑒𝑐𝑡+𝑖𝑛𝑑𝑢𝑐𝑒𝑑
𝑑𝑖𝑟𝑒𝑐𝑡
The estimates enable measurement of employment by reflecting the important cascading
effects that apps create by stimulating growth, entrepreneurship and productivity throughout
the economy as a whole.
The best way to understand the employment multipliers is to interpret them as the total
change in direct and indirect or direct, indirect and induced employment due to a unit change
in employment of the target industry, in this case the app economy. Since the evolution of
the app economy depends on several factors we construct four different scenarios to tease out
the employment numbers. These are – Business as Usual (BAU), Industry Matures (IM),
Government Intervention (GI) and Aggressive Government Intervention in a Mature Market
(AGI). These assumptions and results are shown in Table 1 and Table 2 respectively.

14
Table 1: Assumptions for different scenarios of the App Industry in the future
Scenario Assumptions
Business as
Usual
(BAU)
50% of the expenditure on Electrical Machinery including PC/Laptops and other
peripherals including software and mobile handsets75 can be attributed to apps
based on the expected domestic revenue share of IT services and software in the
industry in 201476
10% of expenditure on communication including mobile and fixed line77 can be
attributed to apps. This is based on the data revenue currently accruing to mobile
service providers as reported by TRAI
Industry
Matures
(IM)
70% of the expenditure on Electrical Machinery including PC/Laptops and other
peripherals including software and mobile handsets can be attributed to apps
under this scenario. This is assuming increased smart phone penetration will drive
at least 50% of the hardware revenue in the industry to depend on apps, in
addition to IT services and software as assumed in the BAU scenario
Improved revenue sharing between service providers, content aggregators, app
developers and cheaper data packages can drive the adoption of data services.
Share of data in revenue from expenditure on communication has therefore been
assumed to increase up to 30% under this scenario
Government
Intervention
(GI)
The expenditure on Electrical Machinery including PC/Laptops and other
peripherals including software and mobile handsets is unlikely to cross 70% of the
total and is hence kept unaltered from the IM scenario
Active government intervention in developing infrastructure, focusing on e-
government services, liberalizing m payment regimes can further increase data
revenue from mobile services. It has been assumed at 50%, given the prevailing
share in some developed markets. However, in mobile first developing countries
this share could rise much more in the future.
Aggressive
Government
Intervention
in a mature
industry
(AGI)
The expenditure share on software, IT services and hardware is kept unchanged (
similar to the IM and GI scenario)
The share of expenditure on data services in total communication revenue is
increased to 90%. This is an aggressive estimate.
The Type I and Type II estimates for the app economy under the Business as Usual (BAU)
and Industry Matures (IM) scenarios are lower than the multiplier estimated by NASSCOM
for IT-ITES for 2014. In the Strategic Review for 2104, NASSCOM estimates a multiplier of
4. In our model, 4 is roughly the median estimate. Government intervention in the form of
favourable IT policies could be expected to push impacts toward the upper limit of 7.2 as
estimated in our aggressive scenario. Rapid innovations in the mobile space have been
disruptive resulting in lower entry barriers and generating new opportunities for small firms
and entrepreneurs. This suggests that bigger impacts are possible under favourable conditions
in the future,
Our Type I estimates also inspire confidence since these are similar in orders of magnitude to
the multipliers estimated in the vast literature on the impact of internet broadband.78
75 Categorised under S56 of the Consumer Expenditure Survey SAM (2007-08) and NSSO (2009-10) 76 Reported by NASSCOM in its Strategic Review Report 2014 77 Categorised under S68 of the Consumer Expenditure Survey SAM (2007-08) and NSSO (2009-10)

15
Table 2: Multiplier Estimates under different scenarios
Multiplier Business As
Usual (BAU)
Industry
Matures
(IM)
Government
Intervention
(GI)
Aggressive Government
Intervention in a Mature
Industry (AGI)
Type I multiplier
(direct + indirect) 1.2 1.4 1.6 1.9
Type II multiplier
(direct + indirect +
induced)
2.9 4.4 5.3 7.2
The CTIA estimates the number of app developers at about 500,000 in the US and over
700,000 for the EU. Given its well known prowess in the IT space, India is slowly catching
up with the developed world.79 In order to interpret our multiplier estimates and understand
their practical implications, we determine multiplier benefits using our current estimates of
employment within the app industry (75,000). In the absence of a readily available forecast
on employment in the app industry, we project increases in the estimated workforce using
revenue estimates for the industry. According to Gartner, the size of India’s app economy is
estimated to increase from 974 crore in 2014 to Rs 2,065 crore in 2016. Gartner has also
forecasted the growth smartphone/ mobile device penetration in India to increase at a
compounded annual growth rate of 42 percent for the period 2012 to 2016. Using the latter,
we independently extrapolate the size of India’s app economy at Rs 1,964 crores for 2016.
Based on this narrow range of estimates for the size of India’s app economy, we project
employment in this industry to range between 1,51,230 and 1,59,010 by 2016. Therefore, the
direct increase in employment attributable to India’s app economy is expected to range
between 76,230 and 84,010 jobs from 2014 to 2016. The multiplier effects for increase in
employment for all business and regulatory scenarios are tabulated below (these are likely
overestimates80). The multiplier effects could result in an increase in employment within the
industry by up to 8 times during the period from 2014 to 16.
Table 3: Estimates for increase in employment between 2014 and 2016
The numbers outside (in) parentheses reflect the multiplier benefits if direct employment
increases to151230 (159010)
78 According to studies by Katz et al. (2008, 2009a, 2009b), Liebenau et al. (2009), the Type I multiplier range
between 1.38-1.83, and Type II multipliers from 1.93 to 3.42
See: Liebenau, J., Atkinson, R., Kärrberg, P., Castro, D., & Ezell, S. (2009). The UK's digital road to recovery 79 Computer World July 2013 India to overtake US on number of software developers by 2017
http://www.computerworld.com/s/article/9240676/India_to_overtake_U.S._on_number_of_developers_by_20
17 80 Technological advancements, productivity increases and firm constraints on expenditure may limit the rise in
employment even when revenue rises. Accordingly, the growth rate in revenue is likely to be higher than that
for employment

16
Business
As Usual
(BAU)
Industry
Matures
(IM)
Government
Intervention
(GI)
Aggressive
Government
Intervention in a
Mature Industry (AGI)
Increase in
employment
using Type I
multiplier
91476
(100811)
106722
(117613)
121968
(134415)
144837
(159618)
Increase in
employment
using Type II
multiplier
221067
(243627)
335412
(369641)
404019
(445249)
548856
(604867)
Admittedly it is difficult to say which of the scenarios will be realised or how much the app
economy will exactly contribute to employment. It seems clear however that the sector is and
will continue to be a net generator of jobs. It could, for example, in our most optimistic
scenario generate close to 604867 jobs in India, almost eight times the current level of
employment. The rate of growth in this industry suggests that these numbers may not be
unachievable. For example in the United States alone, the mobile app industry provided an
estimated 752,000 jobs in 2013 and in the EU it accounted for 1 million jobs in 2014. As
adoption of mobile technology increases and apps become pervasive, new jobs to support
sales will also grow. The labor market can also benefit from the ability of mobile apps to
improve efficiency and lower costs in matching job candidates and employers. As direct
employment in the industry increases, the multiplier effects will benefit overall employment
in the economy.
4. Survey Analysis
4.1 Introduction
In addition to estimating multipliers using secondary data we also collected and analysed
primary data on app developers in India. The principal objective of the survey was to
supplement findings from secondary research and to analyse emerging trends in India’s app
economy based on the app economy framework discussed above. Data from developers was
collected using an online survey, a method ideally suited for the target population 81. The
scope of bias in our survey is thus limited, since the cohort of app developers has native
access to the online platform. We reached out purposively to 2000 individuals82 through
email and social media sites. The respondents included a mix of individual app developers
and both small and big companies engaged in app development. Our survey differs in
objective from other existing surveys in this field that have essentially focused on nature of
smartphone usage, popularity of different app categories etc. For India this is the first
organized survey that attempts to profile app developers and their artefacts while also trying
to understand the constraints in the working of the app eco system.
81 We are grateful to the Internet and Mobile Association of India (IAMAI) for facilitating the online survey
under this project 82 These 2000 respondents were from IAMAI’s database of app developers

17
The app developer survey was conducted over two months in 2013, with a response rate of
over 25 percent. We received 515 responses of which 61 had to be omitted due to incomplete,
erroneous and/or irrelevant information. The analysis is reported in four sections as below:
a) Who? The App Developer in India
b) What? The Preference of Users and Developers in India
c) Why? The Business of Apps in India
d) How? The Future of Apps in India
The first category highlights the demographics of app developers in India, including the
organizational set up. The second category identifies preferences for apps, platforms and
devices. The third category brings out popular business/revenue models and associated
marketing initiatives. The final category lists the perceived challenges and feeds into our
policy recommendations.
4.2 Who? The App Developer in India
App development is a relatively new phenomenon in India and has seen rapid rise since it
inception. India’s app developers run into hundreds of thousands and are overwhelmingly
young - 75 percent of the respondents are below 35 years of age. ‘App whiz-kids’ - teenagers
involved in the development of gaming, entertainment and utility apps - are becoming prime
property in India. This has encouraged a trend wherein students and independent
professionals engage in app development on a part-time basis. While some of these app
developers progress to establish organised businesses with the aim of generating profit, others
continue to operate as independent developers or hobbyists.
The vast majority of app developers in India are male. In our survey of 454 developers, only
35 respondents were female reflecting the gender bias.83 On the demand side 80 percent of
smartphone users in India are male reinforcing the male dominance.84 Geographically the
respondents were all based in India except one developer of Indian origin residing in
Malaysia. The well known and established IT cities in India are attractive for app developers
because they provide with easy access to infrastructure, skill and a ready market for products.
Table 4 shows the concentration of app developers in the cities of Bangalore, Mumbai, Delhi
NCR, Hyderabad, and Ahmedabad. A larger percentage of developers in such IT cities make
apps on a full-time basis as compared to developers in other cities. From the survey data
presented below in Table 5 we find that Bangalore, Mumbai, and NCR have the maximum
number of companies (organized business operations) engaged in app development. Cities
like Ahmedabad, Hyderabad and Chennai host many small teams of app developers as well
as self-employed app professionals. In most of the other cities such as Bhubaneshwar,
Cochin, Coimbatore, Gandhinagar and Kota, app development is done primarily on a part-
time basis and is not the primary source of income. This could be the result of limited
83 Shyamsunder, A. Carter, N. (2014). High Potentials Under High Pressure in India’s Technology Sector.
Catalyst Research Centers. 84 Ibid

18
monetization options that make app development an unsustainable livelihood for many.
Monetisation will be discussed in greater detail in Section 4.5
Table 4: No of app developers in cities
City No. of Developers Primary Occupation
Ahmedabad 49 38
Bangalore 77 56
Mumbai 78 56
Delhi NCR 98 70
Hyderabad 40 28
Chennai 37 26
Pune 15 7
Indore 16 13
Kolkata 6 4
Others 38 29
Table 5: Distribution of app developers in cities based on organization type
City Self Employed Small Team Company
Ahmedabad 21 4 24
Bangalore 11 15 51
Mumbai 11 12 55
Delhi NCR 18 17 63
Hyderabad 17 3 20
Chennai 11 7 19
Pune 4 4 7
Indore 4 3 9
Kolkata 2 1 3
Others 8 8 22
4.3 What? The Preference of Users and Developers in India
The demand for apps in India is varied. This heterogeneity is driven by the differences in
income, education and infrastructure facilities available in different parts of the country. The
advance of high-end feature phones, smartphones and low cost tablets represents the
beginning of an indisputable shift towards greater data consumption. For example between
2012 and 2013, the number of smartphones in urban India increased by 89 percent to reach
51 million.85 This is especially important in light of the fact that globally the growth rate of
85 Nerurkar, Sonal . "Teens drive Indian smartphone sales, study finds." The Times of India. 8 Sept. 2013. Web.
20 Jan. 2014. <http://timesofindia.indiatimes.com/business/india-business/Teens-drive-Indian-smartphone-
sales-study-finds/articleshow/22406572.cms>.
19
smartphones is projected to decelerate from 2013 onwards through to 2017 (while India
should see the reverse).86
Much of the increase in smartphone consumption is driven by consumers aged 16-1887. Pew
Research results for the United States show that youth are heavy consumers of data.88 User
preference for gaming, entertainment and social networking is reflected in the types of apps
being developed. The popularity of international apps is evident in the survey data. The
average download of ‘Indian’ apps is very low. Only 14 of the 454 developers has crossed the
hundred thousand download mark, of which only 5 surpassed the one million milestone.
These numbers do not pertain to a single app, but to the cumulative number of downloads
across all the apps created by each developer, supporting the thesis of low visibility of apps
developed domestically.
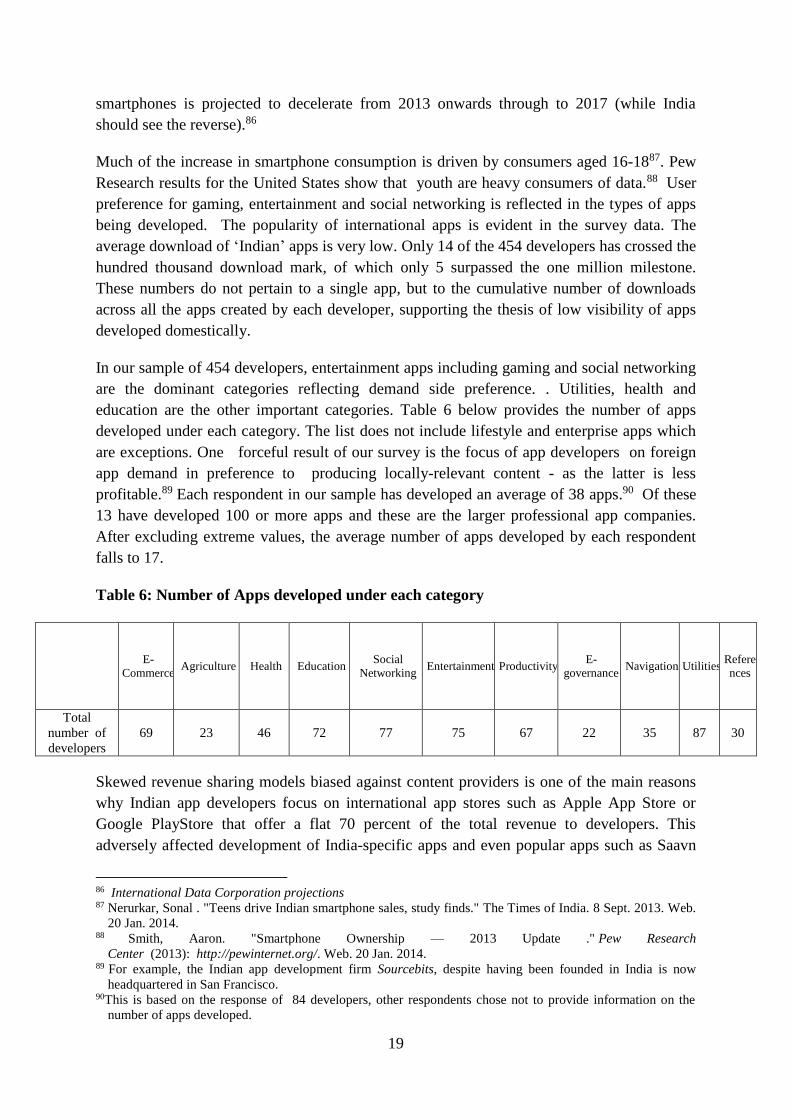
In our sample of 454 developers, entertainment apps including gaming and social networking
are the dominant categories reflecting demand side preference. . Utilities, health and
education are the other important categories. Table 6 below provides the number of apps
developed under each category. The list does not include lifestyle and enterprise apps which
are exceptions. One forceful result of our survey is the focus of app developers on foreign
app demand in preference to producing locally-relevant content - as the latter is less
profitable.89 Each respondent in our sample has developed an average of 38 apps.90 Of these
13 have developed 100 or more apps and these are the larger professional app companies.
After excluding extreme values, the average number of apps developed by each respondent
falls to 17.
Table 6: Number of Apps developed under each category
E-
Commerce Agriculture Health Education
Social
Networking Entertainment Productivity
E-
governance Navigation Utilities
Refere
nces
Total
number of
developers
69 23 46 72 77 75 67 22 35 87 30
Skewed revenue sharing models biased against content providers is one of the main reasons
why Indian app developers focus on international app stores such as Apple App Store or
Google PlayStore that offer a flat 70 percent of the total revenue to developers. This
adversely affected development of India-specific apps and even popular apps such as Saavn
86 International Data Corporation projections 87 Nerurkar, Sonal . "Teens drive Indian smartphone sales, study finds." The Times of India. 8 Sept. 2013. Web.
20 Jan. 2014. 88 Smith, Aaron. "Smartphone Ownership — 2013 Update ." Pew Research
Center (2013): http://pewinternet.org/. Web. 20 Jan. 2014. 89 For example, the Indian app development firm Sourcebits, despite having been founded in India is now
headquartered in San Francisco. 90This is based on the response of 84 developers, other respondents chose not to provide information on the
number of apps developed.

20
and Zomato have expanded abroad. Saavn’s musical lexicon includes both Indian sub-
continental and Western music and Zomato is spreading to list restaurants in Turkey, UAE,
UK and Brazil. There are signs though that the Indian market is adapting to these
developments. AppsDaily is an innovative distribution channel for uniquely Indian apps
(discussed above). Furthermore, Vodafone has recently released its beta app store with an
internationally competitive 70-30 revenue sharing model. If other players follow suit, it could
ensure development of localised content.
The other dimension essential to diffusion of apps among Indian users is the choice of
platform/ operating systems and devices that support it. Survey results confirm the
dominance of Android followed by iOS. Windows OS is a close third. The others categories
include Samsung’s Bada and Tizen OS, Web OS and Mac OS. Table 7 below provides the
data on number of app developers by platform.91 The choice of operating systems is closely
tied to devices. India’s smartphone penetration though low at present, is rising rapidly as
manufacturers are introducing new models at lower prices. Moreover, local manufacturers
such as Micromax, Karbonn, and Lava are competing with global leaders such as Samsung,
by launching smartphones and tablets at affordable prices. Accordingly, most developers are
targeting apps that can be supported on smartphones and tablets. A small group of Java
developers is focusing on the market for feature phones. Table 8 below provides data on
choice of devices that support apps. The ‘others’ category includes smart watches, smart TVs
and desktop apps which are rare.
Survey results indicate an Android dominated future for the app economy in India for two
apparent reasons. One, Android devices are more affordable and two, the Android ecosystem
is open allowing OEMs such as Samsung and HTC to manufacture mobile devices that use
the Android OS. The drawback is the resulting fragmentation in screen sizes, resolution limits
and hardware traits. Because of this, “developing apps that work across the whole range of
Android devices can be extremely challenging and time-consuming.”92 Moreover, Indian app
developers need to recognise the existence of an active market for used phones and thus the
appeal of ‘backward compatibility’ i.e. an app that can work across old devices as well as
new ones and also function across both old and new versions of operating systems will stabd
a better chance of success.
Table 7: Number of developers by choice of operating system
OS Type Android iOS Blackberry Windows Java Others
Number of
developers 84 69 12 62 20 22
Table 8: Number of developers by choice of device
Device Type Smartphones Feature phones Tablets Others
91 Only 232 developers responded to this question. 92 "Android Fragmentation Visualized (July 2013)." Android Fragmentation Report July 2013. Web. 20 Jan.
2014.

21
Total No. of developers 195 30 128 27
4.4 Why? The Business of Apps in India
Apps need an ecosystem to thrive. One major challenge for app developers in India is to
transform a good idea into commercial success. The present rate is not encouraging. Most
developers try to optimize their odds of becoming profitable for example by choosing the
platform with the highest installed user base. Other factors driving the OS choice are
familiarity with the development environment and the cost of development. On the whole,
app development is not considered to be a remunerative business opportunity. 17 percent of
respondents who answered the question on choice of revenue model indicated that they did
not have a specific revenue generation plan. While some developers are engaged in
contractual development, there are few developers who self finance their project and do not
actively market or promote their app. The business of app development in India seems to be
at a stage in which it could be characterised as one based on a ‘hit and trial’ philosophy.
Self financing is common in the industry. Only 7 and 13 developers approached banks or
venture capitalists for financing. Funding an app developer is not an investor’s primary
choice. Recognising the market failure and the utility of apps, the Department of Electronics
and IT and Department of Telecommunication have both instituted funds to encourage
mobile technology ventures and app development in India.93 One can argue on the efficacy of
the use of limited public resources for app development, but not the fact that app
development in India needs a boost. The industry is still very young and ‘unorganized’ and is
largely dependent on own and informal sources for financing. Table 9 below presents the
source of financing for app developers.
Table 9: Source of Financing for Application Developers
Self Bank Loan Informal Sources
Venture
Capital Others
Number of
app
developers
84 7 20 13 6
Most apps in India are distributed either by app stores or on the developer’s websites.
Almost 70 percent of the respondents use app stores. In rare cases developers email their app
to a target group of users. Developers spend up to 85 percent of their development cost on
marketing. Other avenues for marketing include social networking websites, promotions in
magazines and cross promoting new apps on an existing app. Popular revenue generation
93 DoT has set up a 1000 crore app development centre called Application Development Infrastructure and 700
crores under the National E-Governance Plan have been allocated for mobile technology ventures

22
models include advertising, in-app purchasing, freemium and pay per download. Table 10
provides the choice of revenue models for app developers in India.
The vast majority of apps in India are ‘free’ for the consumer. This means that revenue
generation for the developer is either through advertisements or through royalty. In cases
where the consumer pays for the app, the modal price range is between Rs 50 – 100.
Interestingly, Apple and Google Playstore initially priced most of their apps at $1, which
translates to roughly Rs 60 at the prevailing exchange rate.. Although the rupee depreciated to
almost 69 in 2013, the price for paid apps remains within the Rs 50 -100 range. As stated
earlier, a large number of Indian app developers sidestep the unfavourable local conditions by
catering to the international market -localised content suffers as a result. For the few local app
stores that exist, revenue sharing does not favour local app development. Another outcome of
the circumstances for developers has led to their focus on specific clients thereby reducing
their search for profitability.
Table 10: Choice of revenue models
Pay per
download
In-app
purchasing Freemium Subscription Royalty Advertising
Number of app
developers 52 73 61 42 20 77
The potential for apps is well established, but its business case is still quite weak. In our
survey only 82 developers have successfully recovered their investments. Of these, 24 were
profitable within a year, 15 between 1-2 years, while the others took much longer.94 It is
worrying that most developers treat app development as a sunk cost. For apps to become a
business opportunity for the wider developer community, a mature and localised ecosystem is
necessary that is sympathetic to the needs of the developer community.
4.5 How? The Future of Apps in India
India’s app ecosystem functions in an environment that is inimical to growth. Our survey
respondents highlighted several constraints- absence of skilled manpower, high cost of
development, limited or no access to finance- as major impediments to growth. Table 11
below provides survey responses on the barriers. A few other challenges include high cost of
user acquisition, hyper competition driven by independent and freelance developers and the
high cost of marketing. Industry stakeholders are concerned by the clutter in the developer
market, although this could sort itself as the industry evolves and underperforming and
uncompetitive developers gradually weed out. In terms of monetization, the challenge is
related to the preference for free apps and a user base that is limited in terms of their
familiarity with the mobile and internet ecosystem. More than 50 percent of the respondents
feel that the preference for free apps damages the revenue potential of this industry.
Moreover, given users’ price sensitivity, developers have to offer much more to the Indian
94 Most respondents did not answer this question

23
consumer to drive willingness to pay. This reinforces the case for developing content in
Indian languages and localizing the ecosystem as a whole.
Table 11: Barriers facing India’s app economy
Skilled Manpower Access to Financing High Cost of Development Others
Number of
developers 77 14 28 7
Since the industry thrives on innovation, protection of intellectual property is important to
developers. The balance between protection and sharing of innovation is part of a larger and
often tendentious debate on open source versus proprietary software development.95 We do
not attempt to deconstruct that debate here; merely report that 70 percent of respondents are
of the view that intellectual property protection is a concern for app developers. However,
not all have taken steps to protect intellectual property. The lack of seriousness could be
associated with poor revenue potential from apps. Among those who have, some obtained
copyrights/patents, while others worked with individual checks on in-app piracy using code
morphing, copy protection, server–based checks, or both etc. Table 12 below provides the
number of app developers who have adopted different IP protection measures.
Table 12: Intellectual Property Right (IPR) Protection in the App Industry
Measures for IPR Number of
developers
Have obtained Copyright/ Patents 58
Have provided for In-app checks 60
Have not taken any steps 23
Although our survey comprised a small sample, the findings complement the secondary data
analysis and are a useful supplement to the case studies. Developers highlighted the well
known challenges with a view to help unlock the potential in India’s app market. These
include a focus on local content, an improved landscape for local developers, increased
smartphone and broadband penetration, a concerted effort to boost digital literacy, awareness
and an environment that supports innovation. The focus on the easy to tap urban market
which typically demands popular international content must inevitably segue to semi-urban
and rural areas for the app economy to prosper riding primarily on local content.
5. Case Studies
Case studies supplemented the analysis and findings of the primary survey and in particular
sought to identify the micro-channels through which larger macroeconomic impacts (direct,
indirect and induced) get created. Referring once again to the framework developed in
section 2, representative stakeholders were selected from each constituent of the app
ecosystem. Figure 2 reproduced for convenience buckets stakeholders across the ecosystem,
95 Hippel, Eric von, and Georg von Krogh. "Open source software and the “private-collective” innovation
model: Issues for organization science." Organization science 14.2 (2003): 209-223.

24
although some operate across multiple segments. Refer Appendix 4 for a list of all
stakeholders consulted for this project and Appendix 5 for details of each case study.

25
Figure 2: Selected Stakeholders across the Indian App Ecosystem
Source: Author
A strong verdict of the extensive consultations with app developers including Times internet,
Get It Info Media, Bellurbis and Mobile Harvest is that Indian app developers typically
concentrate on coding. The emphasis on aesthetics, user-interface and interaction design is
lacking. The normative view is that this needs to change if Indian apps aim to become
internationally competitive.
The need to create locally relevant content was also a recurrent theme in our interactions. Not
only can we unlock latent demand as a result, but also expand employment opportunities
beyond English language content. A bigger market for local content could create good
externalities even larger than those estimated in this report.96 Mobile Harvest for example
faces challenges of a young and relatively fragmented local market. While the market
potential is massive, achieving scale, a crucial attribute for success in networked sectors, is a
primary challenge.97 Although preliminary, our case studies also indicate that other benefits
of apps in general and local content in particular can provide social cohesion and extension of
communications to low income users which have large multiplier effects throughout the
economy.
Distribution is dominated by international app stores in India. With a nascent e-commerce
industry and poor credit/debit card penetration, telecom operators tend to play a larger role in
the distribution of apps. For example, Samsung Apps has partnered with local telecom
operators (Vodafone India) to enable carrier-billing. A unique physical app distribution
platform that has emerged in India and spread to other countries is AppsDaily, a local
96 IAMAI, Local Language Report, 2013. 97 Ibid.

26
innovation whose success is built on existing gaps in the local operating environment. While
the physical channel will continue to exist, stakeholders such as Vodafone, Samsung and
Blackberry are of the justified view that scaling up needs regulatory intervention to ease
digital payment mechanisms that enables widespread digital distribution of apps.
The pattern of app downloads and user profiles have been discussed extensively in section 2.
While the largest proportion of demand comes from gamers a growing proportion is now
coming from enterprises and government agencies who wish to use technology and mobility
solutions for greater transparency and efficiency. Accordingly, eGov app store that we
analysed is home to some apps that are becoming popular among users, such as e-
procurement, e-heatlh, etc. The use cases suggest how these apps have streamlined processes
and increased efficiency manifold. Details on demand and efficiency gains are available in
Appendix 5.3. On the other hand Make My Trip presents a case of service extension. It is
especially of value to last minute travellers, who find such applications convenient.
Devices form a fundamental component of the app ecosystem. In the first quarter of 2014,
India witnessed 186 percent increase in the shipment of smartphones.98 With smartphones
entering the market at price points that are disruptive (e.g. Micromax covered in the list of
case studies), there is an upsurge in app demand. Our survey highlights the lack adequate
network infrastructure -telecom operators and infrastructure providers have a fundamental
role to play in this regard as does the role of a predictable and strong regulatory environment.
Operators in India and elsewhere view apps as a threat to their existing business model.
However, with the inevitable technological advancement operators will have to adapt to the
new reality of greater data use. In case of conflict between regulation and technology, the
balance of convenience is to favour innovation in public interest. A perspective of Indian
telecom operators towards the app economy was presented by Vodafone India (Refer
Appendix 5.7)
Telecom infrastructure is necessary for the app economy to take off but at the same time our
consultations suggest that access to infrastructure is certainly not the only thing that matters.
On the contrary, research highlights the vital importance of complementary skills and other
infrastructure-literacy, competitive distribution platforms, congenial environment for
development, among others as being important enablers. Unless these are in place, the
potential benefits of apps will be suffocated. There is no benefit in developing a superb app
unless it can reach the final consumer at an affordable price in a language that he
understands.
Cost and connectivity are barriers but interesting innovations by local entrepreneurs using
offline technology such as USB (universal serial bus) to deliver content to users who can
afford smartphones helps overcome the initial connectivity issues. Eventually however
connectivity will be crucial.
98 IDC

27
Operating systems (OS) in the final piece in the app economy puzzle. As reflected in the
survey, Google’s Android followed by Symbian and Microsoft are the popular OS in India.
The choice of OS is linked to the device. Samsung, Micromax and Karbonn, three very
popular handset companies in India, all use the Android OS (although Karbonn is about to
release a dual-OS phone that also runs Windows). Symbian which primarily runs on Nokia
devices also enjoys sizable market share although it is decreasing. Since there will be large
numbers of first time smartphone users entering the Indian market, there is huge potential for
new entrants to capture market share in India. Firefox, a web-based OS, is one such example,
struggling with finding its place in the Indian app market. (Refer Appendix 5.8 for details on
Friefox OS in India)
6. Conclusions and Policy Recommendations
The emergence of apps embedded in mobile devices that go beyond providing basic access
leads us to hypothesize that apps could potentially have a large impact on the economy and
on livelihoods. Emerging markets such as India are the driving force behind rising trends in
app downloads. India is among the top three countries for Google Play downloads in the
world. Apps provide opportunities for software developers, information aggregators and
users. By becoming content providers, users have an opportunity to participate in and even
shape the social and economic transformation. In the recent Indian elections for the 16th Lok
Sabha social networks became a vibrant platform for user generated content especially the
young Indian voters. Some State governments in India have embraced the potential for
mobile phones to improve public services for citizens and promote accountable and
transparent governance. Apps will further enhance the delivery model. For other verticals
such as agriculture, health and financial inclusion, apps need to be designed locally and this
offers exciting opportunities for developers. For a dynamic sector that apps is today, it is
imperative to customize to local circumstances and to assess impacts regularly. This study
breaks new ground in this respect and hopes that estimating growth and employment effects
of apps becomes custom in the future.
Previous research in this genre has unambiguously established productivity impacts of greater
mobile and internet penetration due to the accompanying reductions in information
asymmetries and declining transactions costs. Evidence of the impacts of apps could be
expected to be along similar lines especially since India suffers huge service deficits in
several areas including education and healthcare. ‘Apps for development’ could be an
attractive and practical option for India to embrace, besides apps for e-commerce, gaming
and entertainment that will in any case be driven by the market.
The app economy is credited to have generated half a million jobs in the USA in 2013 and
another 700,000 in the EU. According to 2013 data, the EU app economy accounts for 22
percent of the global production of app related services and products. Indians constitute the
second largest nationality for app developers (the first is Americans), and hence it is worth
documenting the direct, indirect and induced employment effects of the app economy in
India. This study uses scenario based analysis to estimate the potential for employment in the
app economy under different business and policy environments.

28
Apps currently account for 75,000 jobs in India. Using our estimates for increase in
employment (between 2014 and 2016) the multiplier effects have been estimated under
different business and regulatory scenarios. The minimum estimated increase in direct and
indirect employment for the app economy is 91476, while the maximum is 159618. If we
include changes in induced employment, these numbers rise up to 221,067 and 604867
respectively. Thus the aggregate number of jobs that apps could create in India during the
period 2014-16 lies between 91476 and 604867, the upper limit being close to eight times the
current levels of employment. If direct employment increases at a faster rate, the multiplier
effects will result in massive benefits to overall employment in the economy.
India needs technology to overcome everyday problems. The economic benefits can be huge.
And apps can be an important cog in that wheel. Connectivity to the internet holds enormous
promise with smart cities, agriculture, health and education, to name a few applications,
seeking to democratize the benefits of technology. While estimating employment potential of
apps is the central piece of this study, the primary survey and case study analysis have
supplemented these findings to package the trends, patterns and challenges of this industry.
The case studies present underlying benefits of apps, although it would need another study to
robustly estimate their productivity impacts throughout the economy.
It is a fact that India’s market is split by many factors including language, income, access,
awareness and digital literacy among others and therefore we need to address both the supply
and demand side challenges of the ecosystem. Supply side bottlenecks include deficiency of
spectrum and inadequate backbone networks and distribution platforms; on the demand side
the main constraints are lack of affordable mobile devices and broadband services, digital
literacy as well as limited local applications and content. As an illustration the success of
mobile payments worldwide would not have been possible without the easing of entry
barriers such as the falling cost of smartphones and affordable and adequate access to the
internet.
Telecom operators and infrastructure providers have a fundamental role to play in harnessing
the potential of India’s app economy by providing adequate infrastructure. Telecom
infrastructure is necessary for the app economy to take off but at the same time our research
suggests that access to infrastructure is certainly not the only thing that matters. Even though
the bond between mobile operators and users is loosening due to the fact that mobile devices
can now directly connect to the internet, operators in India will still remain important if not
key to unlocking the potential of the app economy. Their vast reach makes them ideal as
distribution networks and payment channels for apps-for this they need to constructively
work with app developers. This is now fortunately beginning to happen.
The absence of successful revenue models and poor levels of commercialization still stand in
the way of entrepreneurial aspirations and employability in the industry. The employment
potential of this industry can be realized with revenue sharing increased in favour of the
developer and regulatory costs of carrier billing lowered. If policy intervention allows for
liberal payment regimes, affordable and ubiquitous access to internet, the gains from this
industry can be maximized.
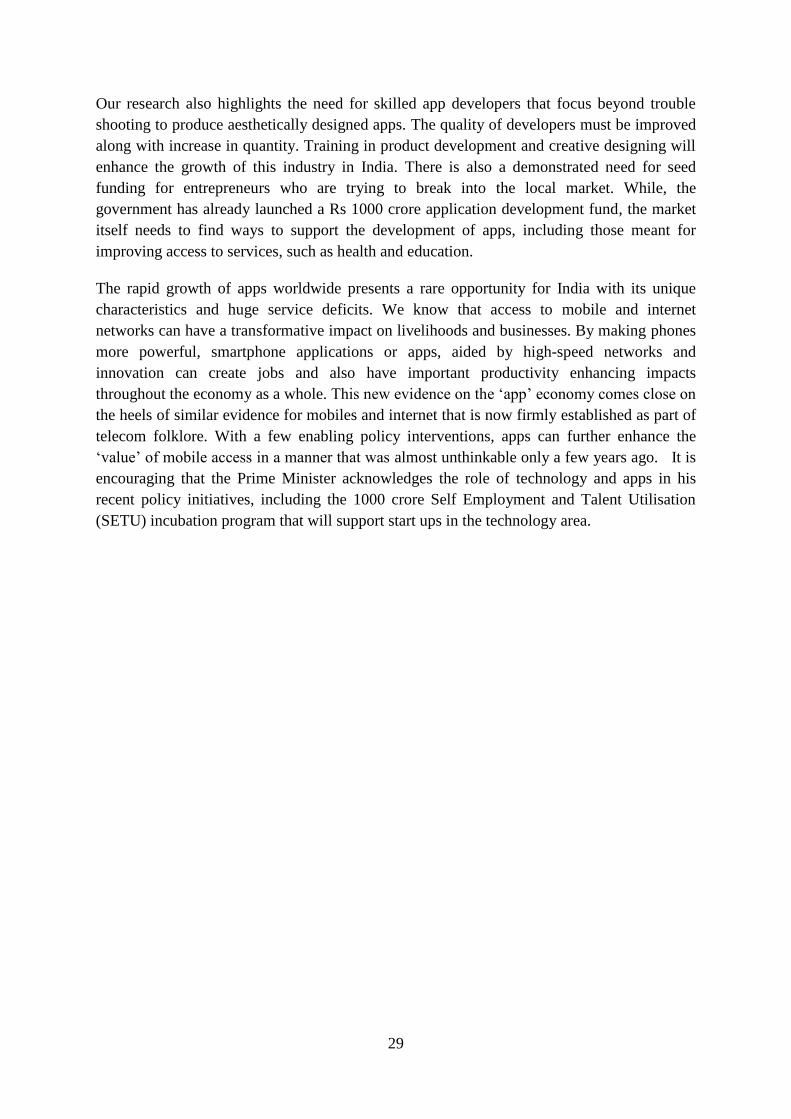
29
Our research also highlights the need for skilled app developers that focus beyond trouble
shooting to produce aesthetically designed apps. The quality of developers must be improved
along with increase in quantity. Training in product development and creative designing will
enhance the growth of this industry in India. There is also a demonstrated need for seed
funding for entrepreneurs who are trying to break into the local market. While, the
government has already launched a Rs 1000 crore application development fund, the market
itself needs to find ways to support the development of apps, including those meant for
improving access to services, such as health and education.
The rapid growth of apps worldwide presents a rare opportunity for India with its unique
characteristics and huge service deficits. We know that access to mobile and internet
networks can have a transformative impact on livelihoods and businesses. By making phones
more powerful, smartphone applications or apps, aided by high-speed networks and
innovation can create jobs and also have important productivity enhancing impacts
throughout the economy as a whole. This new evidence on the ‘app’ economy comes close on
the heels of similar evidence for mobiles and internet that is now firmly established as part of
telecom folklore. With a few enabling policy interventions, apps can further enhance the
‘value’ of mobile access in a manner that was almost unthinkable only a few years ago. It is
encouraging that the Prime Minister acknowledges the role of technology and apps in his
recent policy initiatives, including the 1000 crore Self Employment and Talent Utilisation
(SETU) incubation program that will support start ups in the technology area.

30
Bibliography
Analysys Mason Data
Apple Press Info (2009) Apple’s App Store Downloads Top Two Billion.
App Annie Data
Auerbach, Alan J., and Yuriy Gorodnichenko. Fiscal multipliers in recession and expansion.
No. w17447. National Bureau of Economic Research, 2011.
Basu, Medha. “UAE launches world’s first smart government app store” Asia Pacific
FutureGov. 31 March 2014: Web. 12 June. 2014.
Buvinich, Manuel J. Rojas. "The evaluation of rural development projects using the social
accounting matrix approach." Revista Brasileira de Economia 46.4 (1992): 555-594.
Crandall, Robert, Charles Jackson, and Hal Singer. "The effect of ubiquitous broadband
adoption on investment, jobs, and the US economy." Criterion Economics, LLC Released by
New Millennium Research Council.
DoT, National Broadband Policy, 2012.
“The European App Economy: Creating Jobs and Driving Growth”, (2013) by Vision Mobile
and Plum Consulting. Study sponsored by ACT4Apps
Ford, G. S., & Koutsky, T. M. (2005). Broadband and economic development: A municipal
case study from Florida. Review of urban & regional development studies, 17(3), 216-229.
Gartner Data
Gentzoglanis, A. (2007). International Competitiveness in the Telecommunications and ICT
Sectors: A Cross-Country Comparison. Centre interuniversitaire de recherche sur la science
et la technologie.
Google ‘Our Mobile Planet’ Data
Hirschman, Albert O. (1958). The Strategy of Economic Development. New Haven, Conn.:
Yale University Press
Hippel, Eric von, and Georg von Krogh. "Open source software and the “private-collective”
innovation model: Issues for organization science." Organization science 14.2 (2003): 209-
223.
IAMAI, Local Language Report, 2013.
"IAMAI launches Apps Foundation for developers." The Times of India [New Delhi] 26 June
2013: Print.

31
IDC Data
ITU Data
Kathuria et al. (2009) “Impact of Mobile” ICRIER
Kathuria and Kedia-Jaju, (2012) “India: Impact of Internet” ICRIER
Kathuria, R. & Srivastav S. (2014) “The Indian App Ecosystem.” LirneAsia.The Ford
Foundation.
Katz, Raul, and Stephan Suter. "Estimating the economic impact of the broadband stimulus
plan." Columbia institute for tele-information working paper (2009).
Katz, Raul L. "Estimating broadband demand and its economic impact in Latin
America." Proceedings of the 3rd ACORN-REDECOM Conference Mexico City May. Vol.
22. No. 23rd. 2009.
Katz, Raúl L. "II. The contribution of broadband to economic development."Fast-tracking the
digital revolution: Broadband for Latin America and the Caribbean: 49.,. pdf (2003).
Khan, Haider A., and Erik Thorbecke. "Macroeconomic effects of technology choice:
Multiplier and structural path analysis within a SAM framework." Journal of Policy
Modeling 11.1 (1989): 131-156.
Kim, Y., Kelly, T., & Raja, S. (2010). Building broadband: Strategies and policies for the
developing world. World Bank Publications
Koutroumpis, P. (2009). The economic impact of broadband on growth: A simultaneous
approach. Telecommunications Policy, 33(9), 471-485.
Law, Abhishek. "Developing India's app market." The Hindu [New Delhi] 1 Aug. 2012: The
Hindu Business Line. Web. 20 Jan. 2014.
Liebenau, J., Atkinson, R., Kärrberg, P., Castro, D., & Ezell, S. (2009). The UK's digital road
to recovery.
Mark Mulligan and David Card (2014), “Sizing the EU App Economy” Gigaom Research
Metrics Monk Data
Mandel, M. and Schere J. (2012), “The Geography of the App Economy”, CTIA – The
Wireless Association and Application Developers Alliance
"Next Breakthrough App Will Come from India: Microsoft." The Economic Times [New
Delhi] 3 April. 2014: Web. 12 June. 2014.
NASSCOM, The IT-BPM Sector in India, Strategic Review 2014

32
OECD (2013), “The App Economy”, OECD Digital Economy Papers, No. 230, OECD
Publishing.http://dx.doi.org/10.1787/5k3ttftlv95k-en
Pappas A. (2013). App Economy Forecasts 2013-2016, Vision Mobile.
Pappas A. (2014) Developer Economics Q1 2014: State of the Developer Nation, Vision
Mobile
Pradhan, Basanta K., M. R. Saluja, and Yashobanta Parida. "A Social Accounting Matrix for
India, 2005-06." Research in Applied Economics 6.1 (2014): p176-p201.
Polo, Clemente, and Elisabeth Valle. "A general equilibrium assessment of the impact of a
fall in tourism under alternative closure rules: the case of the Balearic Islands." International
regional science review 31.1 (2008): 3-34.
Pyatt, Graham, and Jeffery I. Round. "Accounting and fixed price multipliers in a social
ccounting matrix framework." The Economic Journal (1979): 850-873.
RBI Data
Salz P. (2014) Apponomics. InMobi
Saxena, Anupam. "Mozilla partners Spice and Intex to launch $25 Firefox phones in
India." The Times of India [New Delhi] 11 June. 2014: Web. 12 June. 2014.
Stone, Charles J. "The dimensionality reduction principle for generalized additive
models." The Annals of Statistics (1986): 590-606.
TRAI Performance Indicators Report, December 2013
TRAI (2012) Recommendations on Application Services.
VisionMobile: State of Developer the Nation Series.
Voskoglou C. (2013). Developer Segmentation 2013. VisionMobile.

33
Appendix 1: Ten most popular Facebook linked App Developers headquartered in India
(by Monthly Average Users)
Source: Metrics Monk, Last Accessed on March 23rd, 2015
Rank Developer
Most
Popular App
of the
Developer
Monthly
Average
Users
(MAU)
Headquarter
City App Category
Country
with
Maximum
Users
% of
Users in
the most
popular
Country
1 India times India times 723385 Gurgaon,
NCR
Infotainment and
Ecommerce
(extension of online
service)
India 83.2
2 Myntra Myntra 558338 Bangalore
Ecommerce
(Extension of online
service)
India 96
3 HashCube Sudoku
Quest
85253 Bangalore Gaming United
States 28.0
4 NDTV
Convergence NDTV 84625 Delhi
Local News &
Infotainment India 86.5
5 authorSTREAM
authorGEN
Technologie
s
75398
Chandigarh
(Another
office in
United states)
Productivity India 55.6
6 ChaYoWo
Games
Cricket
Master
Blaster
56689 Kochi Gaming India 49.5
7 RJ Softwares
Wordosaur
Crossword
Game
9827 Kolkata Gaming Data not
available
Data not
available
8 Oneindia.in Oneindia 13052 Bangalore Local News &
Infotainment India 63.4
9 ibibo web(p) Ltd Games365.i
n 2838
Gurgaon,
NCR
E-Commerce,
Travel
(Lifestyle)Entertain
ment & Gaming
Data not
available
Data not
available
10 Shufflr Shufflr 23 Bangalore Infotainment (Video
Sharing) Philippines 9.5

34
Appendix 2A: Top Facebook linked apps consumed by Indians (by Monthly Average
Users)
Rank Applicatio
n
Monthly
Average
Users
App Category Developer Headquarter
s
Country with
Maximum
number of Users
% of Users in
the most
popular
Country
1 Facebook 2552261 Social
Networking Facebook California
India (via
Samsung Mobile) 16.3
United States (via
Microsoft) 13.6
2 Truecaller 2005332
Utilities,
Communication
(Phone
Directory)
True
Software
Scandinavia
AB
Stockholm India 55.1
3 Gaana 1145464 Entertainment,
Music
Times
Internet
Gurgaon,
NCR India 87.4
4 YouTube 1089921 Communication
(Utilities)
Youtube
(Google) California United States 20.9
5 Astrology 714537 Lifestyle, Others
(Astrology)
Kudos
Media London United States 52.7
6 Trip
Advisor 667479 Lifestyle, Travel
TripAdvisor
, LLC
Massachusett
s United States 34.0
7 Skype 644091 Utilities, Other
Chat
Skype
Communica
tions
Luxembourg United States 11.3
8 Saavn 637645 Entertainment,
Music Saavn, LLC
New York,
United States India 70.6
9 Opera
Mini 612524
Entertainment,
Other
Opera
Software
ASA
Oslo, Norway India 27.8
Source: Metrics Monk Last Accessed on March 23rd, 2015

35
Appendix 2B: Top Facebook linked gaming apps consumed by Indians (by Monthly
Average Users)
Rank Application MAU App Developer Headquarter
s
Country with
Maximum number
of Users
% of Users in the
most popular
Country
1 Candy Crush Saga 8513804
King.com. London Delhi United States 16.8
2 Teen Patti 3978832 Octro, Inc Delhi, India India 97.7
3 Subway Surfers 2245046 Kiloo Games Aarhus,
Denmark
United States 12.0
4 Indian Rummy 1009151 Octro, Inc Delhi, India India 97.4
5 Criminal Case 998852 Pretty Simple Paris Brazil 16.7
6 8 Ball Pool 946425 Miniclip.com Neuchatel,
Switzerland
Indonesia 15.6
7 Farm Heroes Saga 725652 King.com London United States 14.1
8 Pet Rescue Saga 542854 King.com London United States 16.5
9 Clash of Clans 483153 Supercell Finland United States 20.1
10 Bubble Witch 336148 King.com London United States 16.6
Source: Metrics Monk, Last Accessed on March 23rd, 2015

36
Appendix 3: Social Accounting Matrix and the Mathematical formulation of the
Leontief Inverse Matrices and Type I and II multipliers
The Social Accounting Matrix (SAM) is a square matrix, where each row and column
represents receipt and expenditure respectively99. It has an endogenised household sector that
illustrates the flow from production to income, which then leads back to demand. The SAM
framework extends the input-output (I-O) model by including information on income
distribution and final demand.
SAM models are typically used to estimate the impact of a policy for an effective change in
demand/output/employment in any sector, capturing the feedback effect of consumption.
Unlike the input-output model, SAM is used to estimate the induced demand effect (or the
Keynesian multiplier) of developmental policies.100
The SAM used in this report comprises of seventy eight sectors and has been adopted from
Pradhan et al. (2013). 101 In order to isolate the employment multiplier for India’s app
economy we consider the rise in the demand for two sectors - Electrical Machinery and
Communication. Among others constituents, the former includes PC/Laptop, and other
peripherals including software and mobile handsets while the latter includes consumer
expenditure on mobile and fixed lines charges.102
The employment per unit output for each sector has been taken from the NSS 2009-10 data
on industrial employment which corresponds with SAM 2007-08. The output data is
converted into employment figures using this vector of employment levels. The mathematical
formulation of the Leontief inverse matrices and Type I and II multiplier, are provided below
Since demand from electronics and expenditure on communication cannot entirely be
attributed to the app ecosystem, we estimate the employment multipliers using a fraction of
the total demand in the two sectors.
The system of produce for each sector X can be written using the equation below
99 Refer World Bank Social Accounting Matrices and SAM–Based Multiplier Analysis, “Tool Kit for
Evaluating the Poverty and Distributional Impact of Economic Policies, Round (2003). Retrieved from
http://web.worldbank.org/WBSITE/EXTERNAL/TOPICS/EXTPOVERTY/EXTPSIA/0,,contentMDK:20481
426~menuPK:1108016~pagePK:148956~piPK:216618~theSitePK:490130~isCURL:Y,00.html 100 See: Pyatt, Graham, and Jeffery I. Round. "Accounting and fixed price multipliers in a social accounting
matrix framework." The Economic Journal (1979): 850-873.
Buvinich, Manuel J. Rojas. "The evaluation of rural development projects using the social accounting matrix
approach." Revista Brasileira de Economia 46.4 (1992): 555-594.
Auerbach, Alan J., and Yuriy Gorodnichenko. Fiscal multipliers in recession and expansion. No. w17447.
National Bureau of Economic Research, 2011.
Khan, Haider A., and Erik Thorbecke. "Macroeconomic effects of technology choice: Multiplier and
structural path analysis within a SAM framework." Journal of Policy Modeling 11.1 (1989): 131-156. 101 Pradhan, B. K, M.R. Saluja and A. K. Sharma (2013), A Social Accounting Matrix for India 2007-08, IEG
Working Paper No. 326 102 Refer to the concordance between SAM 2007-08 sectors and NSSO 2009-10 given in Pradhan, Basanta K.,
M. R. Saluja, and Yashobanta Parida. "A Social Accounting Matrix for India, 2005-06." Research in Applied
Economics 6.1 (2014): p176-p201.

37
X = AX+Y; (1)
where A is the input coefficient matrix and Y is exogenous final demand
To find the Type I employment multiplier, first we find the aggregate impact on output. We solve for
change in production of each industry given a marginal change in demand for a sector
dX = (I-A)-1dY = B dY (1’)
where B is the Leontief inverse, the coefficient matrix which measures the total output of sector i that
is required as input to produce one unit of output of sector j, accounting for the aggregate chain effects
of the direct and indirect requirements.
Now we close the I-O model by endogenizing the household sector to incorporate the induced effect,
the system under (1) becomes:
X = AX+Y (2)
where A is augmented input coefficient matrix with endogenous household sector and Y is exogenous
final demand
dX = (I-A)-1dY = B’ dY (2’)
where B’ now measures the total output of sector i that is required as input to produce one unit of
output of sector j, accounting for the aggregate chain effects of the direct, indirect and induced output
requirements.
To convert output into employment estimates, a vector of employment levels per unit output is
required, say W. The direct employment effect of a unit rise in demand for sector i’s produce would
be denoted by Wi. One unit increase in the final demand of sector j’s produce generates the N sectoral
aggregative effect of direct and indirect employment as:
Ej =∑ WiBij𝑁
𝑖=1 (3)
And for the aggregative effect of direct, indirect and induced employment:
E′j =∑ WiB′ij𝑁
𝑖=1 (3’)
Thus, Type-I employment multiplier for a unit rise in sector j’s final demand is given by:
∑ WiBij𝑁
𝑖=1/Wj (4)
And Type-II multiplier, where we use coefficients of matrix B’ instead of B:
∑ WiB′ij𝑁
𝑖=1/Wj (4’)
Changes in aggregate employment driven by changes in demand for the app ecosystem can
be determined by multiplying the multiplier estimates to the fraction attributed to apps.

38
Appendix 4: List of Stakeholder Consultations
1. AppsDaily
2. Qualcomm Ventures
3. Qualcomm
4. ShepHertz
5. MakeMyTrip
6. Times Internet
7. Get It Info Media
8. MCarbon
9. Spice Global
10. Mobile Harvest
11. Unicel Tech
12. Amazon
13. Samsung
14. Bellurbis
15. Blackberry

39
Appendix 5: Case Studies
5.1 Mobile Harvest Solutions103
Introduction
Mobile Harvest Solutions is an app development company that designs literacy neutral apps
to bring benefits of social networking and connectivity to those who are not proficient with
reading and writing. Having a development agenda, Mobile Harvest tailors its literacy neutral
apps to meet the needs of specific groups such as farmers, healthcare workers especially
women in rural India. Dubbed as an oral Wikipedia (where information is provided in
vernacular languages), one of Mobile Harvest’s more recent projects has been in
collaboration with UN Women, the Ministry of Science and Technology and Tekes, a Finnish
Funding Agency for Technology Innovation, to design apps that, inter alia, inform women of
government programmes and disseminate information related to family planning.
The Mobile Harvest interface is intuitive and minimalistic in nature. Launched as a pilot
project for farmers in Andhra Pradesh in 2012, the flagship Mobile Harvest app saw 1300+
media files uploaded within a month where farmers shared best practices on farming.
Information uploaded/accessed through this app was organized pictorially into groupings
such as irrigation, weather, pests, prices etc. to facilitate easy use.
Challenges
A challenge for the company is in exploiting domestic demand to the fullest. Low digital
literacy and awareness constrains the potential demand base of the Indian app economy. The
test for Mobile Harvest has been in scaling up and getting adequate funding for its ventures.
The UN Women venture lasted one year and saw a revenue of 12,60,000 INR. However, it
only managed to capture 30 monthly average users. The Indian app market, from the user-
side, is still young and highly fragmented. Venture capital firms in India seem to be targeting
the low-hanging fruit (low-risk infotainment/social networking apps for urban customers).
This makes Mobile Harvest’s novel endeavour all the more tricky.
To reach out to rural customers the requisite network infrastructure needs to be in place and
app companies like Mobile Harvest will need support of telecom operators, who have the
widest access to India’s rural prepaid segment, and OEMs who can pre-install certain apps on
their devices. The support of telecom operators will be particularly useful in facilitating the
billing of app services to those who do not have formal bank accounts/credit or debit cards.
Opportunity and Impact
The opportunity lies in the large untapped market. A study revealed that in rural India 43
percent of non-users of the internet said they would adopt the medium if it were provided in
103 This case study is based on a consultation the authors had with the founder of Mobile Harvest Solutions.

40
the local language.104 In urban India, 13.5 percent of non-users said that local language
content would inspire use of the internet.105 Given that most of this access would be through
mobile devices, the potential of apps like Mobile Harvest which operate in the vernacular
becomes evident. The impact of such apps could be significant but currently private funding
for such projects is conspicuous by its absence-these are driven mainly by NGOs,
governmental organisations and development finance agencies which while good for
individual efforts are not quite effective in establishing scale.
5.2 AppsDaily106
Introduction
AppsDaily is India’s home-grown app distribution platform which accounts the unique
challenges of the Indian app ecosystem. To circumvent the unfavourable mobile payment
regulation and cater to India’s digitally lay segment, AppsDaily established physical retail
outlets from where apps can be purchased using cash. The physical payments method has
gained toehold in India due to low debit/credit card penetration. Flipkart, a leading e-
commerce firm in India introduced cash on delivery for customers not owning credit cards or
those who were reluctant to use them. Like AppsDaily, Flipkart has been palpably successful.
In addition, AppsDaily with its physical attendant takes ‘pressure’ out of the process of
downloading apps and provides a comfortable alternative to the do-it-yourself model, which
is ill-suited to countries where large segments of the population are unfamiliar with digital
payments. AppsDaily has gained immense popularity as it addresses and exploits the current
gap in the market- low credit card penetration and low digital consciousness. Moreover, by
having stores with a physical attendant, AppsDaily has made the process of obtaining apps
easier. Such indigenous business model innovation is needed in the Indian app market, which
has its unique set of constraints, to increase creation and distribution of localised apps.
Challenges
Due to the envisaged risks, the RBI has taken a cautious approach towards enabling mobile
payments. There is a limit on the transaction amount and number of transactions a user can
make per day. Due to security concerns, password copying is not allowed and generally, the
failure rate of e-transactions is high due to weak network structure and the design of payment
gateways. This constrains the revenue generation potential of India’s app economy.
Opportunity and Impact
AppsDaily addresses these issues by enabling cash payments for apps. Its model has met with
success in India as over 1 million apps have been sold, over 10,000 outlets have been
104 IAMAI, Local Language Report, 2013. 105 Ibid. 106 This case study comes from Kathuria, R. & Srivastav S. (2014) The Indian App Ecosystem. LirneAsia.The
Ford Foundation. Retrieved from http://broadbandasia.info/wp-content/uploads/2013/03/The-Indian-App-
Ecosystem-Final-Report_afterEF2014.pdf and is based on a consultation the authors had with the CEO of
AppsDaily.
41
established and its reach extends across 140 cities.107 AppsDaily can install apps on a variety
of devices including Micromax, Samsung, Nokia, HTC etc. It has launched pilot programmes
in Australia, Bangladesh and Saudi Arabia.
5.3 eGov AppStore108
Introduction
As a part of the government’s vision to enhance efficiency, transparency and effectiveness of
public services using digital technology, DeitY and NIC launched the eGov AppStore in May
2013. eGov AppStore aims to propel the National e-Governance plan by providing a common
platform, where all apps are certified and from where government-to-government services
can be distributed across India. The apps are hosted on the National Cloud and are
customised such that they can be used by government agencies/departments at the Centre and
State level. The government believes that this will help in the deployment of e-governance
services across the nation and save different agencies the time and cost associated with
developing similar apps from scratch. While the eGov AppStore is in its preliminary stage,
where most apps are awaiting productization, DeitY has already released information on
which apps have been rated highly as per initial reviews (see table below).109
Top Apps on India’s e-Governance AppStore
App Name Purpose State
Government eProcurement System of NIC Generic Delhi
e-Hospital Health Tripura
Xtended Licensing and Laboratory Node Food & Drugs Gujarat
eOffice Digital Signing Tool (PDF Files) Generic Delhi
Public Distrubution System Common Application Platform Food & Consumer
Affairs
Delhi
eMunicipalities Suite for Urban Local Bodies Urbanisation Maharastra
eGranthayala: A Digital Agenda For Library Library and Informatics
Services
Delhi
Cooperative Core Banking Solution Banking Delhi
District and Subordinate Courts Software Legal Maharastra
Opportunity and Impact
As table 15 shows, the Government eProcurement System of NIC (GePNIC) is the top rated
app. It aims to bring greater transparency and simplicity to the process of government
procurement. The app seeks to establish a one stop shop for all services related to government
procurement and help both the bidders and organizers of tenders. In the state of Jammu and
Kashmir, GePNIC is widely used across major departments under the Mission Mode Project.
107See Official AppsDaily website: www.onwardmobility.com 108 Statistics and information obtained from the official website: http://apps.nic.in/about-us 109 Official website: http://apps.nic.in/about-us

42
This includes the Departments of Policy, Housing and Urban Development and Health and
Medical Education.
Second on the list of rated apps, is e-Hospital, an integrated Hospital Management
Information System, which has been adopted in Tripura. E-Hospital helps to digitalise
hopsital processes such as patient registration and is a store-house of information on patients,
past records, diseases, prescriptions etc. For example, e-Hospital provides doctors with
statistics on common diseases in the catchment area of the hospital in question.110 Impact
analysis of e-Hospital has shown tht the app has streamlined hopsital processes and increased
efficiency manifold (see table below).
Efficiency Gains due to e-Governance Healthcare App
Service/Facilities In Manual System Using e-Hospital@NIC
Patient Registration 1 minute 15 seconds per
new patient
35 seconds per new patient
Follow-Up Re-
Registration with
UHID)
15-30 minutes per patient 15 seconds per patient
Billing & Cash
Collection
2 - 4 hours per patient 30 seconds
Laboratory
Investigation report for
OPD patient
1 to 2 days Same day in most cases
Radiology Investigation
Report for OPD Patient
1 to 2 days Same day in most cases
Emergency Services
such as Ambulance,
Blood Bank, OT etc
Unmanaged and available
only at specific service
delivery counters.
Managed and available at all care points
Dietary Service Unmanaged diet
distribution among patient
as per diet scale
Managed diet distribution among patient as
per diet scale & linked with inventory system
of raw materials
Inventory Service Unmanaged with wastage
of valuable stocks
Reduced waste - no stockpiling or expired
products
Blood Bank Manual- inefficient Increase in blood utilization
*Donor's information shared and
disseminated helping donor deferral process
and avoiding repeat of expensive tests.
*Centralize Blood inventory information -
saves time, cost and makes blood banking
productive.
Care Planning by
Physicians
Care planning is event
based and time consuming
EMR of a patient helps physician in better
care planning and monitoring
Data shows that in terms of uptake, Delhi and Tamil Nadu have, thus far, adopted the greatest
number of e-governance apps (figure below). Since this initiative is in its initial stages, these
figures must be interpreted with caution.
110 http://tsu.trp.nic.in/ehospital/benefit.html
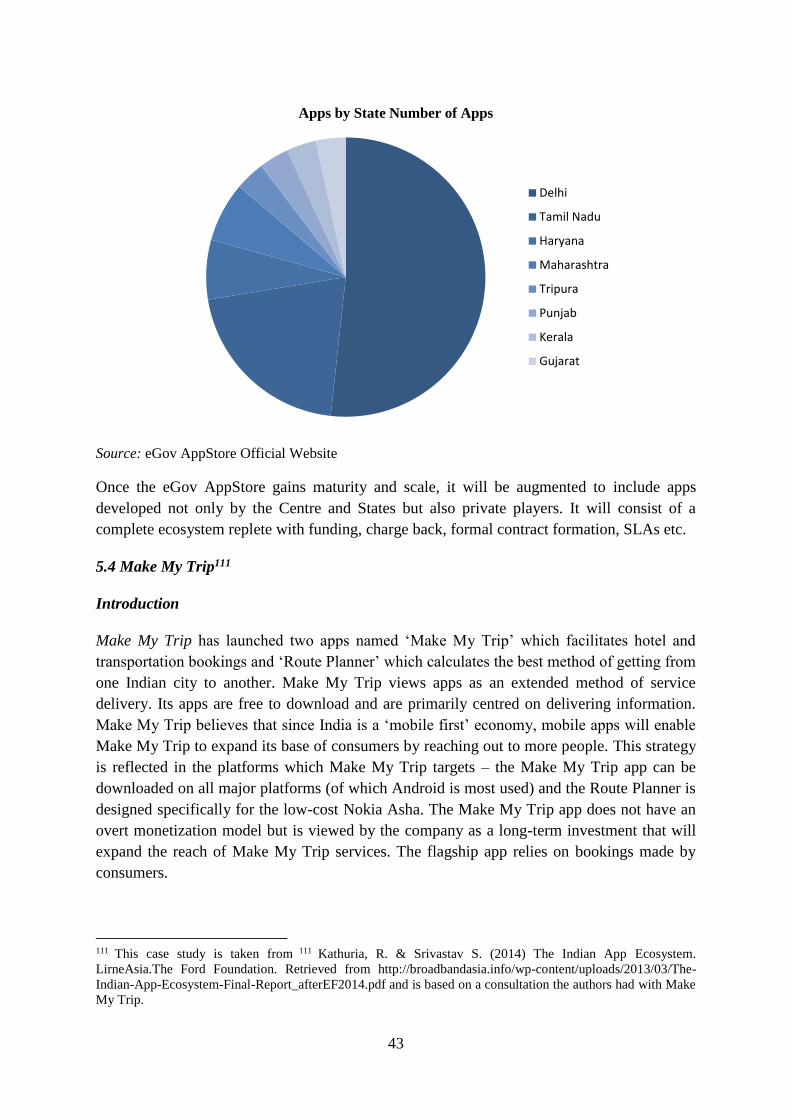
43
Source: eGov AppStore Official Website
Once the eGov AppStore gains maturity and scale, it will be augmented to include apps
developed not only by the Centre and States but also private players. It will consist of a
complete ecosystem replete with funding, charge back, formal contract formation, SLAs etc.
5.4 Make My Trip111
Introduction
Make My Trip has launched two apps named ‘Make My Trip’ which facilitates hotel and
transportation bookings and ‘Route Planner’ which calculates the best method of getting from
one Indian city to another. Make My Trip views apps as an extended method of service
delivery. Its apps are free to download and are primarily centred on delivering information.
Make My Trip believes that since India is a ‘mobile first’ economy, mobile apps will enable
Make My Trip to expand its base of consumers by reaching out to more people. This strategy
is reflected in the platforms which Make My Trip targets – the Make My Trip app can be
downloaded on all major platforms (of which Android is most used) and the Route Planner is
designed specifically for the low-cost Nokia Asha. The Make My Trip app does not have an
overt monetization model but is viewed by the company as a long-term investment that will
expand the reach of Make My Trip services. The flagship app relies on bookings made by
consumers.
111 This case study is taken from 111 Kathuria, R. & Srivastav S. (2014) The Indian App Ecosystem.
LirneAsia.The Ford Foundation. Retrieved from http://broadbandasia.info/wp-content/uploads/2013/03/The-
Indian-App-Ecosystem-Final-Report_afterEF2014.pdf and is based on a consultation the authors had with Make
My Trip.
Apps by State Number of Apps
Delhi
Tamil Nadu
Haryana
Maharashtra
Tripura
Punjab
Kerala
Gujarat

44
Challenges
Make My Trip’s development team consists of around 100 employees of which 25 are
devoted to mobile phone services. While aspects of the apps are developed in-house, other
elements such as, making the app functional across multiple platforms, are outsourced to
companies. In Make My Trip’s experience, it was difficult to access personnel who specialize
in interaction design. The process of finding a suitable company to whom parts of the app
development process could be outsourced was not easy (a total of 42 companies had to be
consulted before reaching a decision). While a paucity of skilled IT professionals in India is
unlikely, their accessibility may be limited due to the high price of their services. Companies
such as Sourcebits have experienced IT professionals but charge around 50 lakh rupees for
their services. This is out of reach for many parties.
A challenge at the user-end is that the growth of mobile transactions is constrained because of
certain mobile payment regulations. Due to the requirement of the One Time Password (OTP)
delivered by SMS, users have to exit the Make My Trip app, view their OTP and re-enter in
order to complete a transaction. This process is lengthy and increases the rate of failed
transactions. A parallel ecosystem constraint is the low penetration of credit and debit cards
in India which prohibits a large proportion of users from engaging in online shopping. When
asked if Make My Trip could consider routing payments through telecom operators, it was
found that due to the high price of trips, telecom operators would be wary of facilitating the
payment and taking on the associated risk.
Simplification of the mobile payment while maintaining its integrity is a challenge that needs
to be addressed while simultaneously improving credit card penetration and financial
inclusion, both long term goals in the field of vision of the policy maker.
When asked if language is an issue which may prohibit app adoption, Make My Trip
highlighted that there are people who, although not formally literate, are English aware. Make
My Trip has ensured that it can cater to this segment of the population by using a Natural
Language Processing program which interprets informal interjections, wrong spellings, and
phonetic typing to decipher what English-aware people are trying to convey. However, from
a long-term perspective, Make My Trip acknowledged that local language content is needed
to increase the penetration of mobile apps throughout India.
Parallel ecosystem adjustments, such as increasing wireless broadband penetration, are
equally important to ensure that apps can deliver rich content, perform optimally and that
users have a positive experience.
Opportunity and Impact
Despite the challenges, the Make My Trip app has experienced two million downloads and
20 percent of total hotel bookings are done via mobile devices. It has been found that a large
proportion of bookings made via the mobile app are same day/next day bookings reflecting

45
that the app has managed to tap into a new group of last-minute customers who would have
previously been unable to make such bookings if it were not for the mobile app.
5.5 Micromax112
Introduction
Micromax the second largest smartphone company in India and the tenth largest mobile
phone manufacturer in the world has disturbed the handset market and challenged incumbents
such as Samsung and Nokia, by offering affordable variants. Micromax aims to democratise
technology by providing smartphones that are at par with high-end handsets but offered at a
fraction of the price. This low margin and high volume strategy has helped Micromax
consolidate its presence in most South Asian countries, home to extremely price sensitive
consumers.
Challenges
A particular challenge for Micromax is to market itself as an ‘aspirational’ brand rather than
simply an affordable one. Currently, Micromax appeals to low- and middle-income groups
but wishes to expand its presence across higher-income segments as well. To this end,
Micromax has engaged in a number of first time innovations such as the thirty day battery
back-up, dual sim dual standby phones, and universal remote control mobile phones etc.
which make it a serious competitor to incumbent OEMs.
Opportunity and Impact
Being an Indian company, Micromax is contributing to the development of the Indian mobile
manufacturing ecosystem. While it is well known that Micromax’s R&D and design occurs in
India, it is less known that 100 percent of Micromax’s LEDs and tabs are also manufactured
locally. The company has also started making phones in India at a new facility in Rudrapur.
Therefore, Micromax represents an innovative Indian OEM which makes mobile devices
with many first time innovations at highly competitive prices. Micromax aims to expand its
services across the globe to become an international player.
5.6 Samsung113
Introduction
Samsung, India’s most popular handset vendor illustrates the case of how shifting value
distribution is forcing OEMs to reorient their strategies towards content as value migrates
from mobile hardware to software. While Samsung enjoys 32 percent market share in terms
112 Information obtained from official website http://www.micromaxinfo.com/ and stakeholder interactions. 113 Case study based on consultation with Samsung and data-based inference.

46
of value in the Indian mobile market, 114 it is acutely aware of the global trend of the
commoditization of smartphones.115
Challenges
Fierce competition from start up brands means that smartphones are becoming increasingly
homogeneous. This poses a serious challenge for brands like Samsung. Evidence shows that
the distribution of value between smartphones and apps is shifting in favour of the latter,
albeit from low starting levels. Apps are envisaged to contribute 33 percent by 2016 as shown
by figure below.116 Therefore, a part of Samsung’s long-term strategy to diversify into apps
and other value added services.
Global Share of Combined App Economy and Handset Revenue117
Source: VisionMobile and Portio Research
Opportunity and Impact
Samsung’s venture in the app space has been helped by its strength in the device segment.
Samsung’s official app store, Samsung Apps, comes pre-installed on every Samsung device.
To ensure that its app store is competitive against the app stores of competitors Google and
Apple, Samsung has partnered with Vodafone India and Aircel to enable carrier billing for
purchases made on its app store. In India, where mobile payments are cumbersome and
credit/debit card penetration meagre, this move will be act to galvanise purchase of apps. It
will also differentiate Samsung’s app store from Google Play and Apple’s App Store which
currently do not host this feature.
Another indication of Samsung’s intent to diversify towards software is the launch of its new
OS Tizen. In emerging markets such as India where there are large numbers of first time
smartphone users, a new OS like Tizen has greater chance to capture market share. Among
the first Tizen smartphones will be launched in India and Russia, thereby illustrating the
114 IDC Data 115 Pappas A. (2013). App Economy Forecasts 2013-2016, Vision Mobile. Retrieved from
http://www.visionmobile.com/product/app-economy-forecasts-2013-2016/ 116 Ibid. 117 Ibid.
18% 21% 24% 28% 33%
82% 79% 76% 72% 67%
2012 2013 2014 2015 2016
App Economy Handset Market

47
importance of the Indian market to Samsung’s strategy. Further initiatives such as Club
Samsung, an entertainment store selling Indian music, movies, songs etc., attest to the fact
that Samsung sees good prospects in the Indian smartphone market for content and apps. It is
interesting to note that Samsung is bundling hardware and content as a means to keep its
hardware competitive. For example, users of the smartphone, Grand 2, get discounts for Club
Samsung.
5.7 Vodafone India118
Introduction
Vodafone India, one of India’s largest telecom operators is engaging with the new reality of
increased data consumption and app usage. With its 52 million data customers, Vodafone
India is poised to become the Group’s top contributors in the next few years. Accelerated data
performance is one of the top reasons for its 13 percent year-on-year growth reported in early
2014.
Challenges
Chat and voice over internet protocol (VoIP) apps such as WhatsApp and Skype have the
potential to eat into operator revenue by diverting customers away from SMS and calling. On
the other hand, they can also increase revenue by augmenting data consumption. With the
shift towards chat and VoIP apps appearing inevitable, several telecom operators have
recognised the need to ride the wave and capitalise on the opportunity presented by the app
economy rather than pushback. Moreover with average revenue per user (ARPU) reaching a
plateau, data presents potential to bolster revenue. To be sure, operator revenue from data
services has remained constant at ten percent for the last decade. 119 This represents an
untapped segment of the market which can be exploited to the advantage of telecom operators
with the help of useful and easily accessible apps.
Opportunity and Impact
Vodafone India, itself a beneficiary of increased data consumption, has decided to ride the
app economy wave by launching its own app store, VStore. VStore is internationally
competitive as it offers app developers 70 percent of the total revenue generated by the app.
This is an important development in the Indian app market as hitherto, telecom operators
offered as little as 30 percent to the developer. This was at odds with the international
revenue sharing norm of 70-30 (where 70 percent went to the developer) and made Indian
app distribution platforms uncompetitive. VStore seems to be amongst the first telecom-
operator managed app distribution platforms that, thanks to international competition, has
corrected for this earlier failing.
118 Statistics and information collected from the official website: https://www.vodafone.in/pages/index.aspx 119 TRAI Data

48
VStore currently hosts 10,000 apps and games of which some are free and others are priced
between Rs. 5 – 150. The store’s most salient feature is that it has the option of carrier billing
where app purchases are either deducted from the prepaid balance or charged to the postpaid
bill. This feature is likely to gain traction in the Indian market as credit/debit card penetration
is only 21 percent.120 As mentioned earlier Vodafone India has also extended its carrier
billing services to other app distribution platforms such as Samsung Apps. These
arrangements show Vodafone India’s growing interest in the app economy. With 125 percent
year-on-year increase in data traffic, it is in Vodafone India’s strategic interest to promote
apps that will be an important feature of India’s second data-centric telecom revolution.
5.8 Firefox OS
Introduction
Firefox OS - Mozilla has entered the mobile space by launching the Firefox OS for
smartphones. Mozilla’s strategic interest lies in emerging markets where there are many first-
time smartphone users. It is believed that there is potential for the Firefox OS to gain market
share since only one in four individuals around the world has a smartphone. While the upper
segments of the market are saturated by sophisticated smartphones, there is potential at the
bottom of the pyramid. This is why Mozilla will launch a 25 USD (1500 INR) smartphone,
running the Firefox OS in India and Indonesia.
Low price points have the potential to trigger mass adoption. By bundling the Firefox OS
with affordable handsets, Mozilla has the capability to break into price sensitive markets such
as India. Mozilla has partnered with Intex and Spice to ensure that the smartphone attains
scale. The company is also using chips made by the Chinese manufacturer, Spreadtrum.
Given that the Firefox OS smartphone would be competitively priced one expects it to expose
the world of apps to more people in India.
The Firefox OS is different from other platforms in the sense that it is purely web-based.
Apps are not native to the device. This helps the Firefox OS have adaptive search and real-
time content display (which makes downloads a thing of the past). It also means that the OS
and its apps can adapt fairly easily to any device, regardless of screen size or other hardware
specifications. However, the challenge with a web-based OS is that connectivity to the
internet is crucial. Unlike other platforms, the Firefox OS loses much of its capabilities if the
smartphone is ‘offline.’ This could be problematic in countries with weak network
infrastructure.
Challenges
Nevertheless, if the requisite network coverage and capability are in place, the Firefox OS
and its ultra-cheap handset could have a transformative impact. The Firefox Marketplace
(Mozilla’s app store), is actively seeking to develop engaging content to further incentivize
users to buy its device. Attracting developers to make apps for a new OS is hard when large
120 RBI Data, 2011
49
incumbents such as Google and Apple have app stores that enjoy massive scale and a high
installed base.
However, through partnerships with local companies in developing markets, Mozilla seems
to be catching the attention of those who see enormous potential in the low-end segment.
Like other app stores, the Firefox Marketplace abides by global revenue sharing norms and
gives 70 percent of all app purchases and in-app purchases to developers.
Opportunities and Impact
For India, the introduction of the Firefox OS smartphone could help spread app usage at the
lower end of the distribution. As stated above, connectivity to the internet is essential for the
OS to function normally. If the Mozilla smartphone is successful, one could expect large
groups of new smartphone users in the market, creating new demand and increasing impacts.


![Quadrilateral Family[1] Rashmi Kathuria](https://static.fdocuments.in/doc/165x107/554cab70b4c905aa608b4606/quadrilateral-family1-rashmi-kathuria.jpg)