Pet Outlook 2014 - VIMAL KEDIA - Elite...
29
PET Overview Vimal Kedia Manjushree Technopack Limited Bangalore INDIA August 05, 2014 at the The Leela, Mumbai
Transcript of Pet Outlook 2014 - VIMAL KEDIA - Elite...

PET Overview
Vimal KediaManjushree Technopack Limited
Bangalore INDIA
August 05, 2014 at the The Leela, Mumbai


South Asia’s largest PET packaging co. converting 80,000 MTPAof resin into PET Preforms and Bottles

No. of production plants : 3 in BangaloreTotal built‐up area : 75,000 sq. mtr.No. of employees : 300 peopleContainers produced per annum : 350 millionPreforms produced per annum : 2.2 billion preformsPET Resin Conversion capacity : 225MT/day; 80,000 MTPA

Manjushree accounts for the conversion of almost 12 % of India’s PET Preforms and
Bottles

PET TRIVIA # 1Roohafza moves from Glass Bottle to PET
bottle after 108 years !
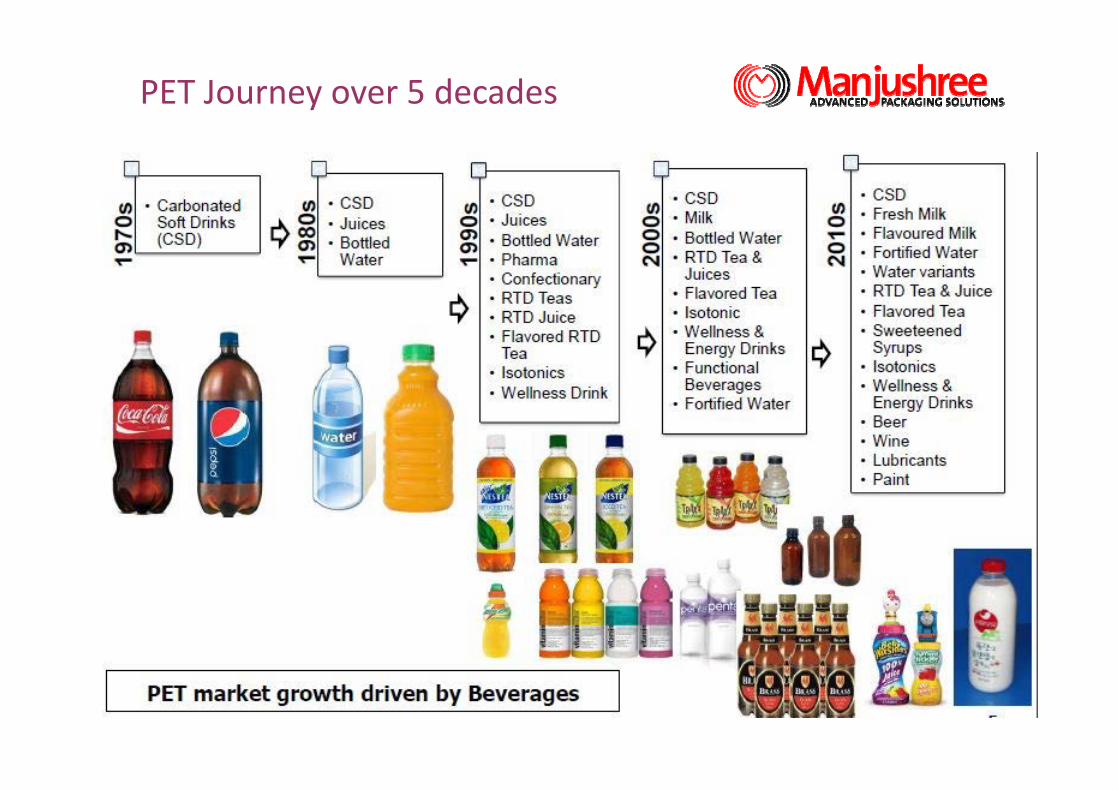
PET Journey over 5 decades

2016*80 MMT
201262 MMT
200851 MMT6%
25%
27% PET
41%
6%
25%
29% PET
41%
5%
24%
31% PET
40%
Filament PET PSF Film
PET is the fastest growing polymer in the world.
Global StatisticsBottle Grade (PET) – Share in Polyesters

Global StatisticsDemand‐Supply : 2012‐2016
MMTA
Europe
North America
CapacityDemandSurplus
2012 2013 20164.4 4.6 5.53.9 4.0 4.6.5 0.6 0.9
CapacityDemandDeficit
2012 2013 20163.6 3.9 4.94.0 4.1 5.0(.4) (0.2) (.1)
Asia
CapacityDemandSurplus
2012 2013 201611.8 13.5 14.06.3 6.9 9.75.5 6.6 4.3Middle East & Africa
CapacityDemandSurplus
2012 2013 20162.0 3.2 3.42.0 2.2 2.7
1.1 .7South America
CapacityDemandDeficit
2012 2013 2016.9 .9 1.2
1.4 1.6 1.9(.5) (.7) (.7)
World
CapacityDemandSurplusOp Rate
2012 2013 2016*
22.8 24.6 31.017.8 18.6 23.9
5 6 7.178% 75% 77%
Over the last 10 years, annual PET resin demand has grown from 9.4
MMT in 2003 to 18.6 MMT in 2013 & the world demand growth expected
@ 6 % CAGR in next 3 years

Indian per capita PET consumption

PET in IndiaA Quick Flashback !
KTA
Mid 80'sCentury Enka & Akzo Nobel
Pearlpet comes into market
End 80's Ester Industries
Early 90's Futura Polymers
Mid 1990 Elque Polyester SENPET
1997 Reliance Industries
2003 Dhunseri Petrochem & Tea
2008 JBF Industries

PET Demand In India
280340
425500
575
660
760
875
1006
2008‐09 2009‐10 2010‐11 2011‐12 2012‐13 2013‐14 2014‐15 2015‐16 2016 ‐17
DEMAND (KTA)

Consumption Pattern
In KTA
Non Alcoholic Beverages
Alcoholic Beverages
Non Beverages
Total Demand
07-08
76
32
102
210
09-10
140
50
150
340
12-13
295
80
200
575
13-14
350
90
220
660
15-16
450
125
300
875
Non Alcoholic Beverage : CSD, Water, Fruit drinks, Milk.: Water the growth driver
Alcoholic Beverage : Low priced, mass consumption liquor: PET replacing glass
Non Beverage : Health and Personal Care, Agro based, Cooking Oil, Confectionaries
• Beverages and bottled water continues to grow @ 15% & 20% respectively • Both Coke & Pepsi have announced large investments (US$ 5 billion) by 2020. • Coke in India has witnessed the highest growth in last few years and has climbed to 6th largest
growth centres globally in 2014 from 19th place in 2006, in Coke markets worldwide.

Indian PET Resin supply scenario
Total consumption estimates for 2013 – 2014 : 600,000 MT
Excess of supply over demand : 960,000 MT
Manufacturer PresentCapacity(KTA)
Expansion /Newcapacity(KTA) Total (KTA)
Dhunseri
Reliance
JBF
Micro PET
Total (KTA)
200 + 210
700
150 + 70
1330
‐
350 (2014)
Completed in Q1
210 (2014)
550
410
1040
220
210
1,880

Key Drivers for PET growth in India
• India : 126 Cr. as on Mar 2014 and growing annually at about 1.58%.
• China : 139Cr. As on Mar 2014 and growing annually at about 2.3%.
• The growing Population is expected to drive the demand for PET in a sustainable way.
Key Drivers for PET growth in India
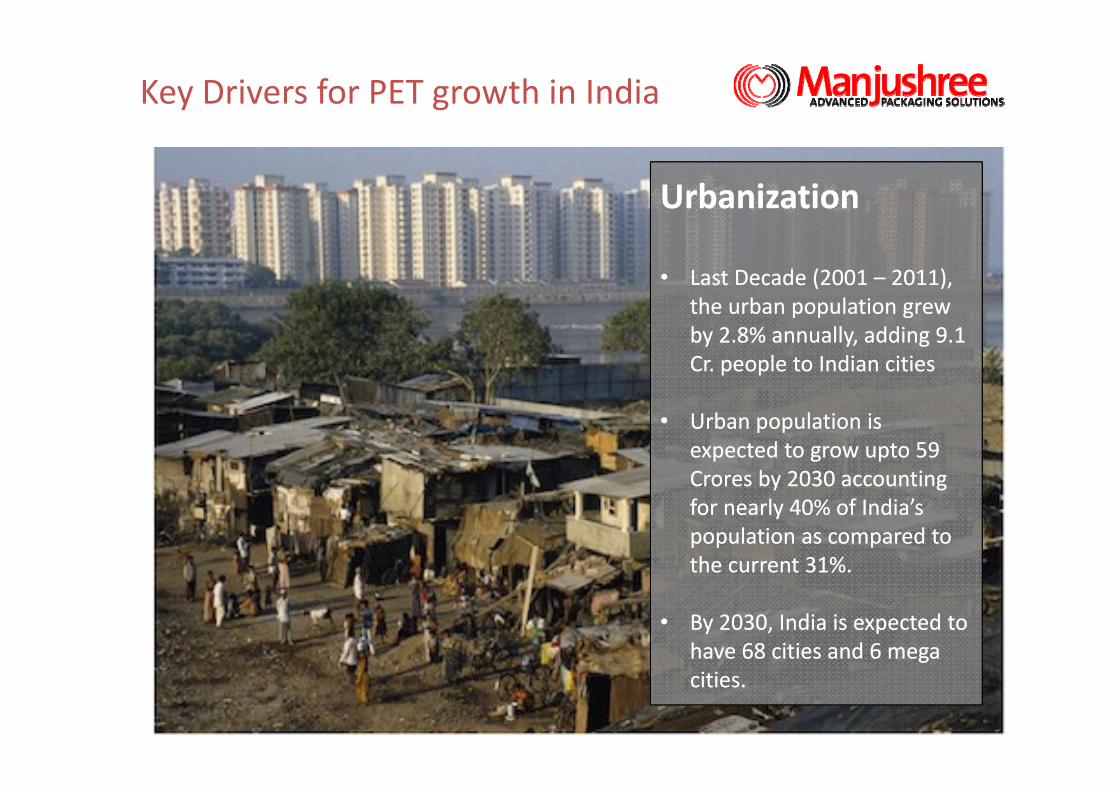
Urbanization
• Last Decade (2001 – 2011), the urban population grew by 2.8% annually, adding 9.1 Cr. people to Indian cities
• Urban population is expected to grow upto 59 Crores by 2030 accounting for nearly 40% of India’s population as compared to the current 31%.
• By 2030, India is expected to have 68 cities and 6 mega cities.

Key Drivers for PET growth in India
HIGH DISPOSABLE INCOME
• Per capita income
Rise of 10.4%
FY Per month Per Annum
2012 – 13 Rs. 5,279 Rs. 68,747
2013 – 14 Rs. 6,423 Rs. 74,920

Key Drivers for PET growth in IndiaAGE DEPENDENCY RATIO(Youth % of working‐age population)
• India’s growing youth population with high disposable income is a sign of growth for the PET resin industry
• In about 7 years, the median individual in India will be 29 years of age.
• Around 450 million people in India are in between ages 15 – 34, which is a high proportion of working age individuals in comparison with dependents.
• Estimated by 2020, India is set to become the world’s youngest country with 64% of its population in the working age group.

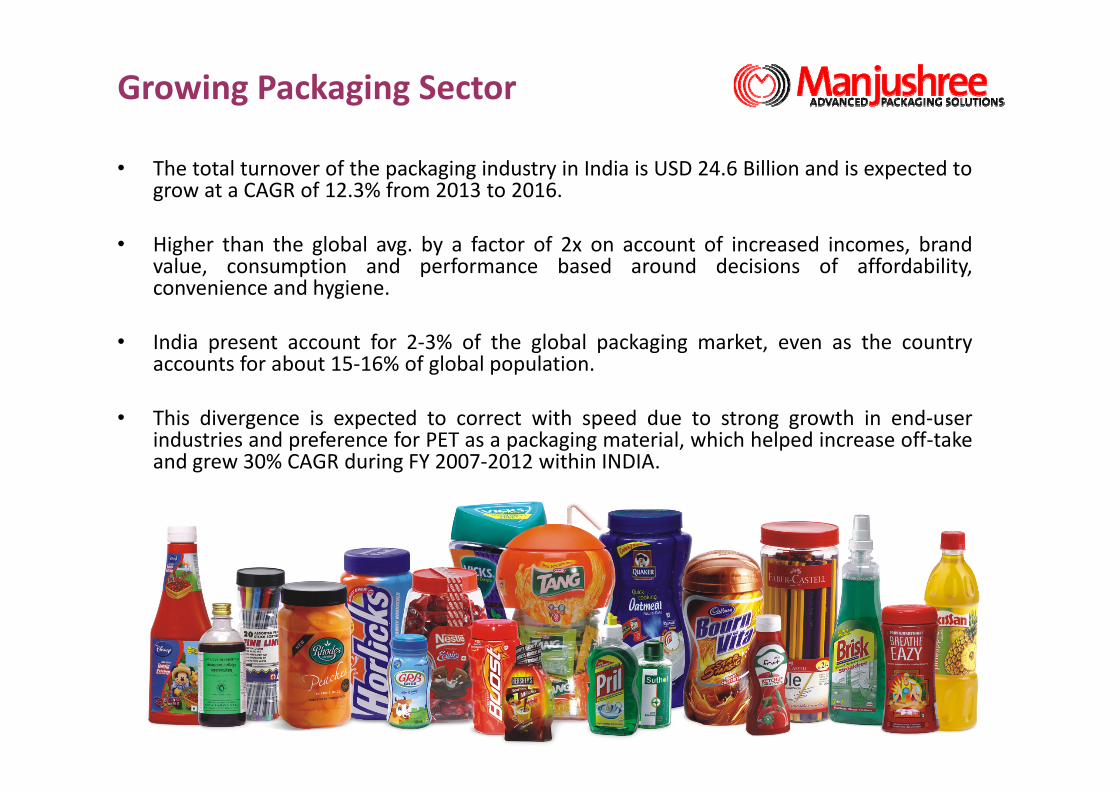
• The total turnover of the packaging industry in India is USD 24.6 Billion and is expected togrow at a CAGR of 12.3% from 2013 to 2016.
• Higher than the global avg. by a factor of 2x on account of increased incomes, brandvalue, consumption and performance based around decisions of affordability,convenience and hygiene.
• India present account for 2‐3% of the global packaging market, even as the countryaccounts for about 15‐16% of global population.
• This divergence is expected to correct with speed due to strong growth in end‐userindustries and preference for PET as a packaging material, which helped increase off‐takeand grew 30% CAGR during FY 2007‐2012 within INDIA.
Growing Packaging Sector

PET TRIVIA # 2Amul’s 200ml SKU moves
from the 200g Glass bottle to a ultralight 15gm PET Bottle!
Capacity of 1.2 million bottles/day !

Water, 21%
CSD, 17%
Flavoured Beverages, 6%Alcoholic
Beverages, 14%
Jar/Confectionary/Retail, 12%
Health Care, 10%
Personal Care, 8%
Cooking Oil, 5%
Agro Chemicals, 2%Others, 6%
India ‐ Current Scenario

India ‐ Current Scenario
PET: Fastest growing Rigid Packaging Material
Indian Market growing @ 15% CAGR
Organized retail expected to Take off
East,7%
South,23%
West,33%
North,37%
Beverages, Personal Care, Healthcare,....
PET - Expanding in new Application areas
Regional Market Spread
Per capita consumption of Beverages in India is only 6 ltrs against the global figure of 30 ltrs.
Similarly for Water , it is 5 ltrs in India against 24 ltrs globally

Import Duty on PET: 5.5 %
Anti-Dumping Duty on PTA in INDIA
2012-13 the total import in India is approx. – 45 KMT
The first ever Bio-MEG plant is located in Central India.
India ‐ Current Scenario contd…
Customers
Very Large
(KTA)
>10
5-10
Percentage
30
15Large
Medium 2-5
<2
25
30Small

India – Emerging Trends
Fresh & Flavoured
milk
AlcoholicBeverages
Juices &Drinks
Wine & Beer Lube oil

Recycled PET
Indian Polyester Market~3.6MMT
PET bottle consumption~0.7MMT
Collection rate~70% in spite of poor bin culture
Recycling Industry growing at 25%
2012PET ChipsConsumption
Collection Rate
PET bottle Collection
Global
KT/Yr
%
kt/yr
18000
46
8280
China
3300
90
2970
India
660
70
462
India has the second highest collection rate.
India – Emerging Trends