^r^ J^ cLo €L^ to BY rli«s*«;-
32
NASA TECHNICAL MEMORANDUM CNI i X NASA TM X-2979 -*"*•». 19ft X53S» S3JT53 r^esS C! 3 1^^ ^r^ J^L €"^ to- 1^ SI K« i^^^iL rli«s*«« co BY; COMPUTER STUDY OF EMERGENCY SHUTDOWNS OF A 60-KILOWATT REACTOR BRAYTON SPACE POWER SYSTEM by Roy C. Tew and Kent S. Jefferies Lewis Research Center Cleveland, Ohio 44135 NATIONAL AERONAUTICS AND SPACE ADMINISTRATION • WASHINGTON, D. C. • FEBRUARY 1974
Transcript of ^r^ J^ cLo €L^ to BY rli«s*«;-

NASA TECHNICAL
MEMORANDUM
CNIi
X
NASA TM X-2979
-*"*•». 19ft X53S» S3JT53 r̂ esS C! 3 1^̂^r^ J^L €"^ to- 1^ SI K«i^^^iL rli«s*««
co BY;
COMPUTER STUDY OF EMERGENCYSHUTDOWNS OF A 60-KILOWATT REACTORBRAYTON SPACE POWER SYSTEM
by Roy C. Tew and Kent S. Jefferies
Lewis Research Center
Cleveland, Ohio 44135
NATIONAL A E R O N A U T I C S AND SPACE ADMINISTRATION • WASHINGTON, D. C. • FEBRUARY 1974

1. Report No.
NASA TM X-29792. 'Government Accession No. 3. Recipient's Catalog No.
4. Title and Subtitle
COMPUTER STUDY OF EMERGENCY SHUTDOWNS OF A
60-KILOWATT REACTOR BRAYTON SPACE POWER SYSTEM
5. Report DateFebruary 197**
6. Performing Organization Code
7. Author(s)
Roy C. Tew and Kent S. Jefferies8. Performing Organization Report No.
E-7651
9. Performing Organization Name and Address
Lewis Research CenterNational Aeronautics and Space AdministrationCleveland, Ohio 44135
10. Work Unit No.502-25
11. Contract or Grant No.
12. Sponsoring Agency Name and AddressNational Aeronautics and Space AdministrationWashington D.C. 20546
13. Type of Report and Period Covered
Technical Memorandum
14. Sponsoring Agency Code
15. Supplementary Notes
16. Abstract
A digital computer study of emergency shutdowns of a 60-kWe reactor Brayton powersystem was conducted. Malfunctions considered were (1) loss of reactor coolant flow,(2) loss of Brayton system gas flow, (3) turbine overspeed, and (4) a reactivity insertionerror. Loss of reactor coolant flow was the most serious malfunction for the reactor.Methods for moderating the reactor transients due to this malfunction are considered.
17. Key Words (Suggested by Author (s) I
Digital simulation; Reactor; Brayton powersystem; System analysis; Heat exchanger;Shutdown; Scram
18. Distribution Statement
Unclassified - unlimited
Cat. 2219. Security Classif. (of this report)
Unclassified20. Security Classif. (of this page)
Unclassified21. No. of Pages
30
22. Price*
$3.00
*For sale by the National Technical Information Service, Springfield, Virginia 22151

COMPUTER STUDY OF EMERGENCY SHUTDOWNS OF A 60-KILOWATT
REACTOR BRAYTON SPACE POWER SYSTEM
by Roy C. Tew and Kent S. Jefferies
Lewis Research Center
SUMMARY
A digital computer study of emergency shutdowns of a 60-kilowatt reactor Braytonpower system was conducted. The purpose of the study was to evaluate a proposed reac-tor emergency shutdown (scram) procedure. . The procedure consists of rapid sequentialstepping of eight reactor control drums (neutron reflectors) in the direction of decreasingreactivity and power whenever certain reactor variables exceed specified limits. Thesimulated malfunctions which initiated the shutdowns were: (1) loss of reactor coolantflow, (2) loss of Brayton power conversion system gas flow, (3) turbine overspeed (fromloss of electrical load), and (4) a reactivity insertion error. The resulting reactortransients were evaluated on the basis of design limits on reactor critical variables.The design limits used were preliminary in nature and may be more restrictive thannecessary.
With sudden loss of reactor coolant flow to 1 percent of the design value and use ofthe proposed scram rate of 200 drum steps per minute (each step having a reactivityvalue of 0. 5 cent), the reactor would exceed certain design limits by a wide margin.Two methods found to moderate the reactor temperature transients for this malfunctionwere: (1) increasing the scram rate and (2) supporting the coolant flow at some percentof the design value. Supporting the coolant flow at 10 percent of its design value wasmore effective than an instantaneous scram of the reactor in reducing the excessive tem-perature change across the reactor and about as effective in reducing peak core tempera-ture. However, even with coolant flow supported at 10 percent of design, the maximumreactor AT and the peak core temperature were excessive. The turbine overspeedmalfunction resulted in a reactor AT which was 20 percent greater than the recom-mended maximum in the steady-state condition. For the reactivity insertion malfunctions,the maximum reactor AT was about equal to the recommended maximum for the runsmade. The loss of gas flow malfunction was not a problem.
INTRODUCTION
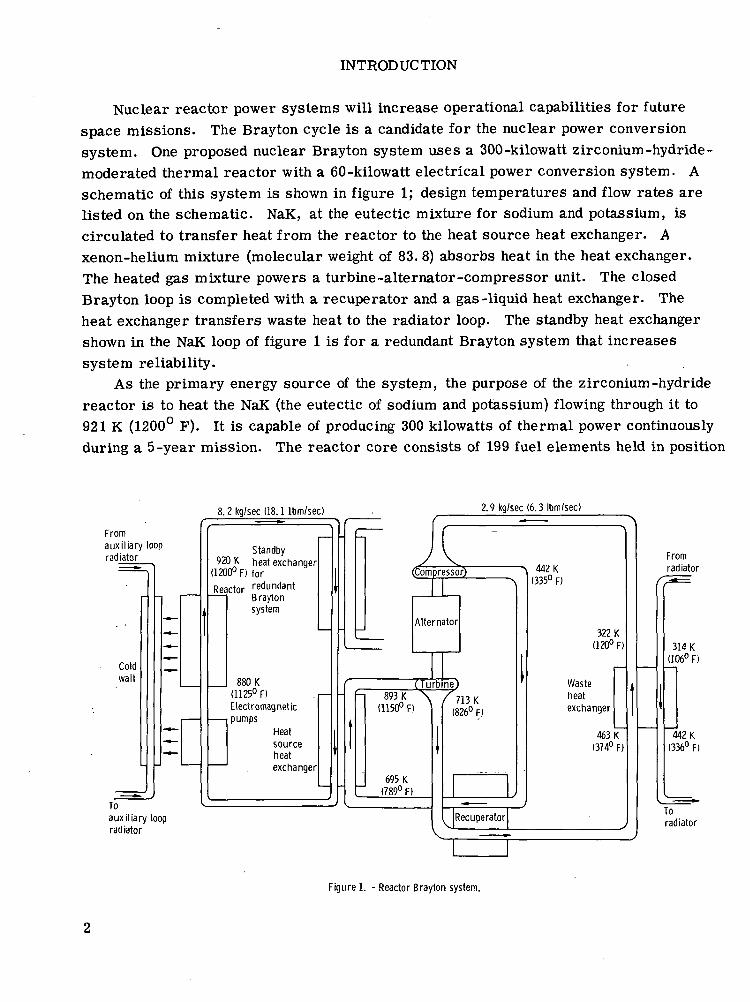
Nuclear reactor power systems will increase operational capabilities for futurespace missions. The Brayton cycle is a candidate for the nuclear power conversionsystem. One proposed nuclear Brayton system uses a 300-kilowatt zirconium-hydride -moderated thermal reactor with a 60-kilowatt electrical power conversion system. Aschematic of this system is shown in figure 1; design temperatures and flow rates arelisted on the schematic. NaK, at the eutectic mixture for sodium and potassium, iscirculated to transfer heat from the reactor to the heat source heat exchanger. Axenon-helium mixture (molecular weight of 83. 8) absorbs heat in the heat exchanger.The heated gas mixture powers a turbine-alternator-compressor unit. The closedBrayton loop is completed with a recuperator and a gas-liquid heat exchanger. Theheat exchanger transfers waste heat to the radiator loop. The standby heat exchangershown in the NaK loop of figure 1 is for a redundant Brayton system that increasessystem reliability.
As the primary energy source of the system, the purpose of the zirconium-hydridereactor is to heat the NaK (the eutectic of sodium and potassium) flowing through it to921 K (1200° F). It is capable of producing 300 kilowatts of thermal power continuouslyduring a 5-year mission. The reactor core consists of 199 fuel elements held in position
8.2 kg/sec (18.1 Ibm/sec) 2.9 kg/sec (6.3 Ibm/sec)
Fromauxiliary loopradiator
Coldwall
Toauxiliary loopradiator
Standby920 K heat exchanger
(1200° F) forReactor redundant
Braytonsystem
880 K(1125° f}Electromagneticpumps
Heatsourceheatexchanger
Lorn jressorj
Alternator
(Turbine)-| 893 K \
(1150° F)
J 695 K(789° F)
/ 7 1 3 K(826° F)
V
-»
Recuperator>
heatexchanger
4631374°
442nK
(335° F)
322 K(120° F)
Waste
Fromradiator
314 K(106° F)
442 K(336° F)
Toradiator
Figure 1. - Reactor Brayton system.

Four NaK outlet pipes-\
Outlet manifold
Upper grid plate-v
Control drum(full-in)-
Core vessel -•'
*r,mw/>nlf'//*l/f^M/*,fAV**f*vf,
wmmxm m wmwmv,
MMM 1 i| W&M&
o \
-Outletplenum
s- Four NaKinlet pipes
trr
-Lower grid plate
-Inlet plenum
-Inlet manifold
^Control drum actuator
Figure 2. - Reactor assembly.
by two grid plates, as shown in figure 2. The control drums, which surround the reac-tor core, control the nucleonic reaction by reflecting neutrons back into the core. Toprovide an inherent power stability, the reactor core was designed to have negativetemperature coefficients of reactivity through physical expansion effects. For example,a random increase in power resulting in a rise in reactor temperature will expand thecore structure thereby increasing leakage of neutrons from the core and reducing thepower back toward its original level.
Eight control drums are the only devices used to control the reactor. The drums canbe moved in small steps and are used for reactor startup, for reactor control duringpower conversion system startup and other transients, for balancing the reactivitychanges caused by fuel depletion, and for reactor shutdown. A cold wall and an auxiliary(NaK) coolant loop are used to cool the reactor control drums.
Reactor thermal transients need to be studied for several reasons. First, there arepotential hazards from radioactivity. Safe operating procedures must therefore be
developed to assure long-term structural integrity of the reactor. Particular attentionmust be paid to transients which would follow potential system malfunctions. Thesetransients could subject the reactor to severe thermal stress. An additional require-ment (which constrains the thermal transients even more than the safety requirement)is that the emergency shutdown procedure must be such that the reactor can withstandthe transients and be capable of restart.
The study reported herein evaluated the proposed reactor emergency shutdown(scram) procedure for certain reactor Brayton system malfunctions. The proposedscram procedure consists of rapid sequential stepping outward of eight control drums(neutron reflectors) to decrease reactivity and power. The study was performed usinga digital computer dynamic simulation of the power system.
Four types of malfunctions were studied: (1) loss of reactor coolant (NaK) flow,(2) loss of gas flow, (3) turbine overspeed, and (4) reactivity insertion error. In thestudy, the reactor was scrammed following a malfunction if a critical variable exceededa specified design limit. For each malfunction, one or more runs were made to evaluatethe effect of changes in shutdown procedure and/or operating conditions on the reactorthermal transients.
DIGITAL COMPUTER SIMULATION
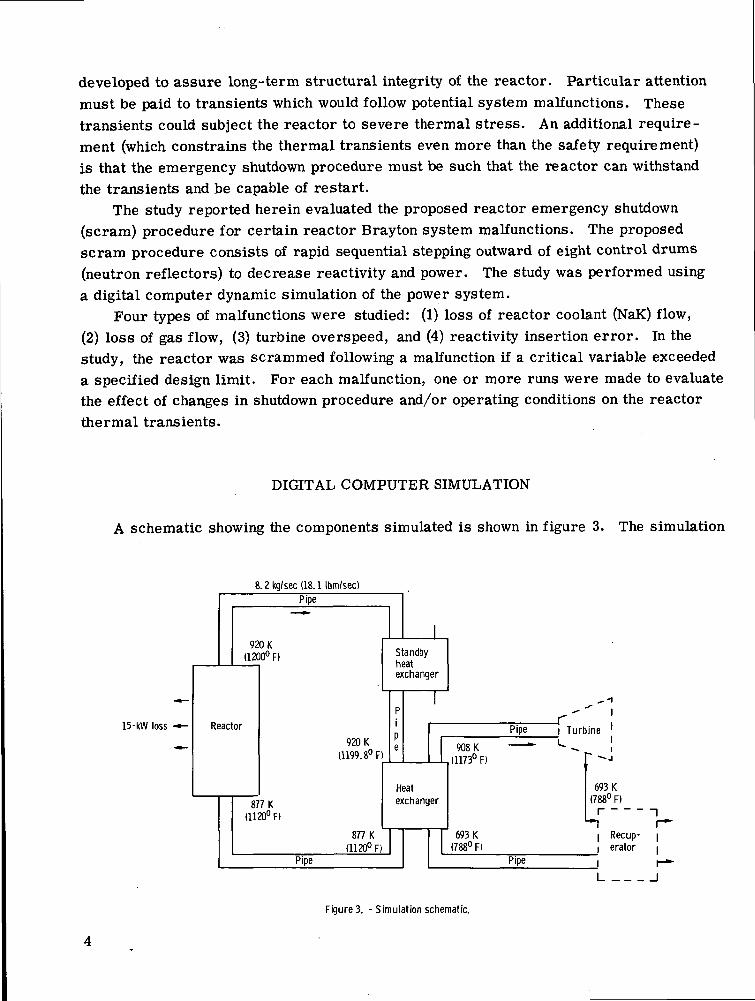
A schematic showing the components simulated is shown in figure 3. The simulation
8.2 kg/sec (18.1 Ibm/sec)
15-kW loss
Pipe
920 K(1200° F)
Reactor
920 K(1199. 8° F)
877 K(1120° F)
877 K(1120° F)
Pipe
I I
Figure 3. - Simulation schematic.

included the reactor, the Brayton heat source heat exchanger and the standby Braytonheat source heat exchanger. Pipe line delays in the NaK loop were simulated, but thepipe heat capacity was neglected because it was small compared to the NaK heatcapacity. Pipe line delays in the gas loop including the effects of pipe heat capacitywere simulated.
The turbine and recuperator do not directly influence reactor dynamics« Theywere therefore represented by extremely simple models. The outlet temperaturefrom the turbine was approximated by a linear function of turbine inlet temperature.The temperature out of the recuperator (going to the heat source heat exchanger) wasassumed to follow the turbine outlet temperature (minus a small AT) as a first-orderlag. These approximations yielded results sufficiently similar to the results of a moredetailed gas loop simulation to justify their use in this study of reactor transients.
Because the cold wall has considerable thermal mass, the temperature changes ofthe auxiliary loop occur too slowly to significantly influence the scram transients. Thisloop was not simulated, although a power loss to the cold wall (proportional to reactor
• power) was simulated.The reactor model was the most important part of the system model for the tran-
sients studied. The method of simulation is described briefly hereinafter. Furtherdet'iils of the reactor model are presented in appendix A. A block diagram of thereactor model is shown in figure 4.
The reactor model included: (1) a calculation of excess reactivity as a function oftemperature and control drum position, (2) a simulation of reactor power dynamicsincluding six delayed neutron groups, (3) a sinusoidal distribution of reactor poweraxially within the core, (4) first-order lag representations of the thermal capacities of
eadbar
ITJ:
d Controldrumsand ac-tuator
Figure 4. - Block diagram of reactor simulation.

the manifolds, plenums, and grid plates, (5) a 20-lump simulation (along the flow direc-tion) representing the heat transfer dynamics in the core, and (6) a model of reactordecay heat following shutdown. Conduction of heat along the flow axis was neglected.
The heat source heat exchanger model was a 10-lump representation of heat trans-fer dynamics. NaK, metal, and gas temperature were computed for each lump. TheNaK and metal temperature computations included the effect of heat energy storage with-in the heat exchanger. The computed gas temperature distribution did not account forheat storage because very little energy is stored in the gas.
The initial system conditions (approximately the design conditions) prior to simu-lated system malfunction are shown in the schematic in figure 3. Initial reactor powerwas 336 kilowatts. This includes a 15-kilowattloss from the control drums to the coldwall and a 3-kilowatt radiation loss from the NaK piping. Design reactor coolant flowand gas flow were 8.1 and 2. 8 kilograms per second (18.1 and 6. 3 Ibm/sec), respec-tively. Constants used in the simulation such as heat capacities, heat transfer coeffi-cients, inventories, and so forth are listed in appendix B.
REACTOR CONTROL AND EMERGENCY SHUTDOWN
Normal Control
During normal reactor operation, the reactor coolant outlet temperature is withina range (deadband) of 913 to 933 K (1185° to 1220° F). Moderate disturbances, such aslong-term fuel depletion, cause the coolant temperature to drift outside of this temper-ature range. If the temperature drifts below 913 K (1185° F), a neutron reflector controldrum is stepped slightly inward. This causes reactor power to increase. The increasedpower causes reactor coolant outlet temperature to increase. If the outlet temperaturehas not returned to the deadband range after 1 minute, drum steps continue at 1 minuteintervals. Likewise, if the outlet temperature drifts above 933 K (1220° F), the controldrums are stepped outward. The reactivity worth of each control drum step is between0. 5 and 1. 3 cents per step. The step worth depends on the angular position of thecontrol drums. A worth of 0. 5 cent per step was used for the computer transientsreported herein.
Emergency Shutdown
When system variables exceed certain design limits, an emergency shutdown (scram)occurs. The emergency control steps the reflector drums outward at 200 steps perminute. The rate of reactivity decrease is between 1 and 2.6 dollars per minute de-

pending on control drum worth. The. emergency, shutdown can be. initiated by (1) loss ofreactor coolant flow (to a value less than «50 percent of design), (2) reactor powerbeing too high (~25 percent above design), or (3) reactor outlet temperature being toohigh («20 K or 30° F above the upper deadband limit).
The following procedure was used in running the shutdown transients on the com-,puter:
(1) The runs started with the system operating at steady state with approximatelydesign conditions. Some runs started with the outlet temperature at the middle of thedeadband range, 921 K (1200° F). Other started with it at the top, 933 K (1220° F).
(2) The malfunctions were simulated as follows:(a) Loss of reactor coolant flow: one second ramp in flow from the design
value, 8.2 kilograms per second (18.1 Ibm/sec), to the final value (usually 1 percentof design).
(b) Loss of gas flow: one second ramp in flow from the design value, 2. 9kilogram per second (6.3 Ibm/sec), to the final value (usually 1 percent of design).
(c) Turbine overspeed: the increase of gas flow rate following turbine over-speed was computed using the separate gas loop simulation. The time history of gasflow from that run was used as an input for the reactor shutdown transient run.
(d) Reactivity insertion error: one of the eight control drums rotates inwardat its fastest possible fate (usually one step every 0. 04 min, 12. 5 cents/min). Thisfastest rate is built into the control drum system. The scram rate is eight times thisfastest rate because there are eight control drums.
Key system variables, such as reactor power and temperatures, were studied todetermine if the transient would have exceeded reactor design limits.
RESULTS AND DISCUSSION
Peak fuel temperature and temperature rise across the reactor were used toevaluate the effect of the four types of malfunctions on the reactor. Peak fuel temper-atures above 1033 K (1400° F) and temperature rise across the reactor greater than56 K (100° F) were considered to be too severe; that is, damage to the reactor mightresult.
Loss of Primary Coolant Flow
For the coolant flow malfunction, primary loop flow was ramped from design flowto 1 percent of design in 1 second. The simulated controller went into the scram modewhen the primary coolant flow dropped below 50 percent of its design value. Also, the
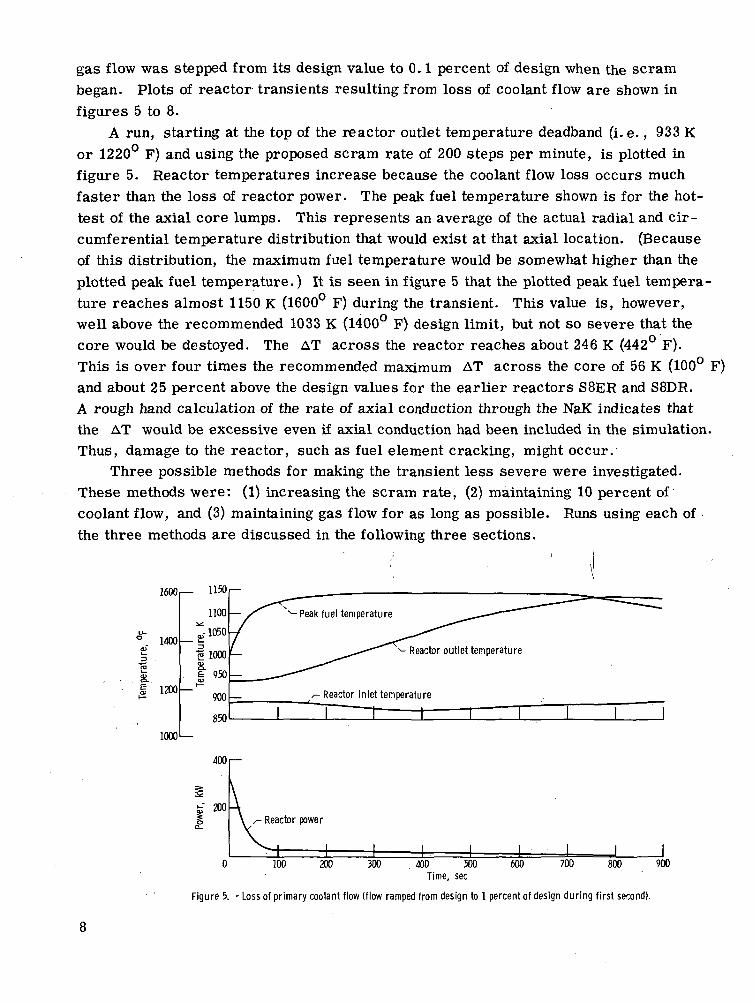
gas flow was stepped from its design value to 0.1 percent of design when the scrambegan. Plots of reactor transients resulting from loss of coolant flow are shown infigures 5 to 8.
A run, starting at the top of the reactor outlet temperature deadband (i. e., 933 Kor 1220° F) and using the proposed scram rate of 200 steps per minute, is plotted infigure 5. Reactor temperatures increase because the coolant flow loss occurs muchfaster than the loss of reactor power. The peak fuel temperature shown is for the hot-test of the axial core lumps. This represents an average of the actual radial and cir-cumferential temperature distribution that would exist at that axial location. (Becauseof this distribution, the maximum fuel temperature would be somewhat higher than theplotted peak fuel temperature.) It is seen in figure 5 that the plotted peak fuel tempera-ture reaches almost 1150 K (1600° F) during the transient. This value is, however,well above the recommended 1033 K (1400° F) design limit, but not so severe that thecore would be destoyed. The AT across the reactor reaches about 246 K (442° F).This is over four times the recommended maximum AT across the core of 56 K (100° F)and about 25 percent above the design values for the earlier reactors S8ER and S8DR.A rough hand calculation of the rate of axial conduction through the NaK indicates thatthe AT would be excessive even if axial conduction had been included in the simulation.Thus, damage to the reactor, such as fuel element cracking, might occur.
Three possible methods for making the transient less severe were investigated.These methods were: (1) increasing the scram rate, (2) maintaining 10 percent ofcoolant flow, and (3) maintaining gas flow for as long as possible. Runs using each ofthe three methods are discussed in the following three sections.
,_ 1150
1100
g-lOSO
"I 1000a.| 950
900
850
1400
s.I 1200
1000
Reactor outlet temperature
- Reactor inlet temperature
4001—
200Reactor power
0 100 200 300 400 500 600 700 800 900Time, sec
Figure 5. - Loss of primary coolant flow (flow ramped from design to 1 percent of design during first second).
1600
'. 1400
S.I 1200
1000
— 1150
1100
£-1050
f 1000
I 950
900
850
400
fe 200
0
1600,— 1150
1100
Reactor outlet temperature
r- Reactor inlet temperature
1—H I I
Reactor power
(a) Scram rate, 200 steps per minute.
'. 1400
1200
10001—
_ a,-1050
f 1000o>
I 950, I—
900
850
•*- Reactor outlet temperature
- Reactorlnlet temperature
± ± ±
300 400 500Time, sec
600 700 800 900
(b) Scram rate, 400 steps per minute.
Figure 6. - Effect of scram rate on loss of primary coolant flow malfunction. (Flow ramped from design to 1 percentof design during first second.)

1600|- "50
1100
Ea
1400
1200
1000
. £-1050
11000aI 950
900
850
400
fe 200
Reactor outlet temperature
-Reactor inlet temperature
I I I
-Initial reactor power
^Reactor power
0 100 200 300 400 500 600 700 800 900Time, sec
(c) Instantaneous scram.
Figure 6. - Concluded.
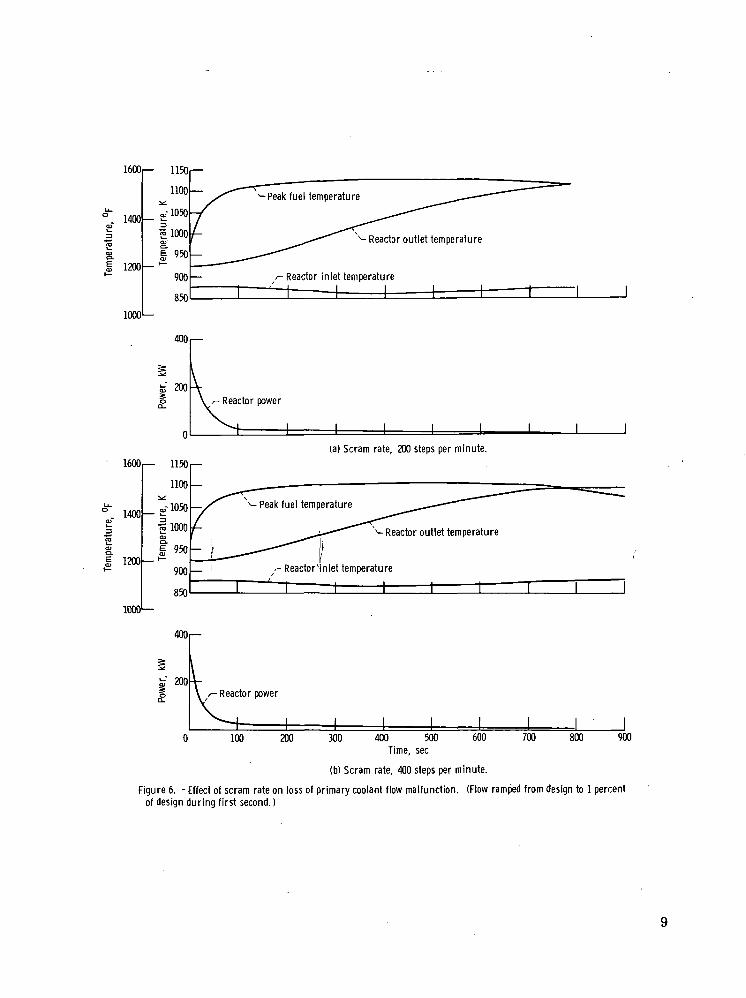
tEffect of scram rate. - Three computer runs were made with different scram rates.
For these runs, the reactor outlet temperature starts at the center of the deadband range,921 K (1200° F). The results in figure 6(a) show the effect of the proposed scram rateof 200 steps per minute. The peak fuel temperature reached a maximum of of 1125 K(1565° F) and the AT across the reactor reached a maximum of 242 K (435° F). Theresults in figure 6(b) show the effect of a scram rate of 400 steps per minute. This isdouble the proposed scram rate. The peak fuel temperature reached a maximum of1100 K (1520° F) and the AT across the reactor reached 214 K (385° F). The resultsin figure 6(c) show the effect of an instantaneous scram. After the scram, the reactorpower follows the decay heat curve shown in figure 15 and discussed in appendix A. Thepeak fuel temperature reached a maximum of 1047 K (1425° F) and the AT across thereactor reached 167 K (300° F). The transients are made significantly less severe byincreasing the scram rate. But, even when an instantaneous scram is assumed, bothdesign limits are exceeded and the maximum AT across the reactor is three timesthe design limit.
Effect of maintaining partial coolant flow. - A redundant short-term reactor coolantsystem could avoid complete loss of coolant flow. A pressurized reservoir could main-tain some flow even if the loss of flow was due to a leak in the reactor coolant system.The run plotted in figure 7 started at design conditions with the outlet temperature atthe center of the deadband range. The coolant flow dropped below 50 percent initiatinga scram (200 steps/min) and the gas flow was stepped to 0.1 percent of design. After1 second the coolant flow reached 10 percent and stopped decreasing. The peak fuel
10

1600
1400
1 1200
1000
1100
* 1050
3 1000CD
O)
jf 950
"~ 900
850
400 f—
200
Peak fuel temperature
-Reactor outlet temperature
- Reactor inlet temperatureJ I I I
- Reactor power
100 200 300 500 600 700 900Time, sec
Figure 7. - Loss of primary coolant flow to 10 percent of design value. (Flow ramped from design to 10 percent ofdesign during first second. I
temperature during the simulated transient was 1047 K (1425 F) and the maximum ATacross the reactor was 131 K (235° F). The temperature transients plotted in figure 7suggest that maintaining flow at 10 percent would be a help in reducing maximum fuel tem-perature and reactor AT. However, both temperature limits are exceeded and reactorAT is still more than twice the design limit. Further improvement could be obtained bysupporting the coolant flow at some higher percent of the design value. Also some combi-nation of increased scram rate and higher support level of flow might be desirable.
Effect of gas flow shutoff time. - The computer runs previously discussed assumedthat the gas flow stepped to 0.1 percent of design when the scram began. The run plottedon figure 8 assumed that the gas flow continues at 100 percent until the turbine inlet tem-perature drops below 644 K (700° F). Below this temperature, the gas flow is not self-sustaining and the gas loop flow is assumed to step to zero. Maintaining gas loop flowdid not reduce the maximum peak fuel temperature as compared with figure 6(a) and madethe reactor AT much worse. The peak temperature was not reduced for the followingreason. At 1 percent coolant flow, the fluid transport time from the heat exchanger outletto the reactor core inlet is approximately 650 seconds. Most of this transport time isspent in the inlet manifold and inlet plenum. The maximum peak fuel temperature occurs380 seconds after the start of the transient. This maximum temperature occurred beforethe effect of having maintained gas flow reached the core. With 10 percent primary flowas in figure 7, the transport time is reduced to 65 seconds. But, the maximum peak fueltemperature occurs 50 seconds after the start of the transient; thus, even with the 10percent flow, maintaining gas flow would not reduce this temperature.
11

1600
1400
1200
1000
800
600
\ ^Turbine inlet temperatureV
400 r—
Sf 200Reactor power
200 300 400 500Time, sec
600 700 800 900
Figure 8. - Loss of primary loop coolant flow with gas flow maintained at design until turbine inlet temperaturedrops to 644 K (700° F), then stepped to zero.
Loss of Gas Flow
Gas flow is ramped from design to 1 percent of design in 1 second. The gas turbinenormally provides the power for the primary loop NaK pump. To prevent gas flow lossfrom also stopping reactor NaK coolant flow, the pump is automatically switched tobattery power when turbine speed decreases. The results plotted in figure 9 show thatreactor power decays fairly rapidly even with no scram. The peak fuel temperaturereaches a maximum of 994 K (1330° F). This is well below the design limit of 1033 K(1400° F). The reactor AT decreases from its initial value of 44 to 0 K (80° to 0° F)at 250 seconds. It is, therefore, not necessary to scram the reactor if gas flow is lost.
Turbine Overspeed
Turbine overspeed could result from loss of alternator electrical load. The effectof turbine overspeed is to increase gas flow. As the flow increases the heat energyabsorbed by the gas from the heat source heat exchanger increases. This heat energy
12

1400
TS 1200
1000
1000^£- 950
"I 900OJ
I 850i—
800
x^-Peak fuel temperature
-Reactor inlet temperature-Reactor outlet temperature
Sf 200-
400 500Time, sec
600 700 800 900
Figure 9. - Loss of gas flow. (Gas flow ramped from design to 1 percent of design during first second. Reactorwas not scrammed.)
81—
I
stoo
6
S
— I1
s"o1/1(DO
1400
U_O
oT
E 1200oa
1"H^
1000
r—
^
1"
aE
_"
3
3£
i.y
3.0
2.5
f~
_
1 1 1 1 1 1 1 1
(a) Gas flow rate into heat exchanger.1050
innn1UUU
950
900
ocnO-AJ
flftfloUU
600
400
200
,^-Peak fuel temperature^/^
.^Reactor outlet temperature— • '— ^Reactor inlet temperature
1 1 1 1 1 1 1 1
,/- Reactor power
/y~ X>i-Brayton power demand
f
~
1 1 1 1 1 1 1 10 100 200. 300 400 500 . 600 700 80C
Time, sec
(b) Reactor transients when initial reactor outlet temperature is 914 K (1185°F).
Figure 10. - Effect of turbine overspeed on reactor.
13
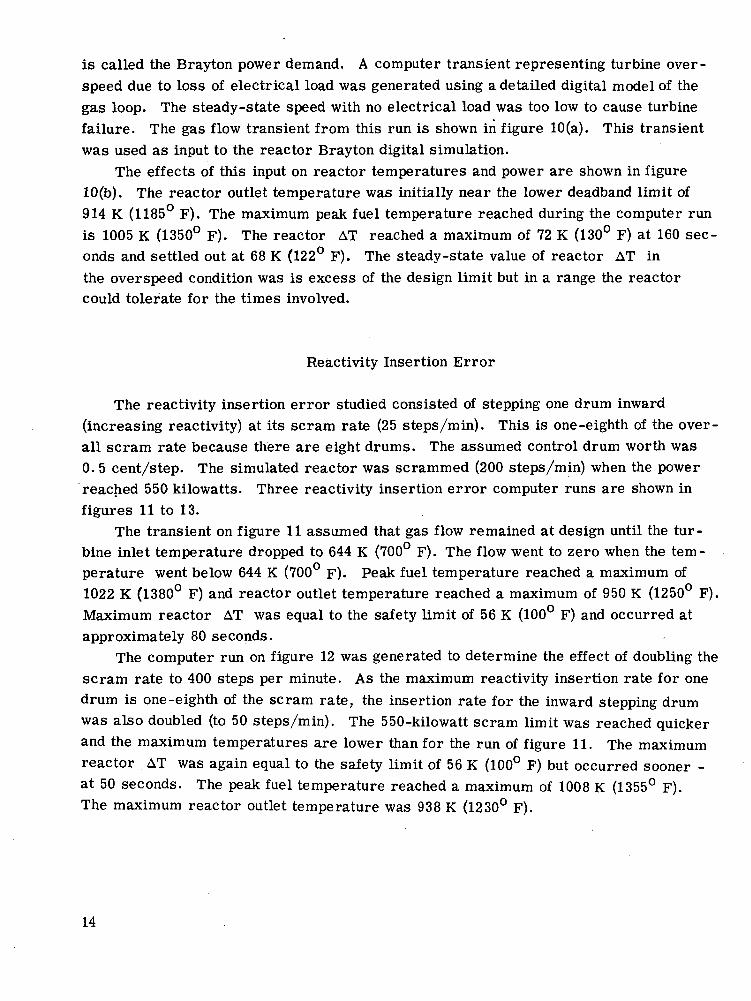
is called the Brayton power demand. A computer transient representing turbine over-speed due to loss of electrical load was generated using a detailed digital model of thegas loop. The steady-state speed with no electrical load was too low to cause turbinefailure. The gas flow transient from this run is shown in figure 10(a). This transientwas used as input to the reactor Brayton digital simulation.
The effects of this input on reactor temperatures and power are shown in figure10(b). The reactor outlet temperature was initially near the lower deadband limit of914 K (1185° F). The maximum peak fuel temperature reached during the computer runis 1005 K (1350° F). The reactor AT reached a maximum of 72 K (130° F) at 160 sec-onds and settled out at 68 K (122° F). The steady-state value of reactor AT inthe overspeed condition was is excess of the design limit but in a range the reactorcould tolerate for the times involved.
Reactivity Insertion Error
The reactivity insertion error studied consisted of stepping one drum inward(increasing reactivity) at its scram rate (25 steps/min). This is one-eighth of the over-all scram rate because there are eight drums. The assumed control drum worth was0. 5 cent/step. The simulated reactor was scrammed (200 steps/min) when the powerreached 550 kilowatts. Three reactivity insertion error computer runs are shown infigures 11 to 13.
The transient on figure 11 assumed that gas flow remained at design until the tur-bine inlet temperature dropped to 644 K (700° F). The flow went to zero when the tem-perature went below 644 K (700° F). Peak fuel temperature reached a maximum of1022 K (1380° F) and reactor outlet temperature reached a maximum of 950 K (1250° F).Maximum reactor AT was equal to the safety limit of 56 K (100° F) and occurred atapproximately 80 seconds.
The computer run on figure 12 was generated to determine the effect of doubling thescram rate to 400 steps per minute. As the maximum reactivity insertion rate for onedrum is one-eighth of the scram rate, the insertion rate for the inward stepping drumwas also doubled (to 50 steps/min). The 550-kilowatt scram limit was reached quickerand the maximum temperatures are lower than for the run of figure 11. The maximumreactor AT was again equal to the safety limit of 56 K (100° F) but occurred sooner -at 50 seconds. The peak fuel temperature reached a maximum of 1008 K (1355° F).The maximum reactor outlet temperature was 938 K (1230° F).
14

1400
1200
£-
£
•I 10008.£i—
800
600
1050
1000
950
^ 900
J 850"ro
| 800o>
"~ 750
700
650
600
-Peak fuel temperature
/- Reactor outlet temperature
600i—
- Reactor power
^Brayton power demand
Gas flow stepsto zero here
300 400Time, sec
Figure 11. - Reactivity insertion malfunction. Reactor scrammed 200 steps per minutewhen power reaches 550 kilowatts: (Gas flow steps to zero when turbine inlet temper-ature falls to 644 K (700° F).)
1400r—
1200-^
1050r—
13 1000
800
6001—
; fuel temperature
^ Reactor outlet temperature
Reactor power
/- Brayton power demand
200 — - Gas flow steps to zero
100 200 300 400Time, sec
500 600 700
Figure 12. - Scram rate of 400 steps per minute. (Gas flow steps to zero when turbineinlet temperature falls to 644 K (700° F).)
15

The computer run on figure 13 assumed that the malfunctioning control drum con-tinued to step inward after the scram began. During the scram, reactivity was removedat six-eighths of the normal scram rate, because seven drums were stepping outwardand one was stepping inward. The maximum peak fuel temperature was 1027 K (1390° F).This is only 5 K (10 F) higher than the run in figure 11. Reactor AT was again about56 K (100° F) at 80 seconds. Comparison of these two runs shows that it makes verylittle difference whether or not the drum continues to malfunction after the scram begins.
These reactivity insertion runs show that the reactor can be protected againstreactivity insertion from one malfunctioning control drum. Marginally adequate pro-tection consists of a scram limit of 550-kilowatt power and a scram rate of 200 or 400steps per minute. Other scram rates and lower reactor power scram limits might pro-
These reactivity insertion runs show that the reactor can be protected againstreactivity inseriton from onw malfunctioning control drum. Marginally adequate pro-tection consists of a scram limit of 550-kilowatt power and a scram rate of 200 or 400steps per minute. Other scram rates and lower reactor power scram limits might pro-vide more protection.
1400
1200
2 1000S.
800
600
• Peak fuel temperature
-Reactor outlet temperature
600
400
200
-Reactor power
Brayton power demand
100 200 300 400Time, sec
500 600 700
Figure 13. - Reactivity insertion malfunction. Drum continues to malfunction duringscram. (Gas flow steps to zero when turbine inlet temperature falls to 644 K (700° F).)
16

CONCLUSIONS
Of the malfunctions studied, loss of reactor coolant flow imposed the most severetransient conditions upon the reactor; for such a malfunction some damage such asfuel element cracking might occur. The other malfunctions considered should notdamage the reactor.
With loss of coolant flow to 1 percent of design and use of the proposed scram rate,the reactor would exceed the peak fuel temperature and reactor AT design limits by awide margin. Two methods found to moderate the transients at the reactor for thismalfunction were: (1) increasing the scram rate and (2) supporting the coolant flow atsome percent of design flow. Supporting the flow at 10 percent of design was about aseffective as an instantaneous scram of the reactor in reducing peak fuel temperature.However, both peak fuel temperature and reactor AT design limits were exceeded withflow maintained at 10 percent of design and reactor AT was still more than twice thedesign limit. Sudden loss of gas flow appeared tolerable for the reactor even with noscram. The core temperature transients resulting from the turbine overspeed mal-function were not a problem but reactor AT did settle out 20 percent higher than thedesign limit in the overspeed condition; this should not be a problem unless the over-speed condition continues for an extended period of time. The core temperature tran-sients resulting from the reactivity insertion malfunction were controlled satisfactorilyby use of the proposed scram procedure. However, the maximum reactor AT wasabout equal to the design limit for the three reactivity insertion runs made.
Lewis Research Center,National Aeronautics and Space Administration,
Cleveland, Ohio, October 25, 1973,502-25.
17

APPENDIX A
REACTOR SIMULATION
The mathematical model of the reactor can be divided into two sets of equations:(1) The reactor kinetics equations which describe the total rate of heat generation
in the fuel (power).(2) The solid and liquid heat balances.
An additional decay heat equation is used to describe the decay of power after shutdownof the reactor. A block diagram for the simulation is shown in figure 4. Each ofthe two sets of equations and the decay heat equation are discussed in turn.
Reactor Kinetics Equation
The basic kinetics equations used in the simulation are the following:
dt(Al)
dNdt
'(?-')6k _ 0 AT.
dp
I*
a 6ka —
^~ATf +
dp. j
Fuel
Z^/ i i
3*L
3Tug
35k
AT + _£_ A0cddp
L _ J V /
Upper grid Control drumplate
(A2)
(A3)
Lower gridplate
The majority of the neutrons are produced instantaneously and are referred to asprompt neutrons. However, a small proportion of the fissions produce isotopes which de-cay and release neutrons after a delay period which ranges in length from 0. 3 to about100 seconds. These neutrons are called delayed neutrons. There are six major groupsof delayed neutron precursors. The concentration of the six groups is defined by equa-tion (Al).
Equation (A2), which determines the rate of increase of neutron flux, illustratesthe importance of the delayed neutrons. During normal reactor operation 6k//3 is less
18
than one, and sustained reactor operation depends on the release of the delayed neutrons.Because the precursors of the delayed neutrons have long half lives, changes of reactorpower occur gradually.
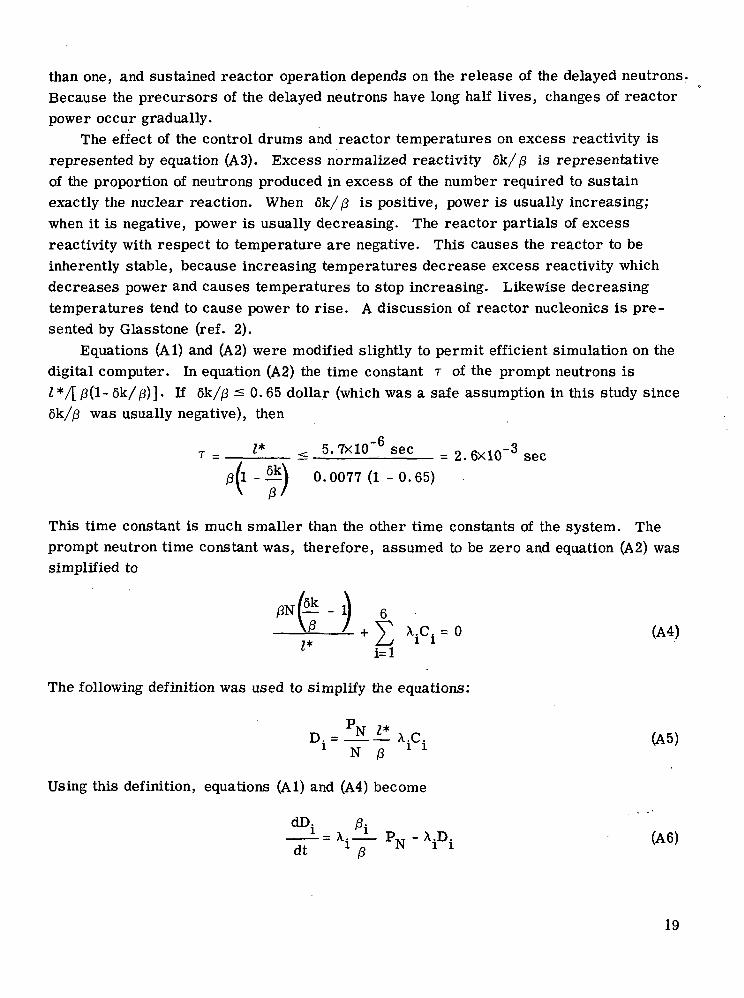
The effect of the control drums and reactor temperatures on excess reactivity isrepresented by equation (A3). Excess normalized reactivity 6k//3 is representativeof the proportion of neutrons produced in excess of the number required to sustainexactly the nuclear reaction. When 6k//3 is positive, power is usually increasing;when it is negative, power is usually decreasing. The reactor partials of excessreactivity with respect to temperature are negative. This causes the reactor to beinherently stable, because increasing temperatures decrease excess reactivity whichdecreases power and causes temperatures to stop increasing. Likewise decreasingtemperatures tend to cause power to rise. A discussion of reactor nucleonics is pre-sented by Glasstone (ref. 2).
Equations (Al) and (A2) were modified slightly to permit efficient simulation on thedigital computer. In equation (A2) the time constant T of the prompt neutrons isI */[ j8(l- 6k/0)]. If 6k//3 s 0. 65 dollar (which was a safe assumption in this study since6k//3 was usually negative), then
r = I* < 5.7xlQ-6sec . 2>6xlo-3
-^) 0.0077 (1 - 0.65)
This time constant is much smaller than the other time constants of the system. Theprompt neutron time constant was, therefore, assumed to be zero and equation (A2) wassimplified to
ti+0N\ r, I .—^
^ XiCi = ° <A4>4 1
The following definition was used to simplify the equations:
D^-N-^A.C. (A5)1 N 0 * *
Using this definition, equations (Al) and (A4) become
dD. /3.L=x.-i- Pvr-X.D. (A6)
19

6VD« (A 7)
Equations (A6) and (A7) are easier to inplement than equations (Al) and (A2) because the
prompt time delay I* and the ratio of power to neutron flux PN/N have been eliminated.
Heat Balances
Core. - The core is divided axially into 20 sections as shown in figure 14.
i + ;
^ Inlet ://I manifold
/ / I plenum/' I I grid plate
/ / i
„-Outlet:/? i grid plate
''' • plenum/-Fuel / / I manifold' ' i
Core
(a) Reactor simulation schematic.
<D, =0.1982 2.9434
0 x— L(b) Power as function of position along flow axis.
Figure 14. - Reactor heat balance schematic.
Average fuel temperatures are computed for each of 20 "lumps." NaK coolant tem-peratures are computed at each of 21 nodes. The following equations were usedto update the coolant and fuel temperatures:
ATC(K) = [Tf(K) - TC(K)] l - e (A8)
20

dTf(K)•I
dt
TC(K + 1) = TC(K) + ATC(K) (A9
(P - PR) - ATC(K) _L_2_ (A10)
Equation (A8) computes the change of temperature of a point in the fluid as it flowspast a core lump. Equation (A9) updates the nodal fluid temperatures each time the fluidmoves from one node to the next. Equation (A10) computes the rate of change of each fuellump temperature based on a heat balance of the internal power generation and the heatflow to the coolant. Equation (A 10) is integrated to update the fuel lump temperaturesevery computer time step where P is total reactor power as a function of time, Pj,represents 15 kilowatts of heat radiated to the cold wall, and Px(K) is the portion oftotal reactor power allocated to the K lump. Px(K) is evaluated by the following equa-tion (All) and illustrated in figure 13(b). This equation represents a chopped sine distri-bution of power.
cos °-1982 + 2.7452 (K - 1) _ CQS 0.1982 + 2.7452 K
Px(K) = _ NL _ NL _cos(0. 1982) - cos(2. 9434)
Grid plates. - The grid plates support the fuel rods. They are shown in figure. 13(a)at the ends of the fuel core. The equations for the grid plate coolant and for the gridplate are the following:
T , = T + (T . - Tgp,out gp v gp,m ~ g p SFC
dT (T - T }_gP = w c 8P,in gp,out' (A13)
dt C ° MgPC8P
Equation (A 12) computes the change of temperature of a point in the fluid as it flowsthrough the grid plate. The grid plate is assumed to have high heat conductivity and,therefore, to have a uniform temperature. Time variations of the grid plate temperatureare computed by integrating equation (A13). This equation represents a heat balance be-tween the grid plate and the coolant.
Plenums and manifolds. - There are two plenums and two manifolds. The relativelocations of these four regions with respect to the reactor core is shown in figure 14 (a).The temperature in each region was assumed to be uniform. Incoming flow was assumedto mix perfectly with the fluid within the region. The equations for the plenums and mani-folds are the following:
21
-^ = <TDl in - Tnl> — (A14)dt pl'in pl M ,
dT w-^S-•<*»., in--WiT:- <A16>Ul lvlman
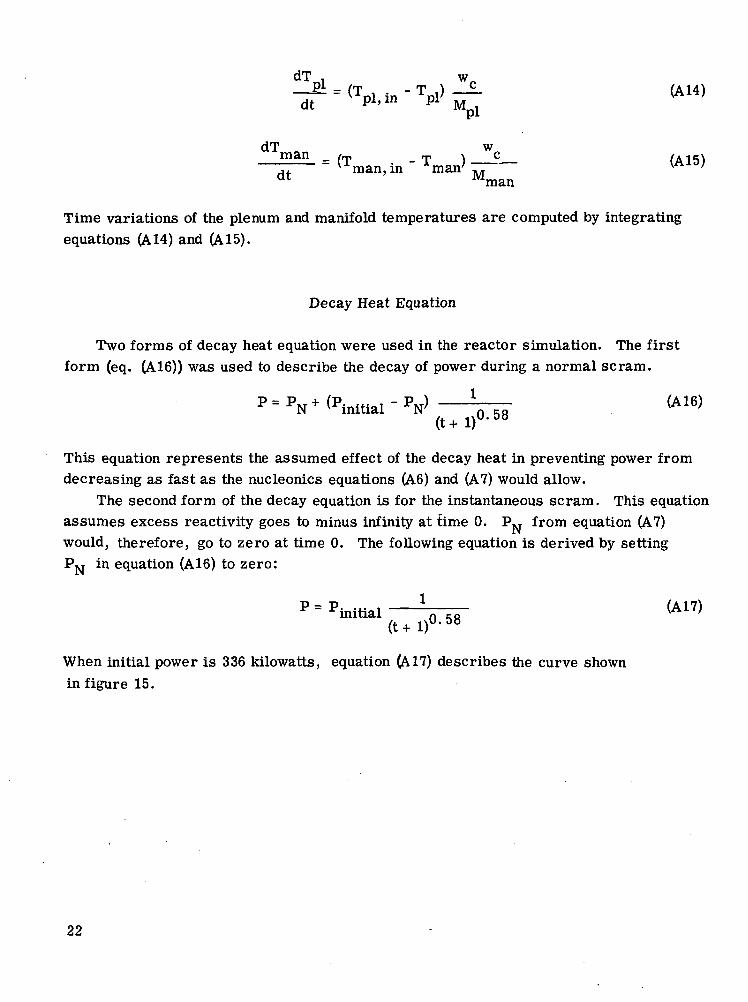
Time variations of the plenum and manifold temperatures are computed by integratingequations (A 14) and (A 15).
Decay Heat Equation
Two forms of decay heat equation were used in the reactor simulation. The firstform (eq. (A16)) was used to describe the decay of power during a normal scram.
P = PN + Initial - PN> - Tii" (A16)
(t+ I)0'58
This equation represents the assumed effect of the decay heat in preventing power fromdecreasing as fast as the nucleonics equations (A6) and (A 7) would allow.
The second form of the decay equation is for the instantaneous scram. This equationassumes excess reactivity goes to minus infinity at time 0. PN from equation (A 7)would, therefore, go to zero at time 0. The following equation is derived by settingPXT in equation (A16) to zero:
P = Pinitial(t + 1)'
When initial power is 336 kilowatts, equation (A17) describes the curve shownin figure 15.
22

1000
- Start of decay
100
.2
10•P= (336 kWXt + I)"0-58
I10 100 1000 10000
Time, t + 1, sec
Figure 15. - Assumed power decay curve for reactor after shutdown.
23

APPENDIX B
SIMULATION CONSTANTS
Reactor Constants
Temperature coefficients of reactivity, dollars/K; dollars/°F
Outlet grid plate -0.00054; -0.0003Average fuel -0.0018; -0.001Inlet grid plate . -0.00126; -0.0007
Heat capacities, MC, J/K; Btu/°F ^
Fuel and cladding 9. 54x10 ; 49.8Inlet grid plate 1.04xl04; 5.5Outlet grid plate 8. 94X104; 4.7
Heat conductances, hA, J/(sec)(K); Btu/(sec)(°F)
Fuel to NaK coolant . 6. 3xl03; 3.32Flat surface of inlet grid plate 5.88x10 ; 0.31Cylindrical surface of inlet grid plate holes . . . 2.20x10 ; 1.16Flat surface of outlet grid plate 3. 79x10 ; 0.20
oCylindrical surface of outlet grid plate holes 1.92x10 ; 1.01
f*
Mean effective neutron life, I*, sec 5.7x10
Fractions of delayed neutrons
)3 0.00766/3j//3 0.03297j82//3 0.2194/33//3 0. 1960i84//3 0.3947j85/j8 0.1150BjB . 0.04193
Decay constants, sec"
0.01240.03850. 1111
0.301
24
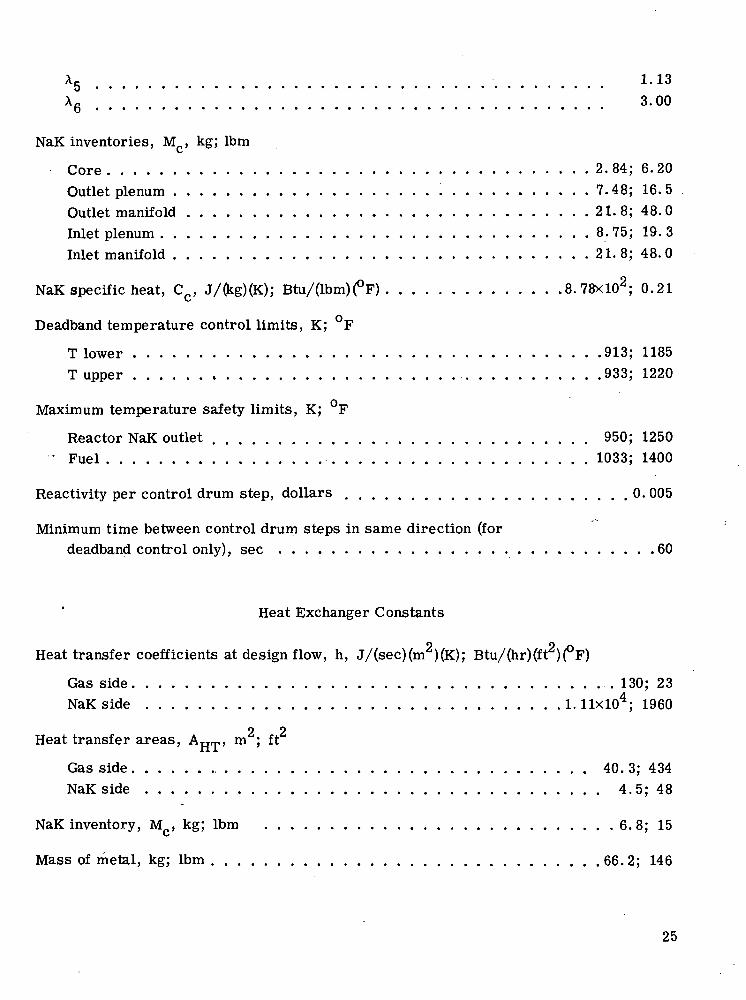
XR 3.00b
NaK inventories, M , kg; Ibmt^
Core 2. 84; 6. 20Outlet plenum 7.48; 16. 5Outlet manifold 21.8; 48. 0Inlet plenum 8.75; 19.3Inlet manifold 21. 8; 48.0
NaK specific heat, C , J/(kg)(K); Btu/(lbm)(°F) 8.78xl02; 0.21ty
Deadband temperature control limits, K; °F
T lower 913; 1185T upper 933; 1220
Maximum temperature safety limits, K; F
Reactor NaK outlet 950; 1250• Fuel 1033; 1400
Reactivity per control drum step, dollars 0.005
Minimum time between control drum steps in same direction (fordeadband control only), sec 60
Heat Exchanger Constants
Heat transfer coefficients at design flow, h, J/(sec)(m2)(K); Btu/(hr)(ft2)(°F)
Gas side . 130; 23NaK side 1. llxlO4; 1960
2 2Heat transfer areas, AHT, m ; ft
Gas side 40. 3; 434NaK side 4.5; 48
NaK inventory, M , kg; Ibm 6. 8; 15\s
Mass of metal, kg; Ibm 66.2; 146
25

Specific heats, C, J/(kg)(K); Btu/(lbm)(°F)
Metal 3.85X10²; 0.092Gas - 5.19X10²; 0.124Coolant (NaK) 8. 78xl02; 0.21
Other Constants
Reactor loop pipe (NaK) inventories, kg; Ibm
Reactor outlet manifold to standby heat exchanger 4.5; 10Between heat exchangers 3.2; 7Heat exchanger to reactor inlet manifold 22.7; 50
Gas pipe constants
Heat exchanger to turbine:Mass of metal, kg; (Ibm) 46. 3; 102Gas to metal heat conductance, J/(sec)(K); Btu/(sec)(°F). . . . 6. 83xl02; 0.36Metal specific heat, J/(kg)(K); Btu/(ft2)(sec)(°F) 4.20X10²; 0.10Heat transfer coefficient, J/(m2)(sec)(K); Btu/(ft2)(sec)(°F) . 3.06X10²; 0.015
Recuperator to heat exchanger:Mass of metal, kg; Ibm 64.4; 142Gas to metal heat conductance, J/(sec)(K); Btu/(sec)(°F). . . 9.55x10 ; 0.504
Recuperator temperature time constant, sec 10
26

APPENDIX C
SYMBOLS
2 2A heat transfer area, m ; ft2 2A cross-sectional flow area, m ; ft
C S
C specific heat, J/(kg)(K); Btu/(lbm)(°F)
C,th
concentration of delay neutron precursors of i group, precursors/m
D. contribution to power from i group of delayed neutron precursors, kW
h heat transfer coefficient, J/(sec)(m2)(K); Btu/(sec)(ft2)(°F)
Z* mean effective neutron lifetime, sec
M mass, kg; Ibm3
N neutron density, neutrons/m
NL number of lumps
P total reactor power, kW
P. ... , reactor power just prior to initiation of shutdown, kW
P^, power calculated from kinetics equations equal to total reactor power exceptduring scram, kW
PR power radiated to cold wall, kW
Px(K) portion of total power allocated to K lump, dimensionless
p perimeter of cross -sectional flow area, m; ft
T temperature, K; °F
t time, sec
V volume, m3; ft3
v velocity, m/sec; ft/sec
w flow rate, kg/sec; Ibm /sec
x distance, m; ft
/3 fraction of total neutrons that are delayed
j3 fraction of total neutrons that are delayed neutrons in i delay group
27

A change from reference value (eq. (3)) or change from previous value (eqs. (8)to (10))
6k//3 excess reactivity, dollars
\. decay constant of delayed neutron precursor of i group, sec"
^cd position of control drum, rad
T time constant associated with prompt neutrons, sec
T fluid dwell time in one lump of core, secc/
Subscripts:
c
cf
dpf
gpi
in
k
Zg
man
out
pi
ug
coolant
core to fluid
design point
fuel
grid plate
i delay group
inlet fluid
k111 node
lower grid plate (inlet)
manifold
outlet fluid
plenum
upper grid plate (outlet)
28

REFERENCES
1. Jefferies, KentS.: Experimental Investigation of Reactor-Loop Transients DuringSNAP-8 Power Conversion System Startup. NASA TM X-52735, 1969.
2. Glasstone, Samuel: Priniciples of Nuclear Reactor Engineering. D. Van NostrandCo., Inc., 1955.
3. Jefferies, Kent S.; Packe, Donald R.; and DittricK} Ralph T.: Design and Perfor-mance of a Nuclear Reactor Simulator for Nonnuclear Testing of Space PowerSystems. NASA TN D-4095, 1967.
NASA-Langley, 1974 E-7651 29

NATIONAL AERONAUTICS AND SPACE ADMINISTRATION
WASHINGTON. D.C. 2O546
OFFICIAL BUSINESS
PENALTY FOR PRIVATE USE $3OO SPECIAL FOURTH-CLASS RATEBOOK
POSTAGE AND FEES PAIDNATIONAL AERONAUTICS AND
SPACE ADMINISTRATION451
POSTMASTER : If Undeliverable (Section 158Postal Manual) Do Not Return
"The aeronautical and space activities of the United States shall beconducted so as to contribute . . . to the expansion of human knowl-edge of phenomena in the atmosphere and space. The Administrationshall provide for the widest practicable and appropriate disseminationof information concerning its activities and the results thereof"
—NATIONAL AERONAUTICS AND SPACE ACT OF 1958
NASA SCIENTIFIC AND TECHNICAL PUBLICATIONSTECHNICAL REPORTS: Scientific andtechnical information considered important,complete, and a lasting contribution to existingknowledge.
TECHNICAL NOTES: Information less broadin scope but nevertheless of importance as acontribution to existing knowledge.
TECHNICAL MEMORANDUMS:Information receiving limited distributionbecause of preliminary data, security classifica-tion, or other reasons. Also includes conferenceproceedings with either limited or unlimiteddistribution.
CONTRACTOR REPORTS: Scientific andtechnical information generated under a NASAcontract or grant and considered an importantcontribution to existing knowledge.
TECHNICAL TRANSLATIONS: Informationpublished in a foreign language consideredto merit NASA distribution in English.
SPECIAL PUBLICATIONS: Informationderived from or of value to NASA activities.Publications include final reports of majorprojects, monographs, data compilations,handbooks, sourcebooks, and specialbibliographies.
TECHNOLOGY UTILIZATIONPUBLICATIONS: Information on technologyused by NASA that may be of particularinterest in commercial and other non-aerospaceapplications. Publications include Tech Briefs,Technology Utilization Reports andTechnology Surveys.
Details on the availability of these publications may be obtained from:
SCIENTIFIC AND TECHNICAL INFORMATION OFFICE
N A T I O N A L A E R O N A U T I C S A N D S P A C E A D M I N I S T R A T I O NWashington, D.C. 20546