Quantitative Flow Cytometry: Instrument … Flow Cytometry: Instrument Characterization,...
15
Quantitative Flow Cytometry: Instrument Characterization, Standardization and Calibration James Wood, PhD Manager, Wake Forest University School of Medicine Comprehensive Cancer Center Flow Cytometry Shared Resource
Transcript of Quantitative Flow Cytometry: Instrument … Flow Cytometry: Instrument Characterization,...
Quantitative Flow Cytometry: Instrument Characterization,
Standardization and CalibrationJames Wood, PhD
Manager, Wake Forest University School of MedicineComprehensive Cancer Center Flow Cytometry Shared Resource
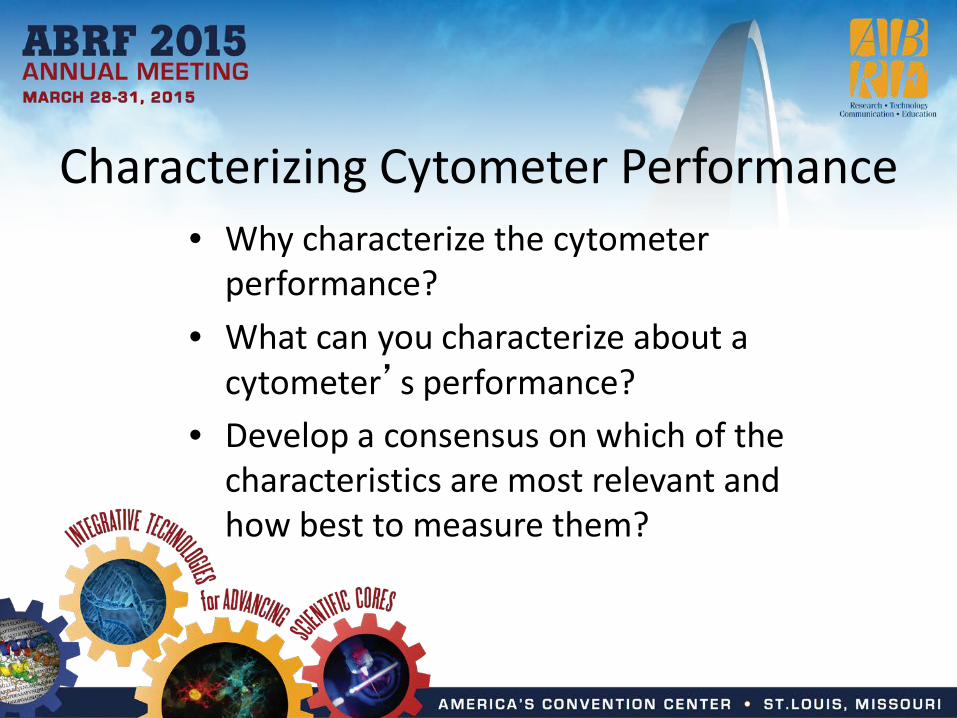
Characterizing Cytometer Performance• Why characterize the cytometer
performance?• What can you characterize about a
cytometer’s performance?• Develop a consensus on which of the
characteristics are most relevant and how best to measure them?
Why Characterize Cytometer Performance?
• Better reproducibility of data• Facilitates intra/inter-lab comparisons of
cytometry data• May be required for clinical lab certification• Quantitative analysis of data• Data presented in physical units
What Can You Characterize about a Cytometer?• Precision• Linearity• Dynamic range• Sensitivity• Optical & Electronic Noise• Calibration in Spe Units
Precision• Alignment of laser and sample stream• Fluidics or pneumatics• Sample injection needle positioning• Bubbles and debris in the flow cell• Laser beam geometry• Signal attenuation• Photonic/electronic noise
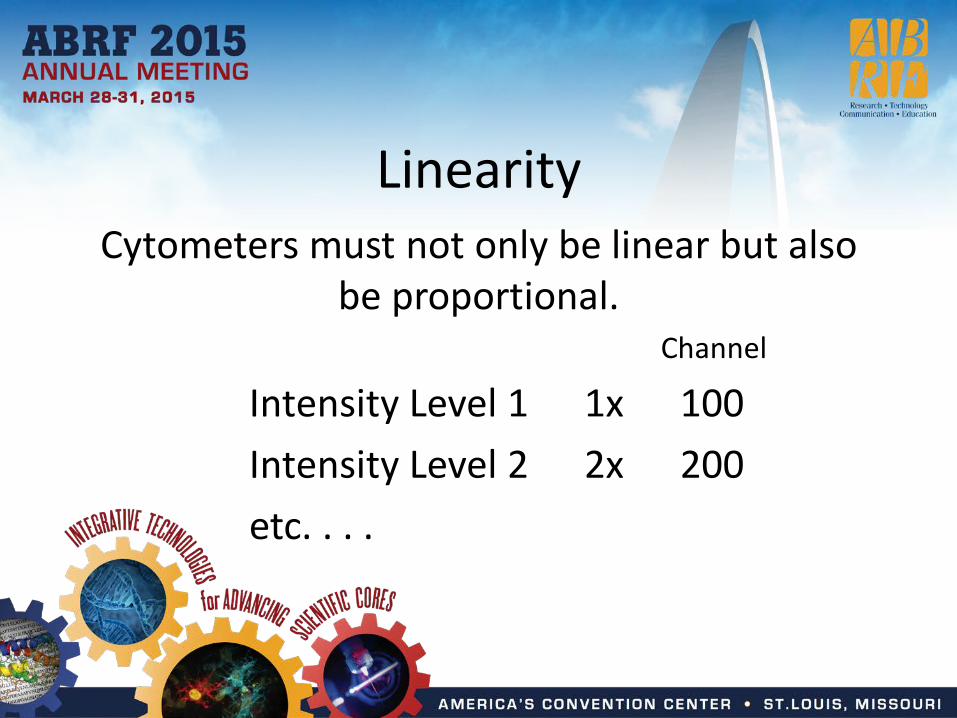
LinearityCytometers must not only be linear but also
be proportional.Channel
Intensity Level 1 1x 100Intensity Level 2 2x 200etc. . . .
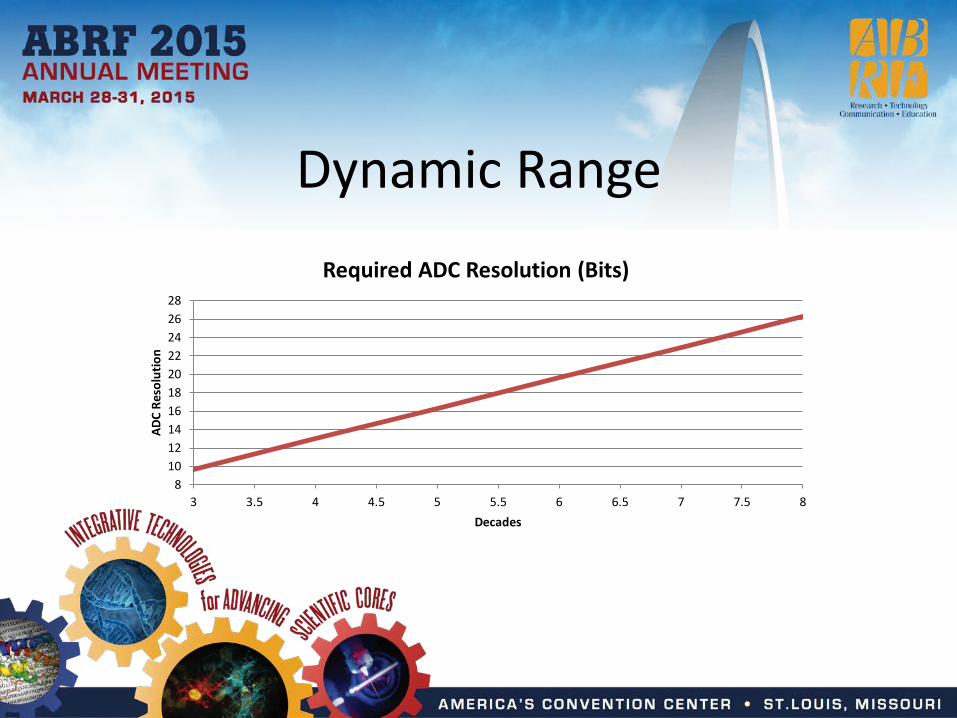
Dynamic Range
810121416182022242628
3 3.5 4 4.5 5 5.5 6 6.5 7 7.5 8
ADC
Reso
lutio
n
Decades
Required ADC Resolution (Bits)
Standardized Light Sources
• Fluorescent multilevel beads are traditional light sources
• Pulsed LED is a new light source with a low intrinsic CV
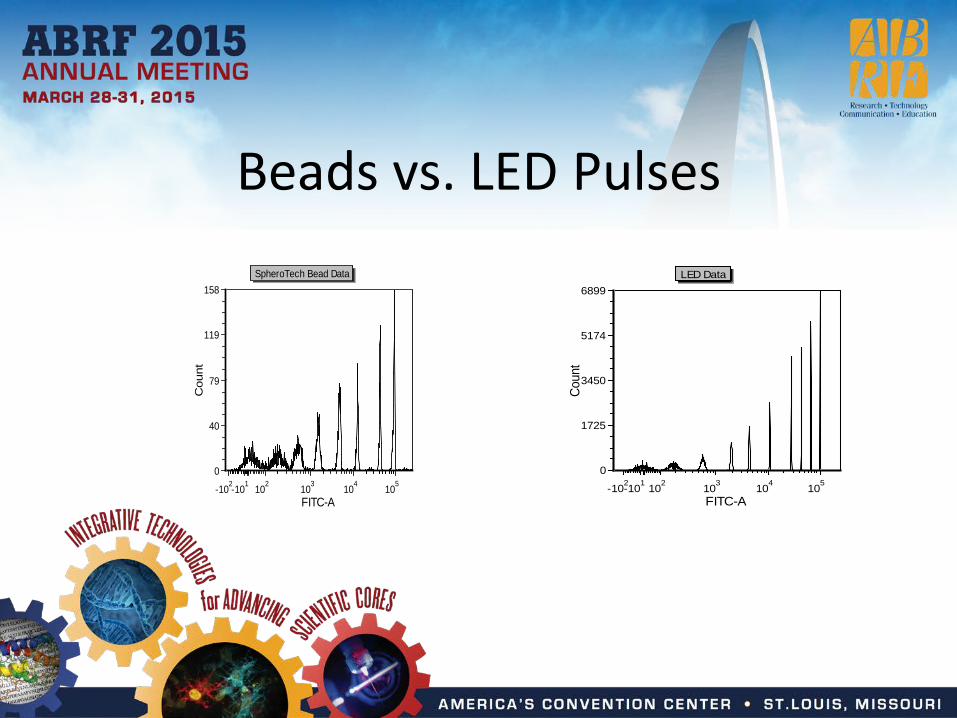
Beads vs. LED PulsesSpheroTech Bead Data
FITC-A
Cou
nt
-102-101 102 103 104 1050
40
79
119
158SpheroTech Bead Data
FITC-A
Cou
nt
-102-101 102 103 104 1050
40
79
119
158LED Data
FITC-A
Coun
t
-102-101 102 103 104 1050
1725
3450
5174
6899
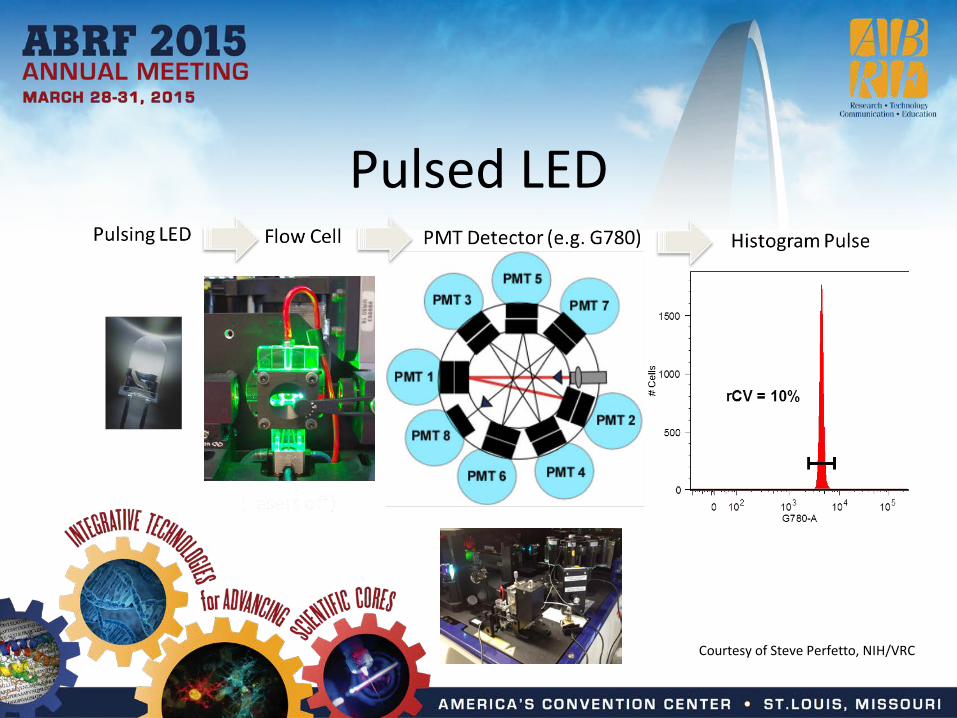
Pulsed LED
Courtesy of Steve Perfetto, NIH/VRC
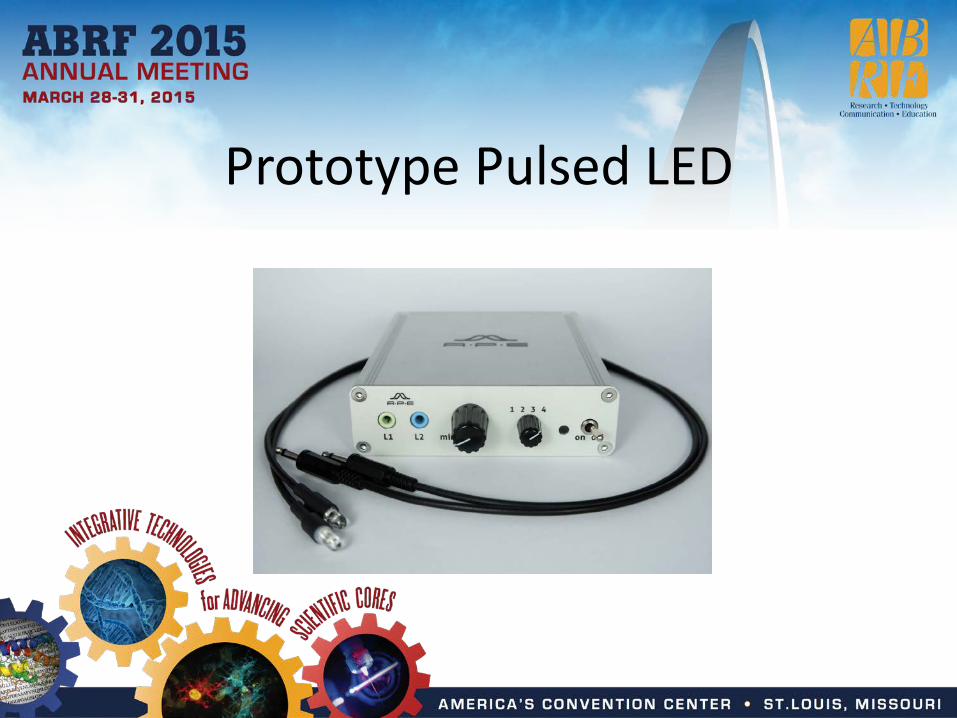
Prototype Pulsed LED
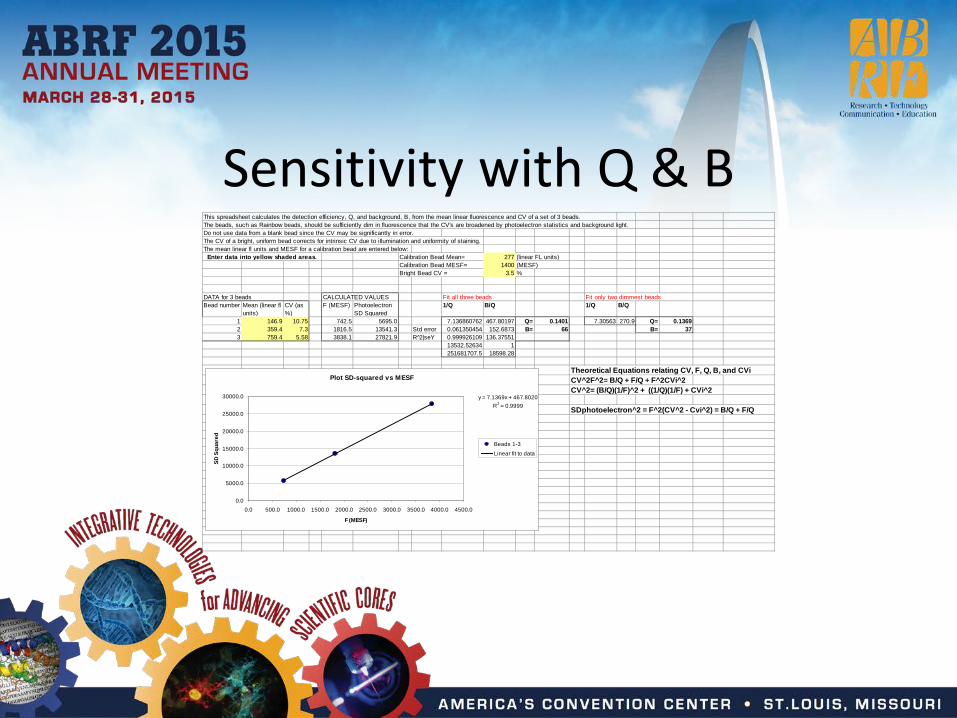
Sensitivity with Q & BThis spreadsheet calculates the detection efficiency, Q, and background, B, from the mean linear fluorescence and CV of a set of 3 beads. The beads, such as Rainbow beads, should be sufficiently dim in fluorescence that the CV's are broadened by photoelectron statistics and background light.Do not use data from a blank bead since the CV may be significantly in error.The CV of a bright, uniform bead corrects for intrinsic CV due to illumination and uniformity of staining.The mean linear fl units and MESF for a calibration bead are entered below: Enter data into yellow shaded areas. Calibration Bead Mean= 277 (linear FL units)
Calibration Bead MESF= 1400 (MESF)Bright Bead CV = 3.5 %
DATA for 3 beads CALCULATED VALUES Fit all three beads Fit only two dimmest beadsBead number Mean (linear fl
units)CV (as %)
F (MESF) Photoelectron SD Squared
1/Q B/Q 1/Q B/Q
1 146.9 10.75 742.5 5695.0 7.136860762 467.80197 Q= 0.1401 7.30563 270.9 Q= 0.13692 359.4 7.3 1816.5 13541.3 Std error 0.061350454 152.6873 B= 66 B= 373 759.4 5.58 3838.1 27821.9 R 2̂|seY 0.999926109 136.37551
13532.52634 1251681707.5 18598.28
Theoretical Equations relating CV, F, Q, B, and CVi CV^2F^2= B/Q + F/Q + F^2CVi^2CV^2= (B/Q)(1/F)^2 + ((1/Q)(1/F) + CVi^2
SDphotoelectron^2 = F^2(CV^2 - Cvi^2) = B/Q + F/Q
Plot SD-squared vs MESF
y = 7.1369x + 467.8020R2 = 0.9999
0.0
5000.0
10000.0
15000.0
20000.0
25000.0
30000.0
0.0 500.0 1000.0 1500.0 2000.0 2500.0 3000.0 3500.0 4000.0 4500.0
F (MESF)
SD S
quar
ed
Beads 1-3
Linear fit to data
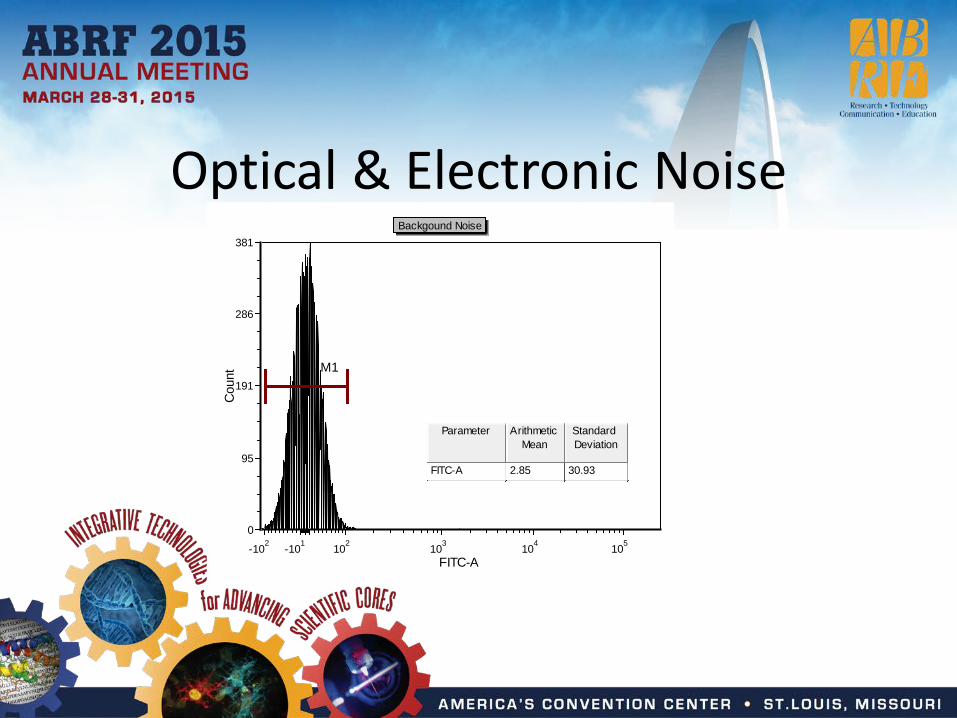
Optical & Electronic NoiseBackgound Noise
FITC-A
Cou
nt
-102 -101 102 103 104 1050
95
191
286
381
M1
Parameter Arithmetic Mean
Standard Deviation
FITC-A 2.85 30.93
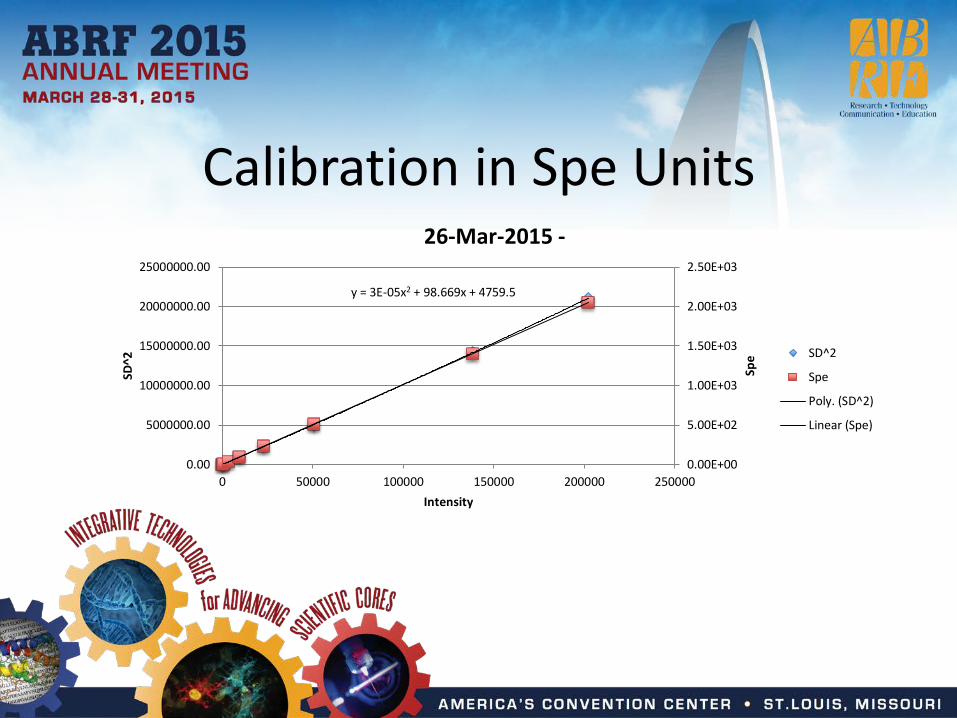
Calibration in Spe Units
y = 3E-05x2 + 98.669x + 4759.5
0.00E+00
5.00E+02
1.00E+03
1.50E+03
2.00E+03
2.50E+03
0.00
5000000.00
10000000.00
15000000.00
20000000.00
25000000.00
0 50000 100000 150000 200000 250000
Spe
SD^2
Intensity
26-Mar-2015 -
SD^2
Spe
Poly. (SD^2)
Linear (Spe)
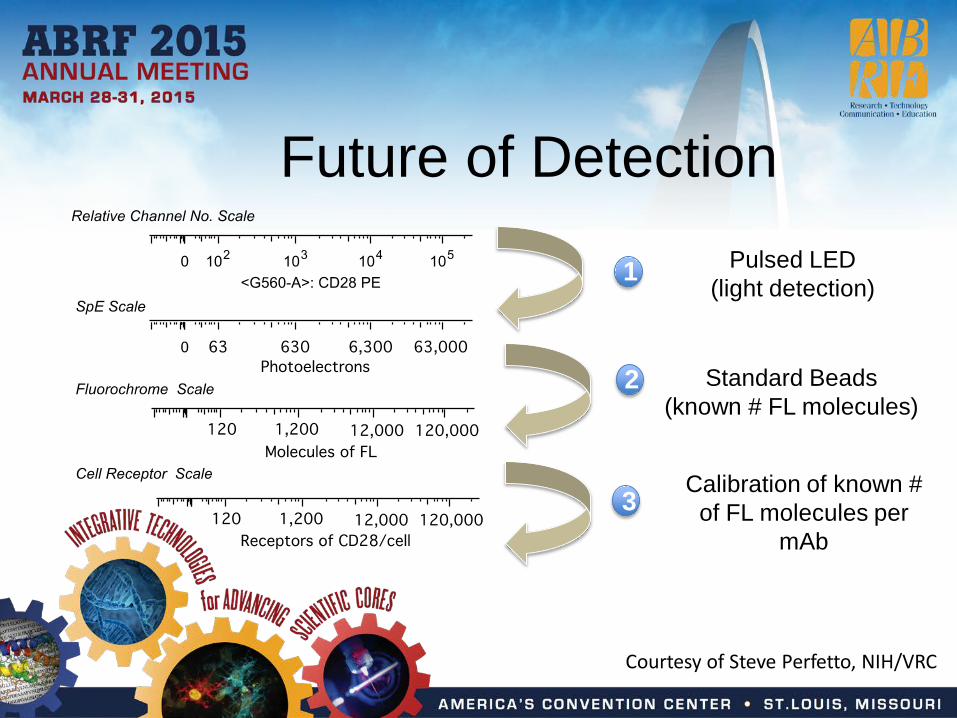
Pulsed LED(light detection)
Calibration of known # of FL molecules per
mAb
Standard Beads(known # FL molecules)
Future of Detection
1
2
3
Courtesy of Steve Perfetto, NIH/VRC