QS TopMBA.com RETURN ON INVESTMENT REPORT · Not everyone can attend the most-famous ... We give a...
26
QS TopMBA.com Unlocking the value of the world’s top business schools Full-Time MBA 2018 RETURN ON INVESTMENT REPORT
Transcript of QS TopMBA.com RETURN ON INVESTMENT REPORT · Not everyone can attend the most-famous ... We give a...
QS TopMBA.com
Unlocking the value of the world’s top business schools
Full-Time MBA 2018
RETURN ON INVESTMENT REPORT

QS TopMBA.com Return on Investment Report 2018
2
Introduction 3
Fast Facts 6
Payback Period 7 ı Shortest Payback Period: MBA, Global 7
ı Shortest Payback Period: MBA, US & Canada 8
ı Shortest Payback Period: MBA, Europe 9
ı Shortest Payback Period: MBA, Asia-Pacific 10
ı Payback Period: Business Masters 11
Salary Levels 12 ı Highest Salary: MBA, Global 12
ı Highest Salary: MBA, US & Canada 13
ı Highest Salary: MBA, Europe 14
ı Highest Salary: MBA, Asia-Pacific 15
ı Salary Levels: Business Masters 16
Salary Uplift 17 ı Biggest Salary Uplift: MBA, Global 17
ı Biggest Salary Uplift: MBA, US & Canada 18
ı Biggest Salary Uplift: MBA, Europe 19
ı Biggest Salary Uplift: MBA, Asia-Pacific 20
ı Salary Uplift: Business Masters 21
10-Year ROI 22 ı Highest 10-Year ROI: MBA, Global 22
ı Highest 10-Year ROI: MBA, US & Canada 23
ı Highest 10-Year ROI: MBA, Europe 24
ı Highest 10-Year ROI: MBA, Asia-Pacific 25
Contents

QS TopMBA.com Return on Investment Report 2018
3
What is the value of an MBA? This is a question many prospective MBA candidates around the world will be asking, before making an investment that can comfortably run into six figures when tuition and forgone salary are both taken into account. Indeed, at some top US schools, tuition alone can come to $200,000.
Is it worth the investment? Well, we can’t really quantify the non-monetary value of an MBA, but we can certainly take a stab at working out some of the financials. Using data provided by 235 full-time MBA programs around the world, the QS TopMBA.com Return on Investment Report: Full-Time MBA 2018 aims to provide some insight into MBA ROI.
We look at four different metrics when seeking to ascertain the return on investment on a full-time MBA. In each, we identify the 20 top-performing schools globally, the top-10 in the US & Canada, Europe and Asia-Pacific, as well as global and regional averages. These indicators are devised to look at the value not just of an MBA from an elite school, where perhaps the payoff is obvious, but also to determine the value of schools beyond this rarefied category – where most candidates, after all, will be studying.
Introduction

QS TopMBA.com Return on Investment Report 2018
4
Payback PeriodUsing the same assumptions as outlined in the 10-year ROI calculation detailed below, we work out how many months on average it will take candidates to recoup tuition and forgone salary. After this point, you are in the black from your MBA investment.
Salary Levels Perhaps the simplest indicator of them all: where do graduates earn the highest average MBA salary levels? This is the metric which is most geared towards elite US schools.
Salary UpliftNot everyone can attend the most-famous schools that deliver the highest salary levels. Those who are able to gain admittance into these super-selective schools are likely to already have enjoyed quite successful – and well-paid – careers. The MBA, however, can also be a crucial stepping stone to those looking to kick their career into a higher gear. This metric is a comparison between the average salary of the incoming cohort compared to the average reported MBA salary in percentage terms, to celebrate the schools that are most able to elevate their candidates to a new level of earnings.
10-Year ROIThe payoff of an advanced degree such as an MBA is a long-term process. The final metric on which we measure schools is the estimated return on investment over a 10-year period. MBA alumni are all individuals, and will follow different paths. Some will move into the highest-earning positions straightaway; others will take their time climbing the career ladder; others still will look for satisfaction in different ways. We can’t account for every possibility, or even hope to measure some things.
What we can do, however, is put together a standard calculation using the data we do have and give an indication of the return graduates of MBA programs are set to enjoy. We use 10 years as a benchmark point – a period long enough to allow a tangible effect to take place, but short enough to acknowledge the unpredictability of career progression after this point.

QS TopMBA.com Return on Investment Report 2018
5
So how we do work it out? We use a fairly simple, though carefully honed formula. First, we calculate the opportunity cost of an MBA program, looking at tuition, forgone salary (using averages) and the cost-of-living in the location of the program.
We then calculate the annual salary premium, looking at how much more you are set to earn on annual basis, factoring in bonus levels. Of course, these figures do not remain static, so we allow for an annual rate of increase in both pre and post-MBA salary (the former at 2%, and the latter at 4%, given that with an MBA you are likely to see faster and higher progression over the course of your lifetime).
We give a banded bonus to schools with high percentages of entrepreneurs (likely to see lower earnings to start with, though higher in the long-term). We also factor in the time taken to find a job, using employment rates after three months, before returns are measured.
With all of these calculations in place, we map the salary premium against non-MBA salary. At the point when the salary premium adds up to opportunity cost, the investment has paid for itself. Everything after that is return.
While we must add the caveat that this is an imprecise science – given the plethora of routes and options open to MBA graduates – we hope that these calculations will shed some light on MBA return on investment.
We have also collected data from 196 master in finance, 214 master in management and 53 master in business analytics programs, looking at global and regional averages (where data is deemed to be sufficient). This is to provide a rough comparison between program types. These degrees are undertaken at a different stage of one’s career, so naturally expectations will be different. These are simply to provide talking points, rather than intended to be a measure of the superiority of any degree type in particular. Any final decision on a program undertaken will ultimately come down to fit between the idiosyncrasies of candidate and program alike.
All figures are in USD.
QS TopMBA.com Return on Investment Report 2018
6
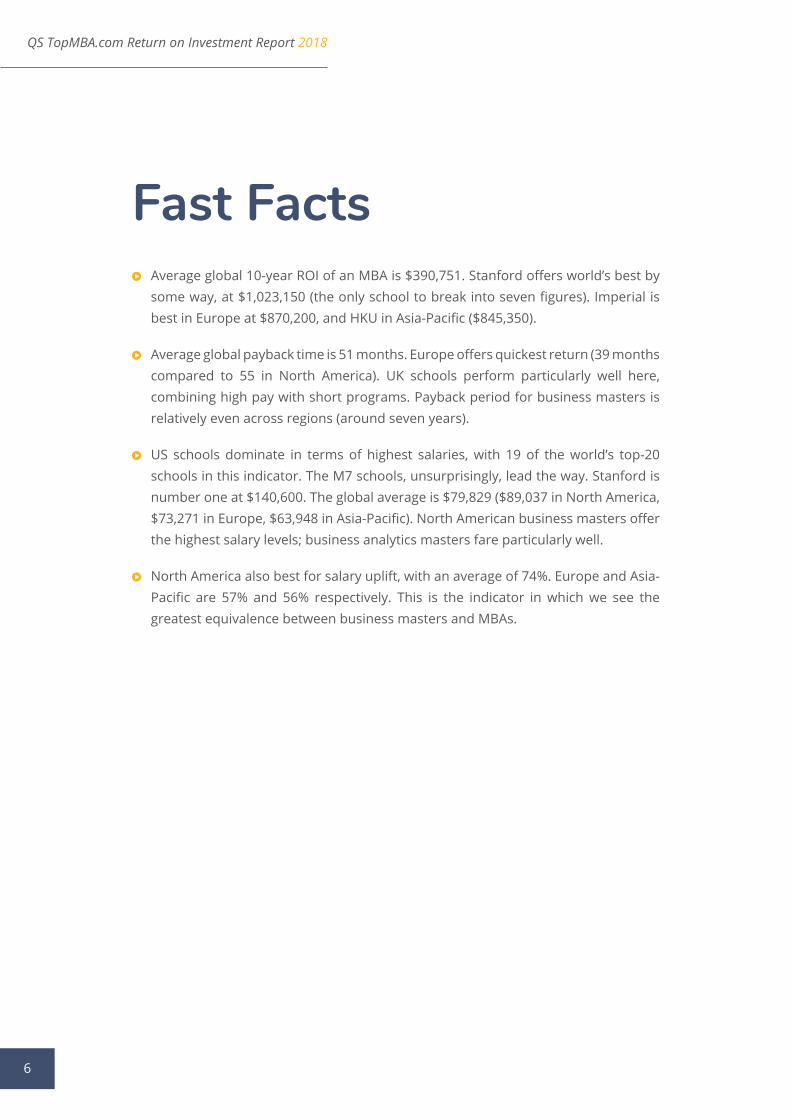
Fast Facts ı Average global 10-year ROI of an MBA is $390,751. Stanford offers world’s best by
some way, at $1,023,150 (the only school to break into seven figures). Imperial is best in Europe at $870,200, and HKU in Asia-Pacific ($845,350).
ı Average global payback time is 51 months. Europe offers quickest return (39 months compared to 55 in North America). UK schools perform particularly well here, combining high pay with short programs. Payback period for business masters is relatively even across regions (around seven years).
ı US schools dominate in terms of highest salaries, with 19 of the world’s top-20 schools in this indicator. The M7 schools, unsurprisingly, lead the way. Stanford is number one at $140,600. The global average is $79,829 ($89,037 in North America, $73,271 in Europe, $63,948 in Asia-Pacific). North American business masters offer the highest salary levels; business analytics masters fare particularly well.
ı North America also best for salary uplift, with an average of 74%. Europe and Asia-Pacific are 57% and 56% respectively. This is the indicator in which we see the greatest equivalence between business masters and MBAs.

7
QS TopMBA.com Return on Investment Report 2018
Average: 51 months
Payback Period
Shortest Payback Period: MBA, Global
Institution Country Months
University of Strathclyde United Kingdom 18
University of Mannheim Germany 21
Durham University United Kingdom 22
Stellenbosch University South Africa 22
University of Birmingham United Kingdom 23
SDA Bocconi Italy 24
Lancaster University United Kingdom 24
Imperial College London United Kingdom 24
University of Liverpool United Kingdom 24
University of Bath United Kingdom 25
EDHEC France 26
Vlerick Business School Belgium 26
Porto Business School Portugal 26
IE University Spain 27
University of Hong Kong Hong Kong 27
University of Warwick United Kingdom 27
Cranfield University United Kingdom 27
University of Leeds United Kingdom 27
European Business School Germany 28
ESMT Germany 28

QS TopMBA.com Return on Investment Report 2018
8
Shortest Payback Period: MBA, US & Canada
The one-year MBA format that predominates in Europe means that the opportunity cost for an MBA here tends to be lower. This, in combination with the high MBA salaries in offer in its stronger economies means it is possible for candidates to recoup their losses in a far shorter period than they can elsewhere in the world. The United Kingdom, in which MBA graduates command some of the highest MBA salaries in the world according to the QS TopMBA.com Jobs & Salary Trends Report, is particularly well represented in this ranking. Short payback periods for graduates of Stellenbosch and HKU prevent a European whitewash.
Globally speaking, MBA graduates are able to recoup their losses in just over four years on average. This is considerably quicker than for business masters programs, for which we see payback periods closer to seven years. There is global variance here, however; with far quicker payback periods in developing economies where we see lower average rates of tuition.
Institution Country Months
University of Tulsa (Collins) United States 30
University of Illinois - Urbana-Champaign United States 31
Babson College (Olin) United States 31
Pennsylvania State University (Smeal) United States 31
University of South Carolina (Moore) United States 32
University of Texas at Dallas (Naveen) United States 34
University of Georgia (Terry) United States 36
Texas A&M University (Mays) United States 36
University of Connecticut United States 36
Carnegie Mellon (Tepper) United States 37
Average: 55 months

QS TopMBA.com Return on Investment Report 2018
9
Shortest Payback Period: MBA, Europe
Across the US & Canada, MBA candidates tend to recover their losses in around four and a half years. At a handful of schools, however, candidates can actually recover their losses in under three years. In terms of business masters, recovery periods are in line with global averages. North American business analytics programs, however, do seem to be world-leading – offering a return in just over six years.
If you are looking for a quick return on your MBA investment, then it would seem Europe would be the place to do it. Over the entirety of this diverse continent, the average payback stands at just over three years, with eight schools offering a return within two. This is a consequence of the lower opportunity cost of the predominant one-year format. As mentioned above, the UK fares particularly well in this metric, dominating the top-10.
Average: 39 months
Institution Country Months
University of Strathclyde United Kingdom 18
University of Mannheim Germany 21
Durham University United Kingdom 22
University of Birmingham United Kingdom 23
SDA Bocconi Italy 24
Lancaster University United Kingdom 24
Imperial College London United Kingdom 24
University of Liverpool United Kingdom 24
University of Bath United Kingdom 25
EDHEC France 26
QS TopMBA.com Return on Investment Report 2018
10
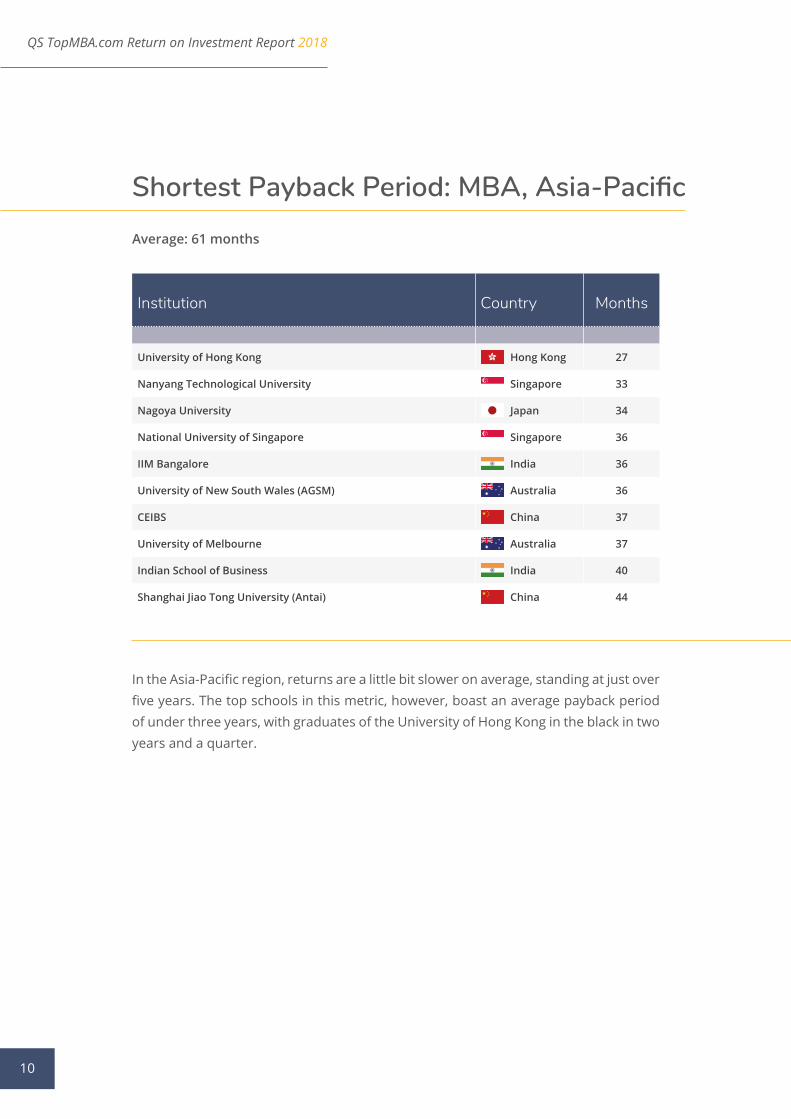
Shortest Payback Period: MBA, Asia-Pacific
In the Asia-Pacific region, returns are a little bit slower on average, standing at just over five years. The top schools in this metric, however, boast an average payback period of under three years, with graduates of the University of Hong Kong in the black in two years and a quarter.
Average: 61 months
Institution Country Months
University of Hong Kong Hong Kong 27
Nanyang Technological University Singapore 33
Nagoya University Japan 34
National University of Singapore Singapore 36
IIM Bangalore India 36
University of New South Wales (AGSM) Australia 36
CEIBS China 37
University of Melbourne Australia 37
Indian School of Business India 40
Shanghai Jiao Tong University (Antai) China 44
QS TopMBA.com Return on Investment Report 2018
11
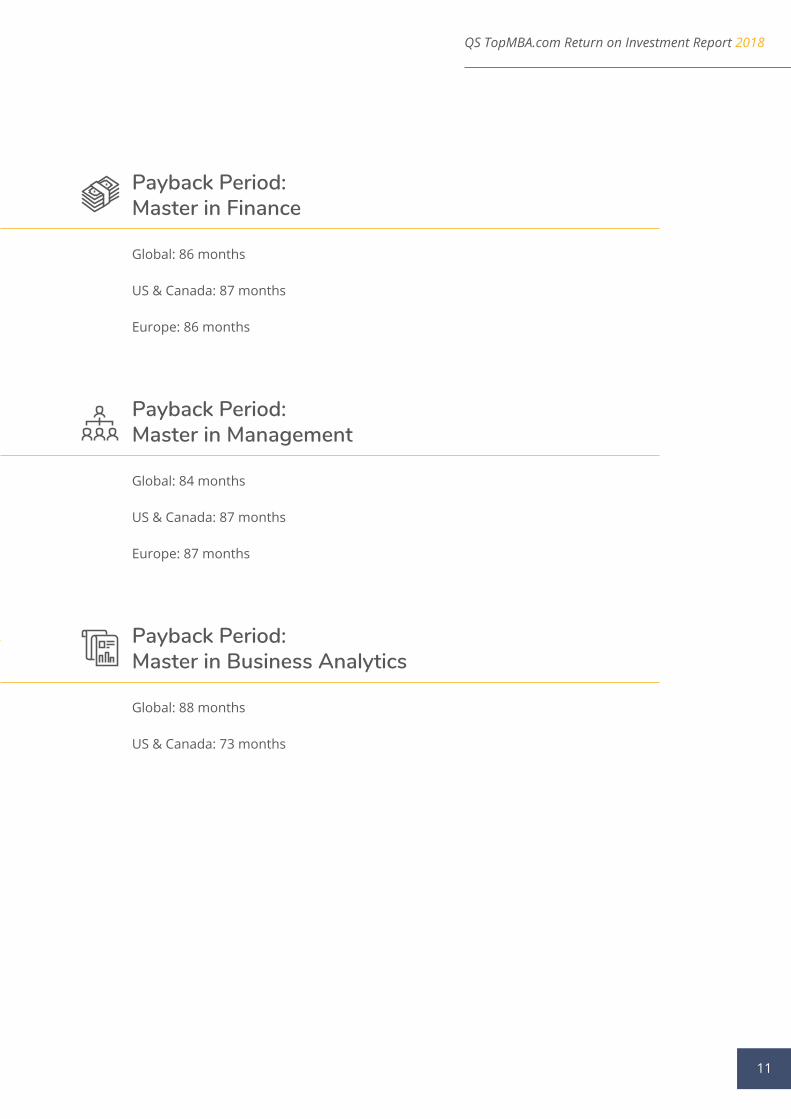
Payback Period: Master in Finance
Global: 86 months
US & Canada: 87 months
Europe: 86 months
Payback Period: Master in Management
Global: 84 months
US & Canada: 87 months
Europe: 87 months
Payback Period: Master in Business Analytics
Global: 88 months
US & Canada: 73 months

12
QS TopMBA.com Return on Investment Report 2018
Salary Levels
Highest Salary: MBA, Global
Average: $79,829
Institution Country Salary
Stanford University United States $140,600
Harvard Business School United States $135,000
University of Pennsylvania (Wharton) United States $125,000
Columbia University United States $125,000
University of Chicago (Booth) United States $125,000
MIT (Sloan) United States $125,000
Northwestern University (Kellogg) United States $124,000
Dartmouth University (Tuck) United States $123,900
University of Virginia (Darden) United States $122,800
UC Berkeley (Haas) United States $122,500
Duke University (Fuqua) United States $121,300
Cornell University (Johnson) United States $121,200
NYU (Stern) United States $120,900
IMD Switzerland $120,100
Yale University United States $120,000
University of Michigan (Ross) United States $120,000
UCLA (Anderson) United States $118,200
Carnegie Mellon University (Tepper) United States $117,700
Emory University (Goizueta) United States $116,200
USC (Marshall) United States $115,300

QS TopMBA.com Return on Investment Report 2018
13
Highest Salary: MBA, US & Canada
Average: $89,037
While you may recoup your investment most rapidly in Europe, for the most bombastic MBA salary levels in the world, we must look to the US. Switzerland’s IMD is the only school which prevents an entirely American top-20. As one might expect, the list is led by the super elite M7. Outside of that we see names familiar to any observer of business school rankings.
Globally, MBA salaries are comfortably in excess of business masters, though we must factor in the greater experience of MBA candidates. Finance offers a higher salary premium than management, while it seems business analytics graduates can command very compelling salaries indeed – though this average is brought up by virtue of a smaller, North American and European-dominated sample.
Institution Country Salary
Stanford University United States $140,600
Harvard Business School United States $135,000
University of Pennsylvania (Wharton) United States $125,000
Columbia University United States $125,000
University of Chicago (Booth) United States $125,000
MIT (Sloan) United States $125,000
Northwestern University (Kellogg) United States $124,000
Dartmouth University (Tuck) United States $123,900
University of Virginia (Darden) United States $122,800
UC Berkeley (Haas) United States $122,500

QS TopMBA.com Return on Investment Report 2018
14
Stanford leads its fellow M7 schools here; these are good times for MBAs working in Silicon Valley, it would seem. As we would expect, Harvard is in second, with a cluster of other schools (led by the M7) following at close intervals. Average salaries in the US & Canada are the best in the world, for MBA and specialized business master graduates alike. Indeed, it seems that location plays a huge part here, with some US-based masters programs yielding more generous salary offers than MBA programs elsewhere.
Highest Salary: MBA, Europe
Average: $73,271
Institution Country Salary
IMD Switzerland $120,100
SBS Swiss Business School Switzerland $110,000
INSEAD France $103,700
Vlerick Business School Belgium $101,000
London Business School United Kingdom $95,600
University of Mannheim Germany $93,600
University of St. Gallen Switzerland $91,000
HEC Paris France $90,600
University of Oxford (Saïd) United Kingdom $88,900
European Business School Germany $87,800
In Europe, Swiss business schools lead the way in terms of the salaries on offer, with the three of the top-10 to be found in the small Alpine nation. France’s INSEAD, regularly to be found in the upper echelons of global MBA rankings, is the highest non-Swiss school, while the UK and Germany are also represented twice. The salaries on offer to business masters graduates tend to be a bit lower, but we must bear in mind we are looking at pre-experience graduates in these instances.

QS TopMBA.com Return on Investment Report 2018
15
Highest Salary: MBA, Asia-Pacific
Average: $63,948
Institution Country Salary
University of New South Wales (AGSM) Australia $110,000
Macquarie University Australia $105,400
University of Hong Kong Hong Kong $92,400
University of Queensland Australia $87,800
Deakin University Australia $86,400
University of Western Australia Australia $86,000
University of Otago New Zealand $86,000
University of Melbourne Australia $83,700
HKUST Hong Kong $83,400
University of Wollongong Australia $75,300
Schools in Australia, included in the Asia-Pacific region, unsurprisingly dominate this metric, led by the University of New South Wales’ Australian Graduate School of Management. The Group of Eight are well represented, though Macquarie, Deakin and Wollongong show that there’s more to advanced Australian business education. Hong Kong’s two-most elite schools also make the list, as well as New Zealand’s well-respected Otago.

QS TopMBA.com Return on Investment Report 2018
16
Salary: Master in Finance
Global: $54,065
US & Canada: $77,659
Europe: $43,623
Salary: Master in Management
Global: $44,443
US & Canada: $62,027
Europe $40,893
Salary: Master in Business Analytics
Global: $63,064
US & Canada: $79,313

17
QS TopMBA.com Return on Investment Report 2018
Salary Uplift
Biggest Salary Uplift: MBA, Global
Average: 64%
Institution Country Uplift
Willamette University (Atkinson) United States 223%
University of Illinois (Urbana-Champaign) United States 176%
University of Connecticut United States 171%
IIM Ahmedabad India 167%
University of Mannheim Germany 162%
University of Georgia (Terry) United States 156%
University of Strathclyde United Kingdom 155%
Pennsylvania of State (Smeal) United States 154%
Arizona State University (Carey) United States 141%
Indian School of Business India 139%
Imperial College London United Kingdom 139%
University of Minnesota (Carlson) United States 138%
SUNY University at Buffalo United States 138%
Indiana University (Kelley) United States 137%
American University (Kogod) United States 135%
University of Leeds United Kingdom 131%
University of South Carolina (Moore) United States 130%
University of Pittsburgh (Katz) United States 127%
IESEG France 124%
Texas Christian University (Neeley) United States 124%

QS TopMBA.com Return on Investment Report 2018
18
Biggest Salary Uplift: MBA, US & CanadaAverage: 74%
Institution Country Uplift
Willamette University (Atkinson) United States 223%
University of Illinois (Urbana-Champaign) United States 176%
University of Connecticut (UCONN) United States 171%
University of Georgia (Terry) United States 156%
Pennsylvania State University (Smeal) United States 154%
Arizona State University (Carey) United States 141%
University of Minnesota (Carlson) United States 138%
SUNY University at Buffalo United States 138%
Indiana University (Kelley) United States 137%
American University (Kogod) United States 135%
The US again dominates this metric, with well-reputed schools that sit outside the top-tier offering the greatest increase. While the MBA salary levels might not rival those of the highest-ranking schools, it is clear that these schools can certainly provide a considerable premium for their MBA students. Outside of the US, the UK is well represented, with a couple of Indian entries showing that the financial value of the MBA goes beyond the West (though one would expect no less from the ultra-competitive IIM Ahmedabad). The global average stands at around two thirds: this is the metric in which masters programs are most-closely aligned with MBAs.
QS TopMBA.com Return on Investment Report 2018
19
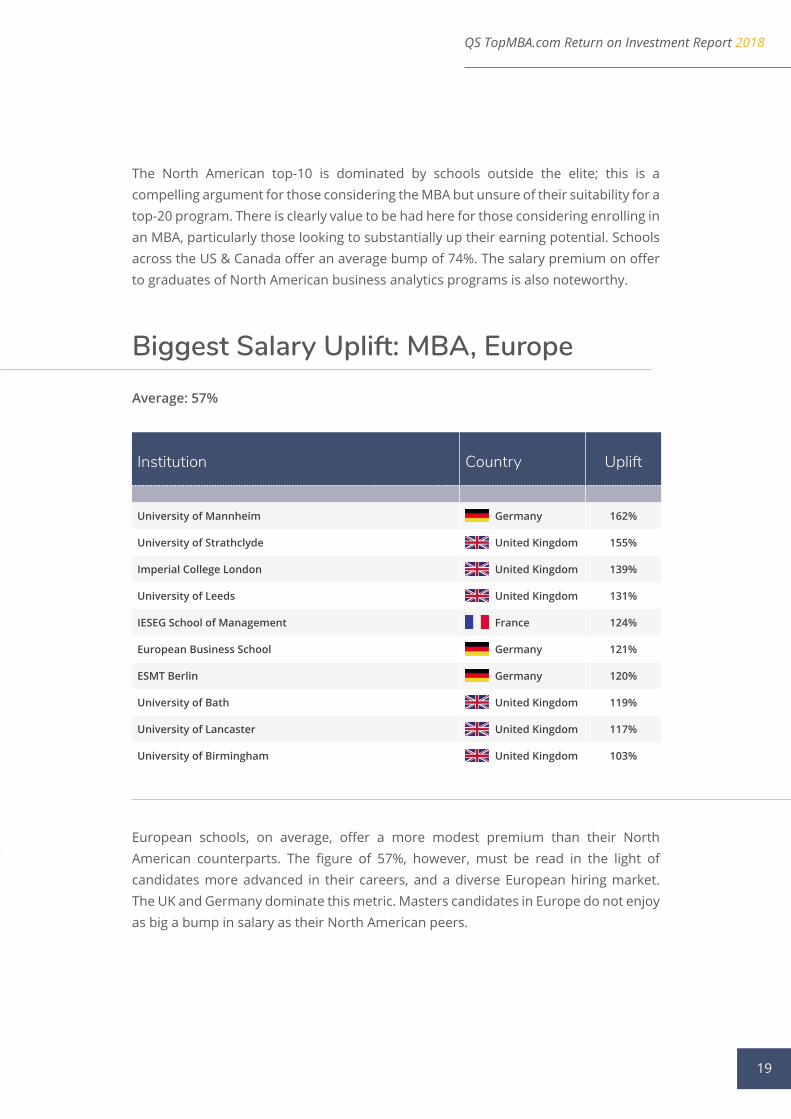
Biggest Salary Uplift: MBA, EuropeAverage: 57%
The North American top-10 is dominated by schools outside the elite; this is a compelling argument for those considering the MBA but unsure of their suitability for a top-20 program. There is clearly value to be had here for those considering enrolling in an MBA, particularly those looking to substantially up their earning potential. Schools across the US & Canada offer an average bump of 74%. The salary premium on offer to graduates of North American business analytics programs is also noteworthy.
European schools, on average, offer a more modest premium than their North American counterparts. The figure of 57%, however, must be read in the light of candidates more advanced in their careers, and a diverse European hiring market. The UK and Germany dominate this metric. Masters candidates in Europe do not enjoy as big a bump in salary as their North American peers.
Institution Country Uplift
University of Mannheim Germany 162%
University of Strathclyde United Kingdom 155%
Imperial College London United Kingdom 139%
University of Leeds United Kingdom 131%
IESEG School of Management France 124%
European Business School Germany 121%
ESMT Berlin Germany 120%
University of Bath United Kingdom 119%
University of Lancaster United Kingdom 117%
University of Birmingham United Kingdom 103%

QS TopMBA.com Return on Investment Report 2018
20
Biggest Salary Uplift: MBA, Asia-PacificAverage: 56%
Institution Country Uplift
IIM Ahmedabad India 167%
Indian School of Business India 139%
Shanghai Jiao Tong University (Antai) China 110%
University of Hong Kong Hong Kong 108%
S. P. Jain IMR India 103%
CEIBS China 92%
IIM Bangalore India 92%
National University of Singapore Singapore 88%
Nanyang Technological University Singapore 86%
University of New South Wales (AGSM) Australia 80%
Salary uplift in the Asia-Pacific region is roughly equivalent in percentage terms to Europe. This metric shows a diverse range of business schools, with India and China enjoying representation alongside the more mature economies of Singapore, Hong Kong and Australia. Both UNSW and HKU’s presence in this list as well as the top-salary list reflects well on both schools’ ability to enhance students’ careers.

QS TopMBA.com Return on Investment Report 2018
21
Salary Uplift: Master in Finance
Global: 55%
US & Canada: 59%
Europe: 41%
Salary Uplift: Master in Management
Global: 66%
US & Canada: 53%
Europe: 44%
Salary Uplift: Master in Business Analytics
Global: 46%
US & Canada: 70%
22
QS TopMBA.com Return on Investment Report 2018
10-Year ROI
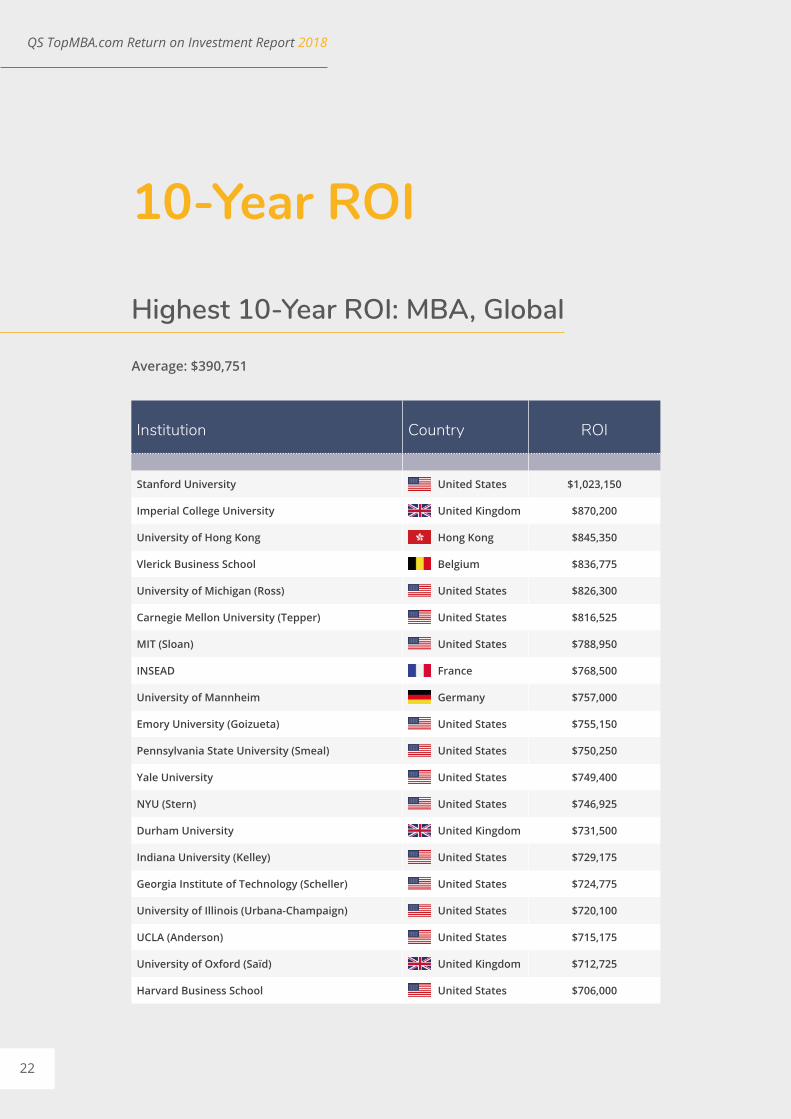
Highest 10-Year ROI: MBA, Global
Average: $390,751
Institution Country ROI
Stanford University United States $1,023,150
Imperial College University United Kingdom $870,200
University of Hong Kong Hong Kong $845,350
Vlerick Business School Belgium $836,775
University of Michigan (Ross) United States $826,300
Carnegie Mellon University (Tepper) United States $816,525
MIT (Sloan) United States $788,950
INSEAD France $768,500
University of Mannheim Germany $757,000
Emory University (Goizueta) United States $755,150
Pennsylvania State University (Smeal) United States $750,250
Yale University United States $749,400
NYU (Stern) United States $746,925
Durham University United Kingdom $731,500
Indiana University (Kelley) United States $729,175
Georgia Institute of Technology (Scheller) United States $724,775
University of Illinois (Urbana-Champaign) United States $720,100
UCLA (Anderson) United States $715,175
University of Oxford (Saïd) United Kingdom $712,725
Harvard Business School United States $706,000

QS TopMBA.com Return on Investment Report 2018
23
We see an interesting mix in schools that have appeared in above indicators in the 10-year ROI ranking. Stanford, as it has in previous editions of this report, comfortably leads the way and is the only school, by our (admittedly imprecise) measure, to break the seven-figure mark. Imperial College London and the University of Hong Kong follow thanks to high salary premiums. Belgium’s Vlerick (an average six-figure salary on graduation) and Germany’s Mannheim (21-month payback period) will be familiar names to those who have been scrutinizing the preceding tables.
While naturally, MBA ROI is down to the individual as much as anything, the average return here of close to $400,000 globally speaking, shows that an MBA investment will, quite likely, pay for itself in a relatively short period of time.
Highest 10-Year ROI: MBA, US & CanadaAverage: $419,161
Institution Country ROI
Stanford University United States $1,023,150
University of Michigan (Ross) United States $826,300
Carnegie Mellon University (Tepper) United States $816,525
MIT (Sloan) United States $788,950
Emory University (Goizueta) United States $755,150
Pennsylvania State University (Smeal) United States $750,250
Yale University United States $749,400
NYU (Stern) United States $746,925
Indiana University (Kelley) United States $729,175
Georgia Institute of Technology (Scheller) United States $724,775

QS TopMBA.com Return on Investment Report 2018
24
Highest 10-Year ROI: MBA, EuropeAverage: $430,447
Stanford really stands out here; if you can make it through the competitive entry procedure in the first place, then it is likely you are destined for handsome returns. Elsewhere, while the names included here can hardly be described as obscure, it’s notable that many of North America’s most prestigious schools do not feature at this stage – give it a few more years, though, and those high salaries will really kick in. At this point, though, this table is an indication of the ability of MBA programs outside the M7 to pay for themselves and offer considerable dividends beyond that.
Institution Country ROI
Imperial College London United Kingdom $870,200
Vlerick Business School Belgium $836,775
INSEAD France $768,500
University of Mannheim Germany $757,000
Durham University United Kingdom $731,500
University of Oxford (Saïd) United Kingdom $712,725
IMD Switzerland $697,900
IE University Spain $692,725
SDA Bocconi Italy $689,325
University of Strathclyde United Kingdom $671,000

QS TopMBA.com Return on Investment Report 2018
25
The European table of best 10-year ROI is dominated by familiar names (from this study at least), with the four top schools, led by the surprise package of Imperial College London. IMD and INSEAD ensure that Europe’s most-prestigious names are represented, with the exception of London Business School, where a two-year program slows the rate of return. At the 10-year point, European average ROI still leads North American by virtue of the lower opportunity cost, albeit by a relatively small margin.
Highest 10-Year ROI: MBA, Asia-Pacific Average: $268,934
Institution Country ROI
University of Hong Kong Hong Kong $845,350
University of New South Wales (AGSM) Australia $617,875
University of Melbourne Australia $541,275
National University of Singapore Singapore $509,325
CEIBS China $503,925
Nagoya University Japan $448,575
Nanyang Technological University Singapore $390,975
Macquarie University Australia $380,950
Chinese University of Hong Kong China $353,100
University of Western Australia Australia $344,175
We see a high disparity between top and bottom here. HKU leads the way by quite some way, with four other schools breaking the half-million mark. Australian schools fare well here, as do Singapore’s most-prestigious pair of institutions. Nagoya University ensures that the traditional power of Japan is represented. An average of $268,934 is somewhat lower than the global figure, but by no means detracts from the value of an Asian MBA.
QS TopMBA.com
Full-Time MBA 2018RETURN ON INVESTMENT REPORT