QS TopMBA.com JOBS & SALARY 2018 · QS TopMBA.com Jobs & Salary Trends Report 2018 2 Contents...
25
QS TopMBA.com What is the current state of MBA hiring around the world? TRENDS REPORT JOBS & SALARY 2018
-
Upload
duongthien -
Category
Documents
-
view
217 -
download
0
Transcript of QS TopMBA.com JOBS & SALARY 2018 · QS TopMBA.com Jobs & Salary Trends Report 2018 2 Contents...

QS TopMBA.com
What is the current state of MBA hiring around the world?
TRENDS REPORT
JOBS & SALARY 2018
QS TopMBA.com Jobs & Salary Trends Report 2018
2
ContentsIntroduction 3
Fast Facts 4
MBA Recruitment Trends by Region 5
MBA Salary Levels by Region 8
MBA Salary and Recruitment Levels by Industry 12
Job Functions 14
Regional Guides 15
ı US & Canada 15
ı Western Europe 16
ı Asia-Pacific 17
ı Eastern Europe & Central Asia 18
ı Latin America 19
ı Middle East & Africa 20
For What are Employers Looking 21
ı MBA Skills 21
ı MBA Specializations 22
ı Work Experience 23
Sample of Employers 24
QS TopMBA.com Jobs & Salary Trends Report 2018
3
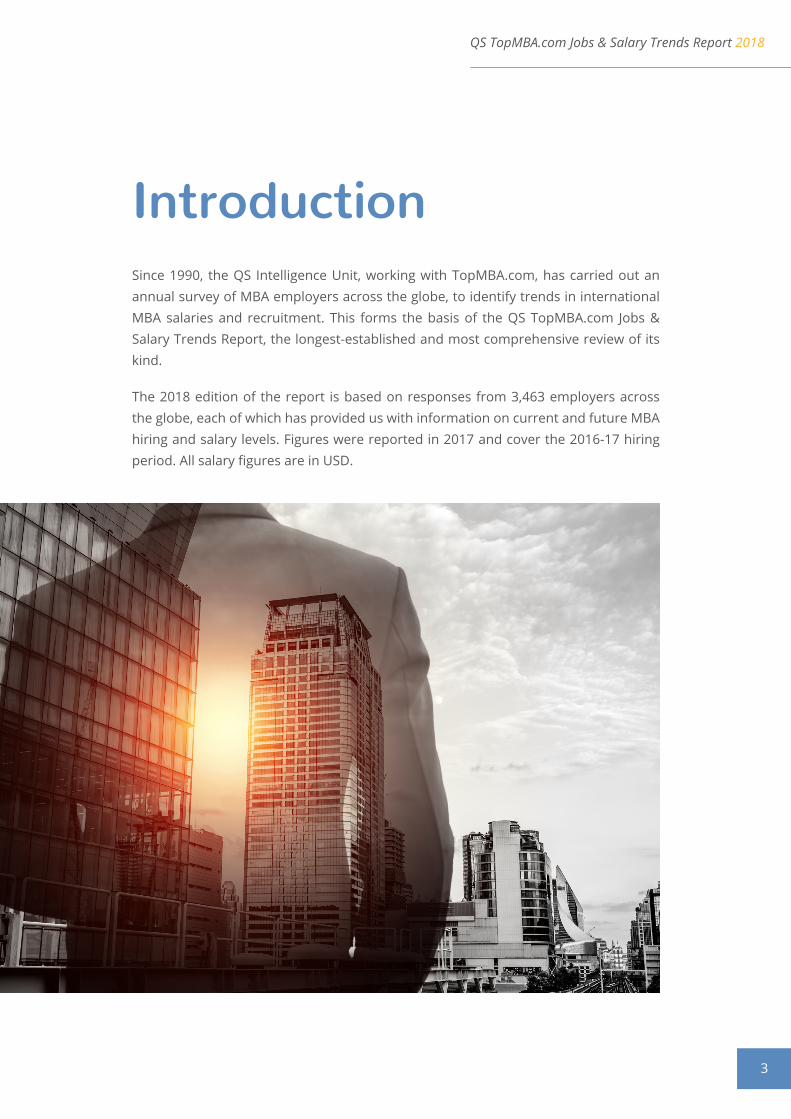
IntroductionSince 1990, the QS Intelligence Unit, working with TopMBA.com, has carried out an annual survey of MBA employers across the globe, to identify trends in international MBA salaries and recruitment. This forms the basis of the QS TopMBA.com Jobs & Salary Trends Report, the longest-established and most comprehensive review of its kind.
The 2018 edition of the report is based on responses from 3,463 employers across the globe, each of which has provided us with information on current and future MBA hiring and salary levels. Figures were reported in 2017 and cover the 2016-17 hiring period. All salary figures are in USD.
QS TopMBA.com Jobs & Salary Trends Report 2018
4
Fast Facts ı 2017 a good year for MBA hiring levels, with a 13% increase reported globally.
ı Asia-Pacific posts the strongest growth at 18%, with mature markets in US & Canada and Western Europe both registering 10% – comfortably in excess of employers’ conservative predictions.
ı Slight slowdown predicted in 2018 and 2019.
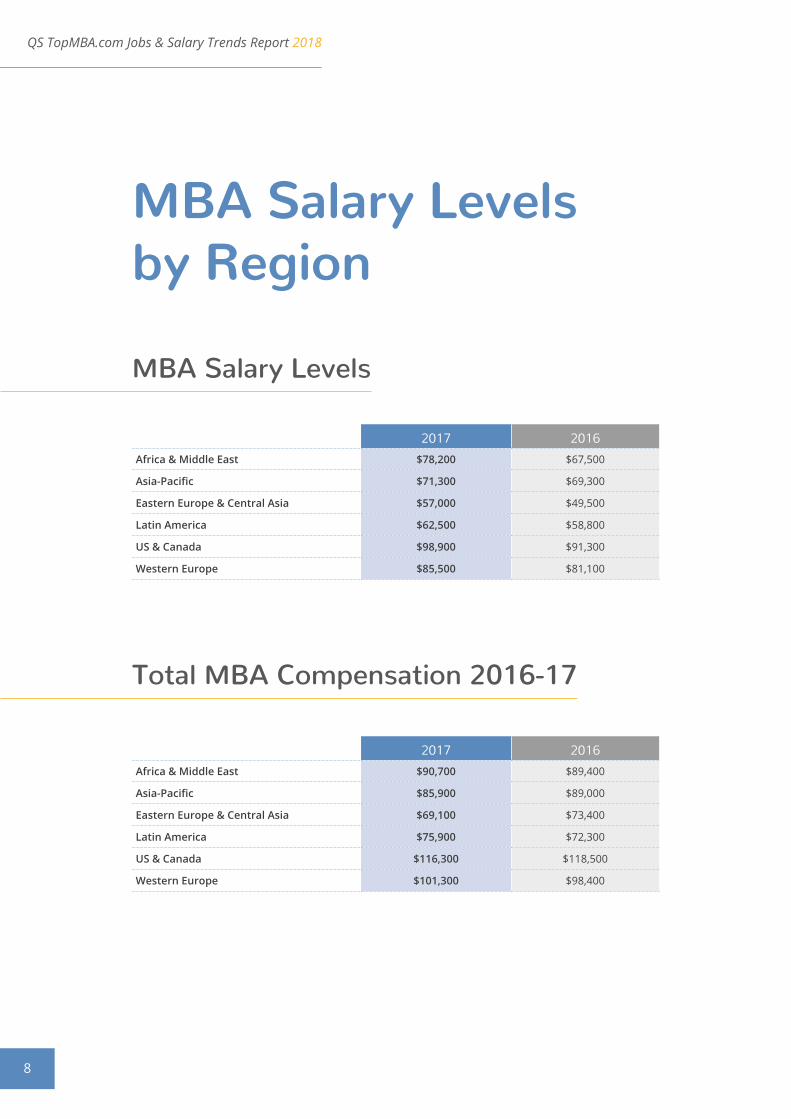
ı MBA salary levels increase after dip in 2016; MBA employers in the US & Canada are the most generous ($98,900, increasing to $116,300 with bonus), pulling away from Western Europe ($85,500, increasing to $101,300).
ı Highest MBA salaries on offer in Switzerland ($123,500), followed by US ($102,100). France ($98,500) and UK ($92,400) are next best performers in Europe. Australia leads the way in Asia-Pacific ($98,400), followed by Japan ($80,000).
ı Sales/business development, finance and general management most commonly offered roles.
ı Strong growth across industry sectors, showing MBAs are in demand from a diverse range of employers. Growth in jobs in financial services still slower, but salaries on offer are highest ($97,100 – US & Canada and Western Europe only).
ı Employers want more from MBA hires in terms of leadership and soft skills.
ı Greatest proportion of employers looking for 3-5 or 1-3 years’ experience.
QS TopMBA.com Jobs & Salary Trends Report 2018
5
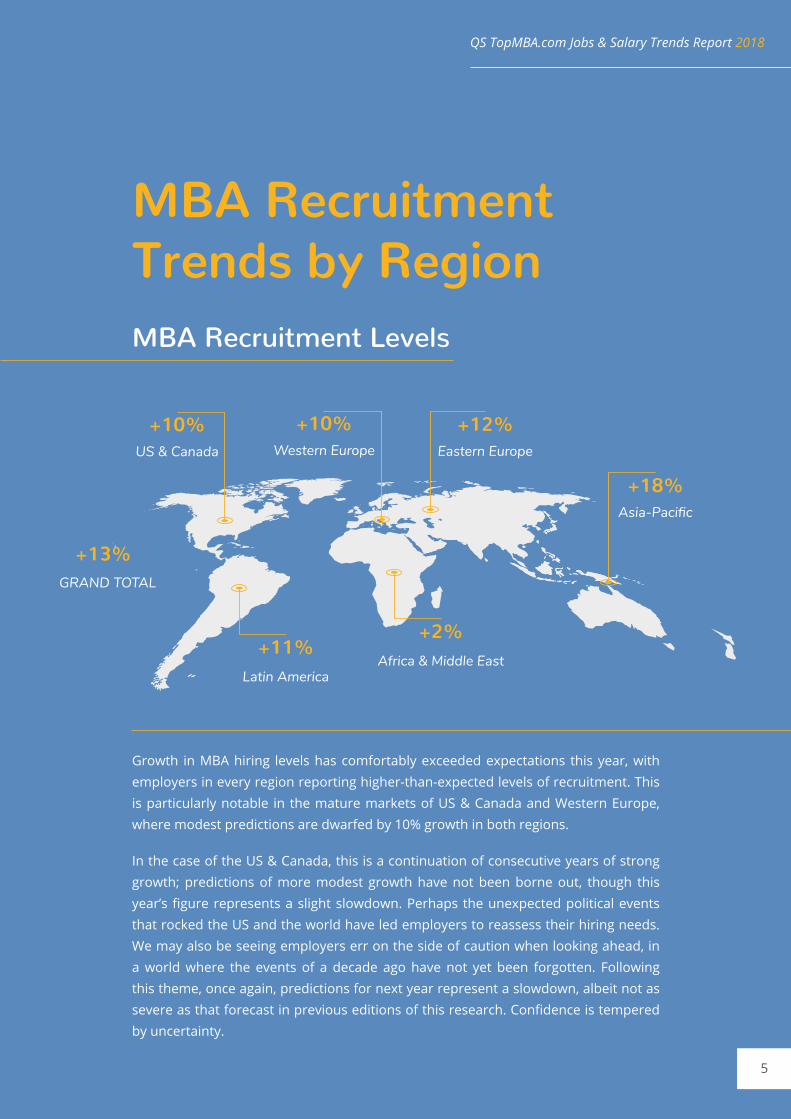
Growth in MBA hiring levels has comfortably exceeded expectations this year, with employers in every region reporting higher-than-expected levels of recruitment. This is particularly notable in the mature markets of US & Canada and Western Europe, where modest predictions are dwarfed by 10% growth in both regions.
In the case of the US & Canada, this is a continuation of consecutive years of strong growth; predictions of more modest growth have not been borne out, though this year’s figure represents a slight slowdown. Perhaps the unexpected political events that rocked the US and the world have led employers to reassess their hiring needs. We may also be seeing employers err on the side of caution when looking ahead, in a world where the events of a decade ago have not yet been forgotten. Following this theme, once again, predictions for next year represent a slowdown, albeit not as severe as that forecast in previous editions of this research. Confidence is tempered by uncertainty.
MBA Recruitment Trends by RegionMBA Recruitment Levels
+2%+11%
+13%
Africa & Middle EastLatin America
GRAND TOTAL
Asia-Pacific
Eastern EuropeWestern EuropeUS & Canada
+18%
+12%+10%+10%
QS TopMBA.com Jobs & Salary Trends Report 2018
6
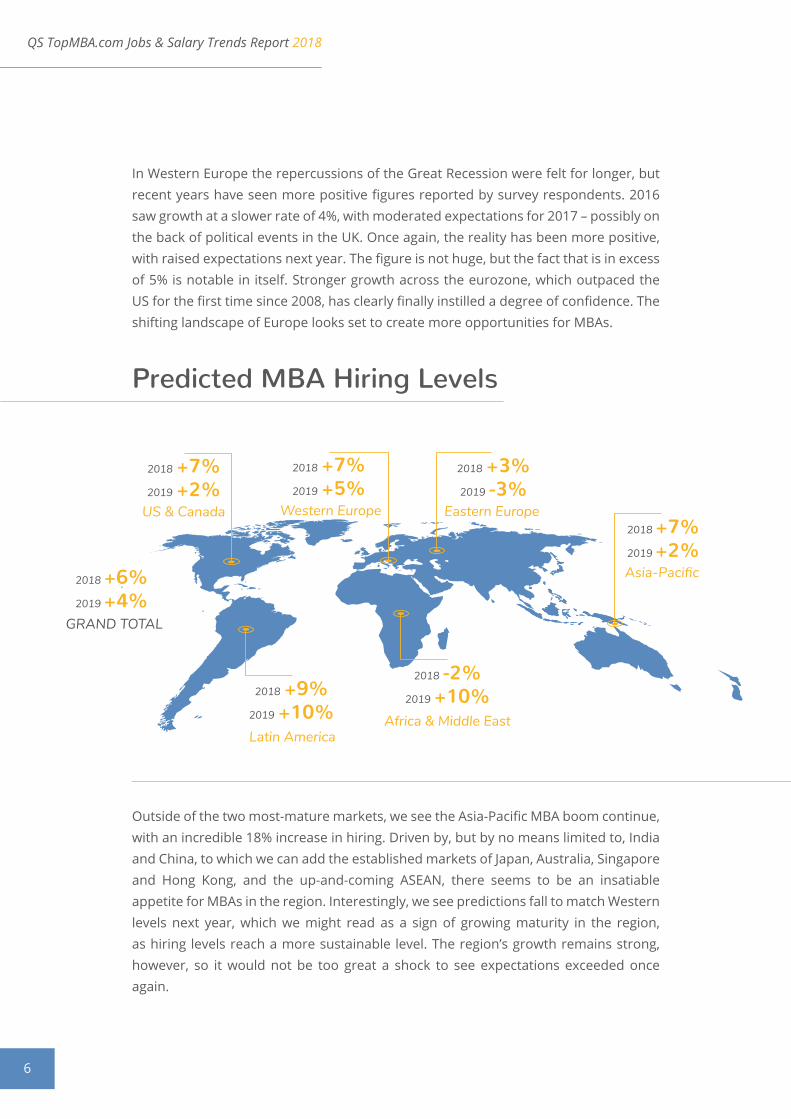
Predicted MBA Hiring Levels
2018 -2%2019 +10%2018 +9%
2019 +10%
2018 +6%2019 +4%
Africa & Middle EastLatin America
GRAND TOTAL
Asia-Pacific
Eastern EuropeWestern EuropeUS & Canada2018 +7%2019 +2%
2018 +3%2019 -3%
2018 +7%2019 +5%
2018 +7%2019 +2%
In Western Europe the repercussions of the Great Recession were felt for longer, but recent years have seen more positive figures reported by survey respondents. 2016 saw growth at a slower rate of 4%, with moderated expectations for 2017 – possibly on the back of political events in the UK. Once again, the reality has been more positive, with raised expectations next year. The figure is not huge, but the fact that is in excess of 5% is notable in itself. Stronger growth across the eurozone, which outpaced the US for the first time since 2008, has clearly finally instilled a degree of confidence. The shifting landscape of Europe looks set to create more opportunities for MBAs.
Outside of the two most-mature markets, we see the Asia-Pacific MBA boom continue, with an incredible 18% increase in hiring. Driven by, but by no means limited to, India and China, to which we can add the established markets of Japan, Australia, Singapore and Hong Kong, and the up-and-coming ASEAN, there seems to be an insatiable appetite for MBAs in the region. Interestingly, we see predictions fall to match Western levels next year, which we might read as a sign of growing maturity in the region, as hiring levels reach a more sustainable level. The region’s growth remains strong, however, so it would not be too great a shock to see expectations exceeded once again.
QS TopMBA.com Jobs & Salary Trends Report 2018
7
Latin America has also had a second-consecutive strong year (2016 was an Olympic year for its largest economy, Brazil). While overall economic growth has slowed, the region finds itself in a relatively stable position as compared to the turn of the century. Accordingly, MBA employers are still looking to bolster their ranks, albeit from a lower base. Predictions for 2018 are resilient, despite potential political complications faced by key-MBA hiring ground Mexico.
In Eastern Europe & Central Asia (EECA) and Middle East & Africa alike, we see the most worrying figures in this year’s analysis: a forecasted contraction in hiring. For now, however, the picture is more positive. While some of the EECA’s larger economies have endured difficult years, many smaller nations enjoyed better fortunes. In a less-mature hiring region, this has been sufficient to see a bump in hiring levels. Mixed fortunes across the huge and varied region of the Middle East & Africa – fluctuating oil prices and unrest, offset by growth peppered across various oil-importing nations – ultimately delivers, in line with the rest of the world, yet another solid growth figure.
And that seems to be the prevailing theme in this year’s data. Despite the uncertainty and challenges faced across the globe, employers are seeking MBA talent in greater numbers than ever before. Indeed, it is to these leaders that organizations are turning to steer them through challenging times.
QS TopMBA.com Jobs & Salary Trends Report 2018
8
MBA Salary Levels by Region
MBA Salary Levels
Total MBA Compensation 2016-17
country 2017 2016Africa & Middle East $78,200 $67,500
Asia-Pacific $71,300 $69,300
Eastern Europe & Central Asia $57,000 $49,500
Latin America $62,500 $58,800
US & Canada $98,900 $91,300
Western Europe $85,500 $81,100
country 2017 2016Africa & Middle East $90,700 $89,400
Asia-Pacific $85,900 $89,000
Eastern Europe & Central Asia $69,100 $73,400
Latin America $75,900 $72,300
US & Canada $116,300 $118,500
Western Europe $101,300 $98,400
QS TopMBA.com Jobs & Salary Trends Report 2018
9
country 2017 2016Africa & Middle East $78,200 $67,500
Asia-Pacific $71,300 $69,300
Eastern Europe & Central Asia $57,000 $49,500
Latin America $62,500 $58,800
US & Canada $98,900 $91,300
Western Europe $85,500 $81,100
country 2017 2016Africa & Middle East $90,700 $89,400
Asia-Pacific $85,900 $89,000
Eastern Europe & Central Asia $69,100 $73,400
Latin America $75,900 $72,300
US & Canada $116,300 $118,500
Western Europe $101,300 $98,400
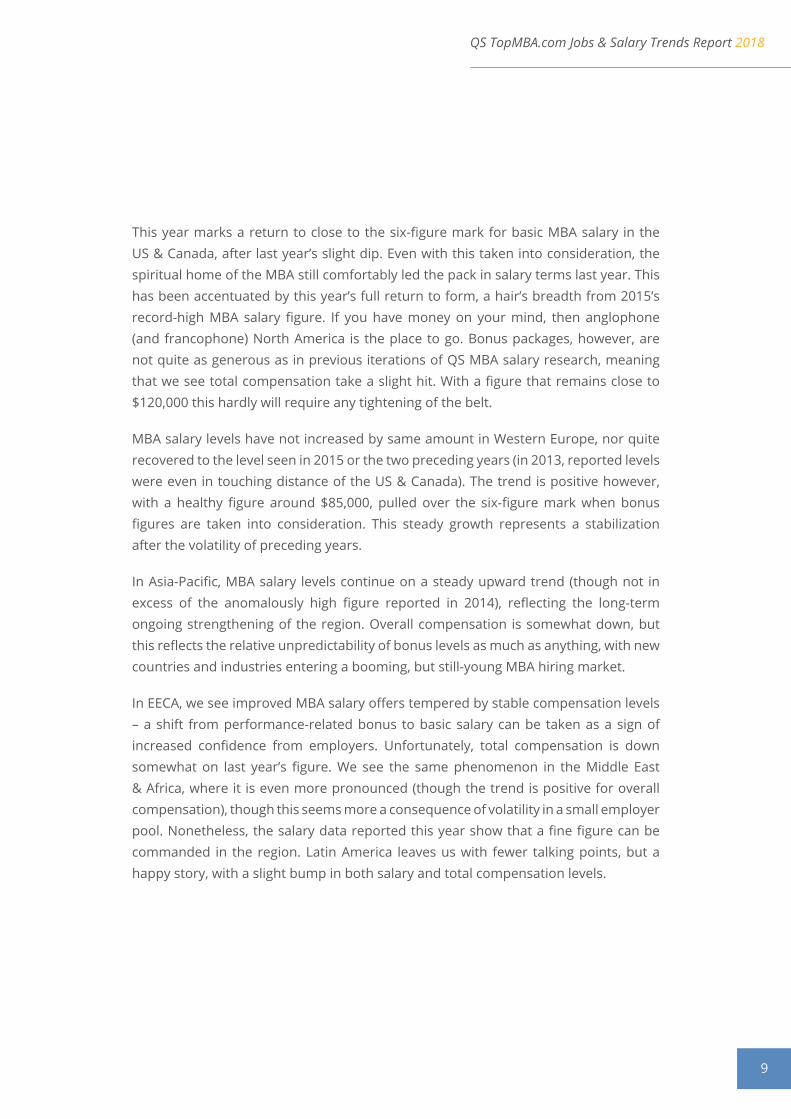
This year marks a return to close to the six-figure mark for basic MBA salary in the US & Canada, after last year’s slight dip. Even with this taken into consideration, the spiritual home of the MBA still comfortably led the pack in salary terms last year. This has been accentuated by this year’s full return to form, a hair’s breadth from 2015’s record-high MBA salary figure. If you have money on your mind, then anglophone (and francophone) North America is the place to go. Bonus packages, however, are not quite as generous as in previous iterations of QS MBA salary research, meaning that we see total compensation take a slight hit. With a figure that remains close to $120,000 this hardly will require any tightening of the belt.
MBA salary levels have not increased by same amount in Western Europe, nor quite recovered to the level seen in 2015 or the two preceding years (in 2013, reported levels were even in touching distance of the US & Canada). The trend is positive however, with a healthy figure around $85,000, pulled over the six-figure mark when bonus figures are taken into consideration. This steady growth represents a stabilization after the volatility of preceding years.
In Asia-Pacific, MBA salary levels continue on a steady upward trend (though not in excess of the anomalously high figure reported in 2014), reflecting the long-term ongoing strengthening of the region. Overall compensation is somewhat down, but this reflects the relative unpredictability of bonus levels as much as anything, with new countries and industries entering a booming, but still-young MBA hiring market.
In EECA, we see improved MBA salary offers tempered by stable compensation levels – a shift from performance-related bonus to basic salary can be taken as a sign of increased confidence from employers. Unfortunately, total compensation is down somewhat on last year’s figure. We see the same phenomenon in the Middle East & Africa, where it is even more pronounced (though the trend is positive for overall compensation), though this seems more a consequence of volatility in a small employer pool. Nonetheless, the salary data reported this year show that a fine figure can be commanded in the region. Latin America leaves us with fewer talking points, but a happy story, with a slight bump in both salary and total compensation levels.
QS TopMBA.com Jobs & Salary Trends Report 2018
10
country Salary Bonus OverallSwitzerland $123,500 $17,400 $140,900
United States $102,100 $18,800 $120,900
Canada $99,800 $11,300 $111,100
France $98,500 $17,700 $116,200
Australia $98,400 $17,800 $116,200
United Kingdom $92,400 $30,500 $122,900
Italy $86,400 $25,400 $111,800
Singapore $82,700 $22,600 $105,300
Japan $80,000 $26,600 $106,600
Germany $77,200 $16,900 $94,100
Chile $76,300 $18,600 $94,900
India $66,500 $9,800 $76,300
Mexico $66,000 $12,800 $78,800
Russia $65,500 $12,900 $78,400
South Korea $65,000 $10,000 $75,000
Colombia $63,800 $10,800 $74,600
Argentina $63,600 $20,700 $84,300
Peru $58,500 $8,400 $66,900
Hong Kong $58,100 $10,400 $68,500
Brazil $54,600 $13,000 $67,600
Spain $52,500 $16,500 $69,000
Malaysia $52,300 $11,200 $63,500
Uruguay $48,900 $13,200 $62,100
China $42,400 $12,600 $55,000
Taiwan $36,800 $12,000 $48,800
MBA Salary Levels by Country
QS TopMBA.com Jobs & Salary Trends Report 2018
11
country Salary Bonus OverallSwitzerland $123,500 $17,400 $140,900
United States $102,100 $18,800 $120,900
Canada $99,800 $11,300 $111,100
France $98,500 $17,700 $116,200
Australia $98,400 $17,800 $116,200
United Kingdom $92,400 $30,500 $122,900
Italy $86,400 $25,400 $111,800
Singapore $82,700 $22,600 $105,300
Japan $80,000 $26,600 $106,600
Germany $77,200 $16,900 $94,100
Chile $76,300 $18,600 $94,900
India $66,500 $9,800 $76,300
Mexico $66,000 $12,800 $78,800
Russia $65,500 $12,900 $78,400
South Korea $65,000 $10,000 $75,000
Colombia $63,800 $10,800 $74,600
Argentina $63,600 $20,700 $84,300
Peru $58,500 $8,400 $66,900
Hong Kong $58,100 $10,400 $68,500
Brazil $54,600 $13,000 $67,600
Spain $52,500 $16,500 $69,000
Malaysia $52,300 $11,200 $63,500
Uruguay $48,900 $13,200 $62,100
China $42,400 $12,600 $55,000
Taiwan $36,800 $12,000 $48,800
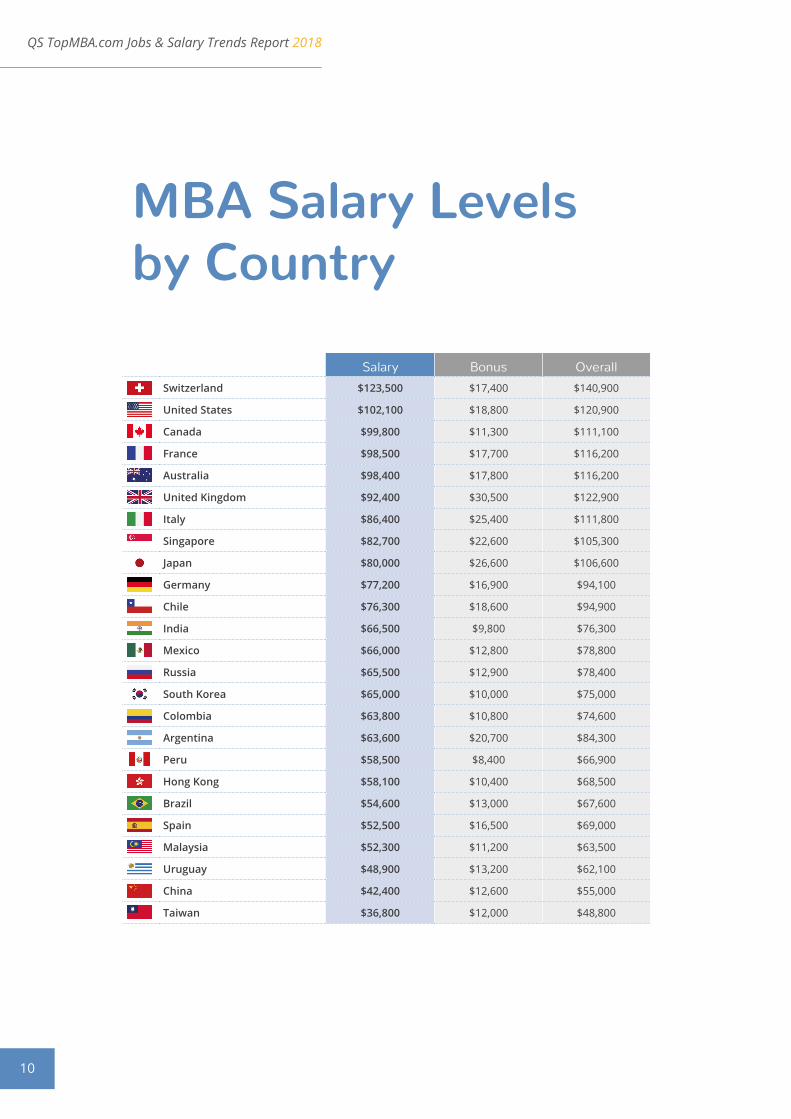
If you’re looking to earn the highest-possible MBA salary, you would do well to target employers in Switzerland, where we see phenomenal salary levels on offer. Elsewhere in Western Europe, the traditionally strong markets of France and the UK – despite uncertainty in the latter, and challenging elections in both – post strong salary figures.
In a great year for North American MBA salary levels, the US leapfrogs into second place in our (non-exhaustive) selection of nations followed by Canada in third place. Australia, as in previous years, leads the pack in Asia-Pacific, followed by Singapore and Japan; while the world’s third-largest economy may have endured some tough years, MBA employers in this established market are still able to offer appealing sums.
Of the Latin America nations featured, we see Chile leading the way, followed by Mexico. Russia posts a figure comfortably in excess of the EECA average, reflecting its status as a relatively mature market in the region, despite turbulent times economically speaking.

QS TopMBA.com Jobs & Salary Trends Report 2018
12
MBA Salary and Recruitment Levels by Industry
2017 2018 2019
Technology 13% 5% 2%
Other 15% 5% 3%
Finance 5% 7% 7%
Consulting 11% 14% 3%
MBA Recruitment Levels by Industry
MBA Salary Levels by Industry
Technology $89,633
Other $89,675
Finance $97,100
Consulting $90,900
QS TopMBA.com Jobs & Salary Trends Report 2018
13
Breaking down recruitment levels by industry, we see the ‘other’ grouping – which takes in everything aside from the three most prominent areas of MBA hiring – has seen the greatest increase in MBA hiring levels. This reflects a theme evident in the last few iterations of this research: an increasingly diverse body of employers are seeking MBA talent. While finance and consulting still account for a good deal of MBA hiring, there are many more options open to the Millennial generation of MBAs, to whom traditional paths may not be as appealing. In line with global trends, the next couple of years look set to be more modest.
Employers in the burgeoning and glamourous technology sector have also posted confident figures this year, though gradually declining predicted figures over the next two years suggest that at some point, we may see this bubble burst. Given the innovation with which the sector is synonymous, there is a degree of unpredictability we must always take into account.
Growth in consulting is also in double digits. The next few years look to be volatile ones, however, with a huge spike next year followed by a slower period as the decade draws to a close. Finance continues to grow at a more modest pace a decade on from the global financial crisis, though the smaller figure must be read in light of a larger base in terms of MBA hiring. Slightly more robust growth is forecast over the next two years.
Salary levels (Western Europe and US & Canada only) are fairly consistent across industries. Taking into account that averages represent a wide range, the takeaway here seems again to be that a diverse range of employers are keen to attract MBA talent, and willing to pay competitive salaries in order to do so. We see a slightly higher salary level on offer from employers in financial services, as might be expected. Consulting salaries remain in line with other sectors, as small firms intermingle with the traditional big industry names, who continue to offer some of the biggest returns available.
QS TopMBA.com Jobs & Salary Trends Report 2018
14
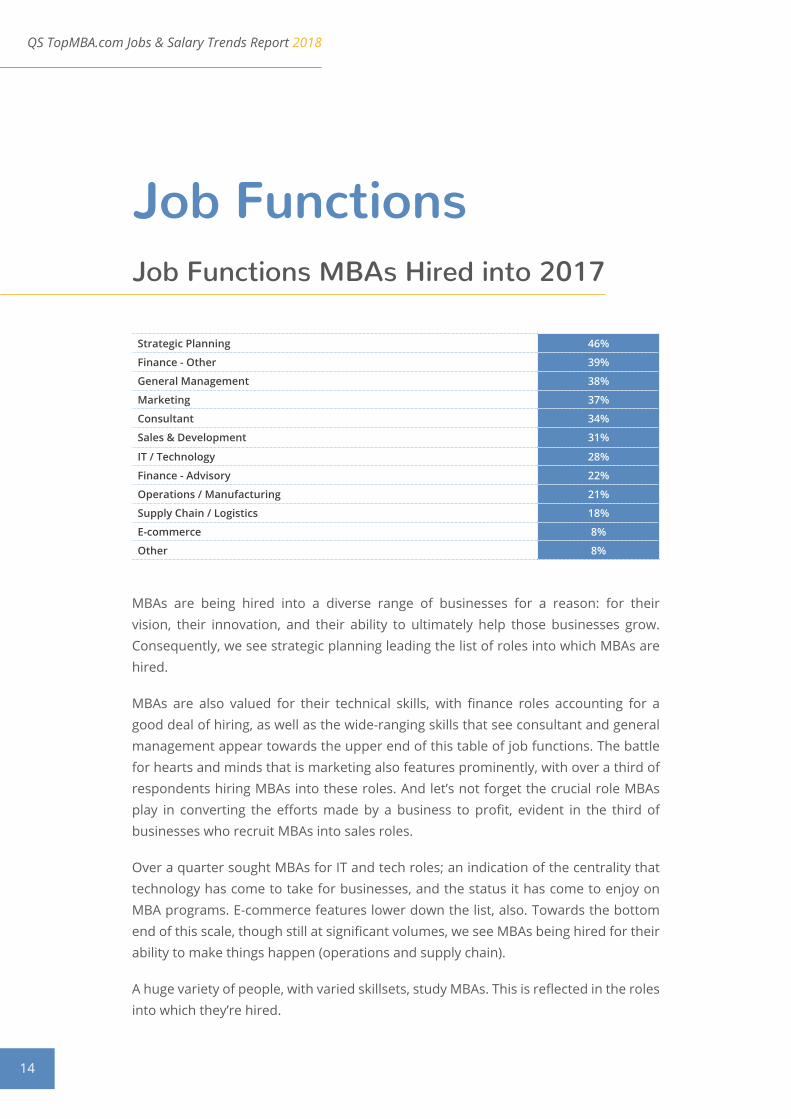
MBAs are being hired into a diverse range of businesses for a reason: for their vision, their innovation, and their ability to ultimately help those businesses grow. Consequently, we see strategic planning leading the list of roles into which MBAs are hired.
MBAs are also valued for their technical skills, with finance roles accounting for a good deal of hiring, as well as the wide-ranging skills that see consultant and general management appear towards the upper end of this table of job functions. The battle for hearts and minds that is marketing also features prominently, with over a third of respondents hiring MBAs into these roles. And let’s not forget the crucial role MBAs play in converting the efforts made by a business to profit, evident in the third of businesses who recruit MBAs into sales roles.
Over a quarter sought MBAs for IT and tech roles; an indication of the centrality that technology has come to take for businesses, and the status it has come to enjoy on MBA programs. E-commerce features lower down the list, also. Towards the bottom end of this scale, though still at significant volumes, we see MBAs being hired for their ability to make things happen (operations and supply chain).
A huge variety of people, with varied skillsets, study MBAs. This is reflected in the roles into which they’re hired.
Job FunctionsJob Functions MBAs Hired into 2017
Strategic Planning 46%
Finance - Other 39%
General Management 38%
Marketing 37%
Consultant 34%
Sales & Development 31%
IT / Technology 28%
Finance - Advisory 22%
Operations / Manufacturing 21%
Supply Chain / Logistics 18%
E-commerce 8%
Other 8%
QS TopMBA.com Jobs & Salary Trends Report 2018
15
Regional GuidesUS & Canada
US & Canada MBA Salary Levels
US & Canada MBA Recruitment Levels by Industry
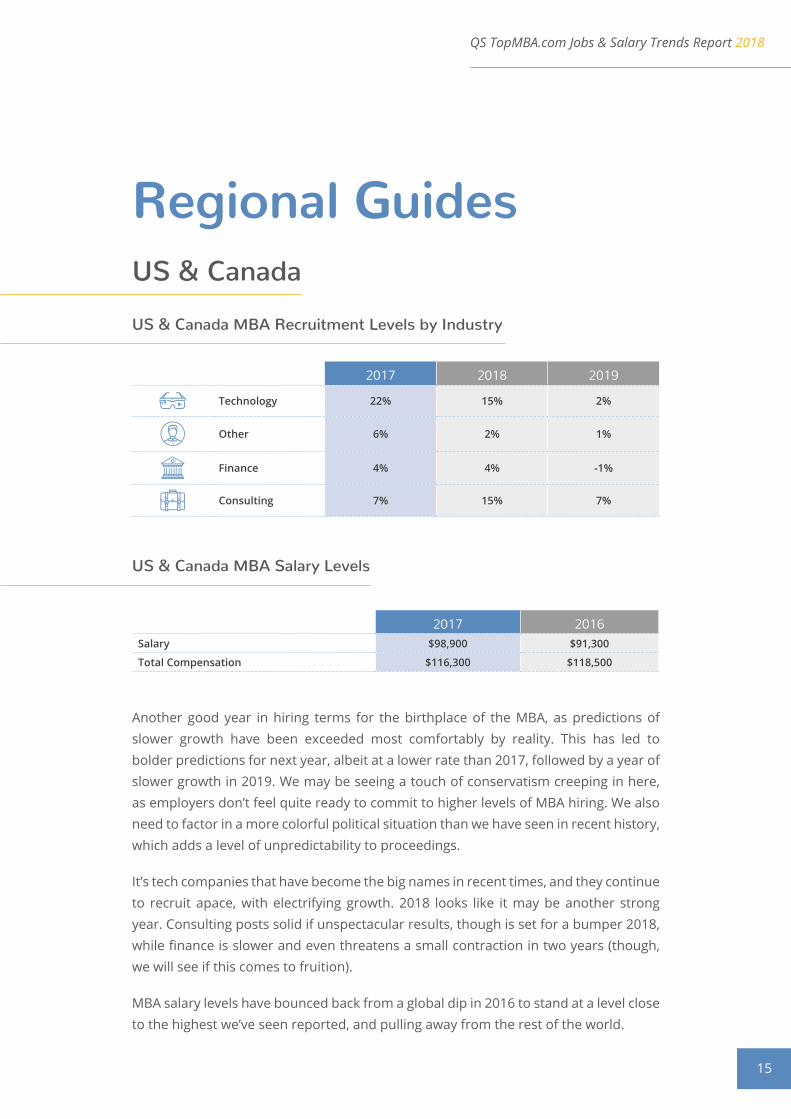
2017 2018 2019
Technology 22% 15% 2%
Other 6% 2% 1%
Finance 4% 4% -1%
Consulting 7% 15% 7%
Another good year in hiring terms for the birthplace of the MBA, as predictions of slower growth have been exceeded most comfortably by reality. This has led to bolder predictions for next year, albeit at a lower rate than 2017, followed by a year of slower growth in 2019. We may be seeing a touch of conservatism creeping in here, as employers don’t feel quite ready to commit to higher levels of MBA hiring. We also need to factor in a more colorful political situation than we have seen in recent history, which adds a level of unpredictability to proceedings.
It’s tech companies that have become the big names in recent times, and they continue to recruit apace, with electrifying growth. 2018 looks like it may be another strong year. Consulting posts solid if unspectacular results, though is set for a bumper 2018, while finance is slower and even threatens a small contraction in two years (though, we will see if this comes to fruition).
MBA salary levels have bounced back from a global dip in 2016 to stand at a level close to the highest we’ve seen reported, and pulling away from the rest of the world.
2017 2016Salary $98,900 $91,300
Total Compensation $116,300 $118,500
QS TopMBA.com Jobs & Salary Trends Report 2018
16
Western Europe MBA Salary Levels
Western Europe MBA Recruitment Levels by Industry
Western Europe
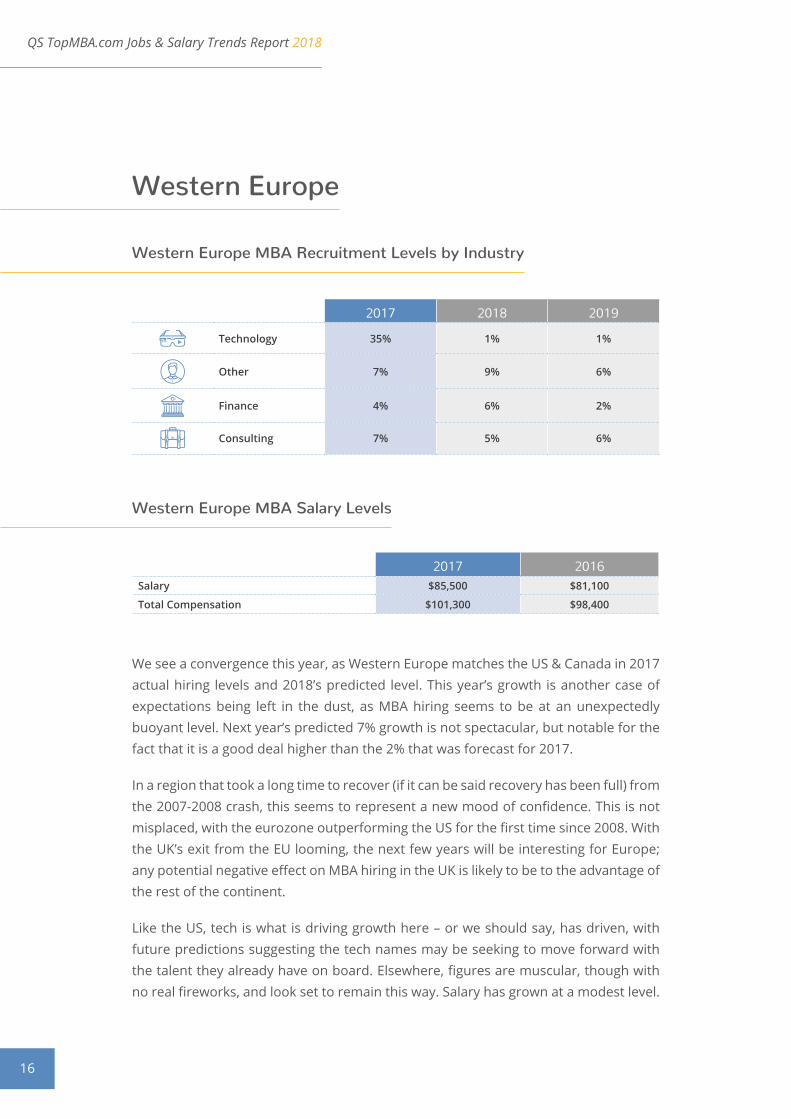
2017 2018 2019
Technology 35% 1% 1%
Other 7% 9% 6%
Finance 4% 6% 2%
Consulting 7% 5% 6%
We see a convergence this year, as Western Europe matches the US & Canada in 2017 actual hiring levels and 2018’s predicted level. This year’s growth is another case of expectations being left in the dust, as MBA hiring seems to be at an unexpectedly buoyant level. Next year’s predicted 7% growth is not spectacular, but notable for the fact that it is a good deal higher than the 2% that was forecast for 2017.
In a region that took a long time to recover (if it can be said recovery has been full) from the 2007-2008 crash, this seems to represent a new mood of confidence. This is not misplaced, with the eurozone outperforming the US for the first time since 2008. With the UK’s exit from the EU looming, the next few years will be interesting for Europe; any potential negative effect on MBA hiring in the UK is likely to be to the advantage of the rest of the continent.
Like the US, tech is what is driving growth here – or we should say, has driven, with future predictions suggesting the tech names may be seeking to move forward with the talent they already have on board. Elsewhere, figures are muscular, though with no real fireworks, and look set to remain this way. Salary has grown at a modest level.
2017 2016Salary $85,500 $81,100
Total Compensation $101,300 $98,400
QS TopMBA.com Jobs & Salary Trends Report 2018
17
Asia-Pacific MBA Salary Levels
Asia-Pacific MBA Recruitment Levels by Industry
Asia-Pacific
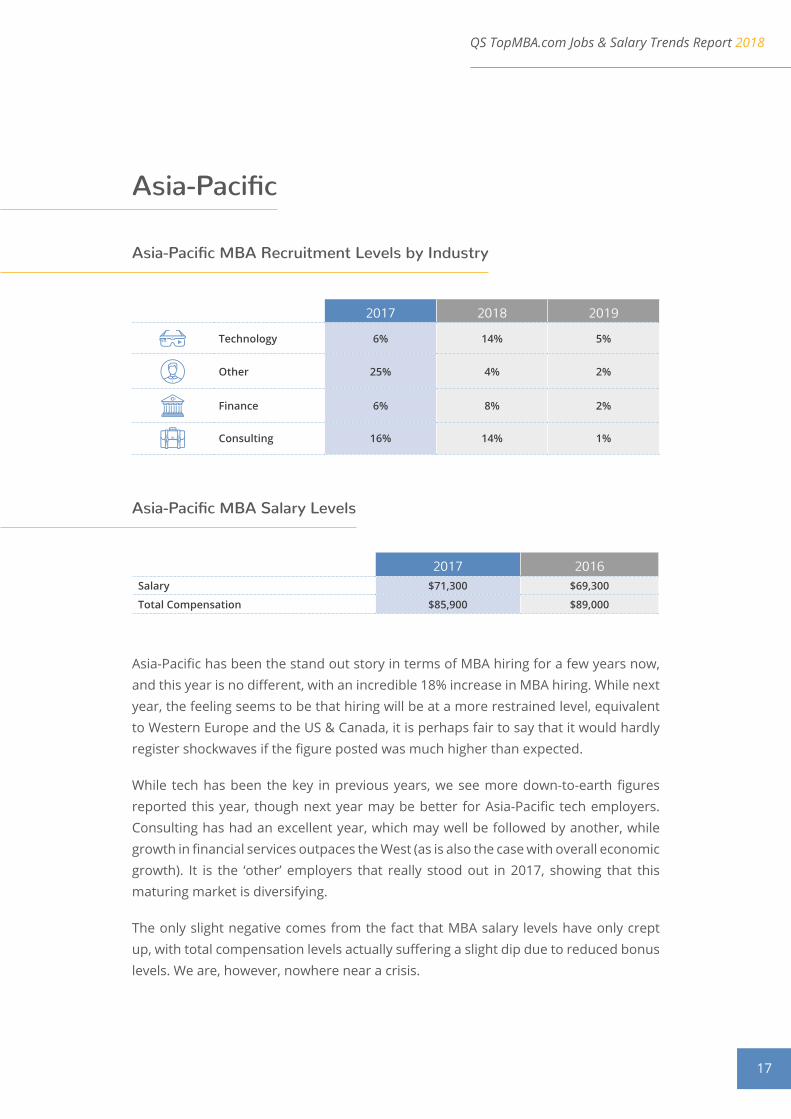
2017 2018 2019
Technology 6% 14% 5%
Other 25% 4% 2%
Finance 6% 8% 2%
Consulting 16% 14% 1%
Asia-Pacific has been the stand out story in terms of MBA hiring for a few years now, and this year is no different, with an incredible 18% increase in MBA hiring. While next year, the feeling seems to be that hiring will be at a more restrained level, equivalent to Western Europe and the US & Canada, it is perhaps fair to say that it would hardly register shockwaves if the figure posted was much higher than expected.
While tech has been the key in previous years, we see more down-to-earth figures reported this year, though next year may be better for Asia-Pacific tech employers. Consulting has had an excellent year, which may well be followed by another, while growth in financial services outpaces the West (as is also the case with overall economic growth). It is the ‘other’ employers that really stood out in 2017, showing that this maturing market is diversifying.
The only slight negative comes from the fact that MBA salary levels have only crept up, with total compensation levels actually suffering a slight dip due to reduced bonus levels. We are, however, nowhere near a crisis.
2017 2016Salary $71,300 $69,300
Total Compensation $85,900 $89,000
QS TopMBA.com Jobs & Salary Trends Report 2018
18
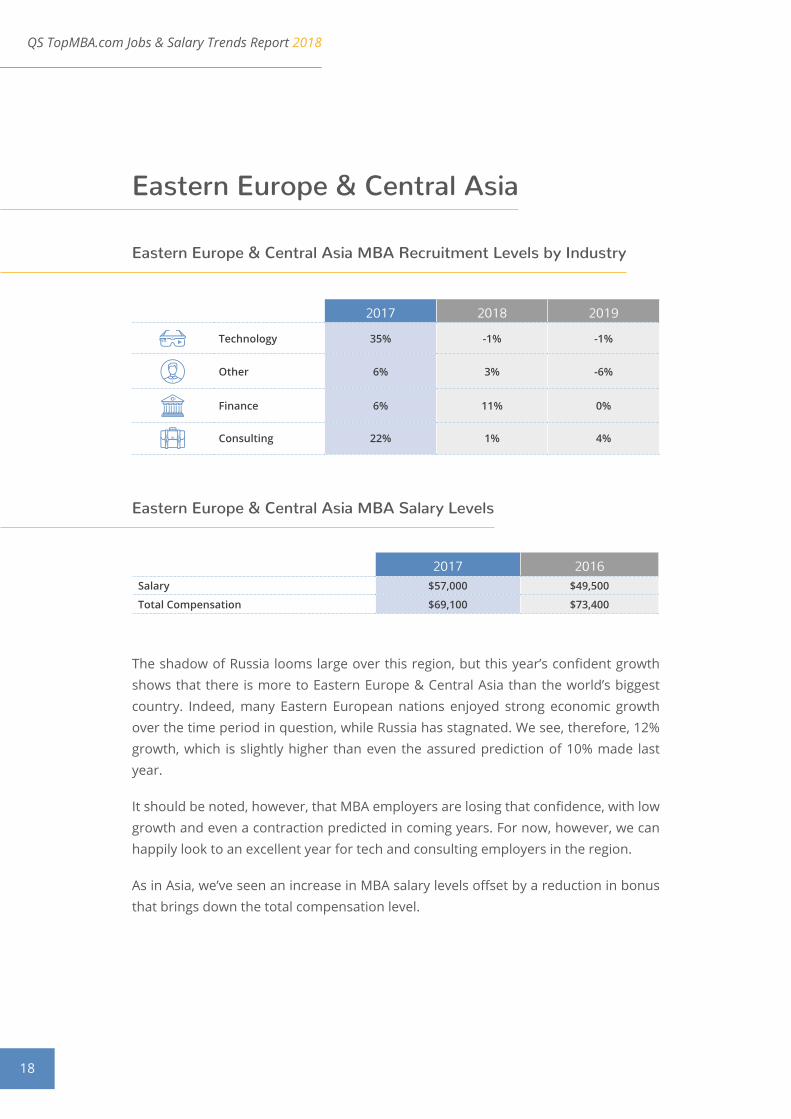
Eastern Europe & Central Asia MBA Salary Levels
Eastern Europe & Central Asia MBA Recruitment Levels by Industry
Eastern Europe & Central Asia
2017 2018 2019
Technology 35% -1% -1%
Other 6% 3% -6%
Finance 6% 11% 0%
Consulting 22% 1% 4%
The shadow of Russia looms large over this region, but this year’s confident growth shows that there is more to Eastern Europe & Central Asia than the world’s biggest country. Indeed, many Eastern European nations enjoyed strong economic growth over the time period in question, while Russia has stagnated. We see, therefore, 12% growth, which is slightly higher than even the assured prediction of 10% made last year.
It should be noted, however, that MBA employers are losing that confidence, with low growth and even a contraction predicted in coming years. For now, however, we can happily look to an excellent year for tech and consulting employers in the region.
As in Asia, we’ve seen an increase in MBA salary levels offset by a reduction in bonus that brings down the total compensation level.
2017 2016Salary $57,000 $49,500
Total Compensation $69,100 $73,400
QS TopMBA.com Jobs & Salary Trends Report 2018
19
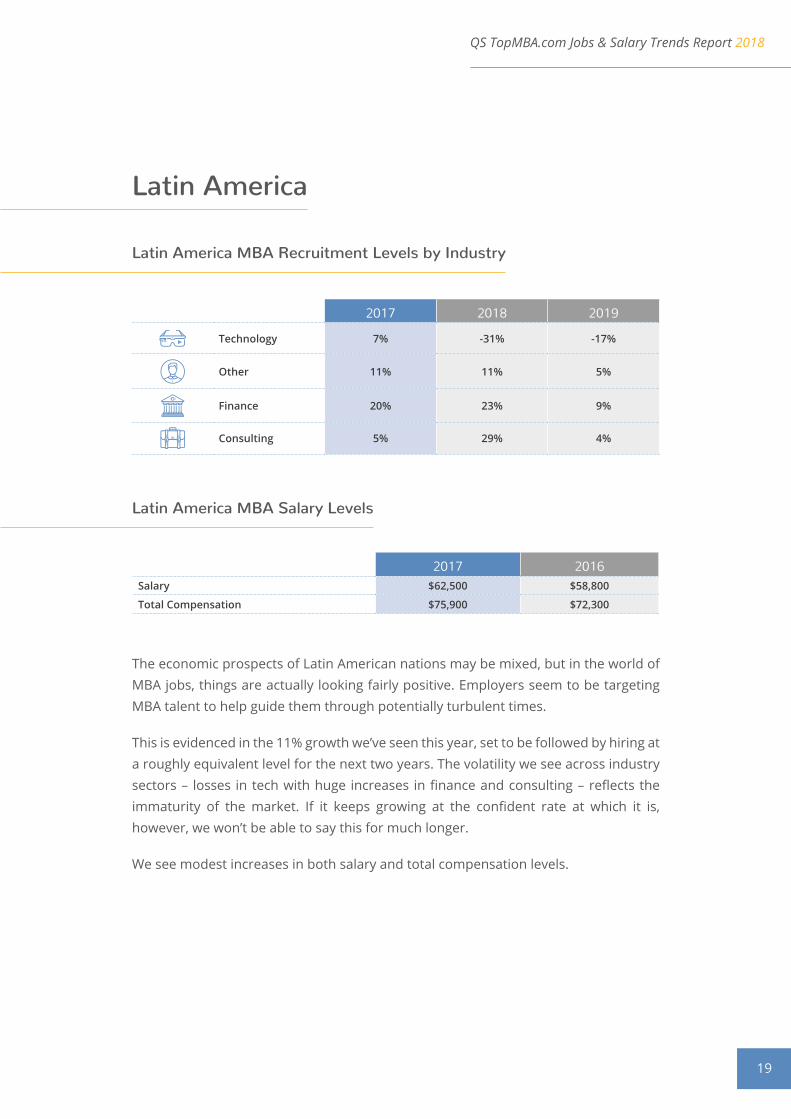
Latin America MBA Salary Levels
Latin America MBA Recruitment Levels by Industry
Latin America
2017 2018 2019
Technology 7% -31% -17%
Other 11% 11% 5%
Finance 20% 23% 9%
Consulting 5% 29% 4%
The economic prospects of Latin American nations may be mixed, but in the world of MBA jobs, things are actually looking fairly positive. Employers seem to be targeting MBA talent to help guide them through potentially turbulent times.
This is evidenced in the 11% growth we’ve seen this year, set to be followed by hiring at a roughly equivalent level for the next two years. The volatility we see across industry sectors – losses in tech with huge increases in finance and consulting – reflects the immaturity of the market. If it keeps growing at the confident rate at which it is, however, we won’t be able to say this for much longer.
We see modest increases in both salary and total compensation levels.
2017 2016Salary $62,500 $58,800
Total Compensation $75,900 $72,300
QS TopMBA.com Jobs & Salary Trends Report 2018
20
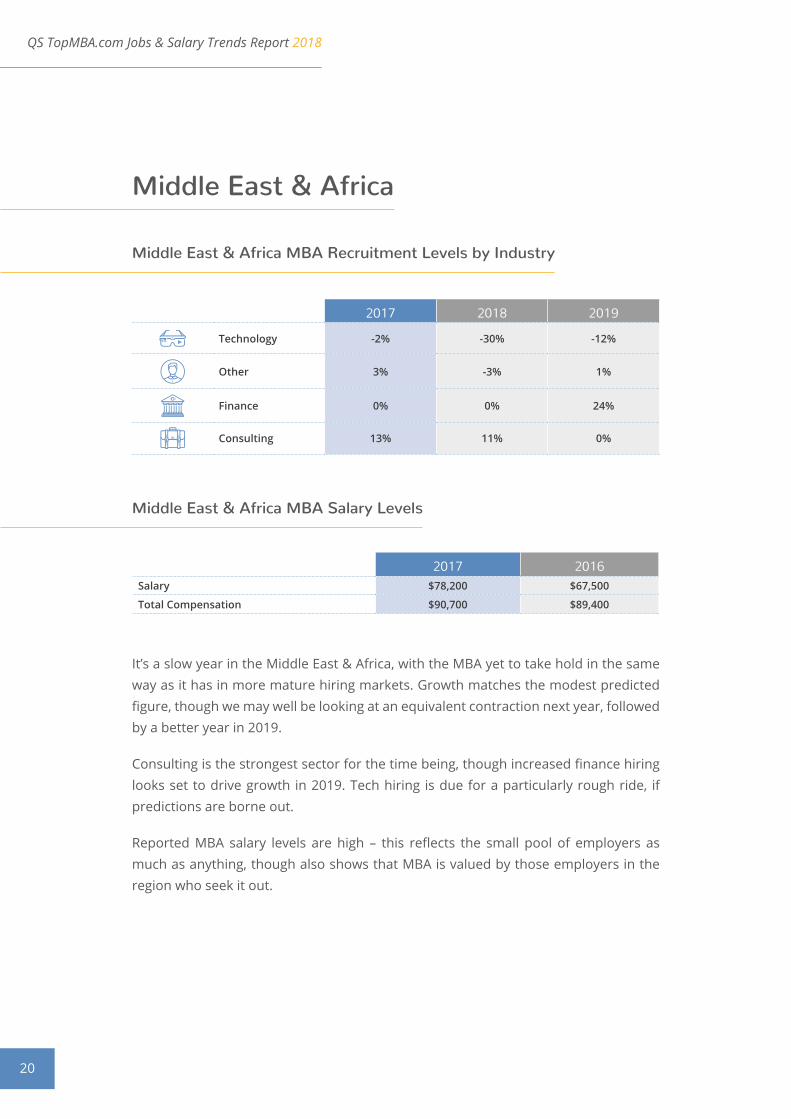
Middle East & Africa MBA Salary Levels
Middle East & Africa MBA Recruitment Levels by Industry
Middle East & Africa
2017 2018 2019
Technology -2% -30% -12%
Other 3% -3% 1%
Finance 0% 0% 24%
Consulting 13% 11% 0%
It’s a slow year in the Middle East & Africa, with the MBA yet to take hold in the same way as it has in more mature hiring markets. Growth matches the modest predicted figure, though we may well be looking at an equivalent contraction next year, followed by a better year in 2019.
Consulting is the strongest sector for the time being, though increased finance hiring looks set to drive growth in 2019. Tech hiring is due for a particularly rough ride, if predictions are borne out.
Reported MBA salary levels are high – this reflects the small pool of employers as much as anything, though also shows that MBA is valued by those employers in the region who seek it out.
2017 2016Salary $78,200 $67,500
Total Compensation $90,700 $89,400
QS TopMBA.com Jobs & Salary Trends Report 2018
21
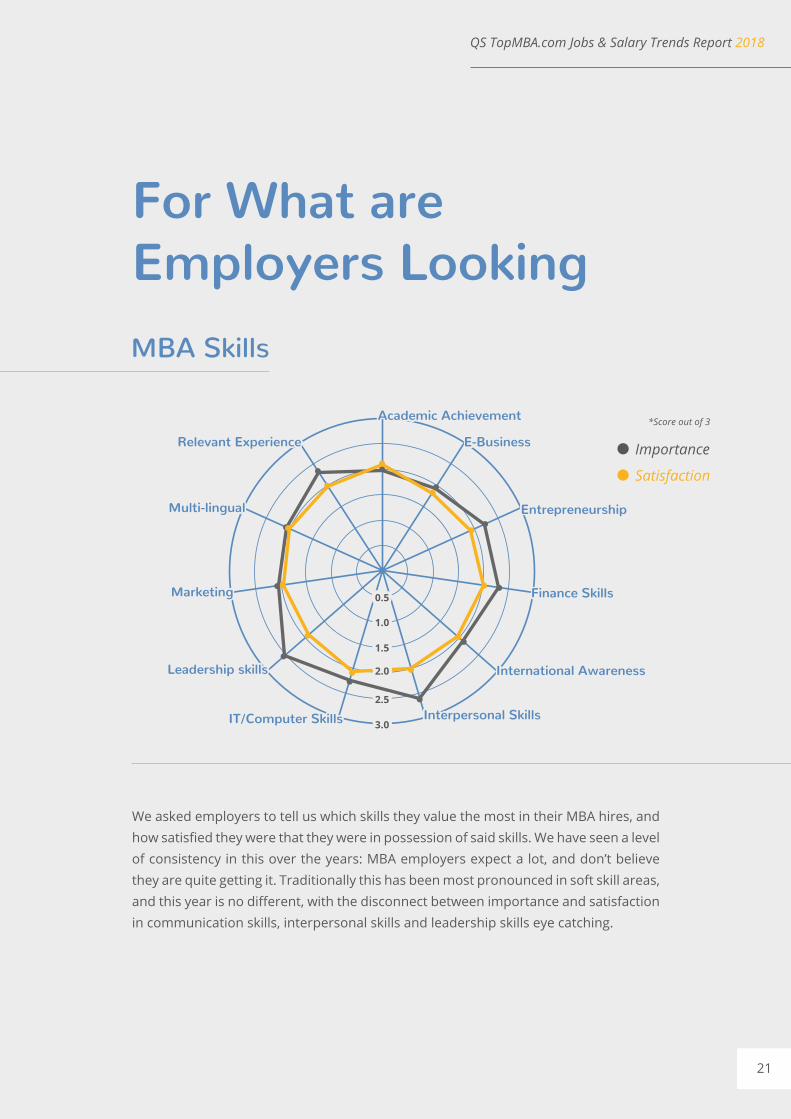
For What are Employers Looking
Importance
Satisfaction
*Score out of 3
MBA Skills
We asked employers to tell us which skills they value the most in their MBA hires, and how satisfied they were that they were in possession of said skills. We have seen a level of consistency in this over the years: MBA employers expect a lot, and don’t believe they are quite getting it. Traditionally this has been most pronounced in soft skill areas, and this year is no different, with the disconnect between importance and satisfaction in communication skills, interpersonal skills and leadership skills eye catching.
0.5
1.0
1.5
2.0
2.5
3.0
Academic Achievement
E-Business
Entrepreneurship
Finance Skills
International Awareness
Interpersonal SkillsIT/Computer Skills
Leadership skills
Marketing
Multi-lingual
Relevant Experience
QS TopMBA.com Jobs & Salary Trends Report 2018
22
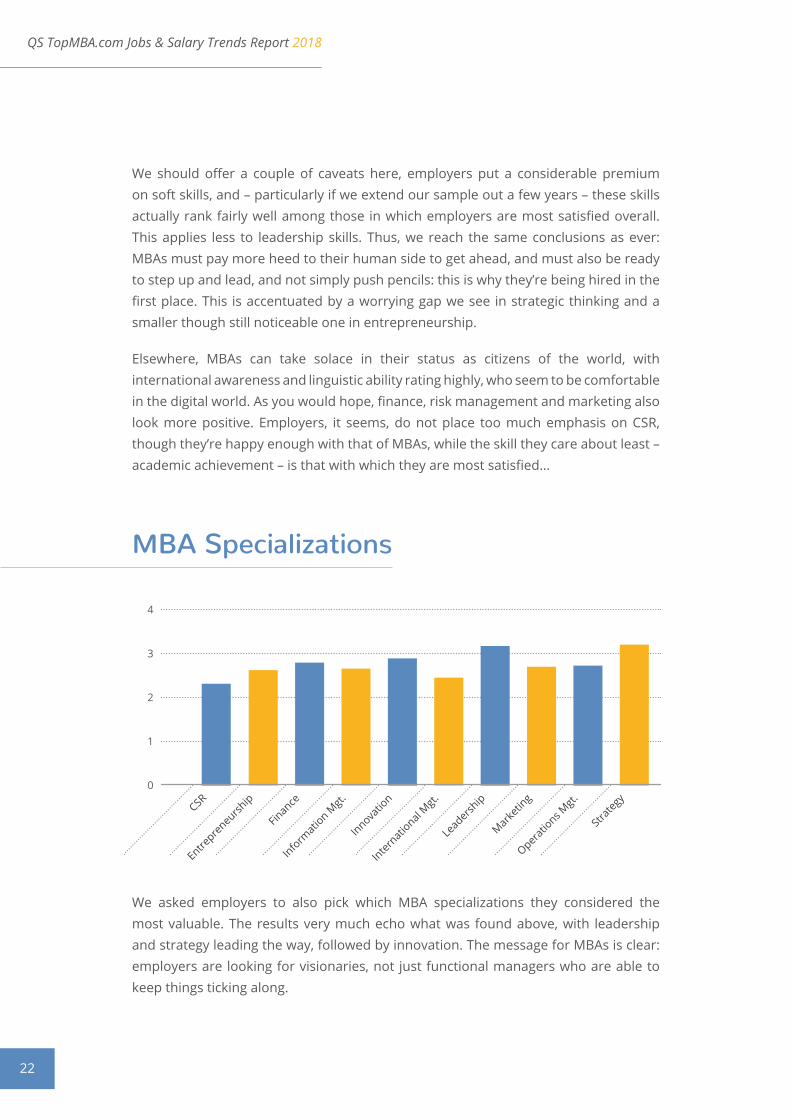
MBA Specializations
We should offer a couple of caveats here, employers put a considerable premium on soft skills, and – particularly if we extend our sample out a few years – these skills actually rank fairly well among those in which employers are most satisfied overall. This applies less to leadership skills. Thus, we reach the same conclusions as ever: MBAs must pay more heed to their human side to get ahead, and must also be ready to step up and lead, and not simply push pencils: this is why they’re being hired in the first place. This is accentuated by a worrying gap we see in strategic thinking and a smaller though still noticeable one in entrepreneurship.
Elsewhere, MBAs can take solace in their status as citizens of the world, with international awareness and linguistic ability rating highly, who seem to be comfortable in the digital world. As you would hope, finance, risk management and marketing also look more positive. Employers, it seems, do not place too much emphasis on CSR, though they’re happy enough with that of MBAs, while the skill they care about least – academic achievement – is that with which they are most satisfied…
We asked employers to also pick which MBA specializations they considered the most valuable. The results very much echo what was found above, with leadership and strategy leading the way, followed by innovation. The message for MBAs is clear: employers are looking for visionaries, not just functional managers who are able to keep things ticking along.
0
1
2
3
4
Entrepre
neurshipCSR
Finance
Inform
ation M
gt.
Innovatio
n
Internatio
nal Mgt.
Leadersh
ip
Marketin
g
Operatio
ns Mgt.
Strategy
QS TopMBA.com Jobs & Salary Trends Report 2018
23
That said, they still also need those with expertise in finance, marketing and operations, to support visionaries. CSR once again registers a low score, as does international management – it may be that these are considered innate enough skills to not warrant a specialization. Interestingly, entrepreneurship registers the next lowest score – perhaps the same applies here.
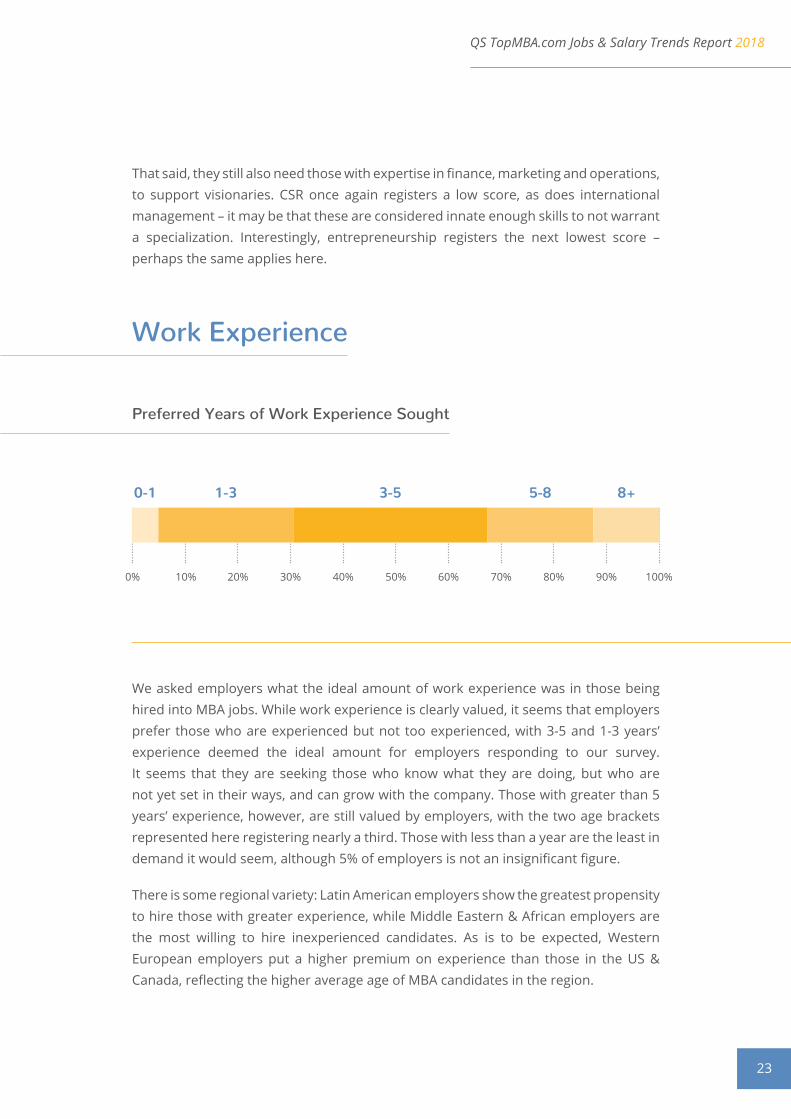
We asked employers what the ideal amount of work experience was in those being hired into MBA jobs. While work experience is clearly valued, it seems that employers prefer those who are experienced but not too experienced, with 3-5 and 1-3 years’ experience deemed the ideal amount for employers responding to our survey. It seems that they are seeking those who know what they are doing, but who are not yet set in their ways, and can grow with the company. Those with greater than 5 years’ experience, however, are still valued by employers, with the two age brackets represented here registering nearly a third. Those with less than a year are the least in demand it would seem, although 5% of employers is not an insignificant figure.
There is some regional variety: Latin American employers show the greatest propensity to hire those with greater experience, while Middle Eastern & African employers are the most willing to hire inexperienced candidates. As is to be expected, Western European employers put a higher premium on experience than those in the US & Canada, reflecting the higher average age of MBA candidates in the region.
Work Experience
Preferred Years of Work Experience Sought
0% 10% 20% 30% 40% 50% 60% 70% 80% 90% 100%
0-1 1-3 3-5 5-8 8+
QS TopMBA.com Jobs & Salary Trends Report 2018
24
Deloitte
PwC
Bain & Company
EY
AXA
Barclays
Morgan Stanley
HSBC Global Asset Management
Infosys
Dell
IBM
Adobe Systems
BBC World Service
Pfizer
Unilever
Diageo
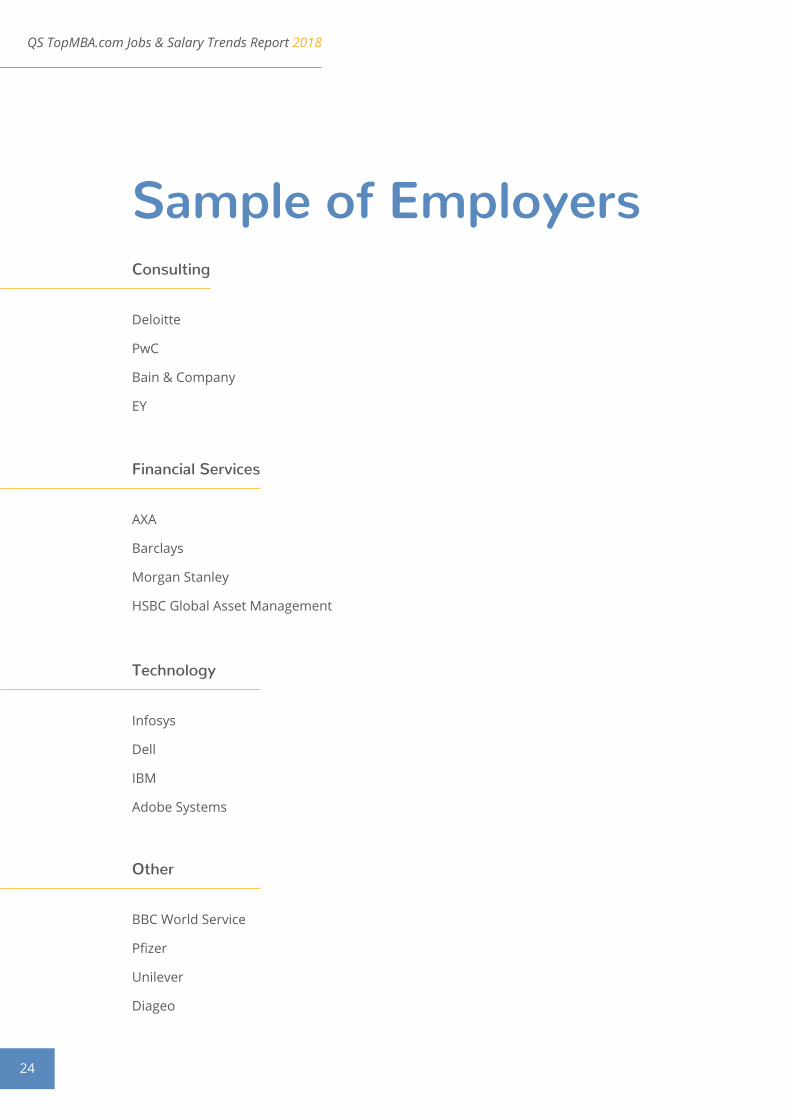
Sample of Employers Consulting
Financial Services
Technology
Other
QS TopMBA.com
2018
JOBS & SALARYTRENDS REPORT