QHSE PERFORMANCE METRICS AND … from QHSE+Focus+Magaz… · QHSE strategic statements, ......
12
QHSE PERFORMANCE METRICS AND IMPROVEMENTS, WHICH PROVIDE BOTTOM-LINE BENEFITS BY FORREST W. BREYFOGLE III This is how QHSE does really enhance business!
Transcript of QHSE PERFORMANCE METRICS AND … from QHSE+Focus+Magaz… · QHSE strategic statements, ......

QHSE PERFORMANCE METRICS AND
IMPROVEMENTS, WHICH PROVIDE BOTTOM-LINE
BENEFITSBY FORREST W. BREYFOGLE III
This is how QHSE does really enhance business!
18

QHSE PERFORMANCE METRICS AND IMPROVEMENTS, WHICH
PROVIDE BOTTOM-LINE BENEFITS
FORREST W. BREYFOGLE III
Often work in the Quality, Health, Safety, and Environment functions are not appreciated relative to an overall organization’s �����������Businesses may have QHSE strategic statements, but these often good-sounding directives can become silo activities that lose out in their
performance measurements. Linkage �����������������������������������that can be achieved from improving QHSE performance metrics. This article will use environmental issues that are generally associated with the “GreenInitiatives” to illustrate the concepts; however, the methodology applies equally to other QHSE functions.
Green InitiativesWhy is Green Important?• It is the right thing to do.• ~����������������� ����• Improves the future.• Helps business success. The fourth bullet is the one that can be the largest concern for organizations. If there is not�������������������������������������� ����tougher to implement.
We have all seen organizations state a position that they will be undertaking Green initiatives.
.. will become a leader in Green procurement.• To achieve carbon neutrality.• To engender a “spirit of sustainability”….• To raise environmental sustainability
management levels through unique management systems.
Vision statements are brief, catchy inspirational, and believable. These ��� ������������������������������
FORREST W. BREYFOGLE III
CEO and President Smarter Solutions, Inc smartersolutions.com
execution to more pressing day-to-day priorities.
Of the four QHSE components, Quality, Health, and Safety problems can have ��������"�������������������������������������this relationship for the environmental component of QHSE is often not as apparent. Many businesses treat efforts in the environmental function as marketing and image factors that are of a minor importance to the bottom line.
This article will illustrate a methodology where QHSE functions, especially environmental activities, can be systematically integrated with other business functions in both operation procedures and their
19

(�������� ������������������������������Strategies are an integrated overarching concept of how the business will meet its objectives.
#��������������������������������������� �an organizational strategy?
• Drives Sales (revenue) up. • Reduces operating costs.• Reduces inventory.• Improves employee loyalty.
What is needed is a system that introduces Green Initiatives that are positive or neutral ���������������������������������������inventory, and employee loyalty, while improving the environmental and other Green impacts from the organization.
However, organizations often list possible Green initiatives being adopted by other organizations and pick the ones they would like to do. Others can be more successful when they look for Green initiatives that align with their organizational performance will include the ��� ������������ �������������������<������ �����+�������������������������������������initiatives.
Alignment of Green within Organizational Structure A system for creating Green alignment with other organizational needs is Integrated Enterprise Excellence (IEE) as described in Figure 1.
(����������������������@jj����������management are:
1. =���������������������2. Measure performance in key functions3. Assess performance for weakness4. j�������������������5. Identify strategies to improve performance6. and more…….
Let’s assume that the organizational mission and vision (step 1) is adequate. An organizational IEE value chain diagram <�����+���������������� ������������measures of success (satellite metrics) and businessfunctions, where every function has ��������������� ����� ��������(30,000-ft-level metrics). An example IEE value chain is shown in Figure 2, where the rectangular boxes contain organizational functions and the oblong boxes the metrics that are to be tracked relative to quality cost and time for the functions.
INTEGRATED ENTERPRISE EXCELLENCE VIDEO
20

Develop Product Market Product Sell Product Produce &
Deliver Product
Invoice and Collect
Payment
Report Financials
Information Technology
(IT)
Human Relations (HR)
Enterprise Process
Management (EPM)
Days Sales Outstanding
(DSO)
Percent Annualized
Gain in Gross Revenue
Gross Revenue
Defective Rate
Lead Time
Developed Product Design
Quality
Product Development
Lead Time
Work in Process (WIP)
On-time Delivery
Voice of the Customer
(VOC)
Labor Relations Safety and
Environment
Legal Finance
Quote Quality
RFQ Response Acceptance
Rate
Internal Process Reworks
Product Margins
Quote Response
Time
TOC Throughput
Net Profit Margins
Existing Customer Additions
New Customer Additions
Timely Inputs
Effective Inputs
Learning and Growth
From Figure 7.1 Integrated Enterprise Excellence Volume II – Business Deployment: A Leaders’ Guide for Going Beyond Lean Six Sigma and the Balanced Scorecard, Bridgeway Books/Citius Publishing, 2008
Figure 2
1. Describe vision and mission.
2. Describe value chain, including satellite-level and
30,000-foot-level metrics.
3. Analyze enterprise.
4. Establish SMART
satellite-levelmetric goals.
5. Create strategies.
6. Identify high potential improvement
areas and establish related SMART 30,000-foot-level metric goals.
7. Identify and executeprojects.
8. Assess project's completion impact on enterprise goals
9. Maintain the gain.
From Figure 4.7 Integrated Enterprise Excellence Volume II - Business Deployment: A Leaders’ Guide for Going Beyond Lean Six Sigma and the Balanced Scorecard, Bridgeway Books/CitiusPublishing, 2008
Figure 1
21
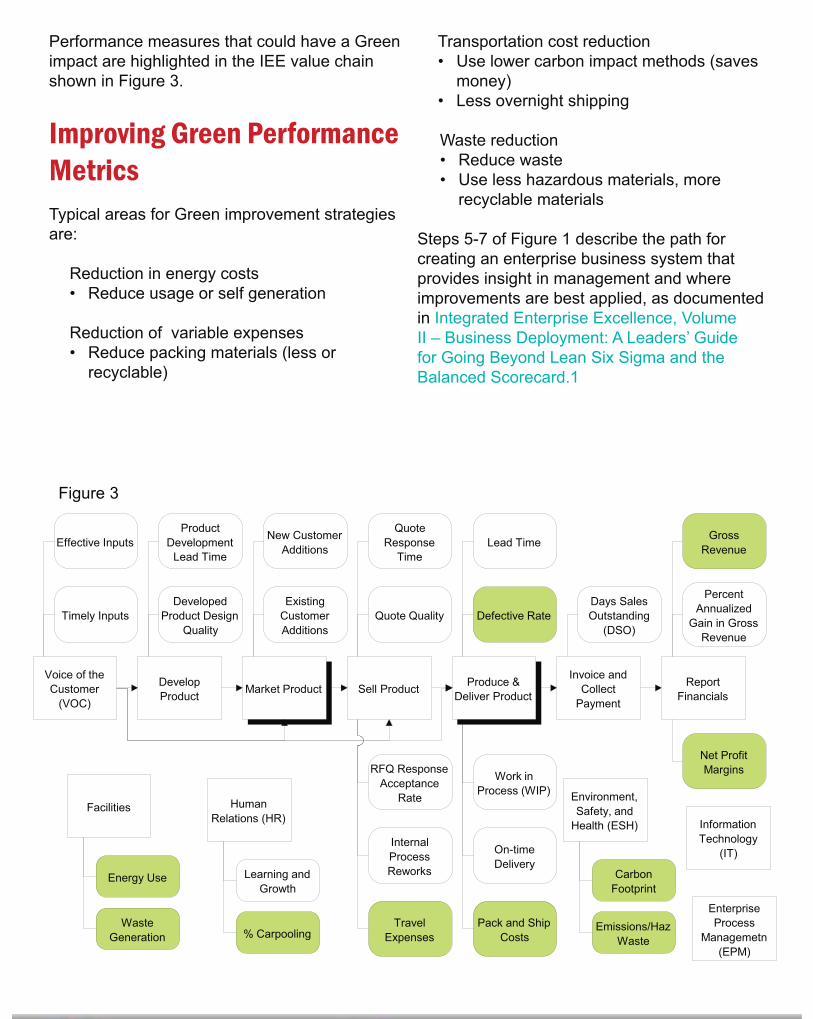
Transportation cost reduction• Use lower carbon impact methods (saves
money)• Less overnight shipping
Waste reduction• Reduce waste• Use less hazardous materials, more
recyclable materials
Steps 5-7 of Figure 1 describe the path for creating an enterprise business system that provides insight in management and where improvements are best applied, as documented in Integrated Enterprise Excellence, Volume II – Business Deployment: A Leaders’ Guide for Going Beyond Lean Six Sigma and the Balanced Scorecard.1
Performance measures that could have a Green impact are highlighted in the IEE value chain shown in Figure 3.
Improving Green Performance MetricsTypical areas for Green improvement strategies are:
Reduction in energy costs• Reduce usage or self generation
Reduction of variable expenses• Reduce packing materials (less or
recyclable)
Develop Product Market Product Sell Product Produce &
Deliver Product
Invoice and Collect
Payment
Report Financials
Information Technology
(IT)
Days Sales Outstanding
(DSO)
Percent Annualized
Gain in Gross Revenue
Gross Revenue
Defective Rate
Lead Time
Developed Product Design
Quality
Product Development
Lead Time
Work in Process (WIP)
On-time Delivery
Voice of the Customer
(VOC)
Facilities
Enterprise Process
Managemetn (EPM)
Quote Quality
RFQ Response Acceptance
Rate
Internal Process Reworks
Travel Expenses
Quote Response
Time
Pack and Ship Costs
Net Profit Margins
Existing Customer Additions
New Customer Additions
Timely Inputs
Effective Inputs
Energy Use
Waste Generation
Human Relations (HR)
Learning and Growth
% Carpooling
Environment, Safety, and
Health (ESH)
Carbon Footprint
Emissions/Haz Waste
Figure 3
22

Application ExampleLet now illustrate application of the described @jj������������������ �� �������������� �
• Step 1 of Figure 1Mission: Produce plastic injection molded items for consumer use.
Vision: Become a preferred, Green supplier for all major department store chains (have a branded display section in stores).
• Step 2 of Figure 1Create a Value chain with satellite and 30,000-ft-level metrics.
Focus will now be given to where the impact of Green initiatives can best be recognized �����������������������������������������value chain shown in Figure 4.
With the IEE system, performance satellite and 30,000-foot-level metrics2 are assessed for statistical stability. Performance measurements that have a recent region of stability are said to predictable. If a process is predictable, the next question would be: What is predicted?
For continuous satellite-level and 30,000-foot-level metric data, a probability plot of the raw data from the recent region of stability can provide a prediction statement, as shown in Figure 5. For this illustration, the prediction statement for the stable ������������� ������� ��������������� ������ ���������� ���������)���������80% of the months between 10.4% and 17.4%.
Figure 4
Develop Product Market Product Sell Product Produce &
Deliver Product
Invoice and Collect
Payment
Report Financials
Information Technology
(IT)
Days Sales Outstanding
(DSO)
Percent Annualized
Gain in Gross Revenue
Gross Revenue
Defective Rate
Lead Time
Developed Product Design
Quality
Product Development
Lead Time
Work in Process (WIP)
On-time Delivery
Voice of the Customer
(VOC)
Facilities
Enterprise Process
Managemetn (EPM)
Quote Quality
RFQ Response Acceptance
Rate
Internal Process Reworks
Travel Expenses
Quote Response
Time
Pack and Ship Costs
Net Profit Margins
Existing Customer Additions
New Customer Additions
Timely Inputs
Effective Inputs
Energy Use
Waste Generation
Human Relations (HR)
Learning and Growth
% Carpooling
Environment, Safety, and
Health (ESH)
Carbon Footprint
Emissions/Haz Waste
23

Step 3 of Figure 1Let’s now examine the green-metric 30,000-foot-level defective rate for the function "produce and deliver product," as shown in Figure 4. For attribute 30,000-foot-level metrics, the centerline of a stable process that has a consistent
subgroup size is a measure of process performance.2 Defect rates impact Green objectives through, for example, the creation of waste, additional processing, and additional shipping return of defective units. Reducing ���������������� ������������������������through the reduction of operating cost.
Continue next page…
Figure 5
IEE Scorecard for Profit Margins
The process is predictableThe est. median is 13.940 with 80% of the occurrences from 10.426 to 17.454
201510
99
95
80
50
20
5
1
Process values
Per
cent
.
90
50
.
10
25
20
15
10
5
Month
_
X=13.94
UCL=23.24
LCL=4.64
Probability plotNormal
I-chart
P-Value 0.946AD 0.159N 42StDev 2.742Mean 13.94
Indi
vidu
al V
alue
10.4
3
13.9
4
17.4
5
24

QHSE PERFORMANCE METRICS AND IMPROVEMENTS, WHICH PROVIDE
BOTTOM-LINE BENEFITS
IEE Scorecard of Defective Rate
The process is predictable since the last process change.The estimated capability is a 5.01 percent defective rate.
1361211069176614631161
8
7
6
5
4
3
Day
_
X=5.010
UCL=6.755
LCL=3.264
1 2 I-chart
Def
ectiv
e Ra
te
Frequency Of Occurrence 0.31 0.25 0.12 0.10 0.10 0.05 0.04 0.03
Percent 31.0 25.0 12.0 10.0 10.0 5.0 4.0 3.0
Cum % 31.0 56.0 68.0 78.0 88.0 93.0 97.0 100.0
Defect type OtherType 7Type 6Type 5Type 1Type 2Type 4Type 3
1.0
0.8
0.6
0.4
0.2
0.0
100
80
60
40
20
0
Pareto Chart of Defect type
Perc
ent
Freq
uenc
y of
Occ
urre
nce
Figure 6
25
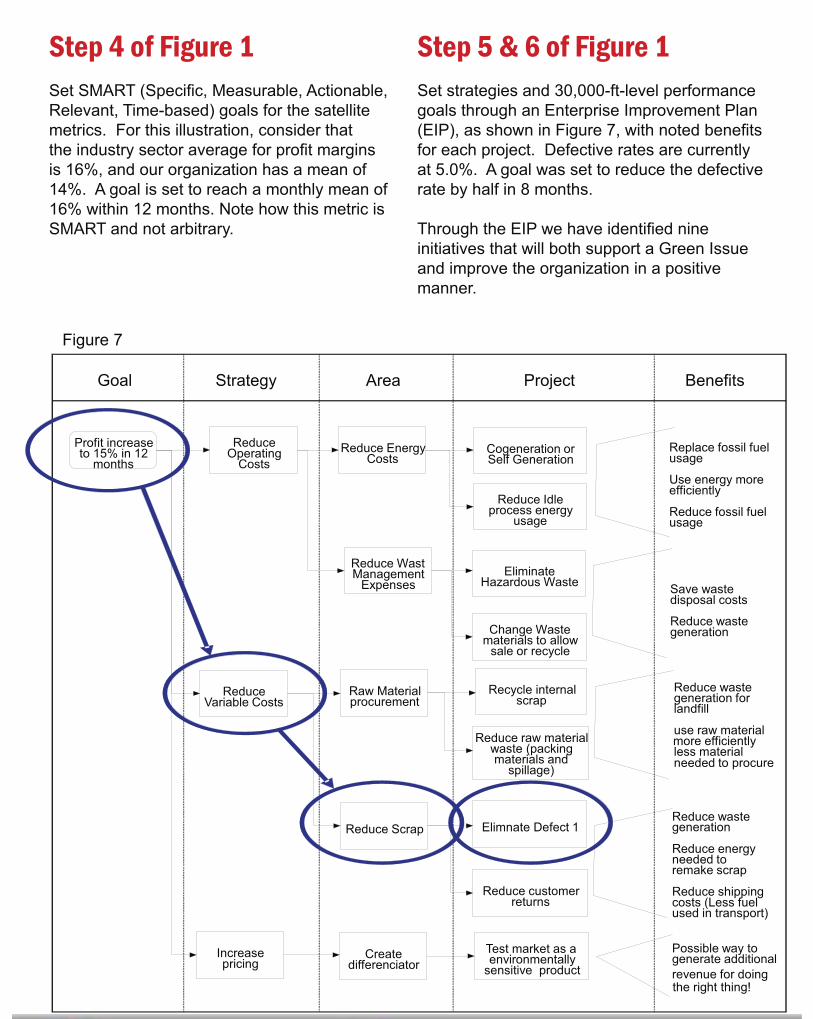
Step 4 of Figure 1����`�$(�<���������`��������������������Relevant, Time-based) goals for the satellite metrics. For this illustration, consider that ���������������������������������� �������is 16%, and our organization has a mean of 14%. A goal is set to reach a monthly mean of 16% within 12 months. Note how this metric is SMART and not arbitrary.
Step 5 & 6 of Figure 1Set strategies and 30,000-ft-level performance goals through an Enterprise Improvement Plan <j@Z+��������������/�������������������������for each project. Defective rates are currently at 5.0%. A goal was set to reduce the defective rate by half in 8 months.
(����������j@Z�����������������������initiatives that will both support a Green Issue and improve the organization in a positive manner.
Goal Strategy Area Project Benefits
Profit increase to 15% in 12
months
Reduce Operating
Costs
Increase pricing
Reduce Variable Costs
Reduce Energy Costs
Reduce Wast Management
Expenses
Create differenciator
Raw Material procurement
Cogeneration or Self Generation
Reduce Idle process energy
usage
Reduce Scrap
Eliminate Hazardous Waste
Change Waste materials to allow
sale or recycle
Elimnate Defect 1
Reduce customer returns
Recycle internal scrap
Reduce raw material waste (packing materials and
spillage)
Test market as a environmentally
sensitive product
Replace fossil fuel usage
Use energy more efficiently
Reduce fossil fuel usage
Save waste disposal costs
Reduce waste generation
Reduce waste generation for landfill
use raw materialmore efficiently less material needed to procure
Reduce waste generation
Reduce energy needed to remake scrap
Reduce shipping costs (Less fuel used in transport)
Possible way to generate additionalrevenue for doing the right thing!
Figure 7
26

• Step 7 of Figure 1Execute the improvement project using the most appropriate approach:
• Lean Six Sigma process improvement techniques to address common-cause or special-cause problems.
• Root cause analysis when a clear special cause exists.
• Plan-do-check-act (PDCA) continuous improvement process when targeting a series of small incremental changes that could lead to improvement.
• Just go do it, for the obvious changes.
• Step 8 of Figure 1Monitor the impact on the organization. If the amount of improvement is not considered large enough, the enterprise will be analyzed for additional opportunities.
Figure 8 indicates that improvements were made to the defective rate. Figure 9 describes how the projects’ bottom-line improvement ������������������)��� ������ ����������margin was achieved within the twelve-month time-frame objective.
Figure 8
IEE Scorecard for Defective Rate
The process is predictable since the last change The estimated capability is a 2.613 percent defective rate.
1451291139781654933171
8
7
6
5
4
3
2
1
0
Day
Def
ecti
veR
ate
_X=2.613
UCL=4.873
LCL=0.353
Improved Add. Imp.Original
I-chart
27

• Step 9 Maintain the gains and continue executing the IEE business system to continue improving!
Summary
With the described approach, the following was done:
• Green target areas were not selected based on strategies grounded on intuition or emotion. Areas were selected that would ������������������
• Business performance was base-lined so that it could assess the impact of any changes.
• Strategies were set after measuring performance.
Through the described IEE approach, the environment was improved without risk to the business, noting again that a similar approach could be applied in other QHSE areas.
References
1. Integrated Enterprise Excellence Volume II - Business Deployment: A Leaders’ Guide for Going Beyond Lean Six Sigma and the Balanced Scorecard, Forrest W. Breyfogle III, Bridgeway Books/Citius Publishing, Austin, TX 2008.
2. Integrated Enterprise Excellence Volume III - Improvement Project Execution: A Management and Black Belt Guide for Going Beyond Lean Six Sigma and the Balanced Scorecard, Forrest W. Breyfogle III, Bridgeway Books/Citius Publishing, Austin, TX, 2008
3. Figures were created in this document using Enterprise Performance Reporting System (EPRS) software
Figure 9
IEE Scorecard for Profit Margins
The process is predictable since the last process change.The est. median is 16.366 with 80% of the occurrences from 14.290 to 18.443
2018161412
99
95
80
50
20
5
1
Process values
90
50
10
25
20
15
10
5
Month
_
X=16.37
UCL=22.12
LCL=10.62
1.0 2.0 Probability plotNormal
I-chart
P-Value 0.174AD 0.479N 9StDev 1.620Mean 13.94
Prof
it M
argi
n
28

Connectwith us
Likeus
Followus
Think we could do any better? With your help we’d definitely do better!
Looking forward to hearing your opinion about our magazine and suggestions for improvement!
Email us at: [email protected]
About Forrest W. Breyfogle III:
CEO and President of Smarter Solutions Inc.,www.smartersolutions.com.Forrest W. Breyfogle III is the creator of the Integrated Enterprise Excellence (IEE) management system, which takes lean SixSigma and the balanced scorecard to the next level. A professional engineer, he is an ASQ fellow who has served on the board of advisors for the
University of Texas Center for Performing Excellence. He received the 2004 Crosby Medal for his book, Implementing Six Sigma. In 2011, Mr. Breyfogle was selected by Quality Magazine to be Quality Professional of the year. In 2012, Missouri University of Science and Technology presented Forrest with its alumni achievement award. E-mail him at [email protected].
QHSE Focus��������
We are Social Friendly!
We are ReaderOriented!
29