QFD notes 2007 · PDF file · 2007-03-02QUALITY FUNCTION DEPLOYMENT 1 ©Warwick...
67
WARWICK MANUFACTURING GROUP Product Excellence using Six Sigma Q Q u u a a l l i i t t y y F F u u n n c c t t i i o o n n D D e e p p l l o o y y m m e e n n t t Section 6 6
Transcript of QFD notes 2007 · PDF file · 2007-03-02QUALITY FUNCTION DEPLOYMENT 1 ©Warwick...
WARWICK MANUFACTURING GROUP Product Excellence using Six Sigma
QQuuaalliittyy FFuunnccttiioonn
DDeeppllooyymmeenntt
SSeeccttiioonn
66

P R O D U C T E X C E L L E N C E U S I N G S I X S I G M A
Quality Function Deployment
© Warwick Manufacturing Group School of Engineering
University of Warwick, Coventry, CV4 7AL, UK Phone +44 (0)24 7652 4240 • Fax +44 (0)24 7652 4307
e-mail [email protected]
Q U A L I T Y F U N C T I O N D E P L O Y M E N T
Table of Contents Introduction 1
What is QFD?......................................................................1 Scope of QFD......................................................................1 Who Uses QFD?..................................................................2 The Purpose of QFD...........................................................2 The System..........................................................................2
The Customer Requirements 6 The Customer Chain...........................................................6 Example ...................................................................................................................... 6 WARNING: Internal Customers ........................................7 Example ...................................................................................................................... 7 What is Meant by ‘Customer’? ............................................7 Obtaining Customer Requirements....................................7 Postal Questionnaires ............................................................................................... 8 Telephone Interviews ............................................................................................... 8 Face-to-face Interviews ............................................................................................ 9 Clinics .......................................................................................................................... 9 Focus Groups............................................................................................................. 9 Listening...................................................................................................................... 9
Technical And Regulatory Requirements 12 Organising Customer Requirements 12
The Process of Organisation............................................. 13 Entering the Customer Requirements onto the QFD Chart........................... 16
Establishing Customer Importance Ratings & Customer Competitive Comparisons 19
Example Questionnaire .................................................... 19 Entering on the QFD chart............................................... 21
Customer Complaint History 25 Establishing Priorities 27 Establish Engineering Characteristics 30 Technical Competitive Comparisons 35
Aircraft Seat Study .............................................................35 Other Sources of Data .......................................................38
Establishing Links 41 Relationships Matrix .........................................................41 Conflicts Matrix.................................................................43
Establishing technical targets and ratings 47 Engineering Targets .........................................................47 Degree of Technical Difficulty..........................................50
Engineering Characteristic Importance Rating 52 Analysing The QFD Chart 55 Next Steps 61
Q U A L I T Y F U N C T I O N D E P L O Y M E N T
Table of Figures Figure 1. The QFD chart. ...................................................................................................................4 Figure 2. Gathering and organizing customer requirements..........................................................5 Figure 3. Technical & regulatory requirements..............................................................................11 Figure 4. Aircraft seat example of organizing customer requirements. ......................................15 Figure 5. Aircraft seat customer requirements continued. ...........................................................16 Figure 6. Customer and technical & regulatory requirements. ....................................................17 Figure 7. Customer importance ratings and competitive comparisons. .....................................18 Figure 8. Example questionnaire......................................................................................................20 Figure 9. Distribution of importance points. .................................................................................22 Figure 10. Customer importanca ratings and comparisons..........................................................23 Figure 11. Customer complaint history...........................................................................................24 Figure 12. Customer complaint history...........................................................................................26 Figure 13. Customer priorities. .........................................................................................................28 Figure 14. Engineering characteristics. ............................................................................................29 Figure 15. Engineering characteristics - aircraft seat example. ....................................................33 Figure 16. Technical competitive comparisons..............................................................................34 Figure 17. Technical competitive comparisons - aircraft seat example. .....................................37 Figure 18. Other sources of technical data. ....................................................................................39 Figure 19. Establishing links. ............................................................................................................40 Figure 20. Establishing links relationship matrix. ..........................................................................42 Figure 21. Establishing links - correlation matrix ..........................................................................44 Figure 22. Technical targets and ratings..........................................................................................46 Figure 23. Establishing engineering targets. ...................................................................................49 Figure 24. Establishing degree of technical difficulty. ..................................................................51 Figure 25. Engineering characteristics importance ratings. ..........................................................53 Figure 26. Analysing the QFD chart. ..............................................................................................54 Figure 27. Analysing the chart for strong relationships. ...............................................................57 Figure 28. Analysing the chart for whene we hold the lead. ........................................................58 Figure 29. Analysing the chart for where we can gain competitive advantage..........................59 Figure 30. Analysing the chart for where we lag and must improve...........................................60
Q U A L I T Y F U N C T I O N D E P L O Y M E N T
1 ©Warwick Manufacturing Group Revision date: January 07
QQUUAALLIITTYY FFUUNNCCTTIIOONN DDEEPPLLOOYYMMEENNTT
Introduction What is QFD? QFD is a system for designing a product or service based on customer demands that involves all members of the producer or supplier organisation. In Japanese, ‘deployment’ refers to an extension or broadening of activities and hence ‘Quality Function Deployment’ means the responsibilities for producing a quality item must be assigned to all parts of a corporation. It is sometimes referred to as the most advanced form of Total Quality Control, Japanese style. The system can be understood by defining each of the terms in ‘Quality Function Deployment’ within the context of QFD.
• Quality - Meeting Customer Requirements
• Function - What Must Be Done - Focusing the attention
• Deployment - Who Will Do It, When
Scope of QFD QFD theory started in 1972 at Mitsubishi’s Kobe Shipyard when they began using a matrix that put customer demands on the vertical axis and the methods by which they would be met on the horizontal axis. This was recognised almost immediately as a major breakthrough. Since that time the Japanese have developed the system to encompass other areas of a secondary nature such as improved communications between the design and manufacturing departments, considering the function of the product, potential failure modes, possible new technologies and cost reduction. This course however, will consider in the main a primary level QFD study, but will refer to the secondary and continuing levels in the final sections.
SSeeccttiioonn
66
Q U A L I T Y F U N C T I O N D E P L O Y M E N T
2 ©Warwick Manufacturing Group Revision date: January 07
Who Uses QFD? Current Japanese users of QFD concepts include Nissan, Toyota, Komatsu, Nippondenso and Honda. In the United States of America users include Ford, GM, Chrysler, DEC, TI, 3M, HP, AT&T Bell Labs, NovAtel, Xerox, Exxon and Dow.
The Purpose of QFD The purpose of QFD is three fold. Firstly, it allows us to get higher quality products to market faster and at a lower cost. Secondly, we will achieve customer driven product design and, finally, it will provide a tracking system for future design or process improvements.
The results we can expect by carrying out the QFD studies are many:
• Better understanding of customer needs
• Improved organisation on development projects
• Improved introduction to production
• Fewer design changes late in development
• Fewer manufacturing start-up problems
• Reputation for being serious about quality
• Increased business
• Documented product definition based on customer requirements
The System QFD achieves these results by breaking down customer requirements into segments and identifing means for achieving each segment. QFD also involves all parts of a company and facilitates simultaneous product and process design. Finally, it integrates the use of other quality tools such as Taguchi Methods.
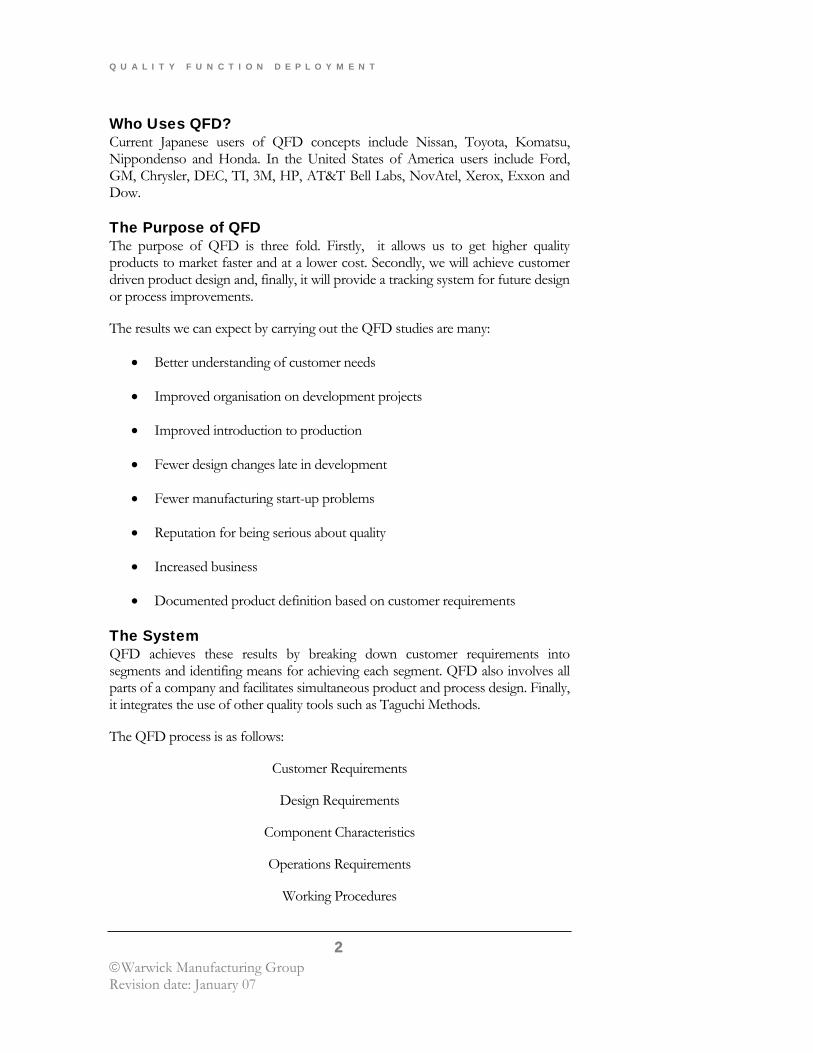
The QFD process is as follows:
Customer Requirements
Design Requirements
Component Characteristics
Operations Requirements
Working Procedures

Q U A L I T Y F U N C T I O N D E P L O Y M E N T
3 ©Warwick Manufacturing Group Revision date: January 07
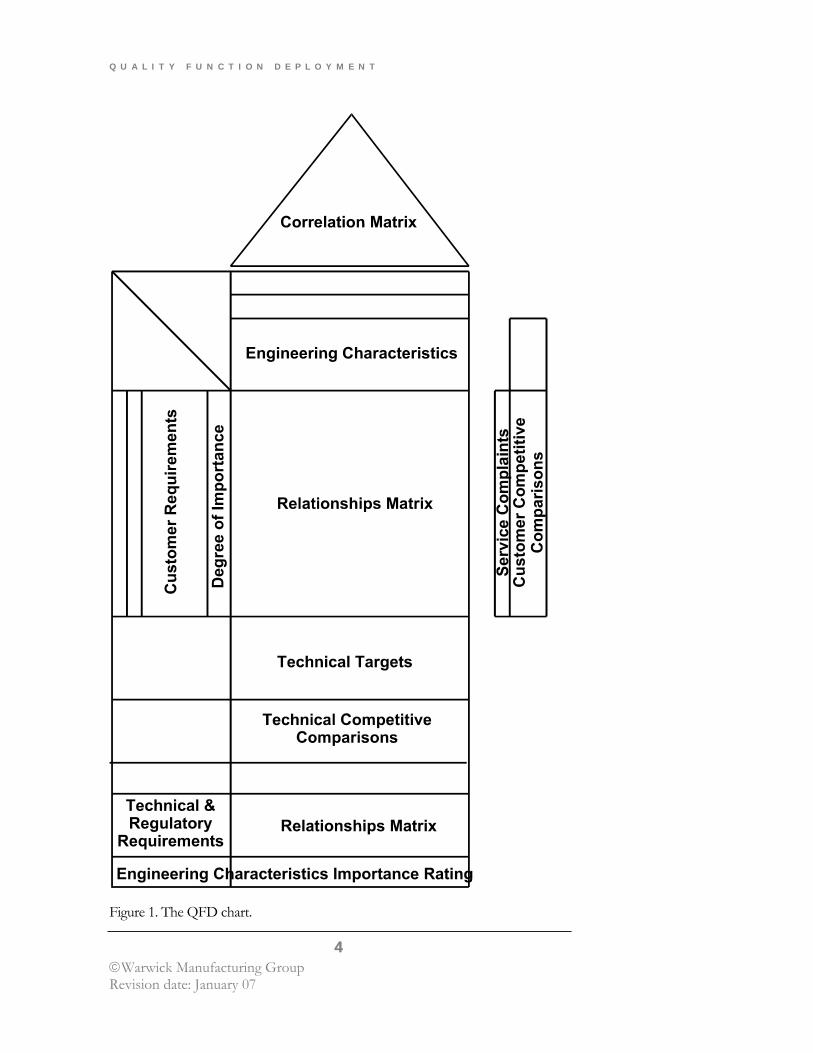
This process begins with the first level QFD chart, a schematic of which is shown overleaf. The following sections of these course notes will now unfold the process of gathering information, entering it on the chart and analysing it.
Q U A L I T Y F U N C T I O N D E P L O Y M E N T
4 ©Warwick Manufacturing Group Revision date: January 07
Figure 1. The QFD chart.
Q U A L I T Y F U N C T I O N D E P L O Y M E N T
5 ©Warwick Manufacturing Group Revision date: January 07
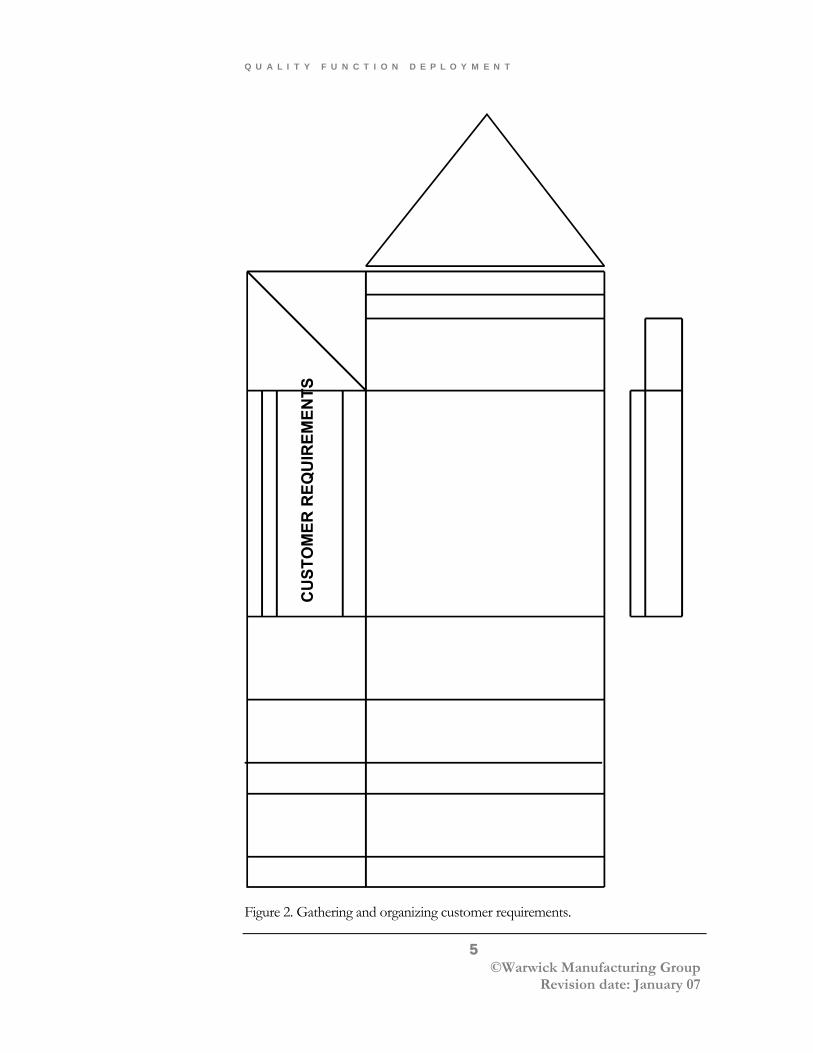
Figure 2. Gathering and organizing customer requirements.
Q U A L I T Y F U N C T I O N D E P L O Y M E N T
6 ©Warwick Manufacturing Group Revision date: January 07
The Customer Requirements In order for any company to stay in business they must sell their products/services and be able to rely on repeat business. This can only be done with a backbone of continual satisfaction on behalf of the customer. In turn, customer satisfaction can only be achieved if we can fulfill the customers’ requirements. Hence, the gathering and use of customer requirements is the foundation of QFD.
It follows, therefore, that the first area that must be understood in QFD is that of customer requirements. As QFD is a technique for translating the customer requirements into a product design, we must be able to gather these requirements. It is essential, however, that the requirements we gather are the true customer requirements. We as engineers and managers are so close to our product that our level of expectation and our values are far removed from the average customer. Hence, we cannot speak for today’s customers.
In order to understand the area of customer requirements we must understand three distinct factors:
• The Customer Chain
• What do we mean by ‘Customer’ in QFD
• Obtaining Customer Requirements
The Customer Chain It is necessary in order to obtain as full a picture as possible that we understand who our customer actually is. For some businesses we may only have one or two types of customer, but for the majority of today’s businesses there will be a chain of customers. This raises the question, what do we mean by a customer chain? By customer chain we mean that for a simple product there could be more than one customer. For a simple product the chain may be short i.e. an owner, an operator and a user. The examples below show simple chains but it is conceivable that they could become much longer and more complex.
Example Manufacturer’s Product Customer
Breakfast Cereal Supermarket - Parent who buys - Child who eats
Aircraft Seat Aircraft Manufacturer - Aircraft lease company - Airline - Passenger
If a company has a very complex customer chain it is possible to use a system for its identification similar to that used for supplier chain analysis. The system for customer chain analysis involves simply identifying who is the company’s
Q U A L I T Y F U N C T I O N D E P L O Y M E N T
7 ©Warwick Manufacturing Group Revision date: January 07
immediate customer and who is the end user. Thus, by asking questions of each it is possible to fill in the customer chain between them.
WARNING: Internal Customers There is one type of customer which when considering QFD we must be very careful of, namely, the internal customer. The reason for this comes from why customer requirements are so important. By satisfying them we stay in business because people buy our products/services. As such it must always be the external customers we satisfy as it is they who pay for our products/services. Therefore, if we include internal customers requirements which then lead to a compromise on an external customer requirement, we have not satisfied the external customer. The correct answer would be to satisfy the external customer and then solve the associated internal problems. In other words, we become customer driven.
Example The designers at a small boatyard are designing fishing boats. The owner, the external customer, has asked for an aluminium wheelhouse. Production, the internal customer, are saying they want anything but aluminium in the vessel because they cannot work aluminium. The designers compromise and specify a wooden wheelhouse. The result is that the external customer is not satisfied. What the designers should have done was to specify the aluminium wheelhouse then considered the associated internal problem. This will automatically happen in QFD if the external customers only are considered as the internal problems will be highlighted and then dealt with at a later stage.
What is Meant by ‘Customer’? In QFD, when we refer to the customer in terms of gathering their requirements, it is not sufficient just to consider our customer chain. We must consider the individual parts of that chain in more detail. It is not sufficient, if we want a full picture, just to consider those people who bought our product; we must look further.
We should consider the following people:
• Those who bought our products
• Those who bought competitors’ products
• Those who switched to our competitor
• Those who are satisfied
• Those who are not satisfied
Obtaining Customer Requirements In the domain of market research there are two types of data, namely, primary and secondary. For the purposes of QFD we consider in the main primary data techniques. The main reason for this is as follows:
Q U A L I T Y F U N C T I O N D E P L O Y M E N T
8 ©Warwick Manufacturing Group Revision date: January 07
Secondary data is that which is not directly gathered from field work.
Examples of secondary data are:
• Government produced statistics
• Company accounts
• Commercially produced reports
• Business news in newspapers and trade magazines
Although this type of data can be useful to parts of QFD, for customer requirements it is necessary that the requirements are gathered in the customers’ own language. That is to say that the words used in the recording of the requirements should be the actual words used by the customer. The techniques used to get this type of information are generally referred to as Field Research Techniques and they produce what is called primary data.
Field research techniques can be broken down into those using questionnaires and those using non-questionnaire techniques. Questionnaire techniques involve the use of a set of questions which respondents are asked to answer. The type of questions asked can be very formal and structured, requiring a simple ‘yes’, ‘no’ or ‘don’t know’ response or they can be semi-structured, requiring an explanation of a customer’s action.
Before listing the questionnaire techniques, there must be one word of warning about using them in the context of QFD. As the use of them is to produce the customers’ requirements, both technical and emotional, we must be careful not to structure the questionnaires in such a way that they lead the customer into a particular response or in fact, miss an area of requirement completely.
Questionnaire methods consist of three basic types:
Postal Questionnaires Postal Questionnaires are impersonal. The respondent is left to fill in a questionnaire alone. It is the most structured of the questionnaire techniques, and its main advantage is its comparative low cost - an interviewer is not required to put the questions directly to a respondent - hence, it is possible to send the questionnaire to a large number of potential respondents. However, the respondent is under no obligation or pressure to answer, so may simply throw away the questionnaire or leave it a long time before replying. As a result, response rates are generally low and replies may take a long time to come in. As a result, respondents may not represent a true cross section of the population.
Telephone Interviews Telephone interviewing, because it involves an interviewer putting questions to respondents, often has the advantage of drawing out answers which are given
Q U A L I T Y F U N C T I O N D E P L O Y M E N T
9 ©Warwick Manufacturing Group Revision date: January 07
instantly. It is more expensive than a postal survey because a trained interviewer must be employed and telephone calls can be costly.
Face-to-face Interviews Respondents meet an interviewer face to face. As a result, the procedure can be more informal than the other two techniques, with time to elaborate on the meaning of questions and the reasons that the answers were given. This is, however, a very costly method in time and money.
For non-questionnaire techniques there are three basic categories:
• Discussion techniques
• Diary panels
• Audit techniques
For QFD, because we are considering products at the design stage we are interested in only one of these above categories. The category of interest is the discussion technique. Of this type there are various different methods.
Clinics The clinic method is very useful for the purposes of QFD as it provides a variety of feedback information. A clinic takes the form of grouping customers at a venue where they may see the product in question, or a mock up, and its competition. The group will encompass all the types of people referred to previously, those who bought your products and those who did not. The feedback that these people give can thus be noted throughout the period of the clinic.
Much use of clinics has been made by the car manufacturers. They use clinics to expand on the information gathered from postal surveys. Selected respondents are asked to bring their cars to a venue where the manufacturer will also have examples of the competition. The customers can then discuss their likes and dislikes and compare the competition.
Focus Groups Focus Groups are small groups of about eight to twelve people. These groups should be a cross section of the population selected at random who agree to come to a venue for a one or two hour discussion. These discussions should be led by someone experienced at such things who is capable of moving the discussion in the right direction so that all issues are covered.
There is one other method for acquiring customer information which is not covered in the above field techniques. This final technique is one that the Japanese have shown that they are exceptionally good at: it is called Listening.
Listening Listening takes the form of engineers and managers simply listening at trade shows and outside retail outlets. What they must listen for is simply the comments of
Q U A L I T Y F U N C T I O N D E P L O Y M E N T
10 ©Warwick Manufacturing Group Revision date: January 07
customers, potential customers and past customers about the particular product in which they are interested.
The example below shows the customer requirements as gathered from the customer chain for the aircraft seat example:
Passenger
Comfortable, does not give you bum ache. Enough leg room. Lumbar support does not hurt short person. Does not burn. Hole in tray for coffee cup. Comfortable seat belt. Seat belt feels safe. Magazines can be easily removed from rack. Comfortable when you recline. Does not hit person behind when you recline. Back can be adjusted to any position and does not slip. Not dirty. Nice colour. Does not soak up a spilt drink. Does not make you sweat. Arm rests not too narrow. Arm rest folds right away.
Airline
Easy/cheap to refit. Easy to clean. Easy to move around. Fit more passengers in. Passengers feel comfortable. Fabric in certain colours. Fabric stain resistant. Meets regulatory requirements. Long life. Low operating cost. Cheap to service.
Aircraft Manufacturer
Cheap. Light weight. Durable. Easy to fit in plane. Safe in crash. Meets regulatory requirements.
Q U A L I T Y F U N C T I O N D E P L O Y M E N T
11 ©Warwick Manufacturing Group Revision date: January 07
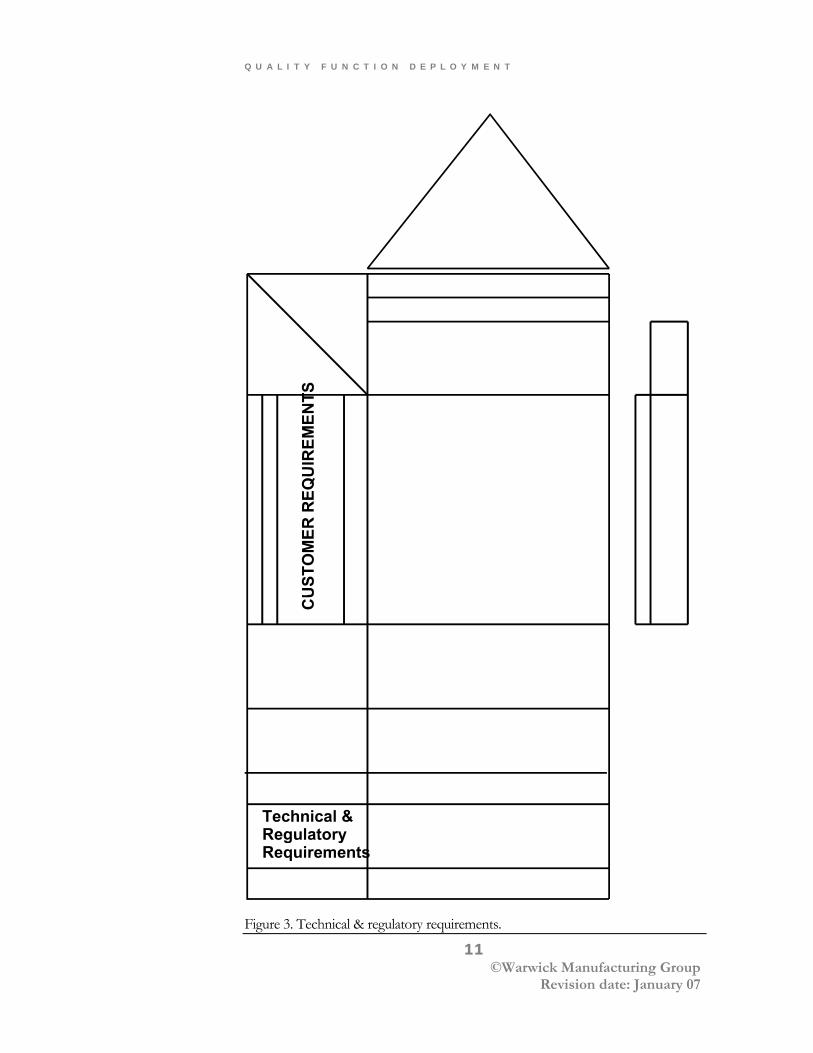
Figure 3. Technical & regulatory requirements.
Q U A L I T Y F U N C T I O N D E P L O Y M E N T
12 ©Warwick Manufacturing Group Revision date: January 07
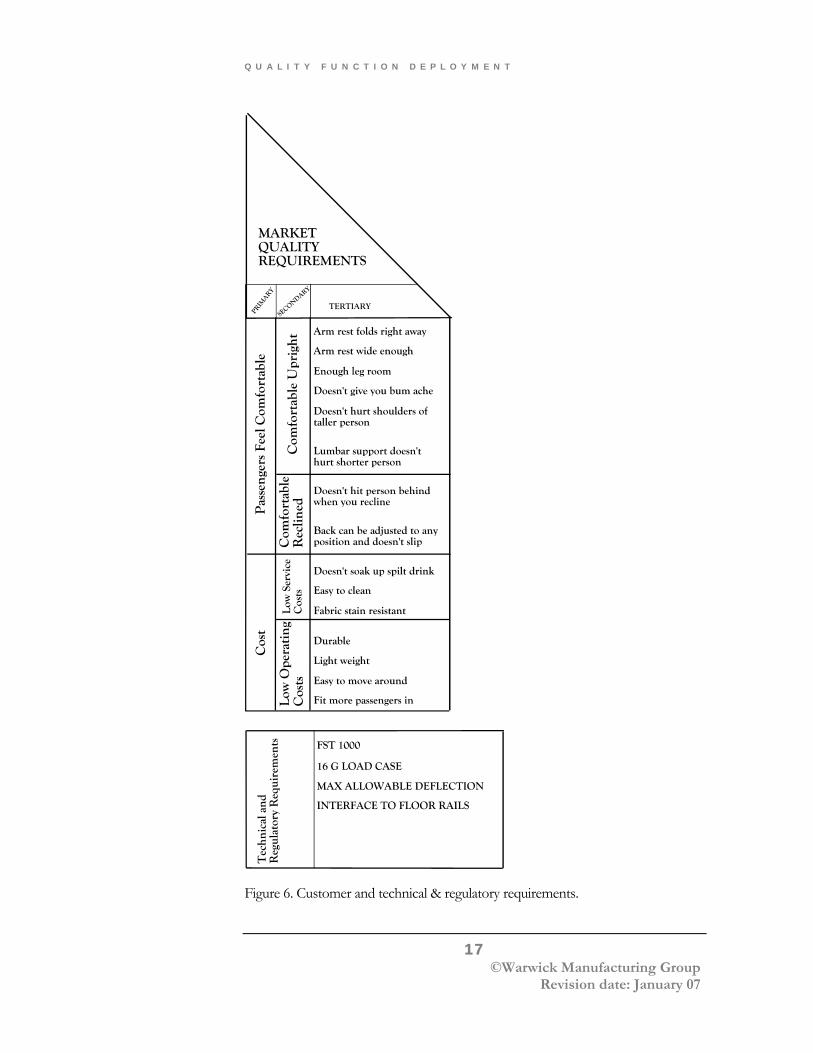
Technical And Regulatory Requirements There are some requirements which the customers will not identify. These requirements will be either technical or regulatory requirements. Regulatory requirements are such things as government legislation, safety requirements, quality standard requirements, classification requirements etc. Technical requirements occur because the company may have some specific plans for the new product. For example, complete automated assembly, single monocoque construction etc. All these types of requirements should be included in the requirement side of the chart so that total satisfaction can occur i.e. customer, company, regulatory.
Earlier, it was mentioned that we had to be careful of internal customers. The technical and regulatory section of the chart is the only place in which they should appear.The technical and regulatory requirements are added at the bottom of the chart as will be shown later.
In the case of the aircraft seat example, the technical and regulatory requirements are as follows:
FST 1000 - fire safety standard
16G load case - safety standard
Max allowable deflection interface to floor rails
Organising Customer Requirements There are three reasons behind organising the customer requirements:
• To organise the raw customer data into groups of associated data to simplify using the QFD charts at a later stage.
• Because the customer requirements are listed in the language of the customer, the process of organising the data allows the QFD team to reach a common understanding of customer wants.
• The customer research techniques by the nature of their sampling and the customer responses may not highlight all the customer needs. The process of organising listed below gives the team the chance to surface areas and requirements which the customer has not talked about.
In organising the customer requirements there are three categories into which they can be put. These are:
Primary: Are the very basic customer wants. At this level all the requirements should give an overall product view. For example, Toyota has only four primary categories for
Q U A L I T Y F U N C T I O N D E P L O Y M E N T
13 ©Warwick Manufacturing Group Revision date: January 07
describing a new car: ‘Good at first glance’, ‘easy ride and handling of car’, ‘feels safe when driving’, ‘long life’.
Secondary: These requirements are the primary level in more detail and are in fact the headings for groups of tertiary level requirements
Tertiary : These are the requirements in their most detailed level.
In fact, when developing these organisation levels with the customer requirements we start at the tertiary level and work outwards towards the primary level. The reason for this is that QFD should always be customer driven and, therefore, we should start with the information the customer has given us. If the customer is a manufacturer of industrial goods, that manufacturer can generally identify its own primary requirements.The buying public, however, often mentions secondary or tertiary requirements when asked what it wants.
The Process of Organisation Step 1: All the customer requirements should be written on to pieces of card, or ‘post it’ notes. Each piece of card should contain only one of the requirements.
Step 2: The cards should now be pinned to a board or spread out on a large table where all members of the team can see them easily.
Step 3: The team should now start to group cards together that have some relationship. It will be the discussions during this step which lead to reaching a common understanding of customer wants. It is quite possible that certain requirements appear to belong to more than one group. If this is the case, at this stage, repeat cards should be written and put with all possible groups.
Step 4: Once the cards have been grouped the team should write title cards which best describe the category for the cards. The title cards should be as specific as possible. Occasionally there will be cards within the group which could easily act as title cards for the group. If this is the case it should become a title card. Once this has been done the cards have effectively been grouped into secondary (title) and tertiary (group) requirements.
At this stage the team should discuss any doubling up of cards from the step and decide to which single group they should belong. At the end of the organising process there should be no repeated requirements.
It is possible that confusion will arise as to whether a requirement should be a secondary requirement or tertiary requirement. The team can alleviate this problem by applying a simple test.
Q U A L I T Y F U N C T I O N D E P L O Y M E N T
14 ©Warwick Manufacturing Group Revision date: January 07
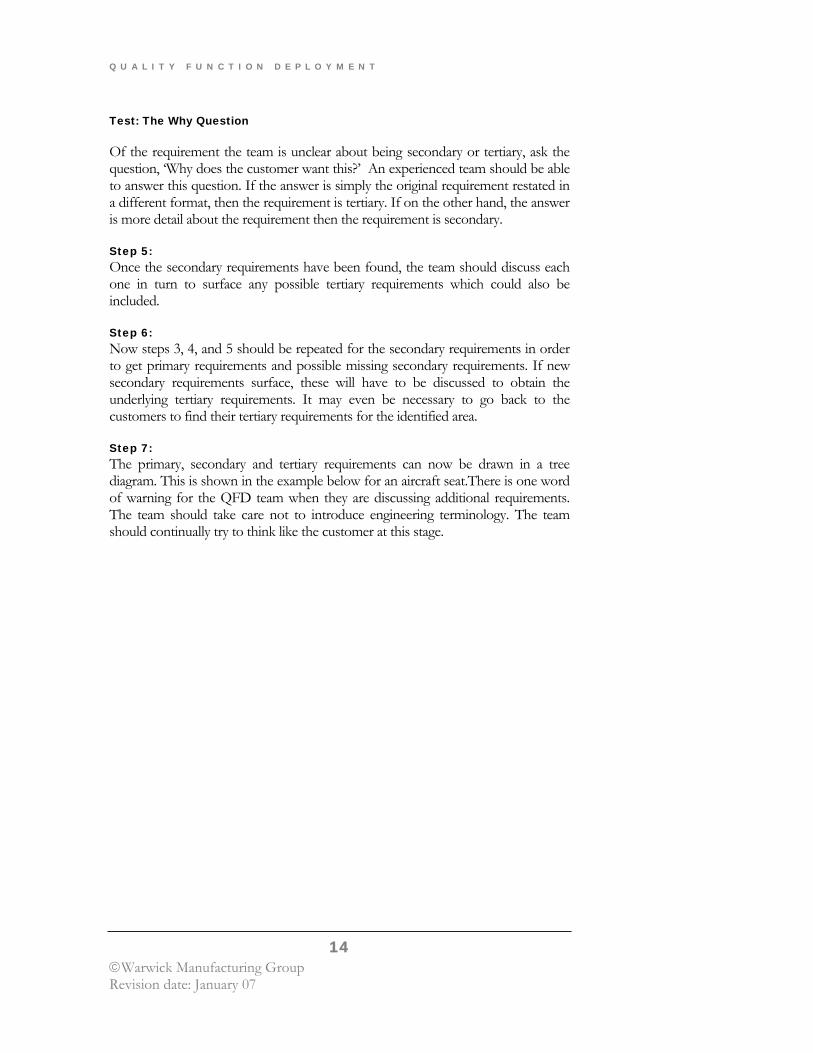
Test: The Why Question
Of the requirement the team is unclear about being secondary or tertiary, ask the question, ‘Why does the customer want this?’ An experienced team should be able to answer this question. If the answer is simply the original requirement restated in a different format, then the requirement is tertiary. If on the other hand, the answer is more detail about the requirement then the requirement is secondary.
Step 5: Once the secondary requirements have been found, the team should discuss each one in turn to surface any possible tertiary requirements which could also be included.
Step 6: Now steps 3, 4, and 5 should be repeated for the secondary requirements in order to get primary requirements and possible missing secondary requirements. If new secondary requirements surface, these will have to be discussed to obtain the underlying tertiary requirements. It may even be necessary to go back to the customers to find their tertiary requirements for the identified area.
Step 7: The primary, secondary and tertiary requirements can now be drawn in a tree diagram. This is shown in the example below for an aircraft seat.There is one word of warning for the QFD team when they are discussing additional requirements. The team should take care not to introduce engineering terminology. The team should continually try to think like the customer at this stage.
Q U A L I T Y F U N C T I O N D E P L O Y M E N T
15 ©Warwick Manufacturing Group Revision date: January 07
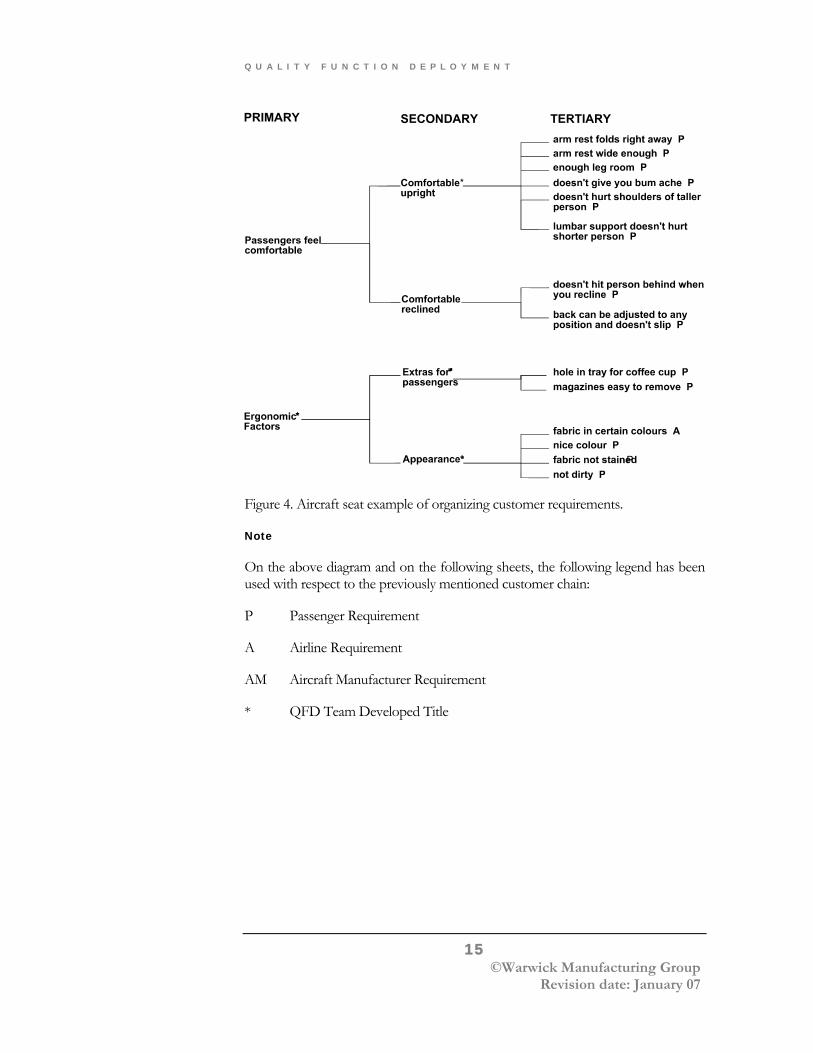
Figure 4. Aircraft seat example of organizing customer requirements.
Note
On the above diagram and on the following sheets, the following legend has been used with respect to the previously mentioned customer chain:
P Passenger Requirement
A Airline Requirement
AM Aircraft Manufacturer Requirement
* QFD Team Developed Title
Q U A L I T Y F U N C T I O N D E P L O Y M E N T
16 ©Warwick Manufacturing Group Revision date: January 07
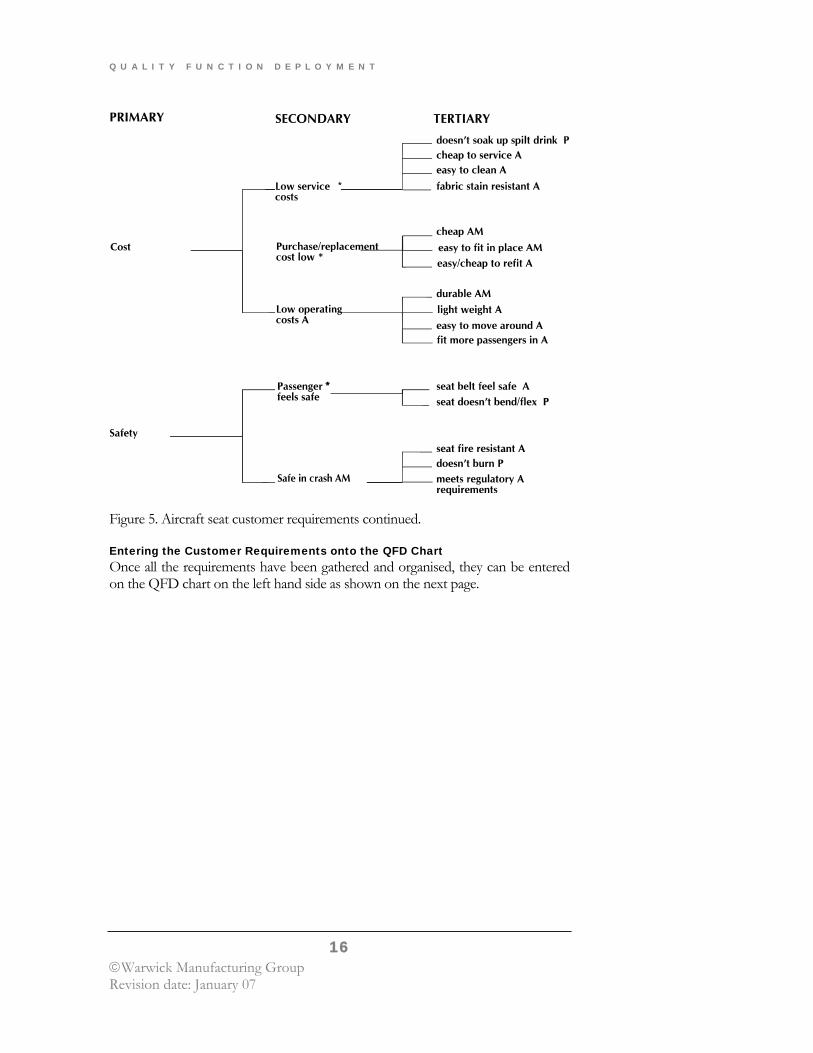
Figure 5. Aircraft seat customer requirements continued.
Entering the Customer Requirements onto the QFD Chart Once all the requirements have been gathered and organised, they can be entered on the QFD chart on the left hand side as shown on the next page.
Q U A L I T Y F U N C T I O N D E P L O Y M E N T
17 ©Warwick Manufacturing Group Revision date: January 07
Figure 6. Customer and technical & regulatory requirements.
Q U A L I T Y F U N C T I O N D E P L O Y M E N T
18 ©Warwick Manufacturing Group Revision date: January 07
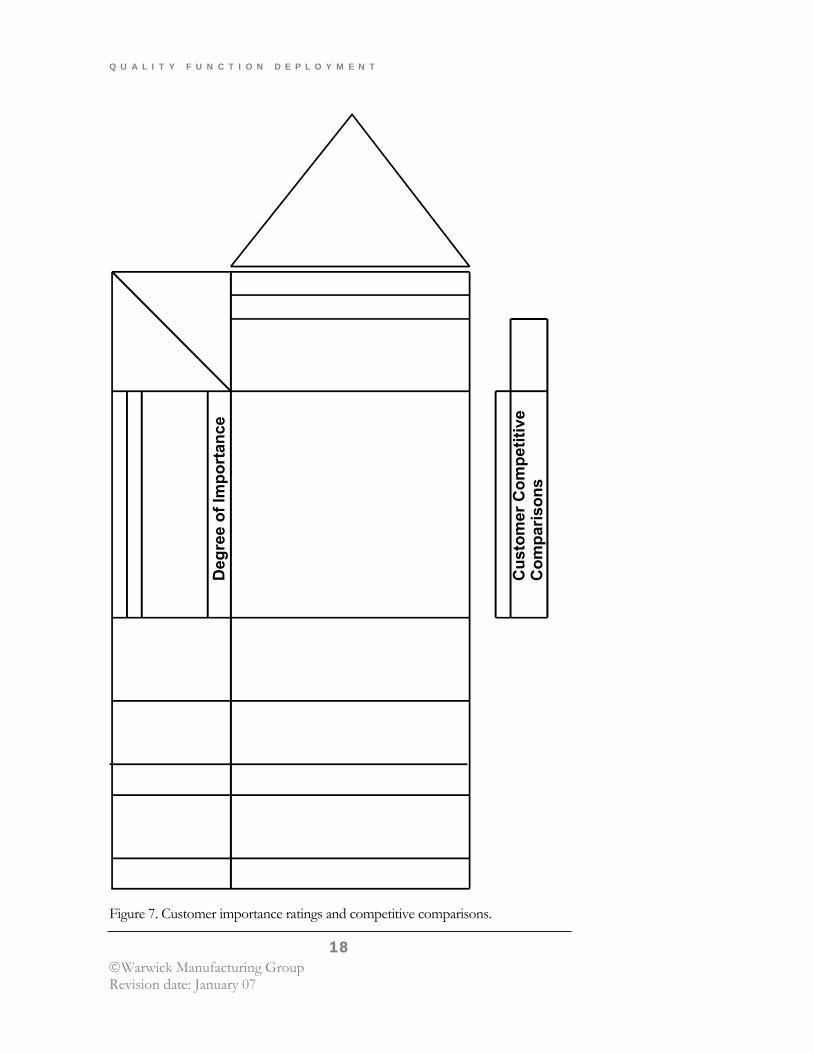
Figure 7. Customer importance ratings and competitive comparisons.
Q U A L I T Y F U N C T I O N D E P L O Y M E N T
19 ©Warwick Manufacturing Group Revision date: January 07
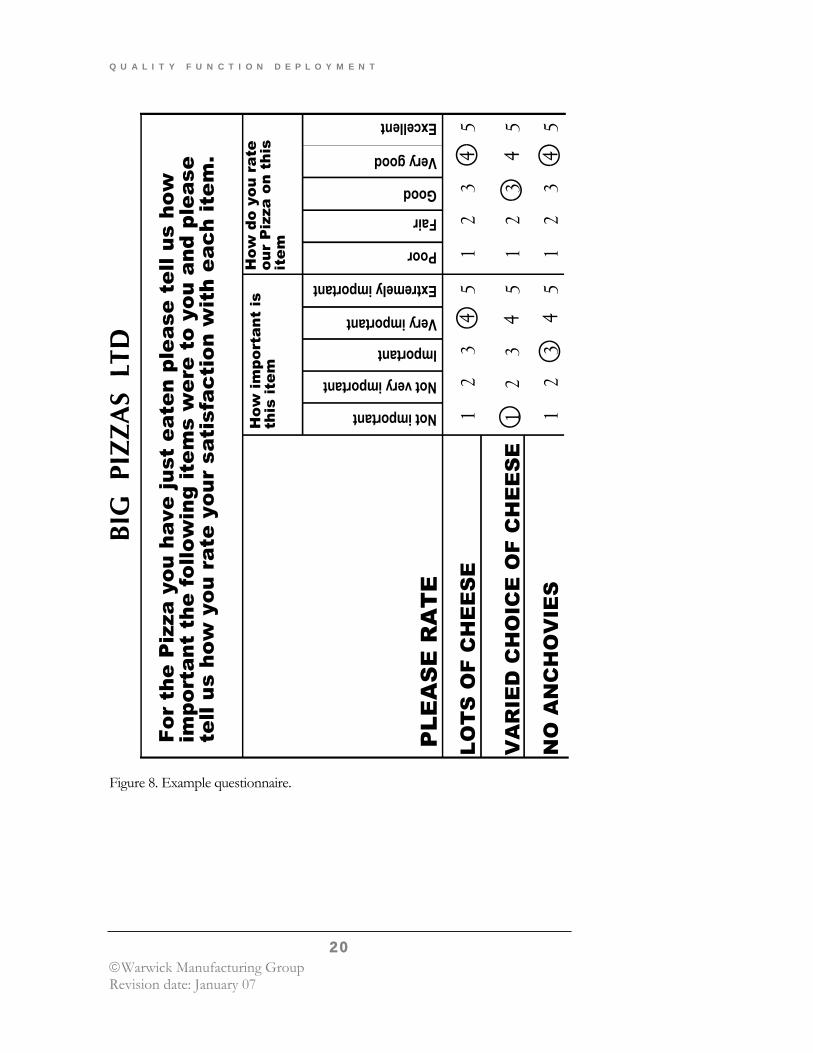
Establishing Customer Importance Ratings & Customer Competitive Comparisons Although these are two distinct areas with different objectives, they can be carried out together on the same customer survey. Hence, they have been linked together in this section. After the customer requirements have been gathered it is necessary to quantify two separate issues:
• How important each of the characteristics are to the customer. It will definitely be the case that the customer will attach more importance to certain requirements than others. It is important to QFD that we are able to reflect these different importance ratings.
• How the customer rates how well our company performs on each of his/her requirements against the best of our competition.
It is necessary to have both of the above pieces of information so that the team can use them in the analysis of the QFD chart to focus in on the sources available to the company for competitive advantage.
Any of the survey techniques mentioned in the customer requirement section can be used to gather customer importance ratings and competitive comparisons. For many products, e.g. cars, it is possible to obtain lists of owners from government registers for both a company’s products and its competitors. For those that lists cannot be found the process becomes much harder.
The example below shows the type of survey sheet that could be used for a postal survey.
Example Questionnaire The following page shows an example questionnaire as used by a chain of Pizza Restaurants.
Q U A L I T Y F U N C T I O N D E P L O Y M E N T
20 ©Warwick Manufacturing Group Revision date: January 07
Figure 8. Example questionnaire.
Q U A L I T Y F U N C T I O N D E P L O Y M E N T
21 ©Warwick Manufacturing Group Revision date: January 07
If the above survey is used on both purchasers of your own company’s products and purchasers of competitors products, a picture of how well you compete against your competitors can be built up.
Because large surveys must be carried out it is necessary to take an average of all the survey data. A simple method for doing this is to average all the survey data for each item and double that average, finally rounding it to a whole number. In doing this if the survey data gave ratings from one to five the results we have now will be more detailed giving ratings from one to ten.
NOTE:
The reason that we ask customers just to rate on scales from one to five is that it is easier for the customer to choose. His choice is limited to top, middle, bottom, above middle or below middle. The process of averaging and rounding up then gives us the increased distribution we require to make the QFD analysis easier.
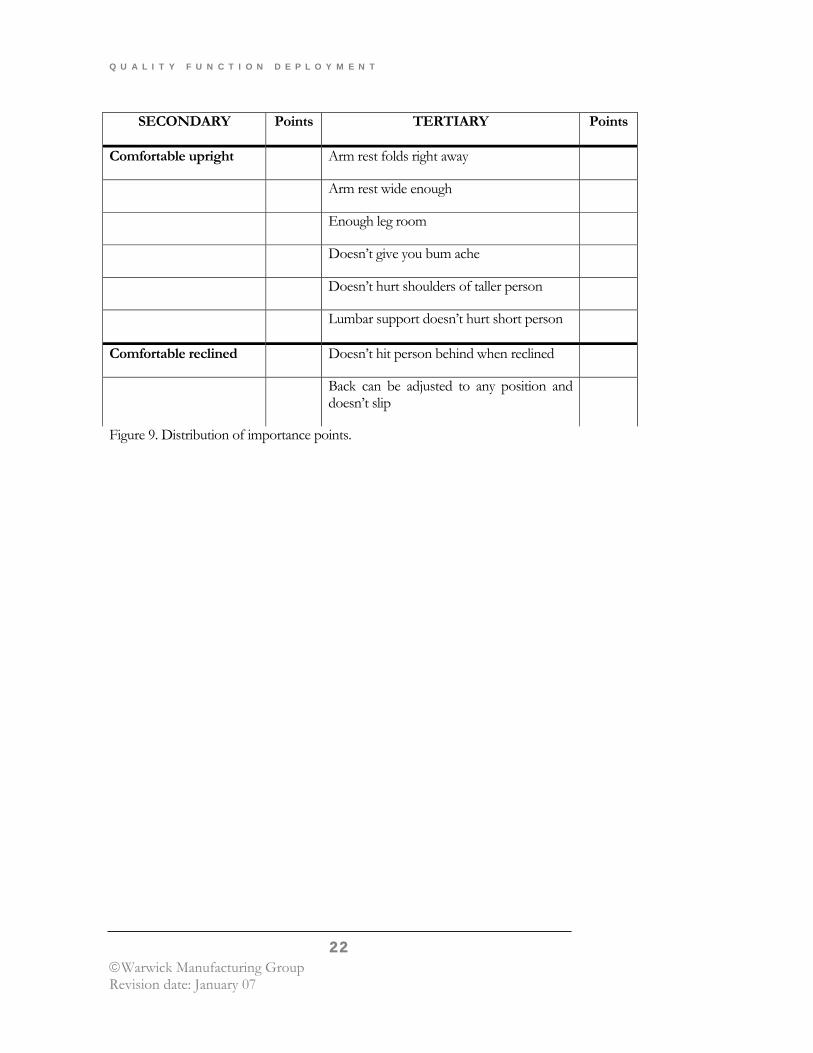
Having said this however, it is conceivable that the increased distribution will still not give the difference in definition that we require, i.e. we may still have very many items which are ranked identically. If this is the case, then other survey techniques must be used to build on the basic data already found. A focus group could be used where the small group of people is asked to discuss or debate the items concerned. The alternative is to use a clinic technique. In this case the group of customers at the clinic would be given a sheet, as shown overleaf, and asked to distribute 100 points between the secondary requirements. This forces the participants to think about the relative importance of each of the secondary items. Once the participating customers have completed this they are asked to break down the points that they have allocated to each of the secondary requirements to the appropriate tertiary requirements. This method will thus give the increased definition we require.
An example of the type of form used in the clinic is shown on the next page.
The final possibility is in fact listening. A wealth of competitive comparison information can be acquired by engineers and managers listening and taking note of what customers say at exhibitions, trade shows and retail outlets. Comments like ‘I like the boot but it isn’t as big as the Toyota we looked at yesterday’ if noted, can prove invaluable.
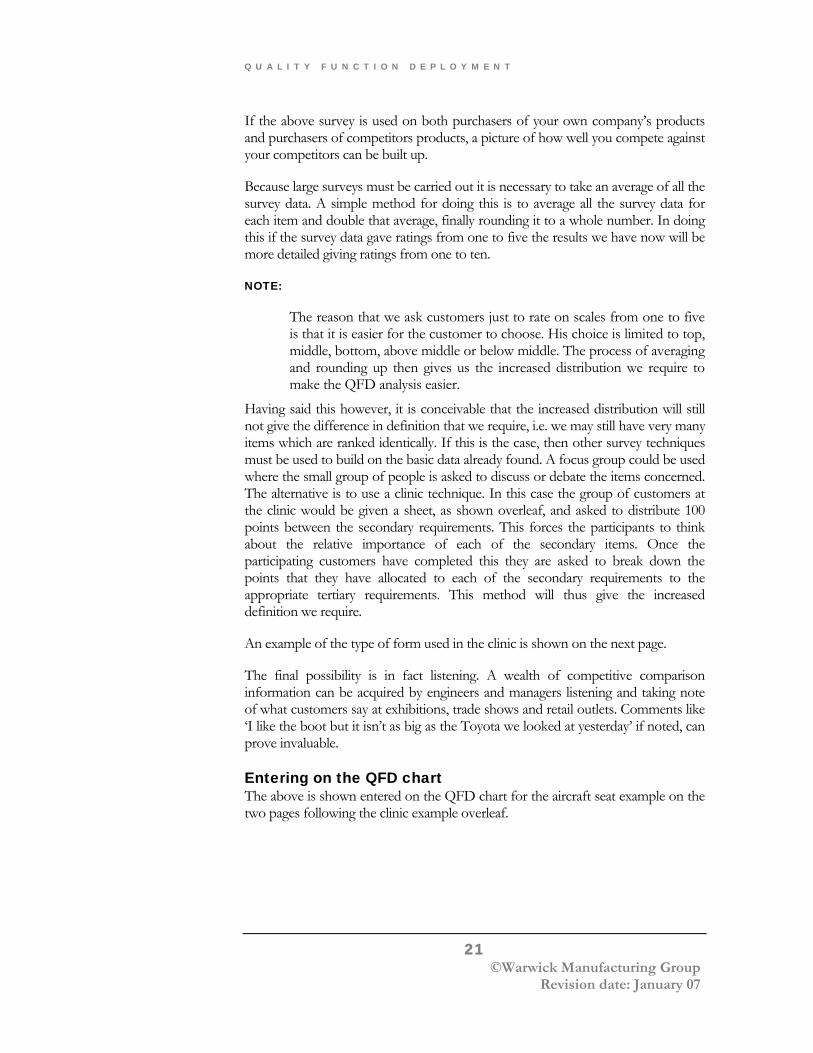
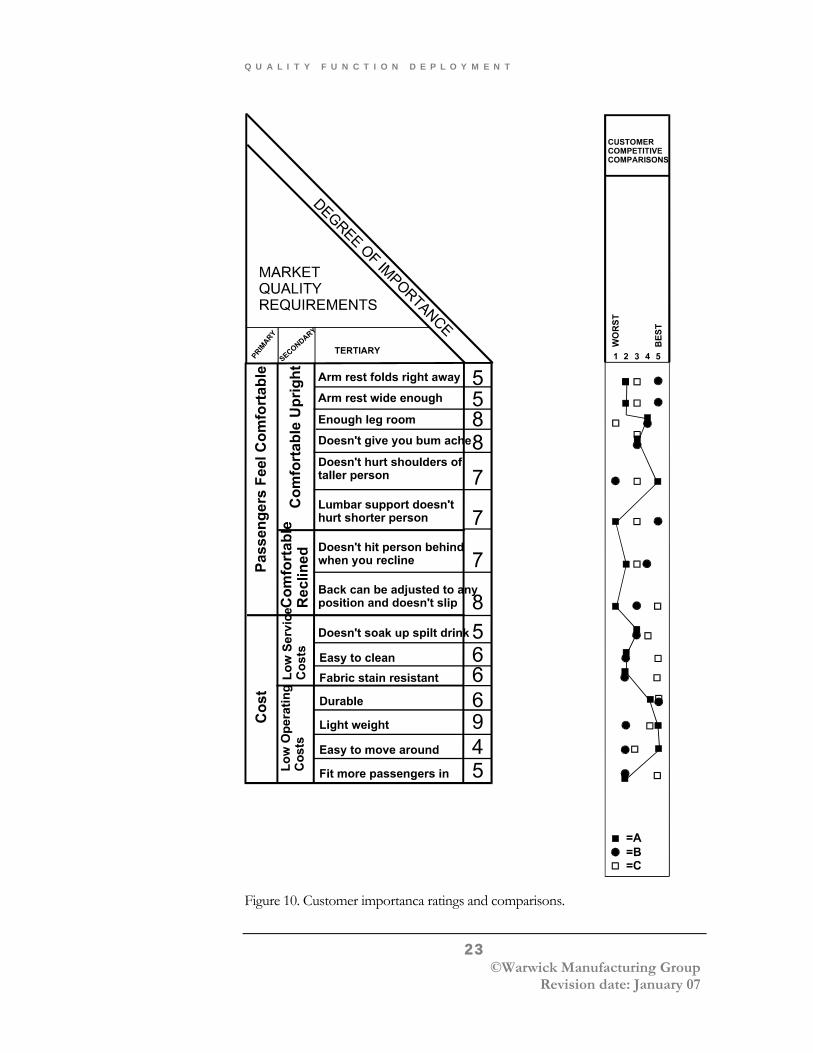
Entering on the QFD chart The above is shown entered on the QFD chart for the aircraft seat example on the two pages following the clinic example overleaf.
Q U A L I T Y F U N C T I O N D E P L O Y M E N T
22 ©Warwick Manufacturing Group Revision date: January 07
SECONDARY Points TERTIARY Points
Comfortable upright Arm rest folds right away
Arm rest wide enough
Enough leg room
Doesn’t give you bum ache
Doesn’t hurt shoulders of taller person
Lumbar support doesn’t hurt short person
Comfortable reclined Doesn’t hit person behind when reclined
Back can be adjusted to any position and doesn’t slip
Figure 9. Distribution of importance points.
Q U A L I T Y F U N C T I O N D E P L O Y M E N T
23 ©Warwick Manufacturing Group Revision date: January 07
Figure 10. Customer importanca ratings and comparisons.
Q U A L I T Y F U N C T I O N D E P L O Y M E N T
24 ©Warwick Manufacturing Group Revision date: January 07
Figure 11. Customer complaint history.
Q U A L I T Y F U N C T I O N D E P L O Y M E N T
25 ©Warwick Manufacturing Group Revision date: January 07
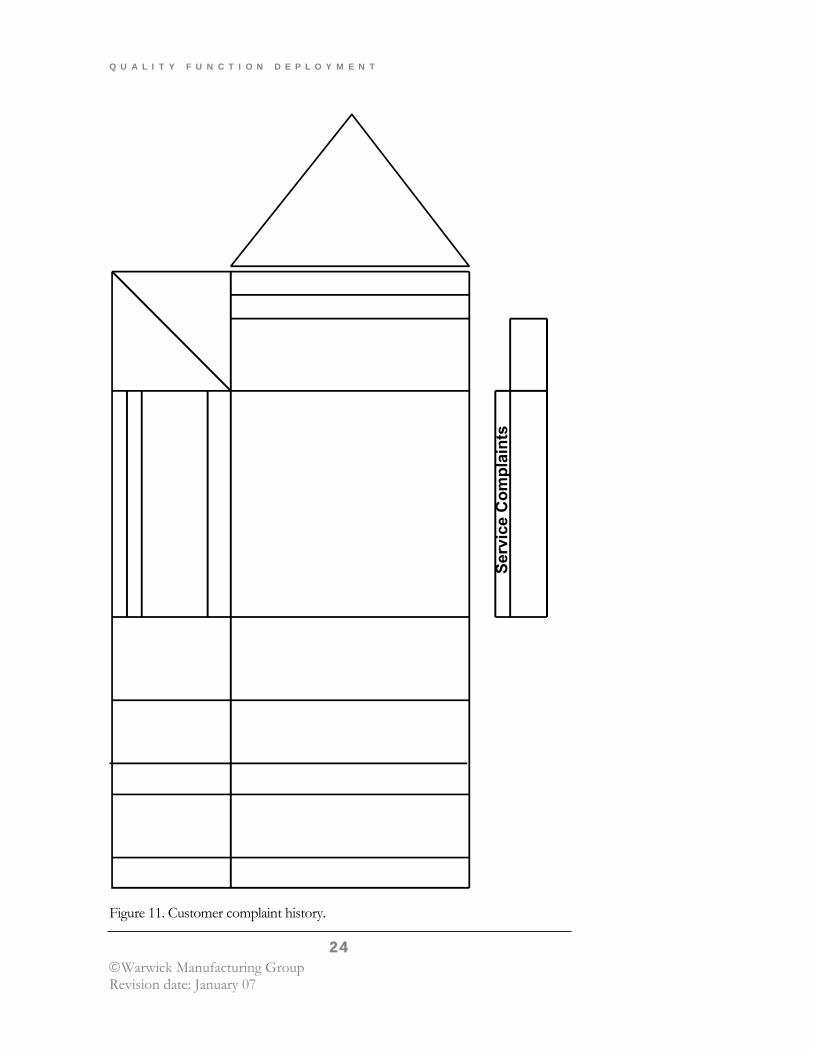
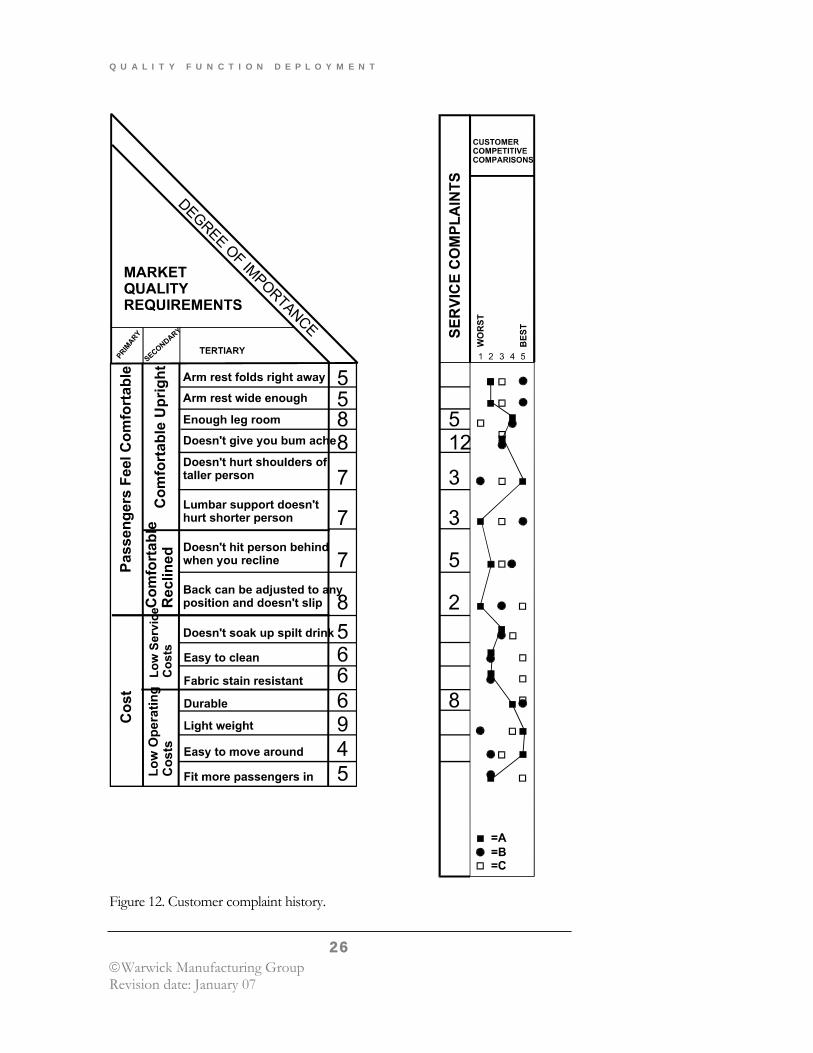
Customer Complaint History There is one other area which adds to the useful information we can gather for use in the QFD study. Most businesses today have records of customer complaints. The reason for complaint histories being useful to the QFD study is that often the complaint history cannot be related to a specific customer want. This is because when the service call report was written the engineer will have translated the customer’s complaint language into technical language and hence the related customer want is lost.
The identification of the customer complaints and their inclusion in the QFD chart allows the QFD team to identify the nature of the customer complaint and the time frame over which it arises. For example, take a car door. The customer may want a door which is easy to open and close. We as manufacturers have designed the door such that this is the case. When we look at the complaint history however, we find that there have been a great many complaints in this area. On investigation the team finds that the hinge design becomes very stiff after certain conditions combined with a certain amount of wear.
The chart on the next page shows how complaint history should be entered on the chart.
Q U A L I T Y F U N C T I O N D E P L O Y M E N T
26 ©Warwick Manufacturing Group Revision date: January 07
Figure 12. Customer complaint history.
Q U A L I T Y F U N C T I O N D E P L O Y M E N T
27 ©Warwick Manufacturing Group Revision date: January 07
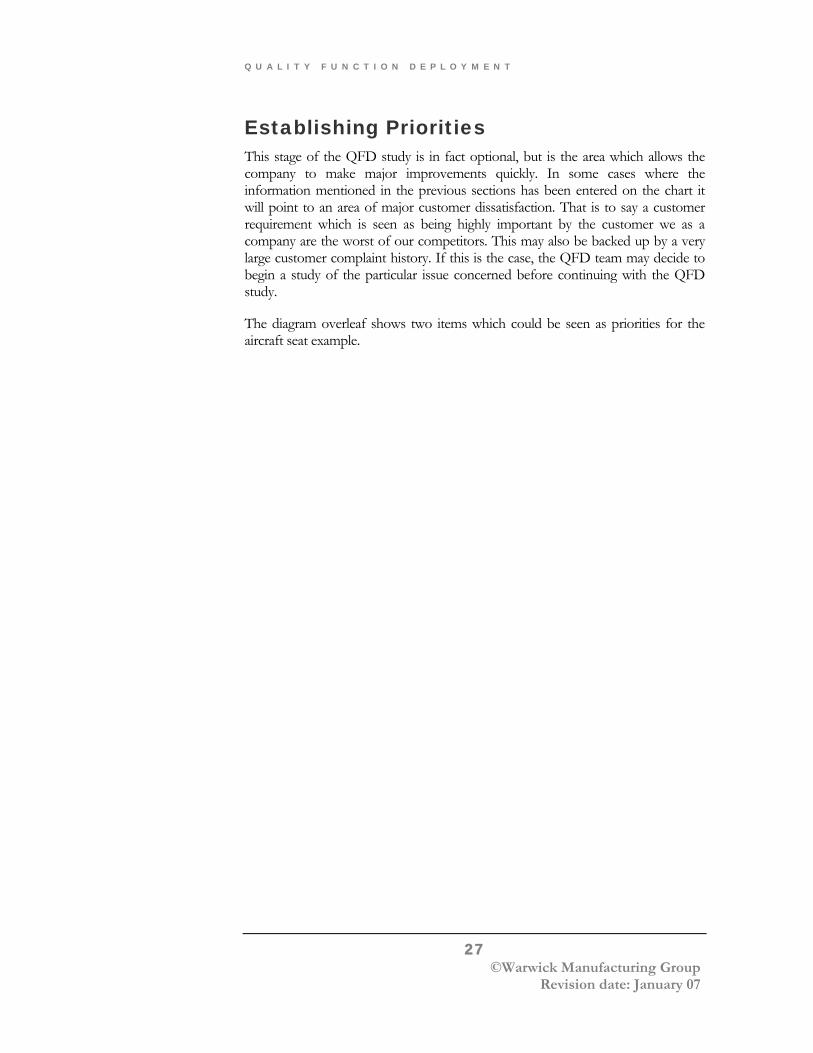
Establishing Priorities This stage of the QFD study is in fact optional, but is the area which allows the company to make major improvements quickly. In some cases where the information mentioned in the previous sections has been entered on the chart it will point to an area of major customer dissatisfaction. That is to say a customer requirement which is seen as being highly important by the customer we as a company are the worst of our competitors. This may also be backed up by a very large customer complaint history. If this is the case, the QFD team may decide to begin a study of the particular issue concerned before continuing with the QFD study.
The diagram overleaf shows two items which could be seen as priorities for the aircraft seat example.
Q U A L I T Y F U N C T I O N D E P L O Y M E N T
28 ©Warwick Manufacturing Group Revision date: January 07
Figure 13. Customer priorities.
Q U A L I T Y F U N C T I O N D E P L O Y M E N T
29 ©Warwick Manufacturing Group Revision date: January 07
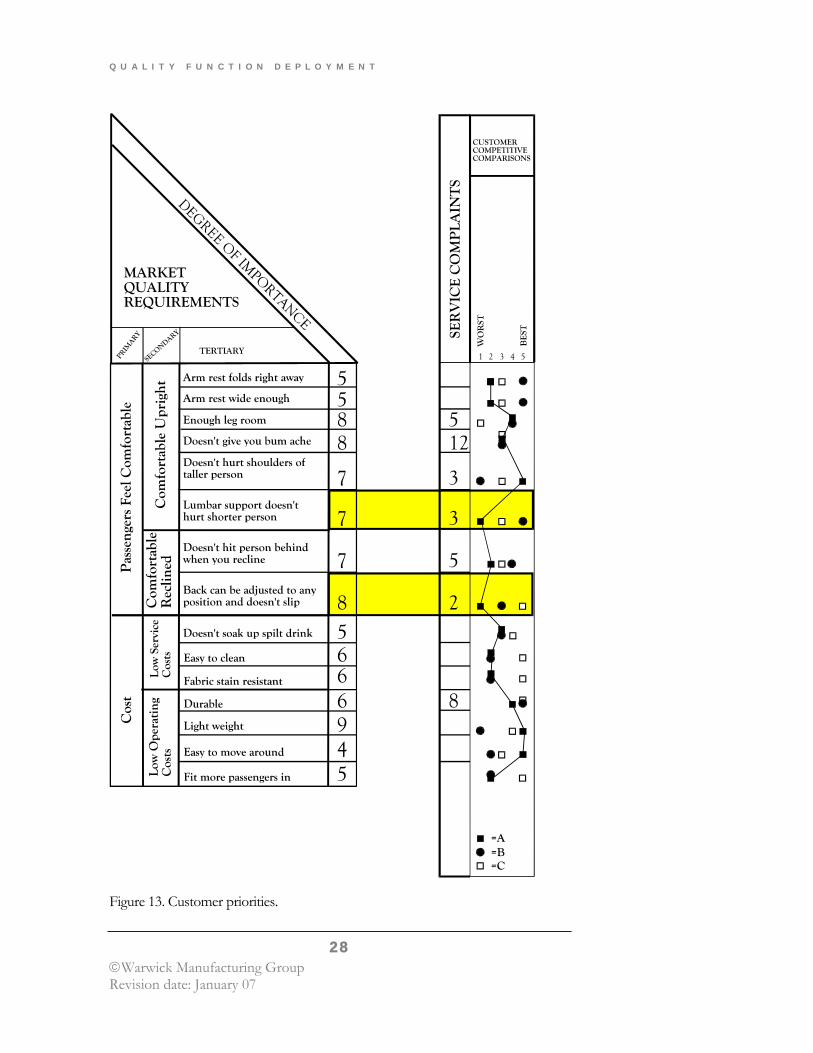
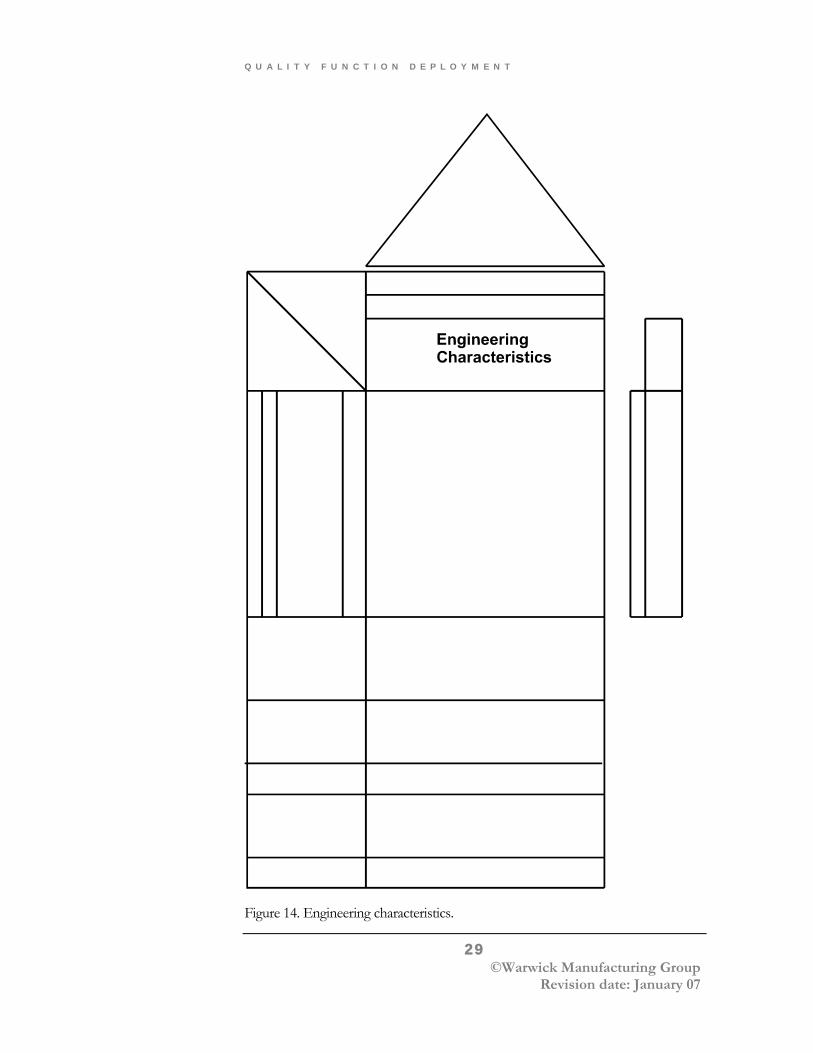
Figure 14. Engineering characteristics.
Q U A L I T Y F U N C T I O N D E P L O Y M E N T
30 ©Warwick Manufacturing Group Revision date: January 07
Establish Engineering Characteristics The starting point for QFD is positive statements of Customer Requirements expressed in the customers’ own language. This data is then organised into logical groups and your competitive position, as perceived by your customers, is determined against these requirements.
The next step is to determine the Engineering Characteristics which must be optimised to assure customer satisfaction. The marketing domain tells us what to do, the engineering domain tells us how to do it.
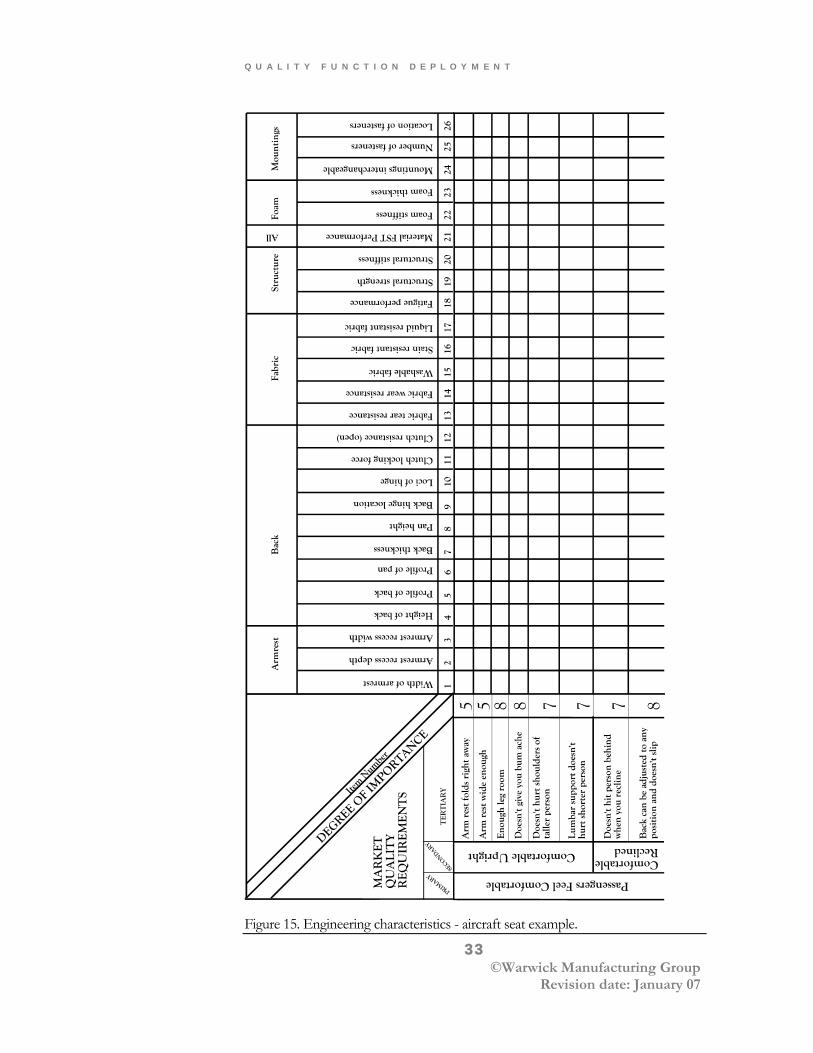
The Customer Requirements are listed down the left hand side of the chart. The QFD team then lists, along the top, those Engineering Characteristics that are likely to affect one or more of the Customer Requirements.
Engineering Characteristics should describe the product in measurable terms and should directly affect customer perceptions. This translation of Customer Requirements into language meaningful to a designer is a very important step in the QFD process and deserves considerable study and development. If the step is performed correctly the customer’s voice will be carried through. If not, one of the major objectives of the study, the customer’s voice, will have been lost.
Teams should avoid ambiguity in interpretation of the Engineering Characteristics. They must avoid hasty decisions that a Customer Requirement is satisfied by using current quality control measurement practices. If you do what you have always done, you will get what you have always got. This is a time for systematic, creative and exhaustive analysis of each of the requirements, a time for brainstorming.
This process need not be conducted by the QFD team alone. Subgroups may be formed with members brought in from outside the core team, but each subgroup should be led by a team member.
Brainstorm each secondary, and its associated tertiary requirements, to generate Engineering Characteristics. As many ideas as possible should be generated, both established and novel approaches, any aspect of engineering that affects at least one of the Customer Requirements. However, there is one overriding requirement that must be rigidly enforced. Each Engineering Characteristic must be measurable. If is not measurable, it cannot be optimised and so cannot be used to assure customer satisfaction.
Q U A L I T Y F U N C T I O N D E P L O Y M E N T
31 ©Warwick Manufacturing Group Revision date: January 07
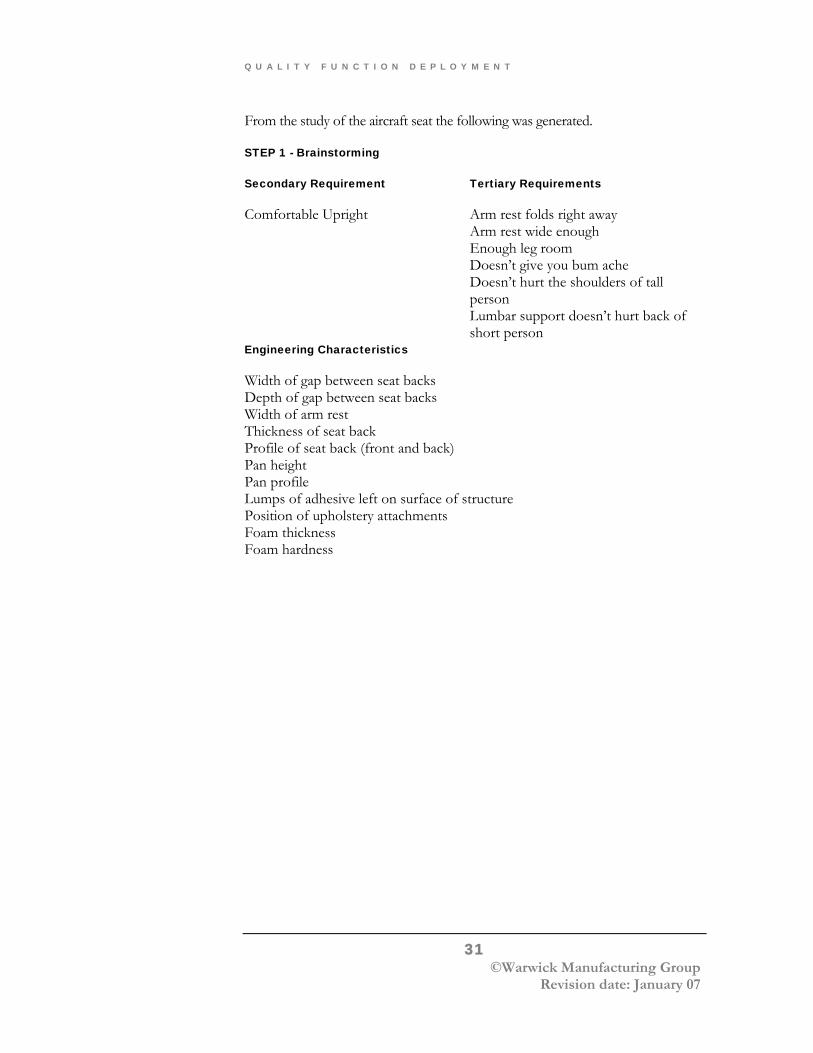
From the study of the aircraft seat the following was generated.
STEP 1 - Brainstorming
Secondary Requirement Tertiary Requirements
Comfortable Upright Arm rest folds right away Arm rest wide enough Enough leg room Doesn’t give you bum ache Doesn’t hurt the shoulders of tall person Lumbar support doesn’t hurt back of short person
Engineering Characteristics
Width of gap between seat backs Depth of gap between seat backs Width of arm rest Thickness of seat back Profile of seat back (front and back) Pan height Pan profile Lumps of adhesive left on surface of structure Position of upholstery attachments Foam thickness Foam hardness
Q U A L I T Y F U N C T I O N D E P L O Y M E N T
32 ©Warwick Manufacturing Group Revision date: January 07
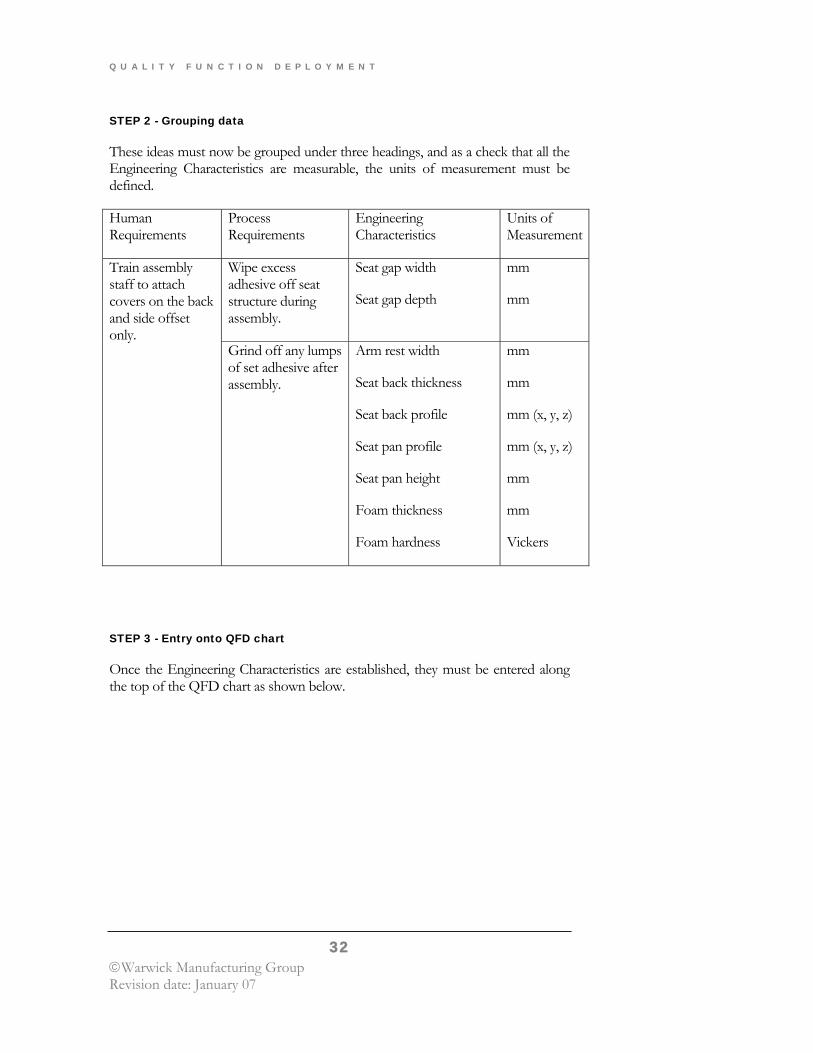
STEP 2 - Grouping data
These ideas must now be grouped under three headings, and as a check that all the Engineering Characteristics are measurable, the units of measurement must be defined.
Human Requirements
Process Requirements
Engineering Characteristics
Units of Measurement
Wipe excess adhesive off seat structure during assembly.
Seat gap width
Seat gap depth
mm
mm
Train assembly staff to attach covers on the back and side offset only.
Grind off any lumps of set adhesive after assembly.
Arm rest width
Seat back thickness
Seat back profile
Seat pan profile
Seat pan height
Foam thickness
Foam hardness
mm
mm
mm (x, y, z)
mm (x, y, z)
mm
mm
Vickers
STEP 3 - Entry onto QFD chart
Once the Engineering Characteristics are established, they must be entered along the top of the QFD chart as shown below.
Q U A L I T Y F U N C T I O N D E P L O Y M E N T
33 ©Warwick Manufacturing Group Revision date: January 07
Figure 15. Engineering characteristics - aircraft seat example.
Q U A L I T Y F U N C T I O N D E P L O Y M E N T
34 ©Warwick Manufacturing Group Revision date: January 07
Figure 16. Technical competitive comparisons.
Q U A L I T Y F U N C T I O N D E P L O Y M E N T
35 ©Warwick Manufacturing Group Revision date: January 07
Technical Competitive Comparisons The next step is to evaluate how your company performs in comparison to its most serious competitors.
If your company continually evaluates its products’ performance competitively against other products in the market place, much of the required data, along with the organisational structure necessary to obtain it, will already exist.
If this is not the case, you will have to obtain the products (buy or rent) or get access to them (how?), to conduct the analysis. In many situations solution of this problem will require some lateral thinking.
Basically, you have to get hold of your competitors’ products, tear them apart and compare them to yours.
A few typical examples are:
• Consumer product: use it then reverse engineer it.
• Computer software: try it out, benchmark it against your software.
• A shop: go and buy something there.
The Engineering Characteristics already identified must be matched up and competitive rankings determined on those specific points. In addition, you should always be on the look out for any other areas in which your competition has the edge on you.
It is important that the QFD team work closely with the test personnel who will conduct the competitive analysis. There will be cases where an Engineering Characteristic cannot be competitively evaluated by a standard company test. In these instances it will be necessary for the team to help design a new test.
Competitive comparisons provide a company with the hard facts about where its products stand technically in relation to its competitors products. This knowledge is vitally important to the QFD team during the analysis stage of the study.
It will rarely prove possible to easily evaluate all of the Engineering Characteristics. Competitive comparisons should become an on going process with team members striving to develop data for every characteristic. In many cases this ideal situation will never be achieved.
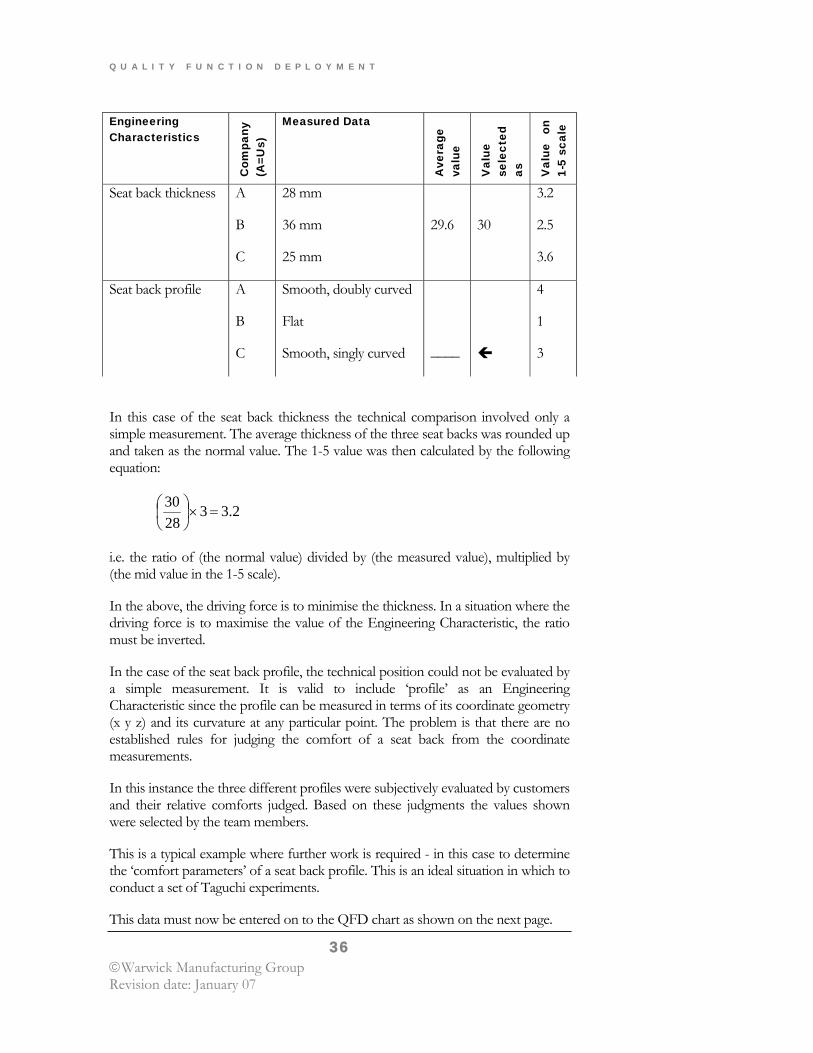
Aircraft Seat Study The method of classification will vary from product to product, as will methods of testing. Below is shown an extract from the Technical Competitive Comparison performed on aircraft seats. You will have to develop your own methods but it is strongly recommended that you lay out the data in a form similar to that shown.
Q U A L I T Y F U N C T I O N D E P L O Y M E N T
36 ©Warwick Manufacturing Group Revision date: January 07
Engineering Characteristics
Com
pany
(A=U
s)
Measured Data
Ave
rage
va
lue
Val
ue
sele
cted
as
Val
ue
on
1-5
scal
e
Seat back thickness A
B
C
28 mm
36 mm
25 mm
29.6
30
3.2
2.5
3.6
Seat back profile A
B
C
Smooth, doubly curved
Flat
Smooth, singly curved
____
4
1
3
In this case of the seat back thickness the technical comparison involved only a simple measurement. The average thickness of the three seat backs was rounded up and taken as the normal value. The 1-5 value was then calculated by the following equation:
2.332830
=×⎟⎠⎞
⎜⎝⎛
i.e. the ratio of (the normal value) divided by (the measured value), multiplied by (the mid value in the 1-5 scale).
In the above, the driving force is to minimise the thickness. In a situation where the driving force is to maximise the value of the Engineering Characteristic, the ratio must be inverted.
In the case of the seat back profile, the technical position could not be evaluated by a simple measurement. It is valid to include ‘profile’ as an Engineering Characteristic since the profile can be measured in terms of its coordinate geometry (x y z) and its curvature at any particular point. The problem is that there are no established rules for judging the comfort of a seat back from the coordinate measurements.
In this instance the three different profiles were subjectively evaluated by customers and their relative comforts judged. Based on these judgments the values shown were selected by the team members.
This is a typical example where further work is required - in this case to determine the ‘comfort parameters’ of a seat back profile. This is an ideal situation in which to conduct a set of Taguchi experiments.
This data must now be entered on to the QFD chart as shown on the next page.
Q U A L I T Y F U N C T I O N D E P L O Y M E N T
37 ©Warwick Manufacturing Group Revision date: January 07
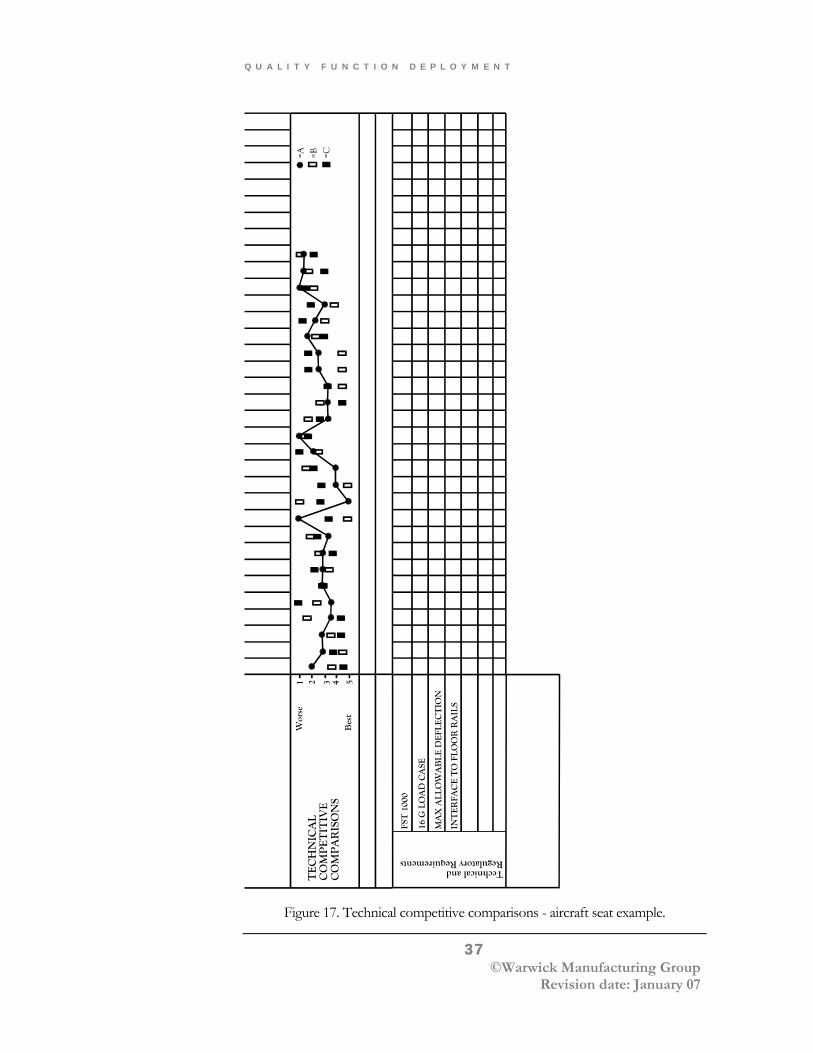
Figure 17. Technical competitive comparisons - aircraft seat example.
Q U A L I T Y F U N C T I O N D E P L O Y M E N T
38 ©Warwick Manufacturing Group Revision date: January 07
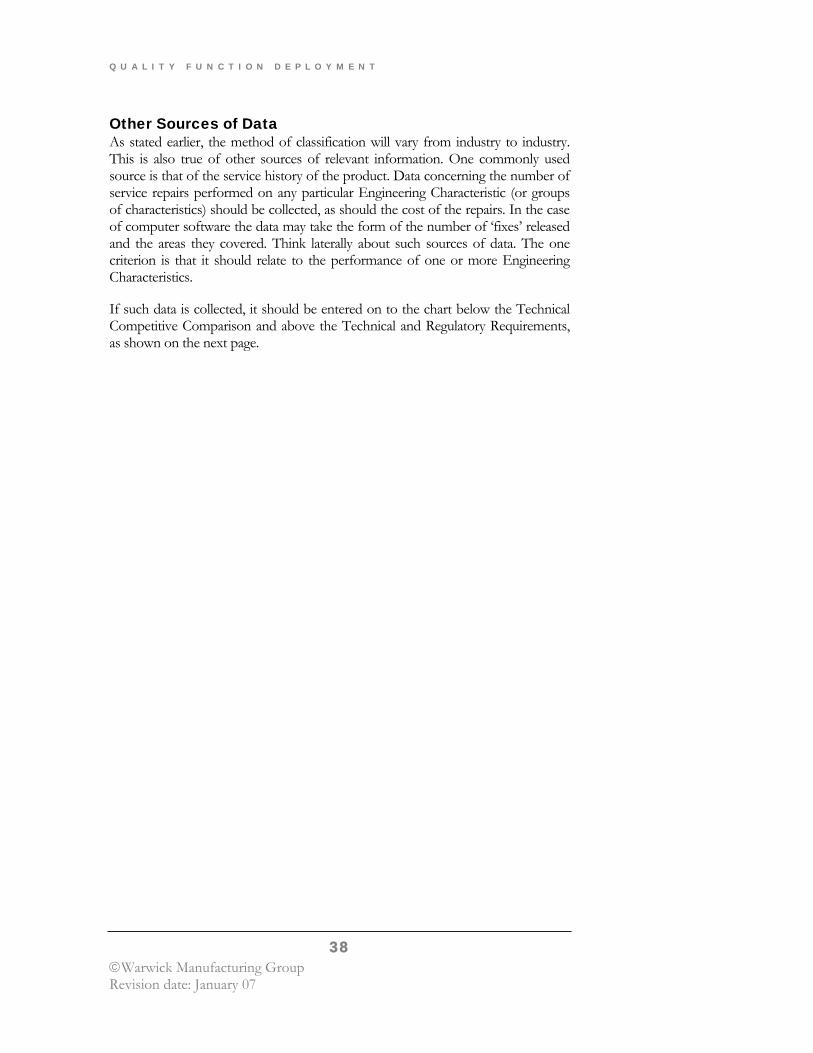
Other Sources of Data As stated earlier, the method of classification will vary from industry to industry. This is also true of other sources of relevant information. One commonly used source is that of the service history of the product. Data concerning the number of service repairs performed on any particular Engineering Characteristic (or groups of characteristics) should be collected, as should the cost of the repairs. In the case of computer software the data may take the form of the number of ‘fixes’ released and the areas they covered. Think laterally about such sources of data. The one criterion is that it should relate to the performance of one or more Engineering Characteristics.
If such data is collected, it should be entered on to the chart below the Technical Competitive Comparison and above the Technical and Regulatory Requirements, as shown on the next page.
Q U A L I T Y F U N C T I O N D E P L O Y M E N T
39 ©Warwick Manufacturing Group Revision date: January 07
Figure 18. Other sources of technical data.
Q U A L I T Y F U N C T I O N D E P L O Y M E N T
40 ©Warwick Manufacturing Group Revision date: January 07
Figure 19. Establishing links.
Q U A L I T Y F U N C T I O N D E P L O Y M E N T
41 ©Warwick Manufacturing Group Revision date: January 07
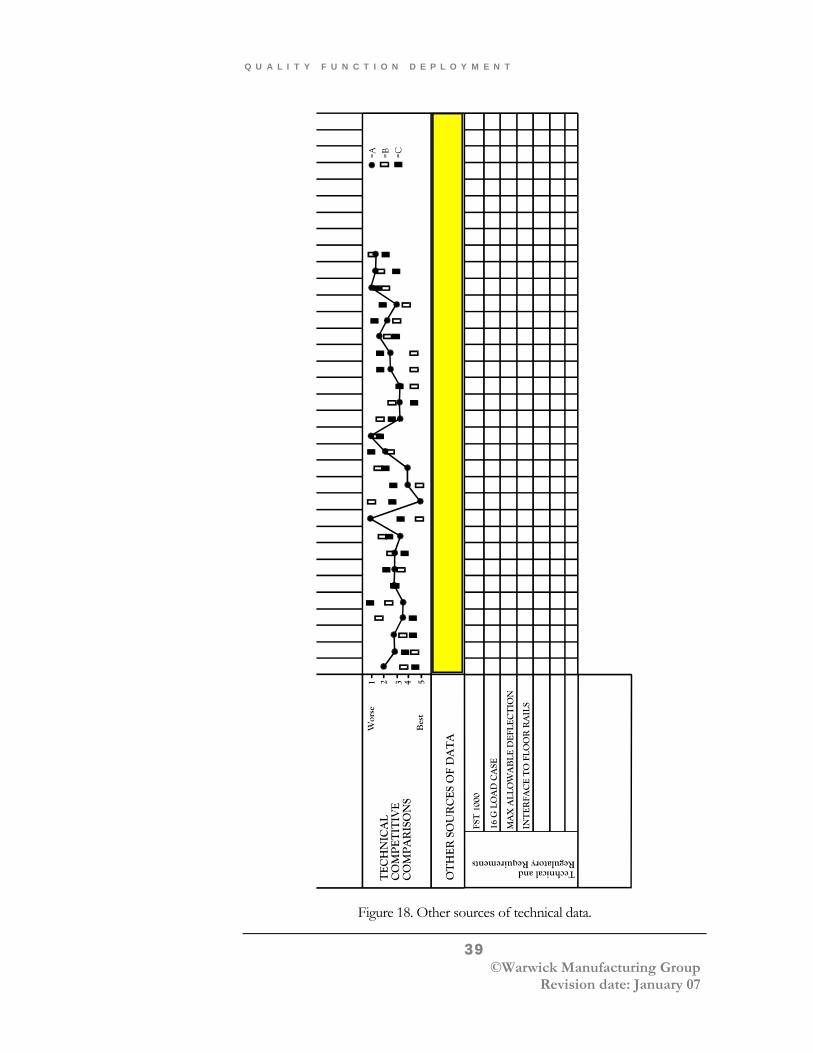
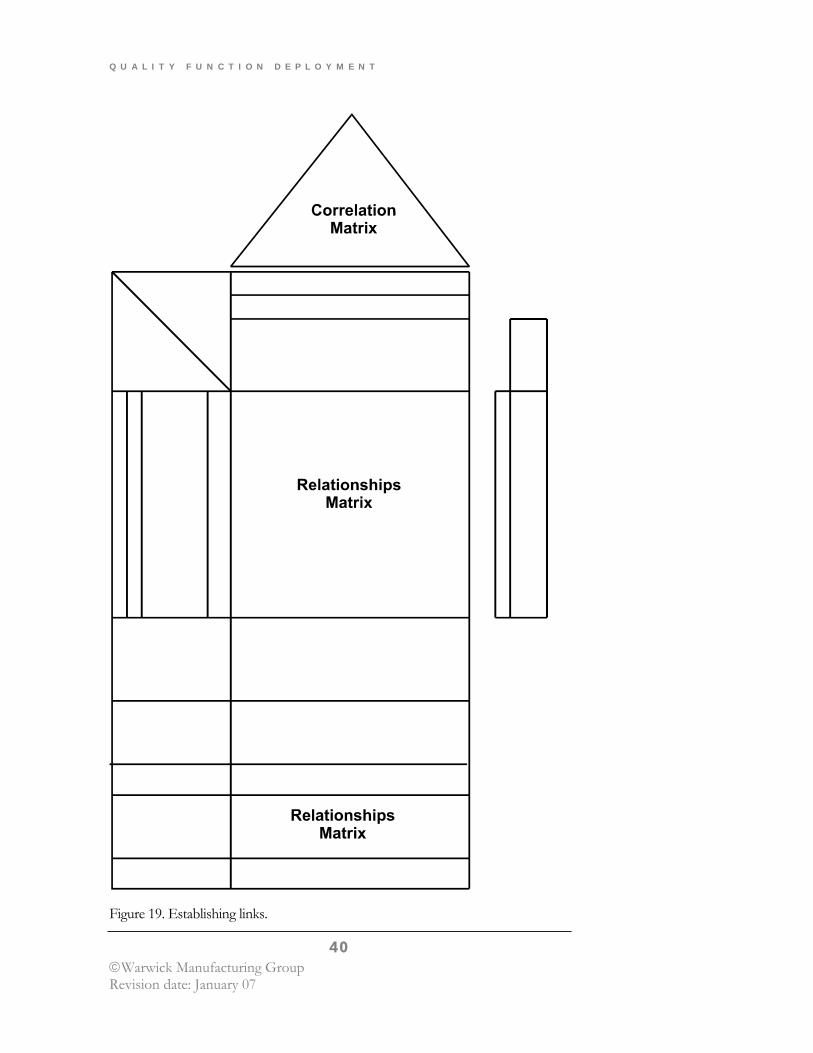
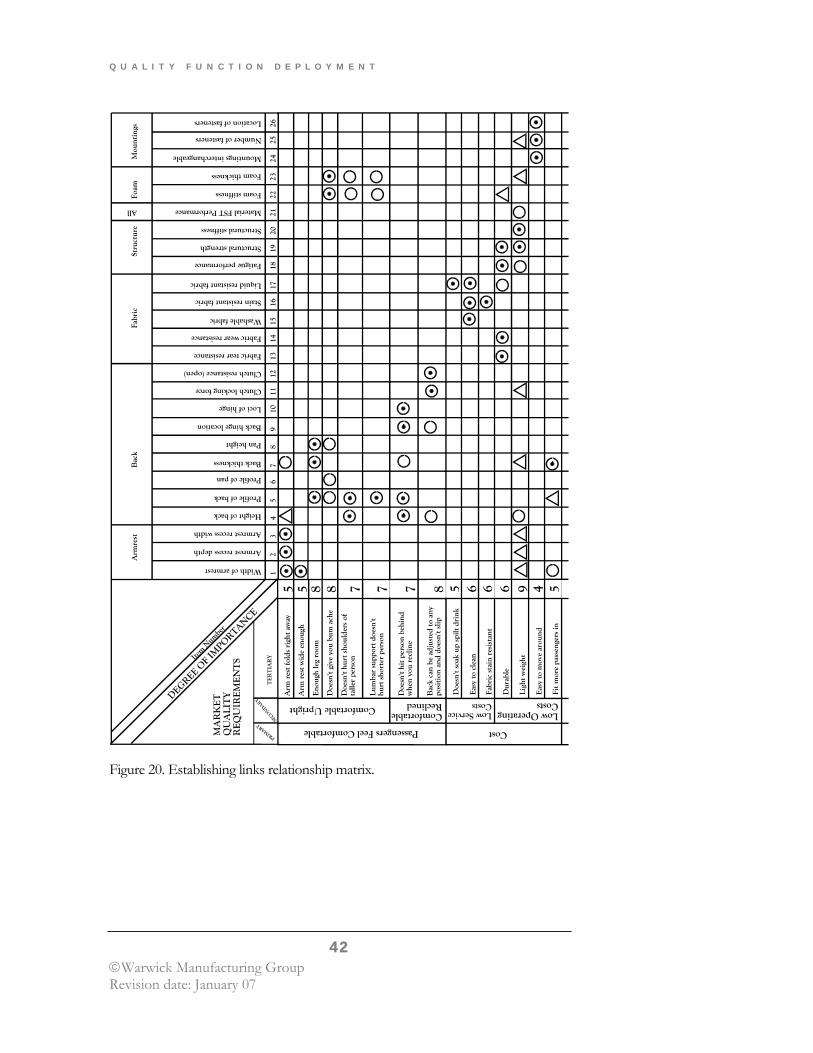
Establishing Links This stage involves filling in the Relationships Matrix in the main body of the chart and the triangular Conflicts Matrix at the top of the chart. The idea is to highlight relationships between Customer Requirements and Engineering Characteristics, and conflict/supporting relationships amongst the Engineering Characteristics. In addition to highlighting the relationships their relative strengths must also be judged and a range of symbols is used to represent this.
Relationships Matrix This matrix highlights the relationships between the Customer Requirements and the Engineering Characteristics. It must also be remembered to include the Technical and Regulatory Requirements in the correlation.
The team members should seek consensus on these evaluations, basing them on expert engineering experience, customer responses and data from statistical studies and controlled experiments.
There will be varying degrees of the strength of the relationships and so a set of symbols is used to identify the significance.
The symbols used are:
Strong relationship
Medium relationship
Weak relationship
As an example, an extract from the aircraft seat study is shown on the next page.
Q U A L I T Y F U N C T I O N D E P L O Y M E N T
42 ©Warwick Manufacturing Group Revision date: January 07
Figure 20. Establishing links relationship matrix.
Q U A L I T Y F U N C T I O N D E P L O Y M E N T
43 ©Warwick Manufacturing Group Revision date: January 07
Looking at the first Customer Requirement, Arm rest folds right away, you see that this is strongly related to width of arm rest, arm rest recess depth and arm rest recess width.
In addition, the team felt that there was a weak relationship to the height of back and a medium relationship with the back thickness.
Every intersection between a Customer Requirement and an Engineering Characteristic should be carefully considered. However, it should be noted that in the example shown less than 20% of the available space has actually been used. This is not unusual. In any event, intersection symbols should certainly occupy less than 50% of the available space.
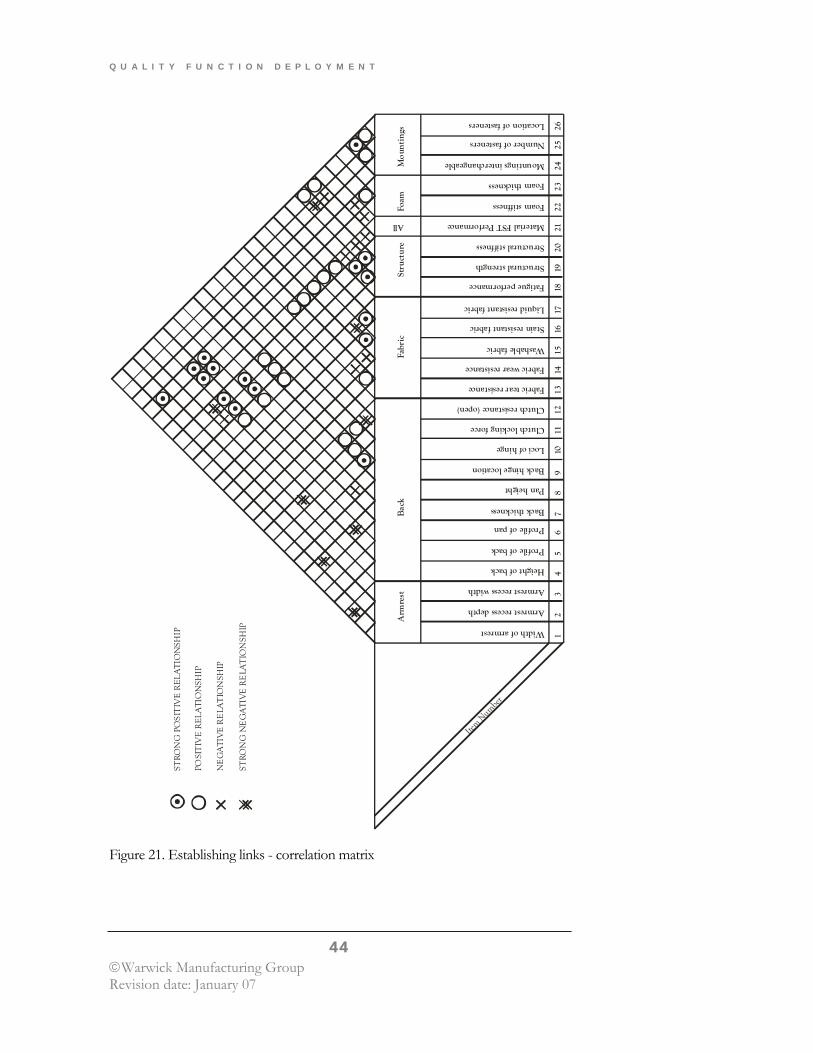
Conflicts Matrix This is the triangular matrix at the top of the chart. It is used to highlight relationships between the Engineering Characteristics. As before, symbols are used to indicate the strength of the relationship but in addition, they also indicate whether it is a positive supporting relationship or a negative conflicting relationship.
The symbols used are:
Strong positive relationship Positive relationship Supportive
Negative relationship Strong negative relationship Conflicting
On the next page is an extract from the aircraft seat study.
Q U A L I T Y F U N C T I O N D E P L O Y M E N T
44 ©Warwick Manufacturing Group Revision date: January 07
Width of armrest
Armrest recess depth
Armrest recess width
Height of back
Profile of back
Profile of pan
Back thickness
Pan height
Back hinge location
Loci of hinge
Clutch locking force
Clutch resistance (open)
Fabric tear resistance
Fabric wear resistance
Washable fabric
Stain resistant fabric
Liquid resistant fabric
Fatigue performance
Structural strength
Structural stiffness
Material FST Performance
Foam stiffness
Foam thickness
Mountings interchangeable
Number of fasteners
Location of fasteners
Arm
rest
Bac
kFa
bric
Stru
ctur
e
All
Foam
Mou
ntin
gs
Item N
umber
12
34
56
78
910
1112
1314
1516
1718
1920
2122
2324
2526
STR
ON
G P
OSI
TIV
E R
ELA
TIO
NSH
IP
POSI
TIV
E R
ELA
TIO
NSH
IP
NE
GA
TIV
E R
ELA
TIO
NSH
IP
STR
ON
G N
EG
AT
IVE
RE
LAT
ION
SHIP
Figure 21. Establishing links - correlation matrix
Q U A L I T Y F U N C T I O N D E P L O Y M E N T
45 ©Warwick Manufacturing Group Revision date: January 07
Consider item 5 ‘Profile of back’.
The matrix is completed by moving up to the beginning of the angled column, then moving along this column to the top right. Again, every intersection should be carefully considered.
The first intersection is with the ‘seat back thickness’. This has been highlighted as a strong negative relationship since they are in conflict. The aim is to have as thin a back as possible, but this would result in a flat back, not a comfortable moulded profile. Moving further along a positive relationship has been shown against ‘Fatigue performance’. This is because a curved profile will increase the rigidity of the back and improve its structural performance. Similar arguments have been used to assign symbols to the rest of the boxes where necessary.
Negative symbols show where a tradeoff situation exists that must be resolved. These will be considered in the next stage when the target values for the Engineering Characteristics are established.
Q U A L I T Y F U N C T I O N D E P L O Y M E N T
46 ©Warwick Manufacturing Group Revision date: January 07
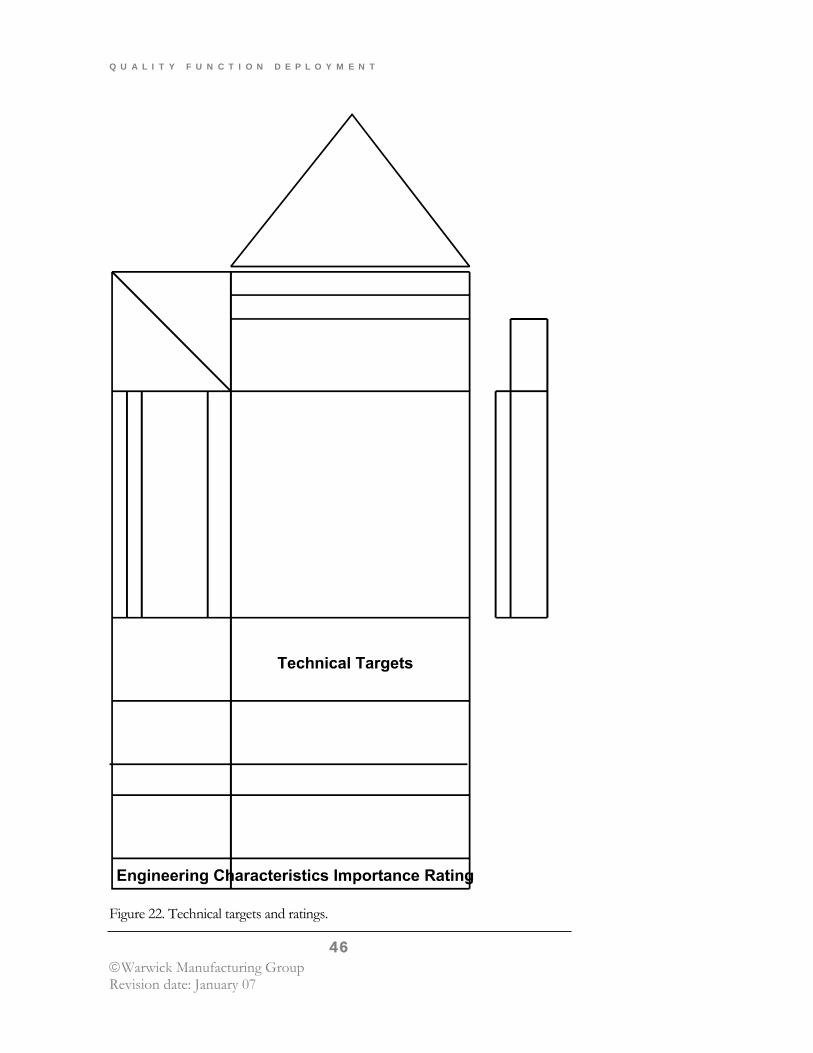
Figure 22. Technical targets and ratings.
Q U A L I T Y F U N C T I O N D E P L O Y M E N T
47 ©Warwick Manufacturing Group Revision date: January 07
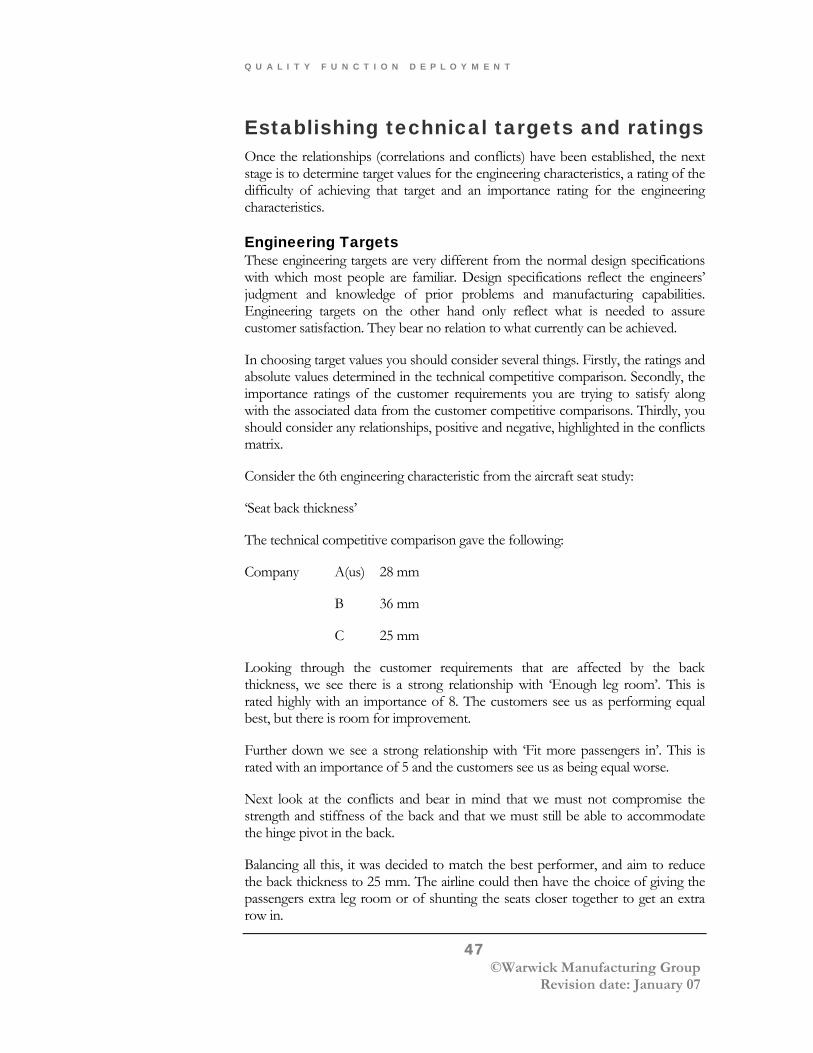
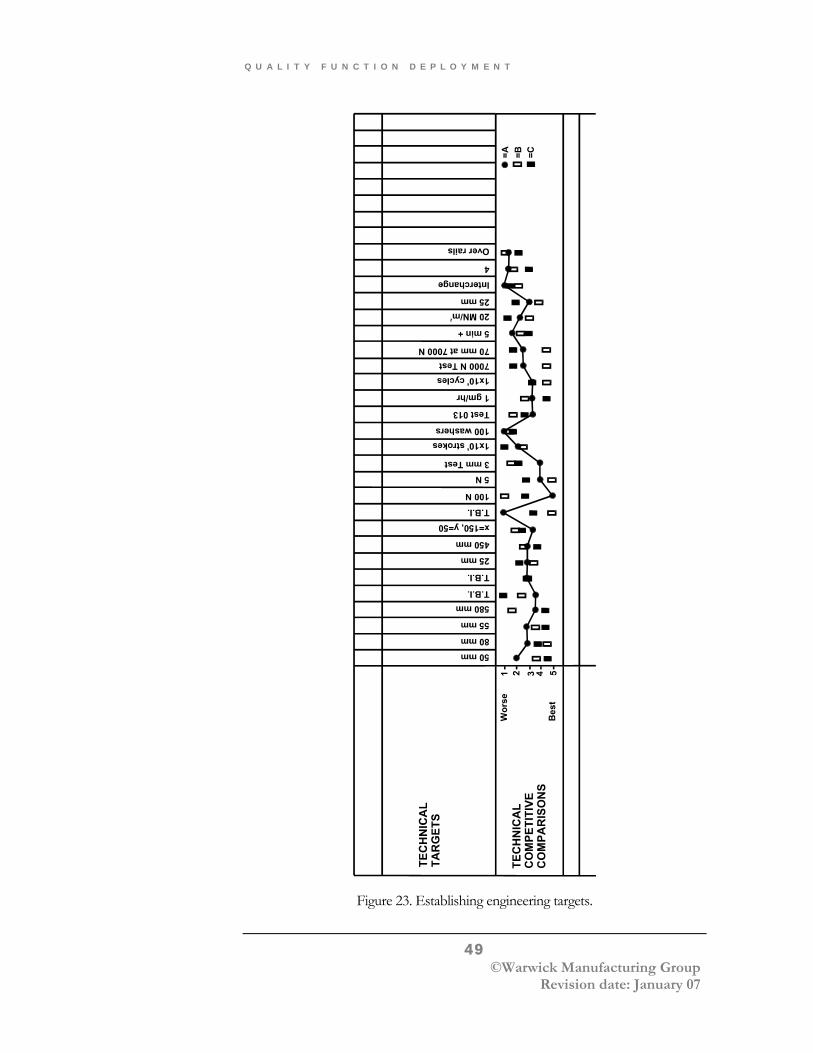
Establishing technical targets and ratings Once the relationships (correlations and conflicts) have been established, the next stage is to determine target values for the engineering characteristics, a rating of the difficulty of achieving that target and an importance rating for the engineering characteristics.
Engineering Targets These engineering targets are very different from the normal design specifications with which most people are familiar. Design specifications reflect the engineers’ judgment and knowledge of prior problems and manufacturing capabilities. Engineering targets on the other hand only reflect what is needed to assure customer satisfaction. They bear no relation to what currently can be achieved.
In choosing target values you should consider several things. Firstly, the ratings and absolute values determined in the technical competitive comparison. Secondly, the importance ratings of the customer requirements you are trying to satisfy along with the associated data from the customer competitive comparisons. Thirdly, you should consider any relationships, positive and negative, highlighted in the conflicts matrix.
Consider the 6th engineering characteristic from the aircraft seat study:
‘Seat back thickness’
The technical competitive comparison gave the following:
Company A(us) 28 mm
B 36 mm
C 25 mm
Looking through the customer requirements that are affected by the back thickness, we see there is a strong relationship with ‘Enough leg room’. This is rated highly with an importance of 8. The customers see us as performing equal best, but there is room for improvement.
Further down we see a strong relationship with ‘Fit more passengers in’. This is rated with an importance of 5 and the customers see us as being equal worse.
Next look at the conflicts and bear in mind that we must not compromise the strength and stiffness of the back and that we must still be able to accommodate the hinge pivot in the back.
Balancing all this, it was decided to match the best performer, and aim to reduce the back thickness to 25 mm. The airline could then have the choice of giving the passengers extra leg room or of shunting the seats closer together to get an extra row in.

Q U A L I T Y F U N C T I O N D E P L O Y M E N T
48 ©Warwick Manufacturing Group Revision date: January 07
A similar process was used to determine target values for all the engineering characteristics. When we come to the analysis stage and study the completed chart, a few of the values may have to be slightly modified. The number requiring modification will depend upon how well this stage was performed.
Q U A L I T Y F U N C T I O N D E P L O Y M E N T
49 ©Warwick Manufacturing Group Revision date: January 07
Figure 23. Establishing engineering targets.
Q U A L I T Y F U N C T I O N D E P L O Y M E N T
50 ©Warwick Manufacturing Group Revision date: January 07
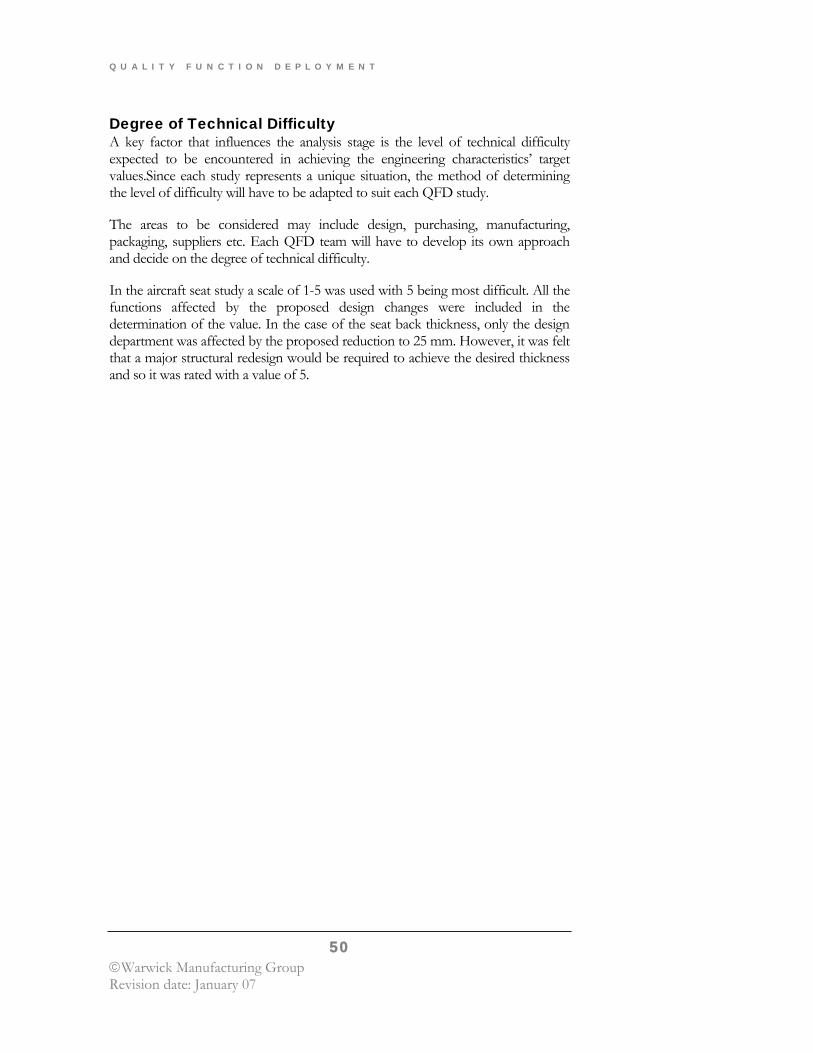
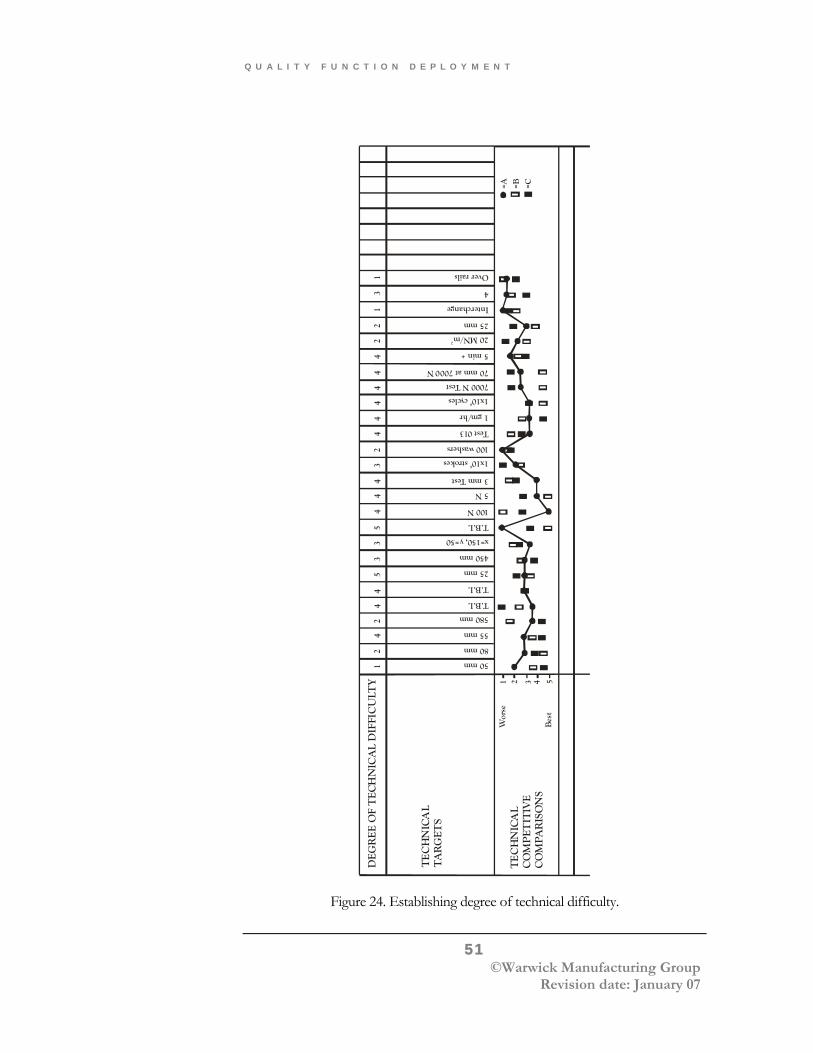
Degree of Technical Difficulty A key factor that influences the analysis stage is the level of technical difficulty expected to be encountered in achieving the engineering characteristics’ target values.Since each study represents a unique situation, the method of determining the level of difficulty will have to be adapted to suit each QFD study.
The areas to be considered may include design, purchasing, manufacturing, packaging, suppliers etc. Each QFD team will have to develop its own approach and decide on the degree of technical difficulty.
In the aircraft seat study a scale of 1-5 was used with 5 being most difficult. All the functions affected by the proposed design changes were included in the determination of the value. In the case of the seat back thickness, only the design department was affected by the proposed reduction to 25 mm. However, it was felt that a major structural redesign would be required to achieve the desired thickness and so it was rated with a value of 5.
Q U A L I T Y F U N C T I O N D E P L O Y M E N T
51 ©Warwick Manufacturing Group Revision date: January 07
DE
GR
EE
OF
TE
CH
NIC
AL
DIF
FIC
ULT
Y 54321=A =B =C
Wor
se
Bes
t
TE
CH
NIC
AL
CO
MP
ETIT
IVE
CO
MPA
RIS
ON
S
TE
CH
NIC
AL
TA
RG
ETS
50 mm
80 mm
55 mm
580 mm
T.B.I.
T.B.I.
T.B.I.
25 mm
450 mm
x=150, y=50
100 N
5 N
3 mm Test
1x10 strokes6
100 washers
Test 013
1 gm/hr
1x10 cycles6
7000 N Test
70 mm at 7000 N
5 min +
20 MN/m2
25 mm
Interchange
4
Over rails
12
42
44
53
35
44
43
24
44
44
42
21
31
Figure 24. Establishing degree of technical difficulty.
Q U A L I T Y F U N C T I O N D E P L O Y M E N T
52 ©Warwick Manufacturing Group Revision date: January 07
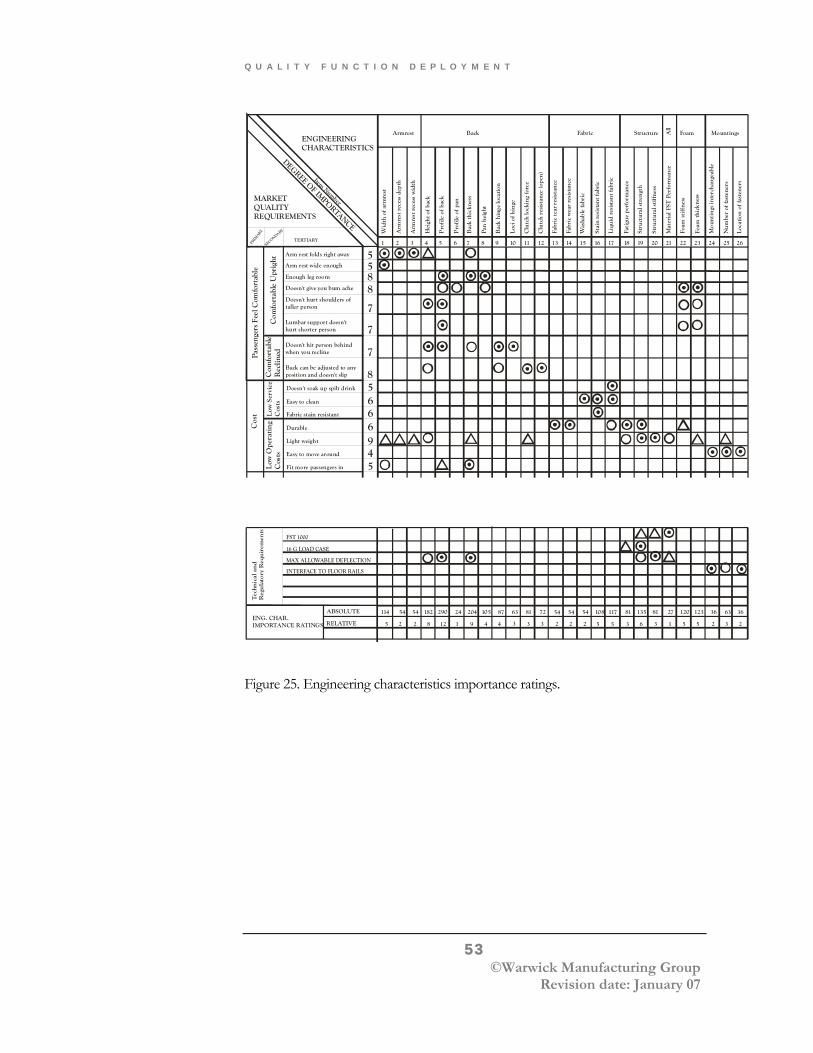
Engineering Characteristic Importance Rating These ratings are a combination of the customer importance rating and the strength of the relationships between the customer requirements and the engineering characteristics.
Values are assigned to the correlation symbols. The recommended values are:
Strong relationship = 9
Medium relationship = 3
Weak relationship = 1
The ratings are calculated by summing down each column the product of the customer importance rating and the value assigned to the correlation symbol.
As an example consider the first column in the aircraft seat example, the ‘Width of the armrest’. The absolute importance rating of 114 is calculated from:
(5 x 9) + (5 x 9) + (9 x 1) + (5 x 3) = 114
The relative value is simply the absolute value expressed as a percentage of the total.
Q U A L I T Y F U N C T I O N D E P L O Y M E N T
53 ©Warwick Manufacturing Group Revision date: January 07
MARKETQUALITYREQUIREMENTS
ENGINEERINGCHARACTERISTICS
PRIMARY
SECONDARY
TERTIARY
Arm rest folds right away
Arm rest wide enough
Enough leg room
Doesn't give you bum ache
Doesn't hurt shoulders oftaller person
Lumbar support doesn'thurt shorter person
Doesn't hit person behindwhen you recline
Back can be adjusted to anyposition and doesn't slip
Com
fort
able
Upr
ight
Com
fort
able
Rec
linedPa
ssen
gers
Fee
l Com
fort
able
5588
7
7
7
8
DEGREE OF IMPORTANCE
Wid
th o
f arm
rest
Arm
rest
rec
ess
dept
h
Arm
rest
rec
ess
wid
th
Hei
ght o
f bac
k
Pro
file
of b
ack
Pro
file
of p
an
Bac
k th
ickn
ess
Pan
heig
ht
Bac
k hi
nge
loca
tion
Loci
of h
inge
Clu
tch
lock
ing
forc
e
Clu
tch
resis
tanc
e (o
pen)
Fabr
ic te
ar r
esis
tanc
e
Fabr
ic w
ear
resi
stan
ce
Was
habl
e fa
bric
Stai
n re
sist
ant f
abri
c
Liqu
id r
esist
ant f
abri
c
Fati
gue
perf
orm
ance
Stru
ctur
al st
reng
th
Stru
ctur
al st
iffne
ss
Mat
eria
l FST
Per
form
ance
Foam
stiff
ness
Foam
thic
knes
s
Mou
ntin
gs in
terc
hang
eabl
e
Num
ber
of fa
sten
ers
Loca
tion
of fa
sten
ers
Armrest Back Fabric Structure All
Foam Mountings
Item Number
1 2 3 4 5 6 7 8 9 10 11 12 13 14 15 16 17 18 19 20 21 22 23 24 25 26
Doesn't soak up spilt drink
Easy to clean
Fabric stain resistant
Durable
Light weight
Easy to move around
Fit more passengers in
Low
Ser
vice
Cos
tsL
ow O
pera
ting
Cos
ts
Cos
t
5666945
Tec
hnic
al a
nd
Reg
ula
tory
Req
uir
emen
ts
FST 1000
16 G LOAD CASE
MAX ALLOWABLE DEFLECTION
INTERFACE TO FLOOR RAILS
ENG. CHAR. IMPORTANCE RATINGS
ABSOLUTE
RELATIVE
114
5
54
2
54
2
182
8
290
12
24
1
204
9
105
4
87
4
63
3
81
3
72
3
54
2
54
2
54
2
108
5
117
5
81
3
135
6
81
3
27
1
120
5
123
5
36
2
63
3
36
2
Figure 25. Engineering characteristics importance ratings.
Q U A L I T Y F U N C T I O N D E P L O Y M E N T
54 ©Warwick Manufacturing Group Revision date: January 07
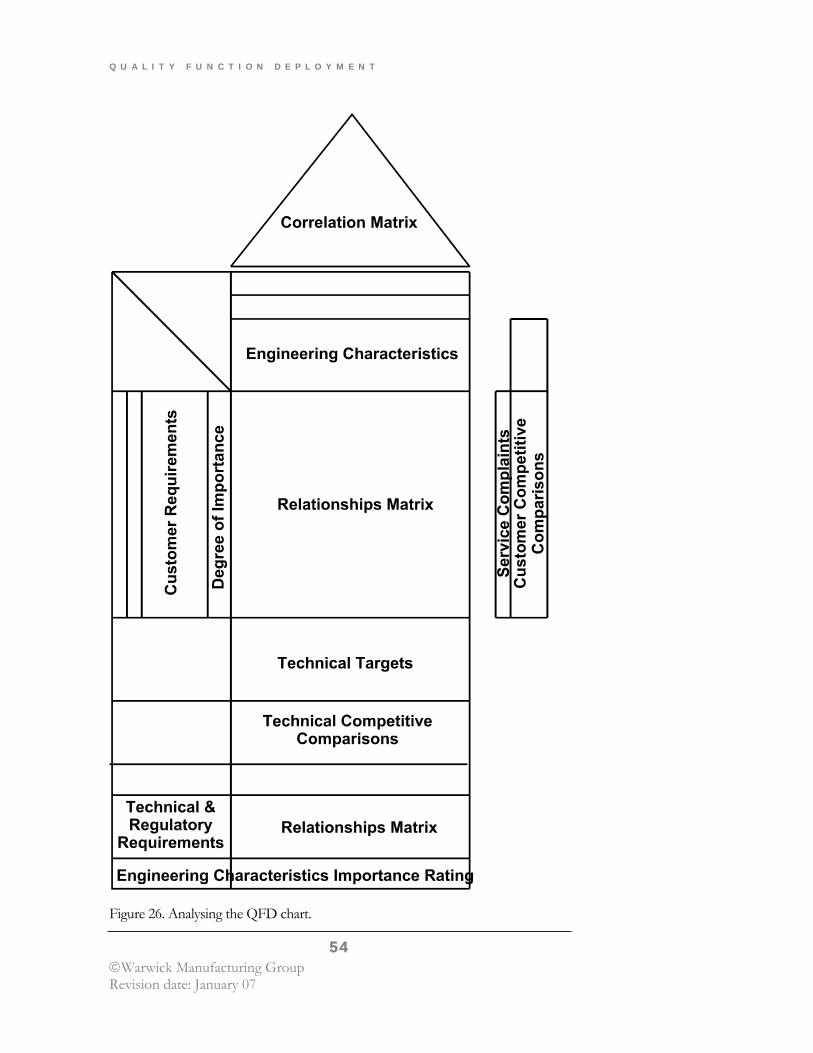
Figure 26. Analysing the QFD chart.
Q U A L I T Y F U N C T I O N D E P L O Y M E N T
55 ©Warwick Manufacturing Group Revision date: January 07
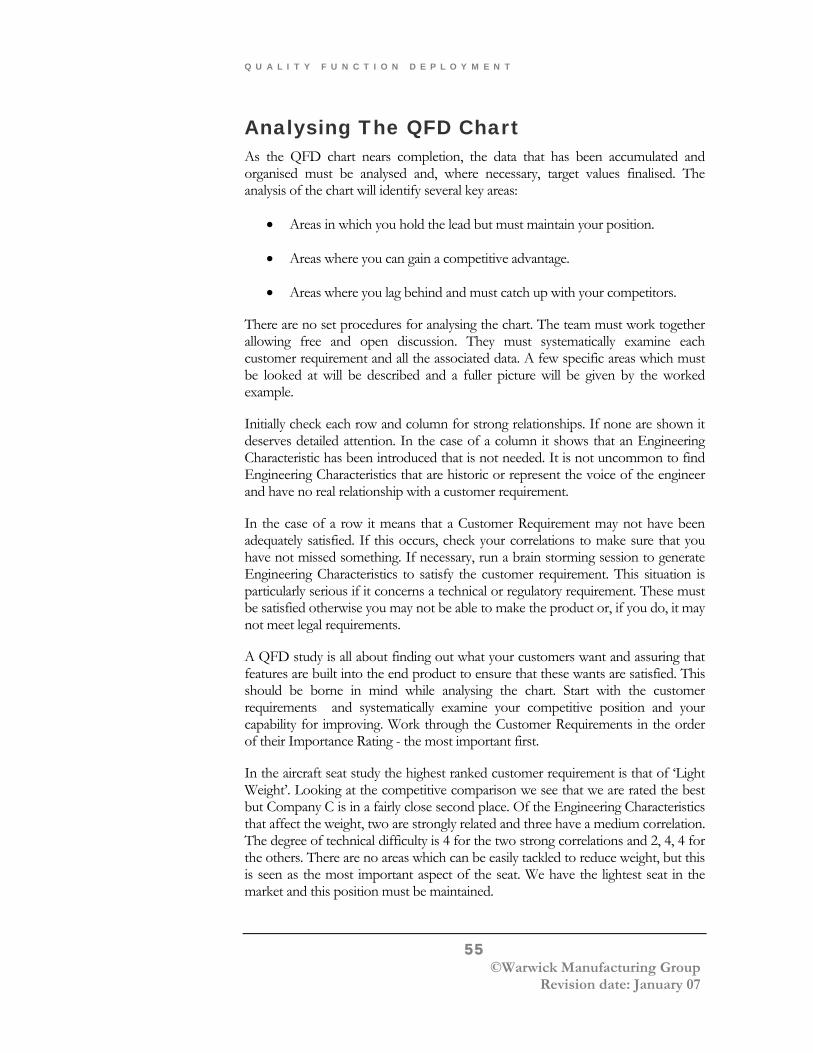
Analysing The QFD Chart As the QFD chart nears completion, the data that has been accumulated and organised must be analysed and, where necessary, target values finalised. The analysis of the chart will identify several key areas:
• Areas in which you hold the lead but must maintain your position.
• Areas where you can gain a competitive advantage.
• Areas where you lag behind and must catch up with your competitors.
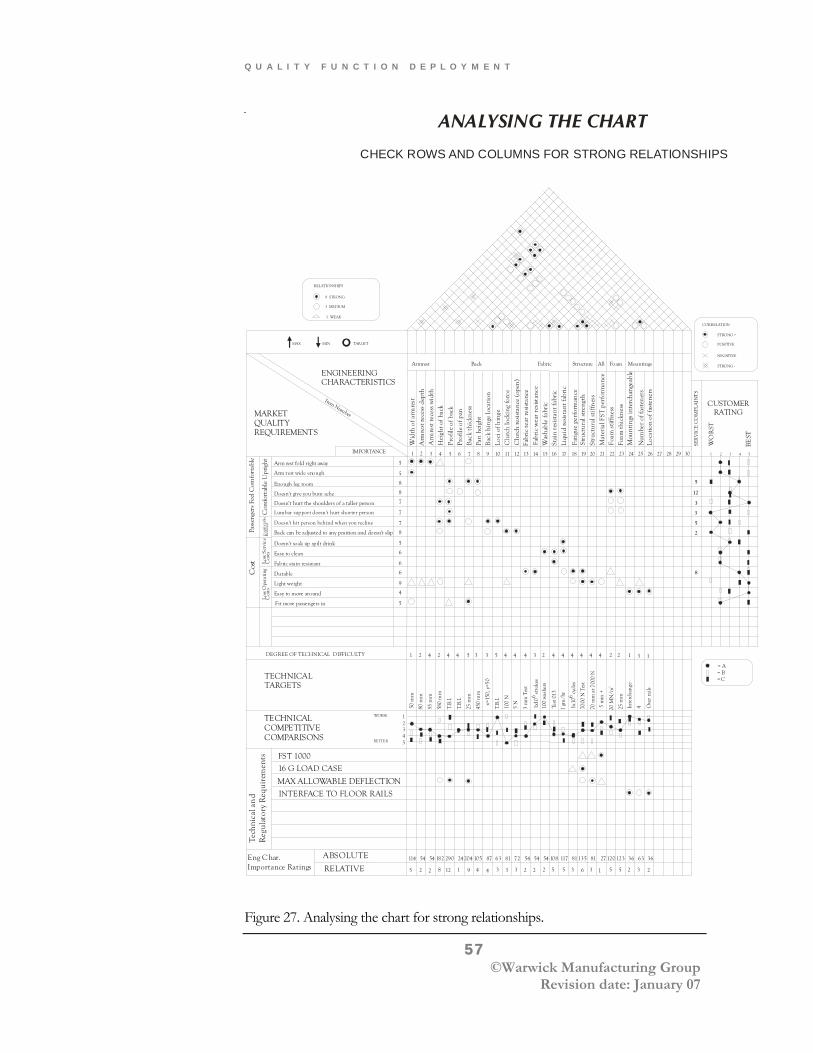
There are no set procedures for analysing the chart. The team must work together allowing free and open discussion. They must systematically examine each customer requirement and all the associated data. A few specific areas which must be looked at will be described and a fuller picture will be given by the worked example.
Initially check each row and column for strong relationships. If none are shown it deserves detailed attention. In the case of a column it shows that an Engineering Characteristic has been introduced that is not needed. It is not uncommon to find Engineering Characteristics that are historic or represent the voice of the engineer and have no real relationship with a customer requirement.
In the case of a row it means that a Customer Requirement may not have been adequately satisfied. If this occurs, check your correlations to make sure that you have not missed something. If necessary, run a brain storming session to generate Engineering Characteristics to satisfy the customer requirement. This situation is particularly serious if it concerns a technical or regulatory requirement. These must be satisfied otherwise you may not be able to make the product or, if you do, it may not meet legal requirements.
A QFD study is all about finding out what your customers want and assuring that features are built into the end product to ensure that these wants are satisfied. This should be borne in mind while analysing the chart. Start with the customer requirements and systematically examine your competitive position and your capability for improving. Work through the Customer Requirements in the order of their Importance Rating - the most important first.
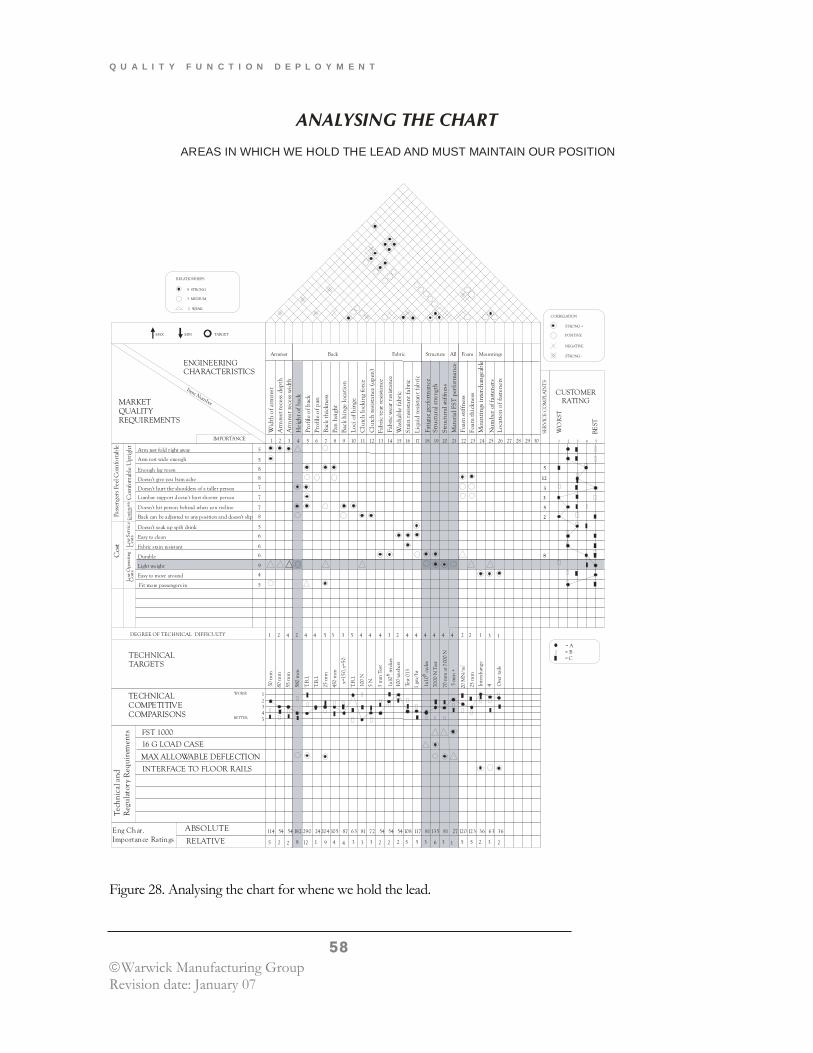
In the aircraft seat study the highest ranked customer requirement is that of ‘Light Weight’. Looking at the competitive comparison we see that we are rated the best but Company C is in a fairly close second place. Of the Engineering Characteristics that affect the weight, two are strongly related and three have a medium correlation. The degree of technical difficulty is 4 for the two strong correlations and 2, 4, 4 for the others. There are no areas which can be easily tackled to reduce weight, but this is seen as the most important aspect of the seat. We have the lightest seat in the market and this position must be maintained.
Q U A L I T Y F U N C T I O N D E P L O Y M E N T
56 ©Warwick Manufacturing Group Revision date: January 07
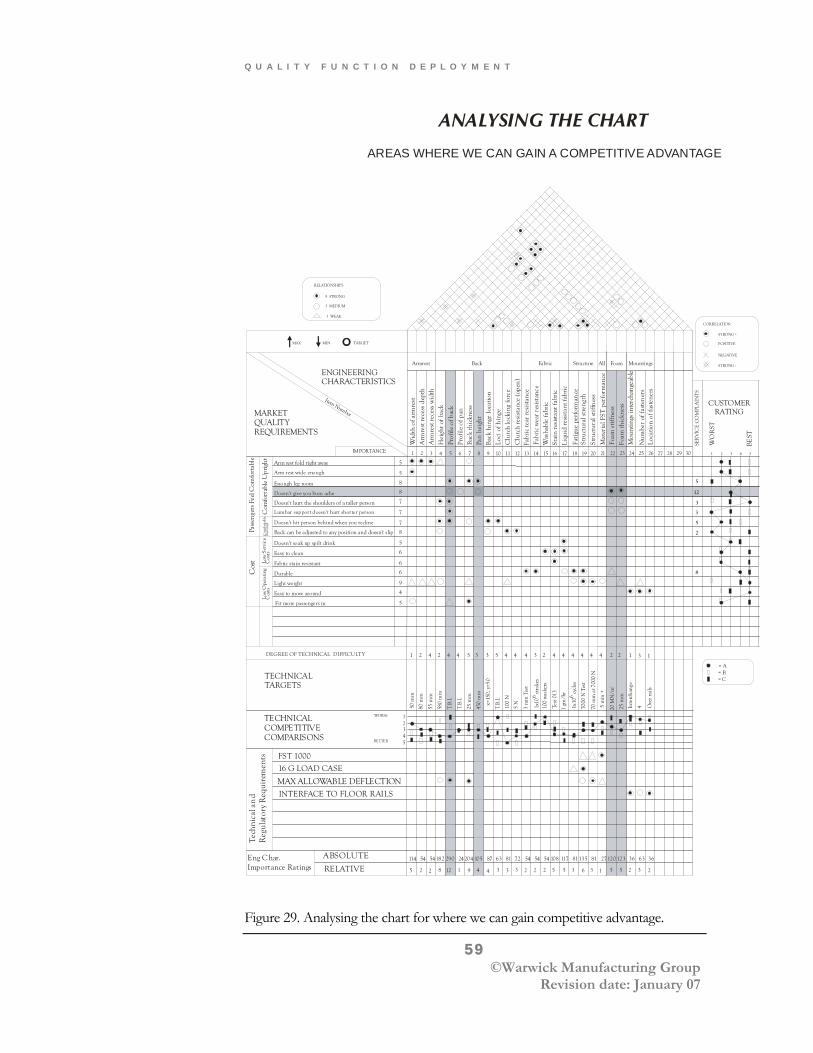
Looking at ‘Doesn’t give you bum ache’ as the next customer requirement, we see that this has an importance of 8 and all the seats are competitively ranked equal with a rating of 3. There is clearly an opportunity here to gain a competitive advantage if the technical problems can be overcome. The strong relationships are with pan profile, foam hardness and foam thickness.
The foam can easily be changed (technical difficulty = 2) but the pan profile has a difficulty of 4 associated with it. If the pan profile can be improved we can take the lead.
Further through the analysis we see that we are rated as the worst performer for ‘short person lumbar comfort’. This has an importance rating of 7. The factor which strongly affects this is the back profile, along with foam hardness and foam thickness of secondary importance. This is clearly an area in which we must improve. The technical difficulty of changing the foam is only 2. This maybe the route forward to tackle the problem in the short term. Longer term the back profile must be modified to make it more comfortable.
As stated earlier, the target values are the levels of performance required for each engineering characteristic to fulfill customer expectations. They must not be based on any level of capability. If during the analysis stage it becomes apparent that the above has not been honoured, then the target value must be modified.
Q U A L I T Y F U N C T I O N D E P L O Y M E N T
57 ©Warwick Manufacturing Group Revision date: January 07
RELATIONSHIPS
9 STRONG
3 MEDIUM
1 WEAK
CORRELATION
STRONG +
POSITIVE
NEGATIVE
STRONG -
CUSTOMERRATING
1 2 3 4 5
WO
RST
BEST
SER
VIC
E C
OM
PLA
INT
S
1 2 3 4 5 6 7 8 9 10 11 12 13 14 15 16 17 18 19 20
MAX MIN TARGET
ENGINEERINGCHARACTERISTICS
IMPORTANCE
DEGREE OF TECHNICAL DIFFICULTY
TECHNICALTARGETS
TECHNICALCOMPETITIVECOMPARISONS
WORSE
BETTER4321
5
Tech
nica
l an
dR
egul
ator
y R
equi
rem
ents
Eng Char.Importance Ratings
ABSOLUTE
RELATIVE
MARKETQUALITYREQUIREMENTS
21 22 23 24 25 26 27 28 29 30
= B= A
= C
50 m
m
80 m
m
55 m
m
580
mm
T.B.
I.
T.B.
I.
25 m
m
450
mm
x=15
0, y
=50
T.B.
I.
100
N
5 N
3 m
m T
est
1x10
6 stro
kes
1x10
6 cyc
les
100
wash
ers
Test
013
1 gm
/hr
7000
N T
est
70 m
m a
t 700
0 N
5 m
in +
20 M
N/m
2
25 m
m
Inte
rcha
nge
4 Ove
r ra
ils1 2 4 2 4 4 5 3 3 5 4 4 4 3 2 4 4 4 4 4 4 2 2 1 3 1
Arm rest fold right away
Arm rest wide enough
Enough leg room
Doesn't give you bum ache
Doesn't hurt the shoulders of a taller person
Lumbar support doesn't hurt shorter person
Doesn't hit person behind when you recline
Back can be adjusted to any position and doesn't slip
Doesn't soak up spilt drink
Easy to clean
Fabric stain resistant
Durable
Light weight
Easy to move around
Com
fort
able
Upr
ight
Com
fort
able
Rec
lined
Low
Ser
vice
Cos
tsLo
w O
pera
ting
Cos
ts
Pass
enge
rs F
eel C
omfo
rtab
leC
ost
Wid
th o
f arm
rest
Arm
rest
rece
ss d
epth
Arm
rest
rece
ss w
idth
Hei
ght o
f ba
ck
Prof
ile o
f bac
kPr
ofile
of p
anB
ack
thic
knes
sPa
n he
ight
Bac
k hi
nge
loca
tion
Loci
of h
inge
Clu
tch
lock
ing
forc
e
Clu
tch
resi
stan
ce (o
pen
)Fa
bric
tear
resi
stan
ce
Fabr
ic w
ear
resi
stan
ceW
asha
ble
fabr
icSt
ain
resi
stan
t fab
ric
Liqu
id r
esis
tant
fabr
ic
Fati
gue
perf
orm
ance
Stru
ctur
al s
tren
gth
Stru
ctur
al s
tiffn
ess
Mat
eria
l FST
per
form
ance
Foam
stif
fnes
sFo
am th
ickn
ess
Mou
ntin
gs in
terc
hang
eabl
e
Num
ber
of fa
sten
ers
Loca
tion
of fa
sten
ers
Armrest Back Fabric Structure All Foam Mountings
FST 1000
16 G LOAD CASE
MAX ALLOWABLE DEFLECTIONINTERFACE TO FLOOR RAILS
114 54 54 182 290 24204 105 87 63 81 72 54 54 54 108 117 81 135 81 27120 123 36 63 36
5 2 2 8 12 1 9 4 4 3 3 3 2 2 2 5 5 3 6 3 1 5 5 2 3 2
5
5
8
8
7
7
7
8
5
6
6
6
9
4
5
5
12
3
3
5
2
8
Item Number
Fit more passengers in
ANALYSING THE CHART
CHECK ROWS AND COLUMNS FOR STRONG RELATIONSHIPS
Figure 27. Analysing the chart for strong relationships.
Q U A L I T Y F U N C T I O N D E P L O Y M E N T
58 ©Warwick Manufacturing Group Revision date: January 07
RELATIONSHIPS
9 STRONG
3 MEDIUM
1 WEAK
CORRELATION
STRONG +
POSITIVE
NEGATIVE
STRONG -
CUSTOMERRATING
1 2 3 4 5
WO
RST
BEST
SER
VIC
E C
OM
PLA
INT
S
1 2 3 4 5 6 7 8 9 10 11 12 13 14 15 16 17 18 19 20
MAX MIN TARGET
ENGINEERINGCHARACTERISTICS
IMPORTANCE
DEGREE OF TECHNICAL DIFFICULTY
TECHNICALTARGETS
TECHNICALCOMPETITIVECOMPARISONS
WORSE
BETTER4321
5
Tech
nica
l and
Reg
ulat
ory
Req
uire
men
ts
Eng Char.Importance Ratings
ABSOLUTE
RELATIVE
MARKETQUALITYREQUIREMENTS
21 22 23 24 25 26 27 28 29 30
= B= A
= C
50 m
m
80 m
m
55 m
m
580
mm
T.B.
I.
T.B.
I.
25 m
m
450
mm
x=15
0, y
=50
T.B.
I.
100
N
5 N
3 m
m T
est
1x10
6 stro
kes
1x10
6 cyc
les
100
wash
ers
Test
013
1 gm
/hr
7000
N T
est
70 m
m a
t 700
0 N
5 m
in +
20 M
N/m
2
25 m
m
Inte
rcha
nge
4 Ove
r ra
ils
1 2 4 2 4 4 5 3 3 5 4 4 4 3 2 4 4 4 4 4 4 2 2 1 3 1
Arm rest fold right away
Arm rest wide enough
Enough leg room
Doesn't give you bum ache
Doesn't hurt the shoulders of a taller person
Lumbar support doesn't hurt shorter person
Doesn't hit person behind when you recline
Back can be adjusted to any position and doesn't slip
Doesn't soak up spilt drink
Easy to clean
Fabric stain resistant
Durable
Light weight
Easy to move around
Com
fort
able
Upr
ight
Com
fort
able
Rec
lined
Low
Ser
vice
Cos
tsLo
w O
pera
ting
Cos
ts
Pass
enge
rs F
eel C
omfo
rtab
leC
ost
Wid
th o
f arm
rest
Arm
rest
rece
ss d
epth
Arm
rest
rece
ss w
idth
Hei
ght o
f ba
ck
Prof
ile o
f bac
kPr
ofile
of p
anB
ack
thic
knes
sPa
n he
ight
Bac
k hi
nge
loca
tion
Loci
of h
inge
Clu
tch
lock
ing
forc
e
Clu
tch
resi
stan
ce (o
pen
)Fa
bric
tear
resi
stan
ce
Fabr
ic w
ear
resi
stan
ceW
asha
ble
fabr
icSt
ain
resi
stan
t fab
ric
Liqu
id r
esis
tan
t fab
ric
Fati
gue
perf
orm
ance
Stru
ctur
al s
tren
gth
Stru
ctur
al s
tiffn
ess
Mat
eria
l FST
per
form
ance
Foam
stif
fnes
sFo
am th
ickn
ess
Mou
ntin
gs in
terc
hang
eabl
e
Num
ber
of fa
sten
ers
Loca
tion
of fa
sten
ers
Armrest Back Fabric Structure All Foam Mountings
FST 1000
16 G LOAD CASE
MAX ALLOWABLE DEFLECTIONINTERFACE TO FLOOR RAILS
114 54 54 182 290 24204 105 87 63 81 72 54 54 54 108 117 81135 81 27 120 123 36 63 36
5 2 2 8 12 1 9 4 4 3 3 3 2 2 2 5 5 3 6 3 1 5 5 2 3 2
5
5
8
8
7
7
7
8
5
6
6
6
9
4
5
5
12
3
3
5
2
8
Item Number
Fit more passengers in
ANALYSING THE CHART
AREAS IN WHICH WE HOLD THE LEAD AND MUST MAINTAIN OUR POSITION
Light weight 9
18 19 20 21
1x10
6 cyc
les
7000
N T
est
70 m
m a
t 700
0 N
5 m
in +
4 4 4 4
Fati
gue
perf
orm
ance
Stru
ctur
al s
tren
gth
Stru
ctur
al s
tiffn
ess
Mat
eria
l FST
per
form
ance
81135 81 27
3 6 3 1
4
580
mm
2
Hei
ght o
f ba
ck
182
8
Figure 28. Analysing the chart for whene we hold the lead.
Q U A L I T Y F U N C T I O N D E P L O Y M E N T
59 ©Warwick Manufacturing Group Revision date: January 07
RELATIONSHIPS
9 STRONG
3 MEDIUM
1 WEAK
CORRELATION
STRONG +
POSITIVE
NEGATIVE
STRONG -
CUSTOMERRATING
1 2 3 4 5
WO
RST
BEST
SER
VIC
E C
OM
PLA
INT
S
1 2 3 4 5 6 7 8 9 10 11 12 13 14 15 16 17 18 19 20
MAX MIN TARGET
ENGINEERINGCHARACTERISTICS
IMPORTANCE
DEGREE OF TECHNICAL DIFFICULTY
TECHNICALTARGETS
TECHNICALCOMPETITIVECOMPARISONS
WORSE
BETTER4321
5
Tech
nica
l an
dR
egul
ator
y R
equi
rem
ents
Eng Char.Importance Ratings
ABSOLUTE
RELATIVE
MARKETQUALITYREQUIREMENTS
21 22 23 24 25 26 27 28 29 30
= B= A
= C
50 m
m
80 m
m
55 m
m
580
mm
T.B.
I.
T.B.
I.
25 m
m
450
mm
x=15
0, y
=50
T.B.
I.
100
N
5 N
3 m
m T
est
1x10
6 stro
kes
1x10
6 cyc
les
100
wash
ers
Test
013
1 gm
/hr
7000
N T
est
70 m
m a
t 700
0 N
5 m
in +
20 M
N/m
2
25 m
m
Inte
rcha
nge
4 Ove
r ra
ils1 2 4 2 4 4 5 3 3 5 4 4 4 3 2 4 4 4 4 4 4 2 2 1 3 1
Arm rest fold right away
Arm rest wide enough
Enough leg room
Doesn't give you bum ache
Doesn't hurt the shoulders of a taller person
Lumbar support doesn't hurt shorter person
Doesn't hit person behind when you recline
Back can be adjusted to any position and doesn't slip
Doesn't soak up spilt drink
Easy to clean
Fabric stain resistant
Durable
Light weight
Easy to move around
Com
fort
able
Upr
ight
Com
fort
able
Rec
lined
Low
Ser
vice
Cos
tsLo
w O
pera
ting
Cos
ts
Pass
enge
rs F
eel C
omfo
rtab
leC
ost
Wid
th o
f arm
rest
Arm
rest
rece
ss d
epth
Arm
rest
rece
ss w
idth
Hei
ght o
f ba
ck
Prof
ile o
f bac
kPr
ofile
of p
anB
ack
thic
knes
sPa
n he
ight
Bac
k hi
nge
loca
tion
Loci
of h
inge
Clu
tch
lock
ing
forc
e
Clu
tch
resi
stan
ce (o
pen
)Fa
bric
tear
resi
stan
ce
Fabr
ic w
ear
resi
stan
ceW
asha
ble
fabr
icSt
ain
resi
stan
t fab
ric
Liqu
id r
esis
tant
fabr
ic
Fati
gue
perf
orm
ance
Stru
ctur
al s
tren
gth
Stru
ctur
al s
tiffn
ess
Mat
eria
l FST
per
form
ance
Foam
stif
fnes
sFo
am th
ickn
ess
Mou
ntin
gs in
terc
hang
eabl
e
Num
ber
of fa
sten
ers
Loca
tion
of fa
sten
ers
Armrest Back Fabric Structure All Foam Mountings
FST 1000
16 G LOAD CASE
MAX ALLOWABLE DEFLECTIONINTERFACE TO FLOOR RAILS
114 54 54 182 290 24204 105 87 63 81 72 54 54 54 108 117 81135 81 27120123 36 63 36
5 2 2 8 12 1 9 4 4 3 3 3 2 2 2 5 5 3 6 3 1 5 5 2 3 2
5
5
8
8
7
7
7
8
5
6
6
6
9
4
5
5
12
3
3
5
2
8
Item Number
Fit more passengers in
ANALYSING THE CHART
AREAS WHERE WE CAN GAIN A COMPETITIVE ADVANTAGE
Doesn't give you bum ache 8 12
22 23
20 M
N/m
2
25 m
m
2 2
Foam
stif
fnes
sFo
am th
ickn
ess
120123
5 5
5T.
B.I.
4
Prof
ile o
f bac
k
290
12
8
450
mm
3
Pan
heig
ht
105
4
Figure 29. Analysing the chart for where we can gain competitive advantage.
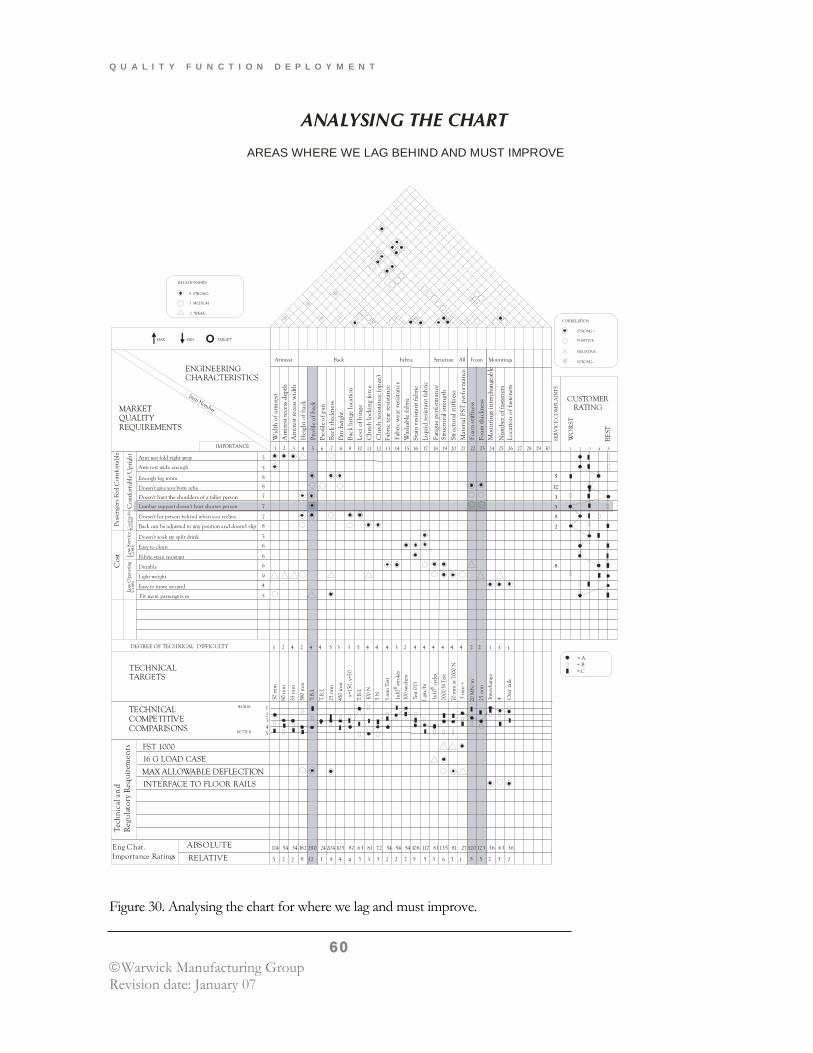
Q U A L I T Y F U N C T I O N D E P L O Y M E N T
60 ©Warwick Manufacturing Group Revision date: January 07
RELATIONSHIPS
9 STRONG
3 MEDIUM
1 WEAK
CORRELATION
STRONG +
POSITIVE
NEGATIVE
STRONG -
CUSTOMERRATING
1 2 3 4 5
WO
RST
BEST
SER
VIC
E C
OM
PLA
INT
S
1 2 3 4 5 6 7 8 9 10 11 12 13 14 15 16 17 18 19 20
MAX MIN TARGET
ENGINEERINGCHARACTERISTICS
IMPORTANCE
DEGREE OF TECHNICAL DIFFICULTY
TECHNICALTARGETS
TECHNICALCOMPETITIVECOMPARISONS
WORSE
BETTER4321
5
Tech
nica
l an
dR
egul
ator
y R
equi
rem
ents
Eng Char.Importance Ratings
ABSOLUTE
RELATIVE
MARKETQUALITYREQUIREMENTS
21 22 23 24 25 26 27 28 29 30
= B= A
= C
50 m
m
80 m
m
55 m
m
580
mm
T.B.
I.
T.B.
I.
25 m
m
450
mm
x=15
0, y
=50
T.B.
I.
100
N
5 N
3 m
m T
est
1x10
6 stro
kes
1x10
6 cyc
les
100
wash
ers
Test
013
1 gm
/hr
7000
N T
est
70 m
m a
t 700
0 N
5 m
in +
20 M
N/m
2
25 m
m
Inte
rcha
nge
4 Ove
r ra
ils
1 2 4 2 4 4 5 3 3 5 4 4 4 3 2 4 4 4 4 4 4 2 2 1 3 1
Arm rest fold right away
Arm rest wide enough
Enough leg room
Doesn't give you bum ache
Doesn't hurt the shoulders of a taller person
Lumbar support doesn't hurt shorter person
Doesn't hit person behind when you recline
Back can be adjusted to any position and doesn't slip
Doesn't soak up spilt drink
Easy to clean
Fabric stain resistant
Durable
Light weight
Easy to move around
Com
fort
able
Upr
ight
Com
fort
able
Rec
lined
Low
Ser
vice
Cos
tsLo
w O
pera
ting
Cos
ts
Pass
enge
rs F
eel C
omfo
rtab
leC
ost
Wid
th o
f arm
rest
Arm
rest
rece
ss d
epth
Arm
rest
rece
ss w
idth
Hei
ght o
f ba
ck
Prof
ile o
f bac
kPr
ofile
of p
anB
ack
thic
knes
sPa
n he
ight
Bac
k hi
nge
loca
tion
Loci
of h
inge
Clu
tch
lock
ing
forc
e
Clu
tch
resi
stan
ce (o
pen
)Fa
bric
tear
resi
stan
ce
Fabr
ic w
ear
resi
stan
ceW
asha
ble
fabr
icSt
ain
resi
stan
t fab
ric
Liqu
id r
esis
tant
fabr
ic
Fati
gue
perf
orm
ance
Stru
ctur
al s
tren
gth
Stru
ctur
al s
tiffn
ess
Mat
eria
l FST
per
form
ance
Foam
stif
fnes
sFo
am th
ickn
ess
Mou
ntin
gs in
terc
hang
eabl
e
Num
ber
of fa
sten
ers
Loca
tion
of fa
sten
ers
Armrest Back Fabric Structure All Foam Mountings
FST 1000
16 G LOAD CASE
MAX ALLOWABLE DEFLECTIONINTERFACE TO FLOOR RAILS
114 54 54 182 290 24204 105 87 63 81 72 54 54 54 108 117 81 135 81 27 120 123 36 63 36
5 2 2 8 12 1 9 4 4 3 3 3 2 2 2 5 5 3 6 3 1 5 5 2 3 2
5
5
8
8
7
7
7
8
5
6
6
6
9
4
5
5
12
3
3
5
2
8
Item Number
Fit more passengers in
ANALYSING THE CHART
AREAS WHERE WE LAG BEHIND AND MUST IMPROVE
Lumbar support doesn't hurt shorter person 7 3
22 23
20 M
N/m
2
25 m
m
2 2
Foam
stif
fnes
sFo
am th
ickn
ess
120 123
5 5
5
T.B.
I.
4
Prof
ile o
f bac
k
290
12
Figure 30. Analysing the chart for where we lag and must improve.
Q U A L I T Y F U N C T I O N D E P L O Y M E N T
61 ©Warwick Manufacturing Group Revision date: January 07
Next Steps The first level QFD study has now been completed. The early stages were concerned with finding out what your customers actually want in the product. We then moved on to developing engineering characteristics that could be used to assure customer satisfaction. The next stages involved correlating the two, highlighting conflicting characteristics and setting target values.
During the setting of target values it became clear that we did not know enough about some aspects of the design i.e.. the seat back and pan profiles. This is one of the strengths of QFD. It highlights areas of weakness which are important to customers. Once a problem is identified it can be tackled.
This point comes up again during the final stages. The analysis of the chart shows areas of importance that must be addressed. QFD in itself does not solve engineering problems for you. It is a forum for gathering and organising all the data relevant to a design. It focuses attention on what the customer wants and forces you to set target values for engineering characteristics to assure customer satisfaction. In this context QFD shows you what to do, not how to do it.
A large amount of effort must go into preparing a first level study. An equal commitment should be made to solving any engineering problems highlighted. The best problem solving techniques should be employed; the use of designed experiments is strongly recommended.
There are two other benefits of QFD that may not be so obvious. Firstly, it acts as a facilitator for a multi-discipline team approach to product design. Secondly, it is an excellent documentation medium for recording options considered and decisions made during product design.

Q U A L I T Y F U N C T I O N D E P L O Y M E N T
62 ©Warwick Manufacturing Group Revision date: January 07
Page intentionally blank