Q3 FY2017 Consolidated Financial Results - sony.net · PDF file · 2 days agoTitle:...
27
0 Q3 FY2017 Consolidated Financial Results (Three months ended December 31, 2017) Sony Corporation February 2, 2018 Please be aware that, in the following remarks, statements made with respect to Sony's current plans, estimates, strategies and beliefs and other statements that are not historical facts are forward-looking statements about the future performance of Sony. These statements are based on management's assumptions in light of the information currently available to it, and, therefore, you should not place undue reliance on them. Sony cautions you that a number of important factors could cause actual results to differ materially from those discussed in the forward-looking statements. For additional information as to risks and uncertainties, as well as other factors that could cause actual results to differ, please refer to today's press release, which can be accessed by visiting www.sony.net/IR.
Transcript of Q3 FY2017 Consolidated Financial Results - sony.net · PDF file · 2 days agoTitle:...
0
Q3 FY2017 Consolidated Financial Results
(Three months ended December 31, 2017)
Sony Corporation
February 2, 2018
Please be aware that, in the following remarks, statements made with respect to Sony's current plans, estimates, strategies and beliefs and other statements that are not historical facts are forward-looking statements about the future performance of Sony. These statements are based on management's assumptions in light of the information currently available to it, and, therefore, you should not place undue reliance on them.
Sony cautions you that a number of important factors could cause actual results to differ materially from those discussed in the forward-looking statements. For additional information as to risks and uncertainties, as well as other factors that could cause actual results to differ, please refer to today's press release, which can be accessed by visiting www.sony.net/IR.
Q3 FY2017 Consolidated Results and FY2017 Consolidated Forecast
Segments Outlook
I’m CFO Kenichiro Yoshida.
Today I would like to explain two topics in the next 15 minutes:
1
Q3 FY2017 Consolidated Results
Q3 FY16 Q3 FY17 ChangeQ3 FY17
USD Amount*1
Sales & operating revenue ¥2,397.5 ¥2,672.3 +274.8 bln yen
(+11.5%)$23,649
Operating income 92.4 350.8 +258.5 bln yen
(+279.8%)3,105
Income before income taxes 66.2 343.1 +276.9 bln yen
(+418.1%)3,036
Net income attributable to Sony Corporation’s stockholders
19.6 295.9 +276.3 bln yen
(+1,407.3%)2,619
Net income attributable to Sony Corporation’sstockholders per share of common stock (diluted) 15.24 yen 228.91 yen +213.67 yen 2.03 USD
Restructuring charges*2 5.1 3.1 -39.2%
Additions to long-lived assets*3 52.9 94.8 +79.4%
Depreciation and amortization*4 78.5 88.2 +12.4%
Research and development expenses 108.8 112.8 +3.7%
Average rate
1 US dollar 109.3 yen 113.0 yen
1 Euro 117.8 yen 133.0 yen
*1 US dollar amounts have been translated from yen, for convenience only, using the average rate listed on this slide*2 Restructuring charges are included in operating income as operating expenses (applies to all following pages)*3 Does not include the increase in intangible assets resulting from acquisitions (applies to all following pages) *4 Includes amortization expenses for intangible assets and for deferred insurance acquisition costs (applies to all following pages)
(Bln Yen, Mln US dollar)
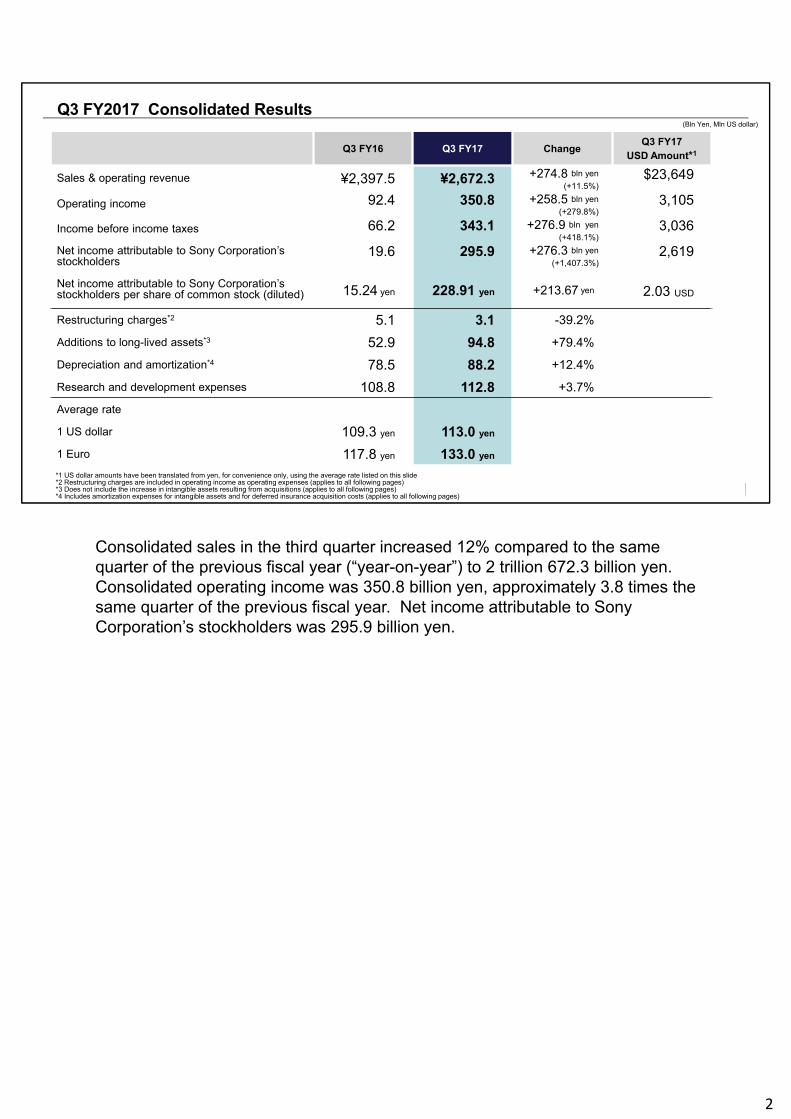
Consolidated sales in the third quarter increased 12% compared to the same quarter of the previous fiscal year (“year-on-year”) to 2 trillion 672.3 billion yen. Consolidated operating income was 350.8 billion yen, approximately 3.8 times the same quarter of the previous fiscal year. Net income attributable to Sony Corporation’s stockholders was 295.9 billion yen.
2
OperatingIncome
Adjusted Operating
IncomeAdjusted Operating Income excludes the following items*1
Q3 FY16 92.4 bln yen 206.7 bln yen
Impairment charge of goodwill recorded in the Pictures segment (-112.1 bln yen)
Impact*2 of the 2016 Kumamoto Earthquakes (-2.2 bln yen)
Q3 FY17 350.8 bln yen 344.1 bln yen Gain resulting from the sale of manufacturing equipment in
the Semiconductors segment (+6.7 bln yen)
Change from FY16+258.5 bln yen +137.4 bln yen
(+66.5%)
Adjusted Operating Income (Q3)
*1 These monetary amounts are disclosed in the Quarterly Financial Statements (previously known as the “Quarterly Earnings Release”), the Presentation Slides (previously known as the “Handout”) and the Quarterly Securities Reports for the relevant quarters
*2 Net result of physical damage and opportunity losses offset by insurance recoveries, both of which resulted from the 2016 Kumamoto Earthquakes
Adjusted operating income is not a measure in accordance with U.S. GAAP. However, Sony believes that this disclosure may be useful information to investors.
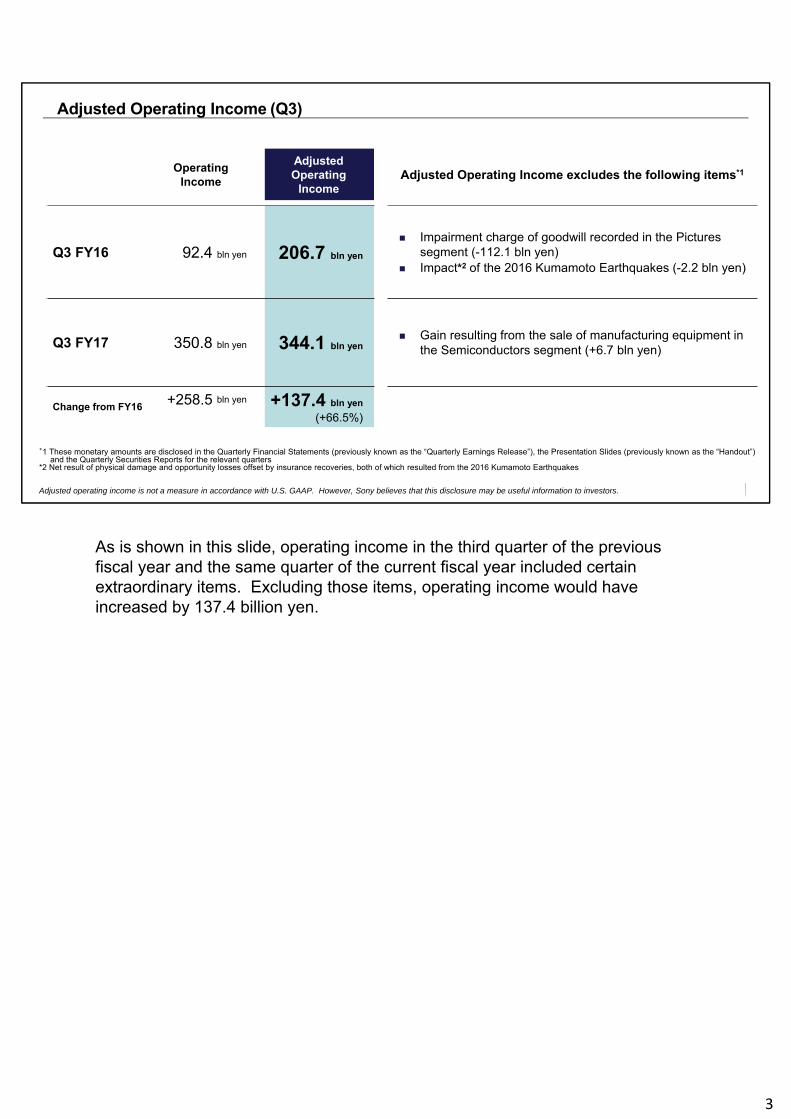
As is shown in this slide, operating income in the third quarter of the previous fiscal year and the same quarter of the current fiscal year included certain extraordinary items. Excluding those items, operating income would have increased by 137.4 billion yen.
3
Q1-Q3 FY2017 Consolidated Results
Q1-Q3 FY16 Q1-Q3 FY17 ChangeQ1-Q3 FY17
USD Amount*
Sales & operating revenue 5,699.6 6,593.0 +893.3 bln yen
(+15.7%)$59,024
Operating income 194.3 712.7 +518.4 bln yen
(+266.8%)6,380
Income before income taxes 163.8 690.6 +526.8 bln yen
(+321.7%)6,182
Net income attributable to Sony Corporation’s stockholders
45.6 507.6 +462.0 bln yen
(+1,012.3%)4,544
Net income attributable to Sony Corporation’sstockholders per share of common stock (diluted)
35.43 yen 393.05 yen +357.62 yen 3.52 USD
Restructuring charges 39.4 7.1 -81.9%
Additions to long-lived assets 188.2 238.0 +26.5%
Depreciation and amortization 259.6 258.2 -0.5%
Research and development expenses 325.1 323.4 -0.5%
Average rate
1 US dollar 106.6 yen 111.7 yen
1 Euro 118.1 yen 128.5 yen
(Bln Yen)
* US dollar amounts have been translated from yen, for convenience only, using the average rate listed on this slide
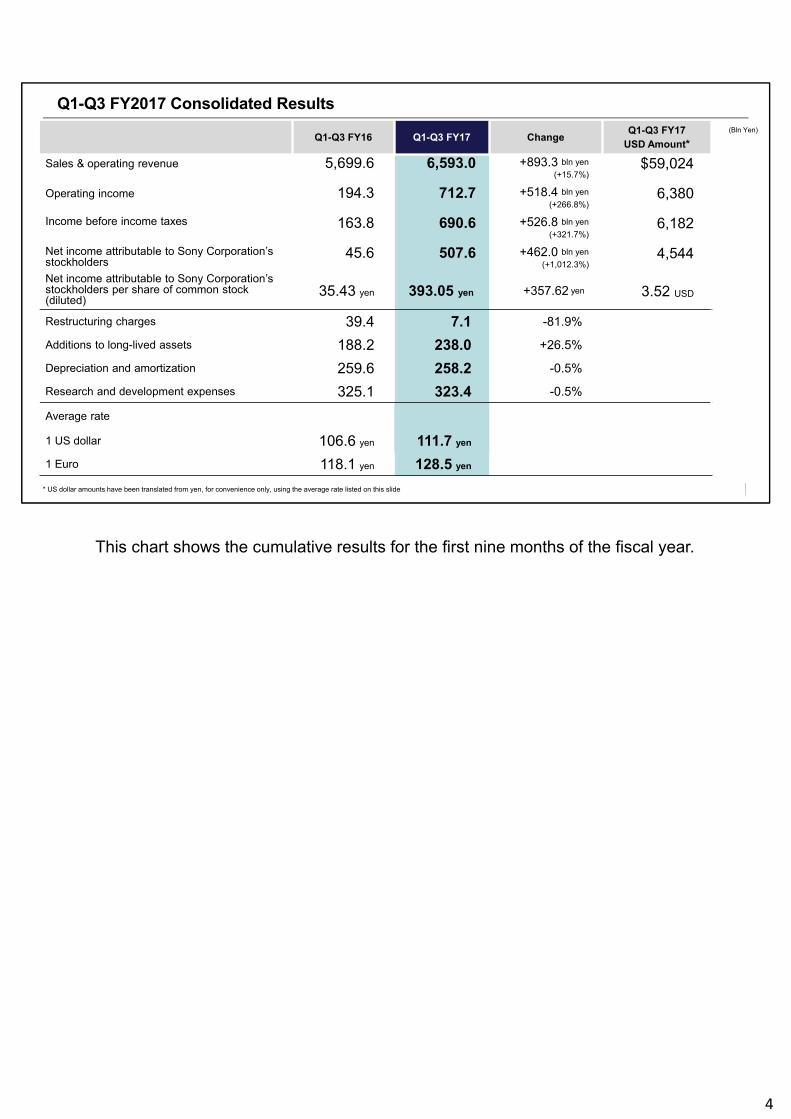
This chart shows the cumulative results for the first nine months of the fiscal year.
4
OperatingIncome
Adjusted Operating
IncomeAdjusted Operating Income excludes the following items*1
Q1-Q3 FY16 194.3 bln yen 404.7 bln yen
Impairment charge of goodwill in the Pictures segment (-112.1 bln yen) Impact*2 of the 2016 Kumamoto Earthquakes (-41.6 bln yen) Impairment charge related to the transfer of the battery business
(-32.8 bln yen) Impairment charge against long-lived assets resulting from the
termination of development and manufacturing of high-functionality camera modules (-23.9 bln yen)
Q1-Q3 FY17 712.7 bln yen 668.4 bln yen
Gain resulting from the sale of an equity interest in a manufacturing subsidiary in the camera modules business (+28.3 bln yen)
Insurance recoveries related to the 2016 Kumamoto Earthquakes(+9.3 bln yen)
Gain resulting from the sale of manufacturing equipment in the Semiconductors segment (+6.7 bln yen)
Change from FY16 +518.4 bln yen +263.7 bln yen(+65.2%)
Adjusted Operating Income (Q1-Q3)
*1 These monetary amounts are disclosed in the Quarterly Financial Statements (previously known as the “Quarterly Earnings Release”), the Presentation Slides (previously known as the “Handout”) and the Quarterly Securities Reports for the relevant quarters
*2 Net result of physical damage and opportunity losses offset by insurance recoveries, both of which resulted from the 2016 Kumamoto Earthquakes
Adjusted operating income is not a measure in accordance with U.S. GAAP. However, Sony believes that this disclosure may be useful information to investors.
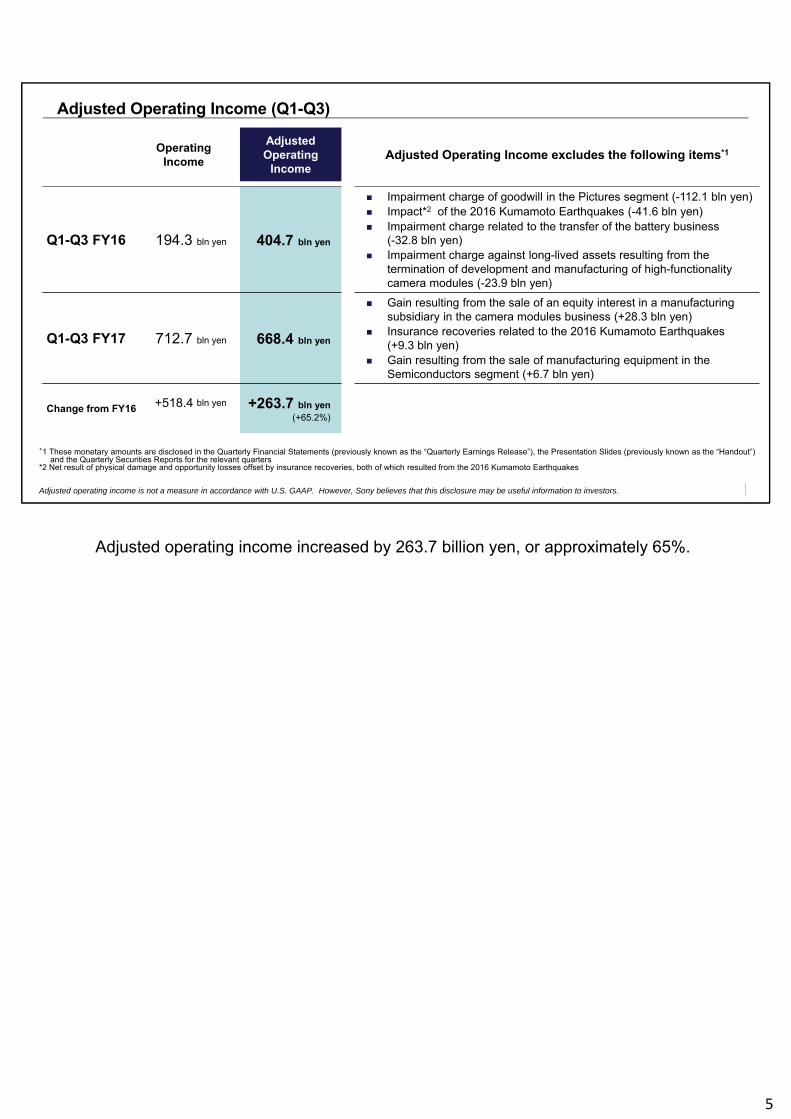
Adjusted operating income increased by 263.7 billion yen, or approximately 65%.
5
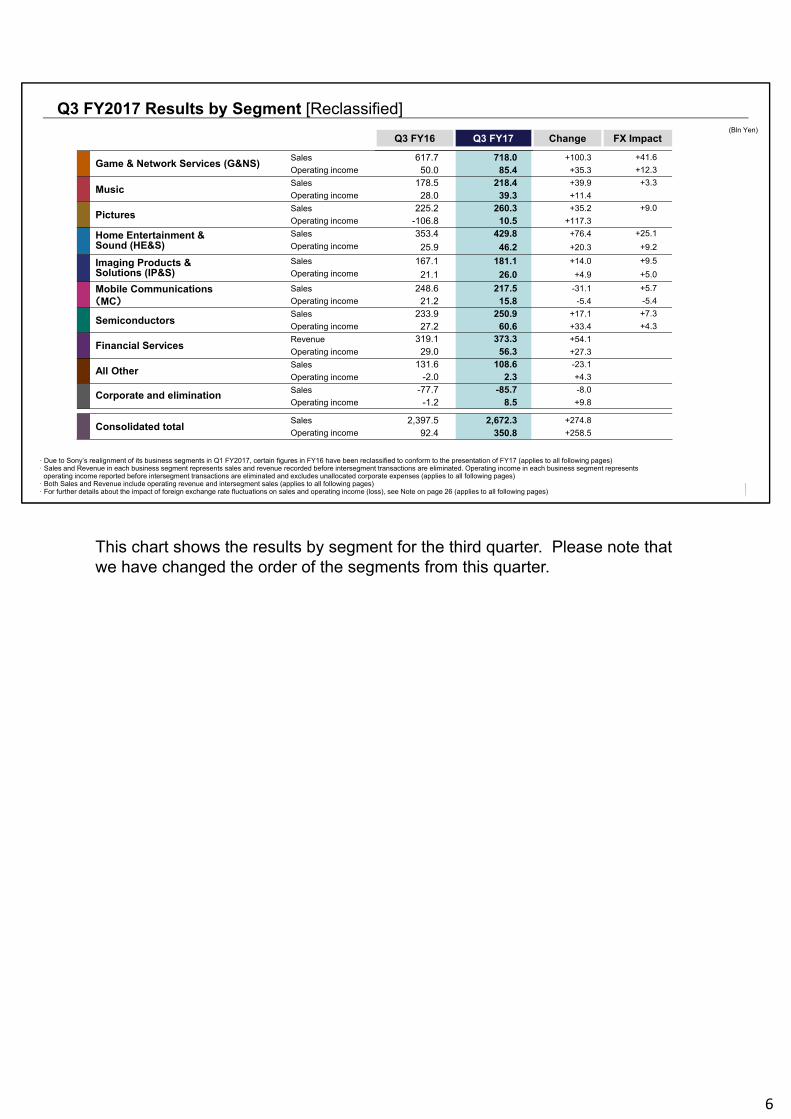
Q3 FY2017 Results by Segment [Reclassified]
· Due to Sony’s realignment of its business segments in Q1 FY2017, certain figures in FY16 have been reclassified to conform to the presentation of FY17 (applies to all following pages)· Sales and Revenue in each business segment represents sales and revenue recorded before intersegment transactions are eliminated. Operating income in each business segment represents
operating income reported before intersegment transactions are eliminated and excludes unallocated corporate expenses (applies to all following pages) · Both Sales and Revenue include operating revenue and intersegment sales (applies to all following pages) · For further details about the impact of foreign exchange rate fluctuations on sales and operating income (loss), see Note on page 26 (applies to all following pages)
(Bln Yen)Q3 FY16 Q3 FY17 Change FX Impact
Game & Network Services (G&NS)Sales 617.7 718.0 +100.3 +41.6
Operating income 50.0 85.4 +35.3 +12.3
MusicSales 178.5 218.4 +39.9 +3.3
Operating income 28.0 39.3 +11.4
PicturesSales 225.2 260.3 +35.2 +9.0
Operating income -106.8 10.5 +117.3
Home Entertainment &Sound (HE&S)
Sales 353.4 429.8 +76.4 +25.1
Operating income 25.9 46.2 +20.3 +9.2
Imaging Products &Solutions (IP&S)
Sales 167.1 181.1 +14.0 +9.5
Operating income 21.1 26.0 +4.9 +5.0
Mobile Communications(MC)
Sales 248.6 217.5 -31.1 +5.7
Operating income 21.2 15.8 -5.4 -5.4
SemiconductorsSales 233.9 250.9 +17.1 +7.3
Operating income 27.2 60.6 +33.4 +4.3
Financial ServicesRevenue 319.1 373.3 +54.1
Operating income 29.0 56.3 +27.3
All OtherSales 131.6 108.6 -23.1
Operating income -2.0 2.3 +4.3
Corporate and eliminationSales -77.7 -85.7 -8.0
Operating income -1.2 8.5 +9.8
Consolidated totalSales 2,397.5 2,672.3 +274.8
Operating income 92.4 350.8 +258.5
This chart shows the results by segment for the third quarter. Please note that we have changed the order of the segments from this quarter.
6
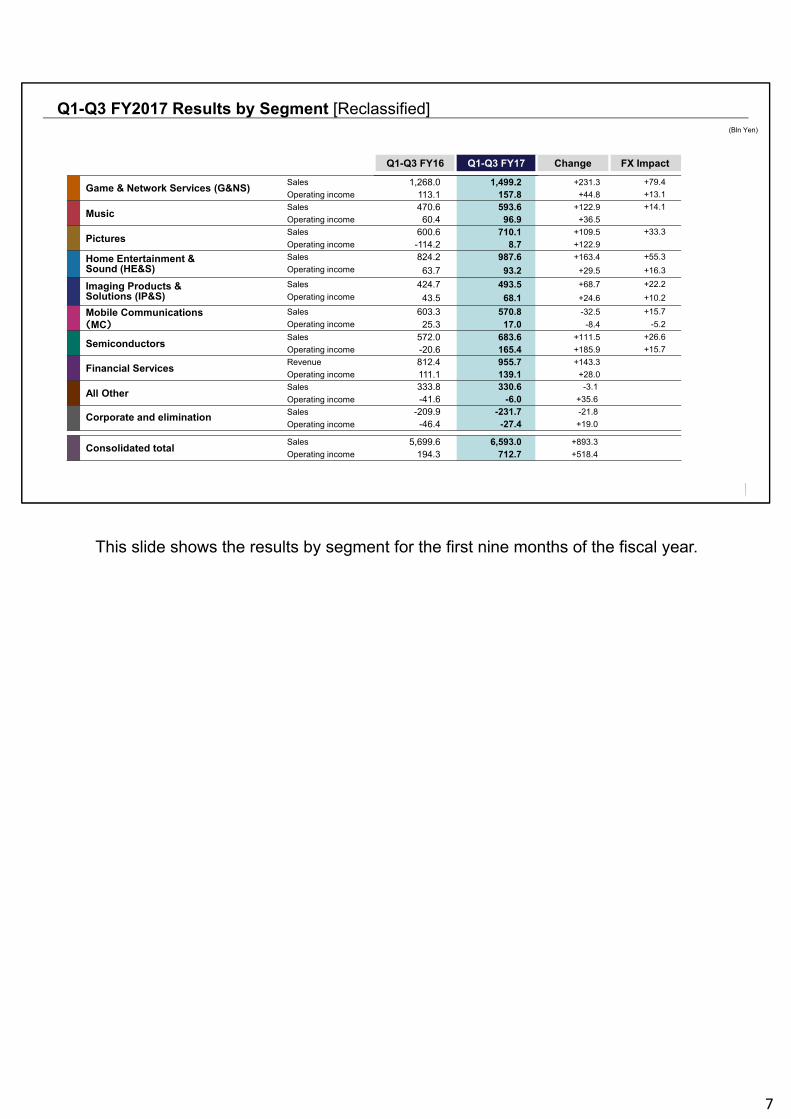
Q1-Q3 FY2017 Results by Segment [Reclassified]
Q1-Q3 FY16 Q1-Q3 FY17 Change FX Impact
Game & Network Services (G&NS)Sales 1,268.0 1,499.2 +231.3 +79.4
Operating income 113.1 157.8 +44.8 +13.1
MusicSales 470.6 593.6 +122.9 +14.1
Operating income 60.4 96.9 +36.5
PicturesSales 600.6 710.1 +109.5 +33.3
Operating income -114.2 8.7 +122.9
Home Entertainment &Sound (HE&S)
Sales 824.2 987.6 +163.4 +55.3
Operating income 63.7 93.2 +29.5 +16.3
Imaging Products &Solutions (IP&S)
Sales 424.7 493.5 +68.7 +22.2
Operating income 43.5 68.1 +24.6 +10.2
Mobile Communications(MC)
Sales 603.3 570.8 -32.5 +15.7
Operating income 25.3 17.0 -8.4 -5.2
SemiconductorsSales 572.0 683.6 +111.5 +26.6
Operating income -20.6 165.4 +185.9 +15.7
Financial ServicesRevenue 812.4 955.7 +143.3
Operating income 111.1 139.1 +28.0
All OtherSales 333.8 330.6 -3.1
Operating income -41.6 -6.0 +35.6
Corporate and eliminationSales -209.9 -231.7 -21.8
Operating income -46.4 -27.4 +19.0
Consolidated totalSales 5,699.6 6,593.0 +893.3
Operating income 194.3 712.7 +518.4
(Bln Yen)
This slide shows the results by segment for the first nine months of the fiscal year.
7
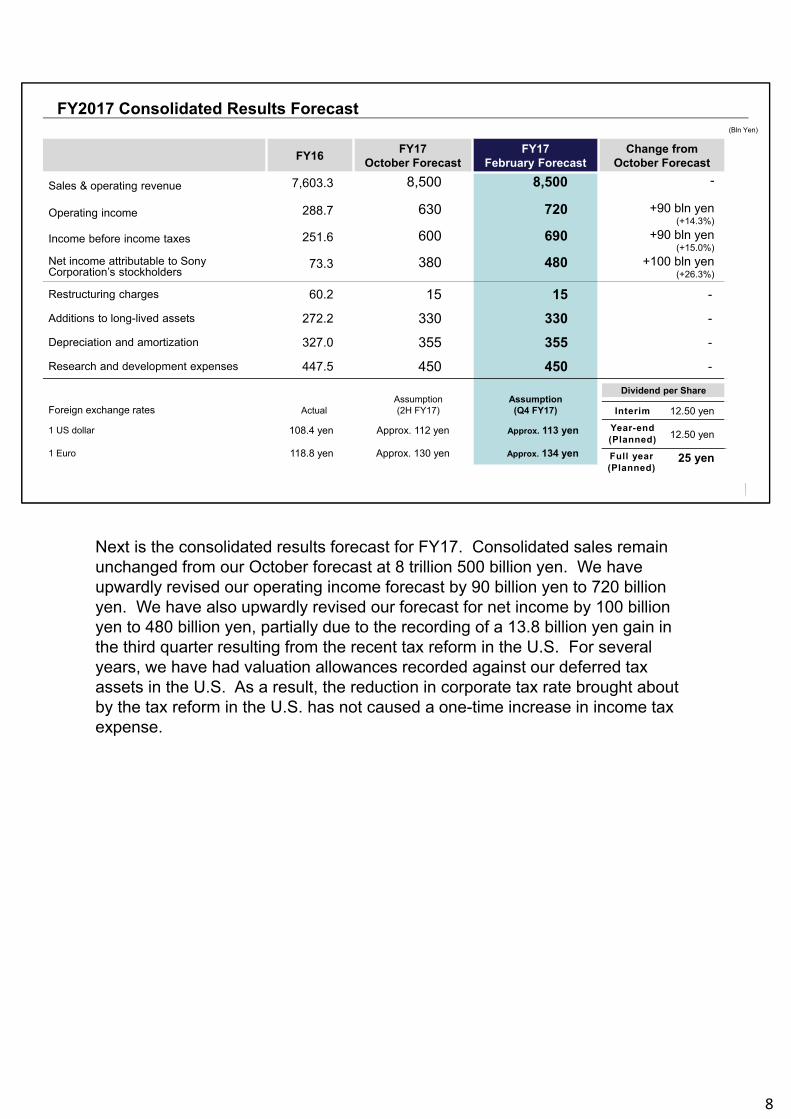
FY2017 Consolidated Results Forecast
FY16FY17
October ForecastFY17
February ForecastChange from
October Forecast
Sales & operating revenue 7,603.3 8,500 8,500 -
Operating income 288.7 630 720 +90 bln yen(+14.3%)
Income before income taxes 251.6 600 690 +90 bln yen(+15.0%)
Net income attributable to Sony Corporation’s stockholders
73.3 380 480 +100 bln yen(+26.3%)
Restructuring charges 60.2 15 15 -
Additions to long-lived assets 272.2 330 330 -
Depreciation and amortization 327.0 355 355 -
Research and development expenses 447.5 450 450 -
Foreign exchange rates ActualAssumption(2H FY17)
Assumption(Q4 FY17)
1 US dollar 108.4 yen Approx. 112 yen Approx. 113 yen
1 Euro 118.8 yen Approx. 130 yen Approx. 134 yen
(Bln Yen)
Dividend per Share
Interim 12.50 yen
Year-end (Planned) 12.50 yen
Full year(Planned)
25 yen
Next is the consolidated results forecast for FY17. Consolidated sales remain unchanged from our October forecast at 8 trillion 500 billion yen. We have upwardly revised our operating income forecast by 90 billion yen to 720 billion yen. We have also upwardly revised our forecast for net income by 100 billion yen to 480 billion yen, partially due to the recording of a 13.8 billion yen gain in the third quarter resulting from the recent tax reform in the U.S. For several years, we have had valuation allowances recorded against our deferred tax assets in the U.S. As a result, the reduction in corporate tax rate brought about by the tax reform in the U.S. has not caused a one-time increase in income tax expense.
8
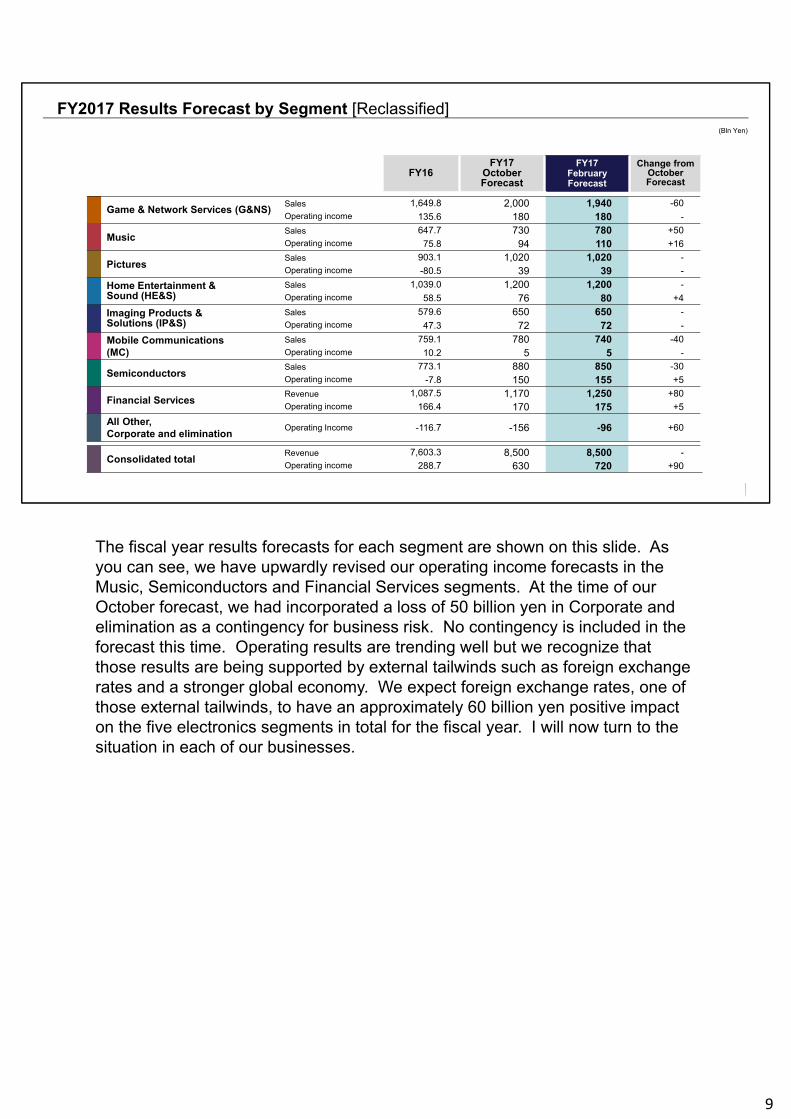
FY2017 Results Forecast by Segment [Reclassified]
FY16FY17
October Forecast
FY17 February Forecast
Change from October Forecast
Game & Network Services (G&NS)Sales 1,649.8 2,000 1,940 -60Operating income 135.6 180 180 -
MusicSales 647.7 730 780 +50Operating income 75.8 94 110 +16
PicturesSales 903.1 1,020 1,020 -Operating income -80.5 39 39 -
Home Entertainment &Sound (HE&S)
Sales 1,039.0 1,200 1,200 -Operating income 58.5 76 80 +4
Imaging Products &Solutions (IP&S)
Sales 579.6 650 650 -Operating income 47.3 72 72 -
Mobile Communications(MC)
Sales 759.1 780 740 -40Operating income 10.2 5 5 -
SemiconductorsSales 773.1 880 850 -30Operating income -7.8 150 155 +5
Financial ServicesRevenue 1,087.5 1,170 1,250 +80Operating income 166.4 170 175 +5
All Other, Corporate and elimination
Operating Income -116.7 -156 -96 +60
Consolidated totalRevenue 7,603.3 8,500 8,500 -Operating income 288.7 630 720 +90
(Bln Yen)
The fiscal year results forecasts for each segment are shown on this slide. As you can see, we have upwardly revised our operating income forecasts in the Music, Semiconductors and Financial Services segments. At the time of our October forecast, we had incorporated a loss of 50 billion yen in Corporate and elimination as a contingency for business risk. No contingency is included in the forecast this time. Operating results are trending well but we recognize that those results are being supported by external tailwinds such as foreign exchange rates and a stronger global economy. We expect foreign exchange rates, one of those external tailwinds, to have an approximately 60 billion yen positive impact on the five electronics segments in total for the fiscal year. I will now turn to the situation in each of our businesses.
9
Game & Network Services Segment
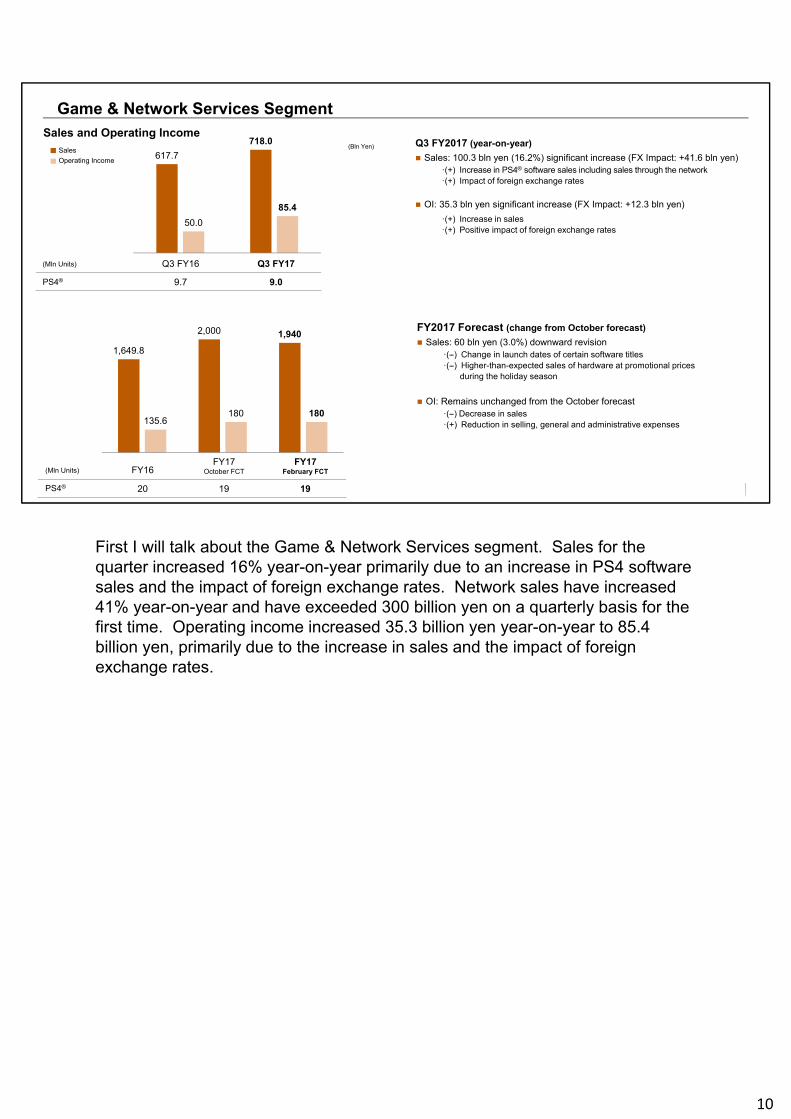
Q3 FY2017 (year-on-year)
Sales: 100.3 bln yen (16.2%) significant increase (FX Impact: +41.6 bln yen)·(+) Increase in PS4® software sales including sales through the network ·(+) Impact of foreign exchange rates
OI: 35.3 bln yen significant increase (FX Impact: +12.3 bln yen)
·(+) Increase in sales·(+) Positive impact of foreign exchange rates
(Mln Units) FY16FY17
October FCT FY17
February FCT
PS4® 20 19 19
617.7
718.0
50.0
85.4
(Mln Units) Q3 FY16 Q3 FY17
PS4® 9.7 9.0
1,649.8
2,000 1,940
135.6180 180
FY2017 Forecast (change from October forecast)
Sales: 60 bln yen (3.0%) downward revision·(--) Change in launch dates of certain software titles·(--) Higher-than-expected sales of hardware at promotional prices
during the holiday season
OI: Remains unchanged from the October forecast·(--) Decrease in sales·(+) Reduction in selling, general and administrative expenses
Sales and Operating IncomeSales
Operating Income
(Bln Yen)
First I will talk about the Game & Network Services segment. Sales for the quarter increased 16% year-on-year primarily due to an increase in PS4 software sales and the impact of foreign exchange rates. Network sales have increased 41% year-on-year and have exceeded 300 billion yen on a quarterly basis for the first time. Operating income increased 35.3 billion yen year-on-year to 85.4 billion yen, primarily due to the increase in sales and the impact of foreign exchange rates.
10
Game & Network Services Segment
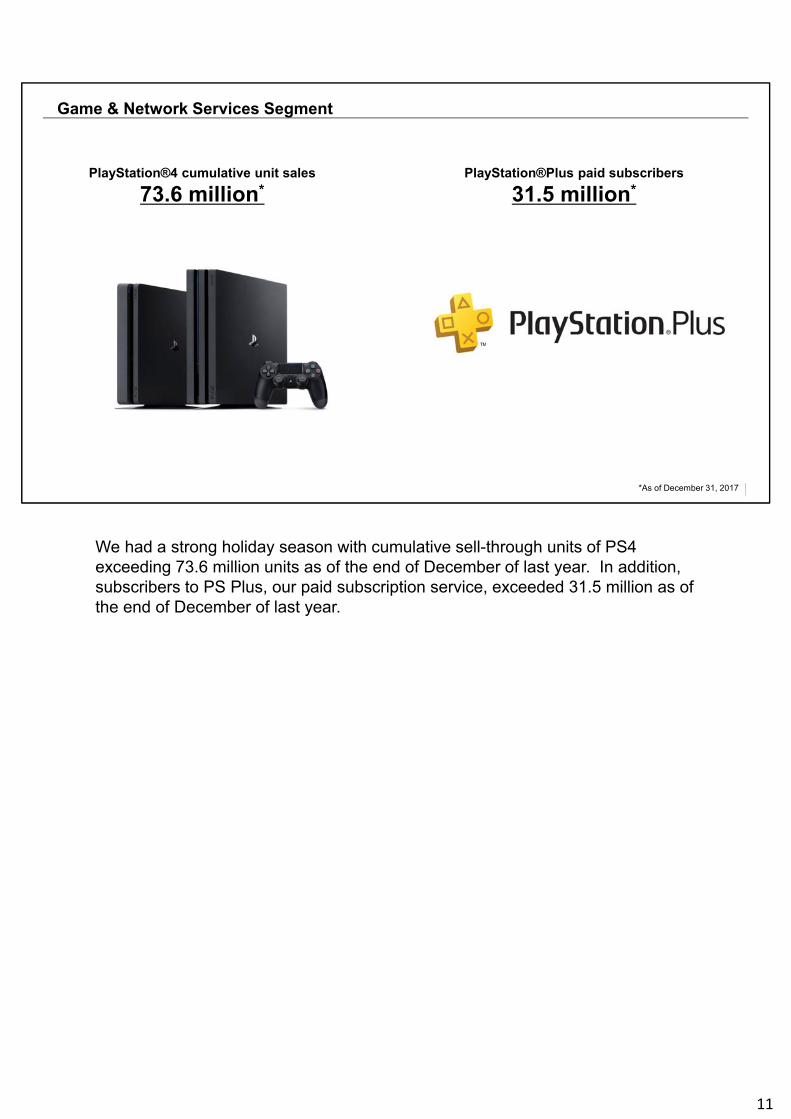
ユーザーベースの更なる拡大PlayStation®4 cumulative unit sales
73.6 million*PlayStation®Plus paid subscribers
31.5 million*
*As of December 31, 2017
We had a strong holiday season with cumulative sell-through units of PS4 exceeding 73.6 million units as of the end of December of last year. In addition, subscribers to PS Plus, our paid subscription service, exceeded 31.5 million as of the end of December of last year.
11
Game & Network Services Segment
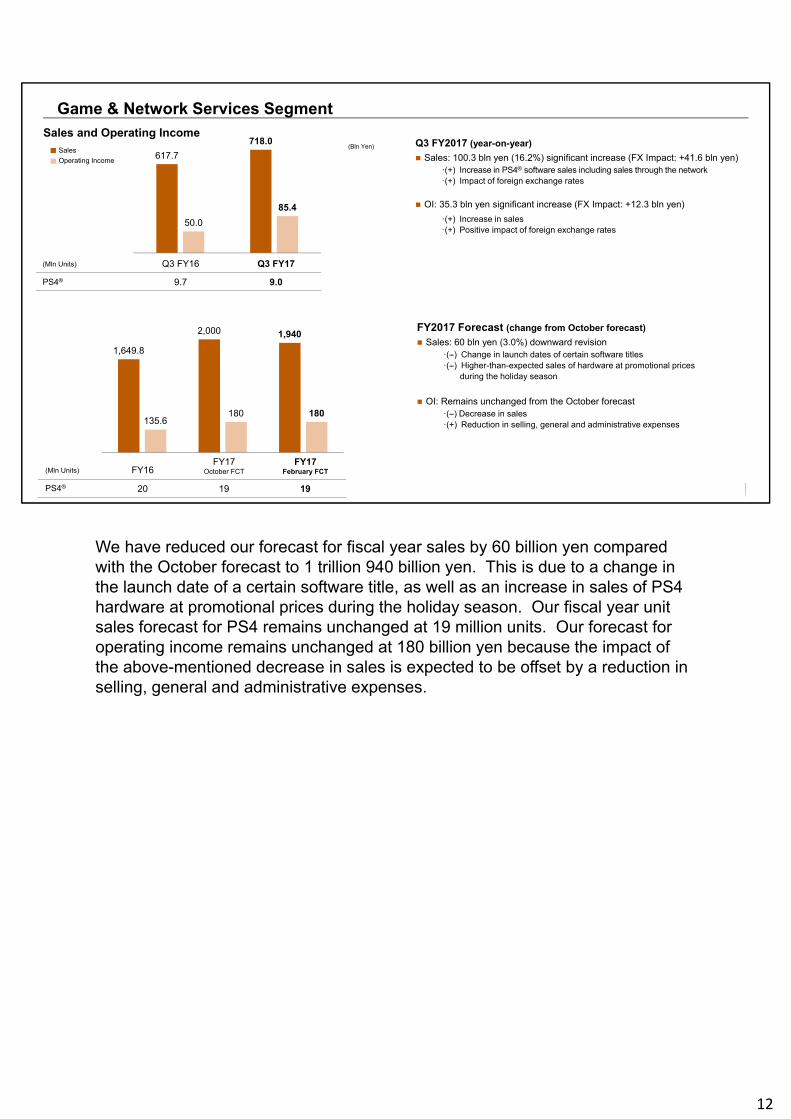
Q3 FY2017 (year-on-year)
Sales: 100.3 bln yen (16.2%) significant increase (FX Impact: +41.6 bln yen)·(+) Increase in PS4® software sales including sales through the network ·(+) Impact of foreign exchange rates
OI: 35.3 bln yen significant increase (FX Impact: +12.3 bln yen)
·(+) Increase in sales·(+) Positive impact of foreign exchange rates
(Mln Units) FY16FY17
October FCT FY17
February FCT
PS4® 20 19 19
617.7
718.0
50.0
85.4
(Mln Units) Q3 FY16 Q3 FY17
PS4® 9.7 9.0
1,649.8
2,000 1,940
135.6180 180
FY2017 Forecast (change from October forecast)
Sales: 60 bln yen (3.0%) downward revision·(--) Change in launch dates of certain software titles·(--) Higher-than-expected sales of hardware at promotional prices
during the holiday season
OI: Remains unchanged from the October forecast·(--) Decrease in sales·(+) Reduction in selling, general and administrative expenses
Sales and Operating IncomeSales
Operating Income
(Bln Yen)
We have reduced our forecast for fiscal year sales by 60 billion yen compared with the October forecast to 1 trillion 940 billion yen. This is due to a change in the launch date of a certain software title, as well as an increase in sales of PS4 hardware at promotional prices during the holiday season. Our fiscal year unit sales forecast for PS4 remains unchanged at 19 million units. Our forecast for operating income remains unchanged at 180 billion yen because the impact of the above-mentioned decrease in sales is expected to be offset by a reduction in selling, general and administrative expenses.
12
Music Segment
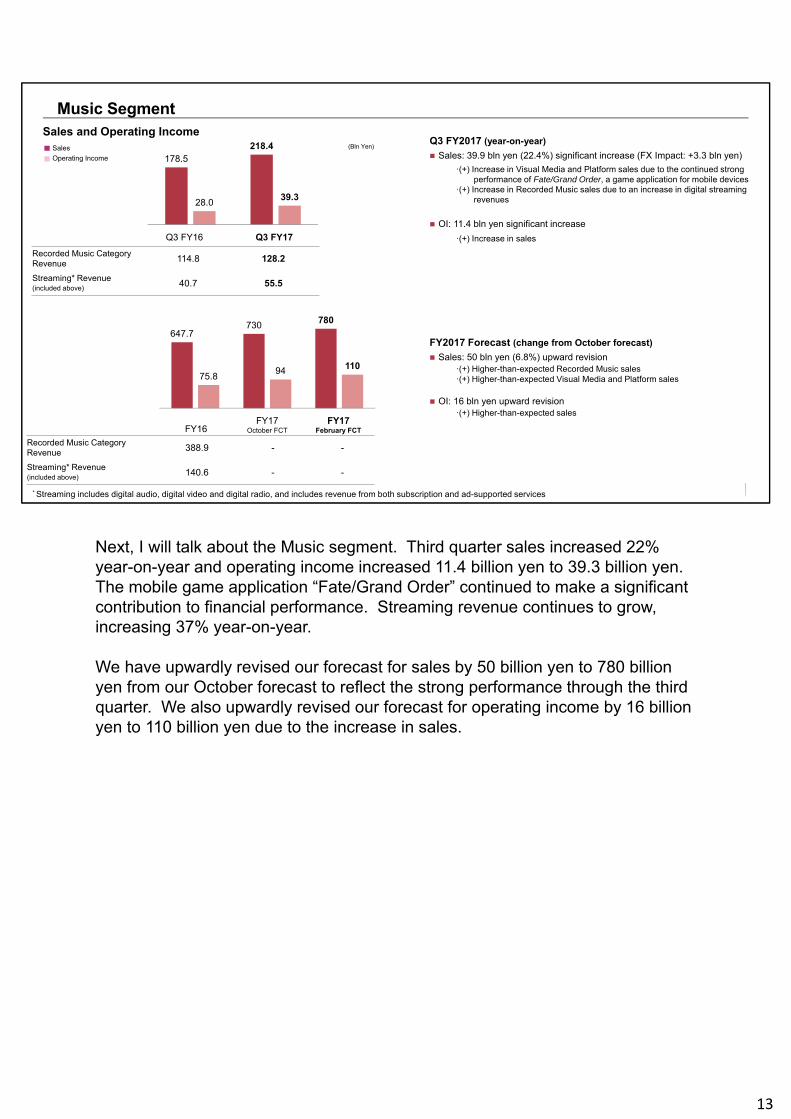
Q3 FY2017 (year-on-year)
Sales: 39.9 bln yen (22.4%) significant increase (FX Impact: +3.3 bln yen)
·(+) Increase in Visual Media and Platform sales due to the continued strong performance of Fate/Grand Order, a game application for mobile devices
·(+) Increase in Recorded Music sales due to an increase in digital streaming revenues
OI: 11.4 bln yen significant increase
·(+) Increase in sales
FY2017 Forecast (change from October forecast)
Sales: 50 bln yen (6.8%) upward revision·(+) Higher-than-expected Recorded Music sales·(+) Higher-than-expected Visual Media and Platform sales
OI: 16 bln yen upward revision·(+) Higher-than-expected sales
647.7730 780
75.894 110
178.5218.4
28.039.3
Q3 FY16 Q3 FY17
FY16FY17
October FCT FY17
February FCT
Recorded Music Category Revenue 114.8 128.2
Streaming* Revenue (included above)
40.7 55.5
Recorded Music CategoryRevenue 388.9 - -
Streaming* Revenue(included above)
140.6 - -
* Streaming includes digital audio, digital video and digital radio, and includes revenue from both subscription and ad-supported services
Sales and Operating IncomeSales
Operating Income
(Bln Yen)
Next, I will talk about the Music segment. Third quarter sales increased 22% year-on-year and operating income increased 11.4 billion yen to 39.3 billion yen. The mobile game application “Fate/Grand Order” continued to make a significant contribution to financial performance. Streaming revenue continues to grow, increasing 37% year-on-year.
We have upwardly revised our forecast for sales by 50 billion yen to 780 billion yen from our October forecast to reflect the strong performance through the third quarter. We also upwardly revised our forecast for operating income by 16 billion yen to 110 billion yen due to the increase in sales.
13
Pictures Segment
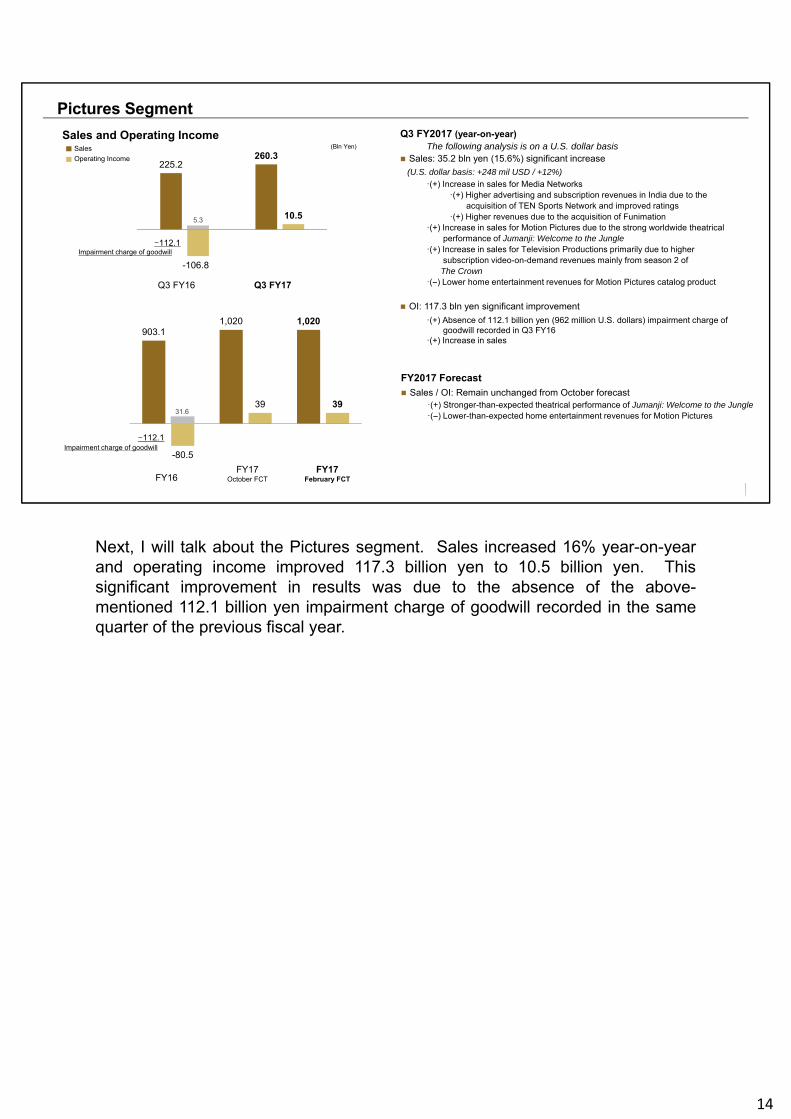
Q3 FY2017 (year-on-year)The following analysis is on a U.S. dollar basis
Sales: 35.2 bln yen (15.6%) significant increase
(U.S. dollar basis: +248 mil USD / +12%)
·(+) Increase in sales for Media Networks·(+) Higher advertising and subscription revenues in India due to the
acquisition of TEN Sports Network and improved ratings·(+) Higher revenues due to the acquisition of Funimation
·(+) Increase in sales for Motion Pictures due to the strong worldwide theatrical performance of Jumanji: Welcome to the Jungle
·(+) Increase in sales for Television Productions primarily due to higher subscription video-on-demand revenues mainly from season 2 of The Crown
·(--) Lower home entertainment revenues for Motion Pictures catalog product
OI: 117.3 bln yen significant improvement
·(+) Absence of 112.1 billion yen (962 million U.S. dollars) impairment charge of goodwill recorded in Q3 FY16
·(+) Increase in sales
FY2017 Forecast
Sales / OI: Remain unchanged from October forecast·(+) Stronger-than-expected theatrical performance of Jumanji: Welcome to the Jungle·(--) Lower-than-expected home entertainment revenues for Motion Pictures
225.2260.3
-106.8
10.5
Q3 FY16 Q3 FY17
FY16FY17
October FCT FY17
February FCT
903.11,020 1,020
-80.5
39 3931.6
5.3
Sales
Operating Income
Sales and Operating Income(Bln Yen)
-112.1Impairment charge of goodwill
-112.1Impairment charge of goodwill
Next, I will talk about the Pictures segment. Sales increased 16% year-on-yearand operating income improved 117.3 billion yen to 10.5 billion yen. Thissignificant improvement in results was due to the absence of the above-mentioned 112.1 billion yen impairment charge of goodwill recorded in the samequarter of the previous fiscal year.
14

Pictures Segment
©2017 CTMG. All Rights Reserved.
Jumanji, which we released near the end of December, has been performing very well at the box office.
15

Pictures Segment
Q3 FY2017 (year-on-year)The following analysis is on a U.S. dollar basis
Sales: 35.2 bln yen (15.6%) significant increase
(U.S. dollar basis: +248 mil USD / +12%)
·(+) Increase in sales for Media Networks·(+) Higher advertising and subscription revenues in India due to the
acquisition of TEN Sports Network and improved ratings·(+) Higher revenues due to the acquisition of Funimation
·(+) Increase in sales for Motion Pictures due to the strong worldwide theatrical performance of Jumanji: Welcome to the Jungle
·(+) Increase in sales for Television Productions primarily due to higher subscription video-on-demand revenues mainly from season 2 of The Crown
·(--) Lower home entertainment revenues for Motion Pictures catalog product
OI: 117.3 bln yen significant improvement
·(+) Absence of 112.1 billion yen (962 million U.S. dollars) impairment charge of goodwill recorded in Q3 FY16
·(+) Increase in sales
FY2017 Forecast
Sales / OI: Remain unchanged from October forecast·(+) Stronger-than-expected theatrical performance of Jumanji: Welcome to the Jungle·(--) Lower-than-expected home entertainment revenues for Motion Pictures
225.2260.3
-106.8
10.5
Q3 FY16 Q3 FY17
FY16FY17
October FCT FY17
February FCT
903.11,020 1,020
-80.5
39 3931.6
5.3
Sales
Operating Income
Sales and Operating Income(Bln Yen)
-112.1Impairment charge of goodwill
-112.1Impairment charge of goodwill
There is no change to our fiscal year forecast for sales and operating income. Although the above-mentioned Jumanji has been performing well, we expect its positive impact to be offset by the negative impact of lower home entertainment revenue, including DVD and Blu-ray sales.
16
Home Entertainment & Sound Segment
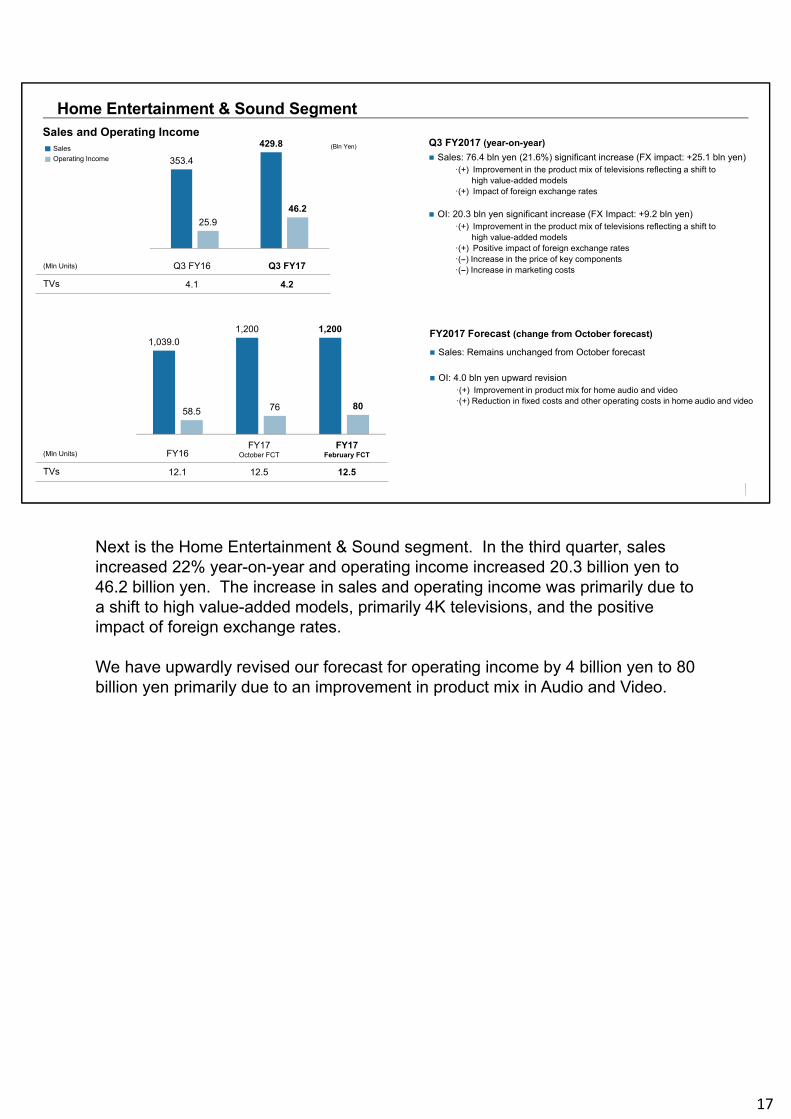
Q3 FY2017 (year-on-year)
Sales: 76.4 bln yen (21.6%) significant increase (FX impact: +25.1 bln yen)·(+) Improvement in the product mix of televisions reflecting a shift to
high value-added models·(+) Impact of foreign exchange rates
OI: 20.3 bln yen significant increase (FX Impact: +9.2 bln yen)·(+) Improvement in the product mix of televisions reflecting a shift to
high value-added models·(+) Positive impact of foreign exchange rates·(--) Increase in the price of key components·(--) Increase in marketing costs
FY2017 Forecast (change from October forecast)
Sales: Remains unchanged from October forecast
OI: 4.0 bln yen upward revision·(+) Improvement in product mix for home audio and video·(+) Reduction in fixed costs and other operating costs in home audio and video
(Mln Units) FY16FY17
October FCT FY17
February FCT
TVs 12.1 12.5 12.5
1,039.01,200 1,200
58.5 76 80
353.4
429.8
25.9
46.2
(Mln Units) Q3 FY16 Q3 FY17
TVs 4.1 4.2
(Bln Yen)Sales
Operating Income
Sales and Operating Income
Next is the Home Entertainment & Sound segment. In the third quarter, sales increased 22% year-on-year and operating income increased 20.3 billion yen to 46.2 billion yen. The increase in sales and operating income was primarily due to a shift to high value-added models, primarily 4K televisions, and the positive impact of foreign exchange rates.
We have upwardly revised our forecast for operating income by 4 billion yen to 80 billion yen primarily due to an improvement in product mix in Audio and Video.
17
Imaging Products & Solutions Segment
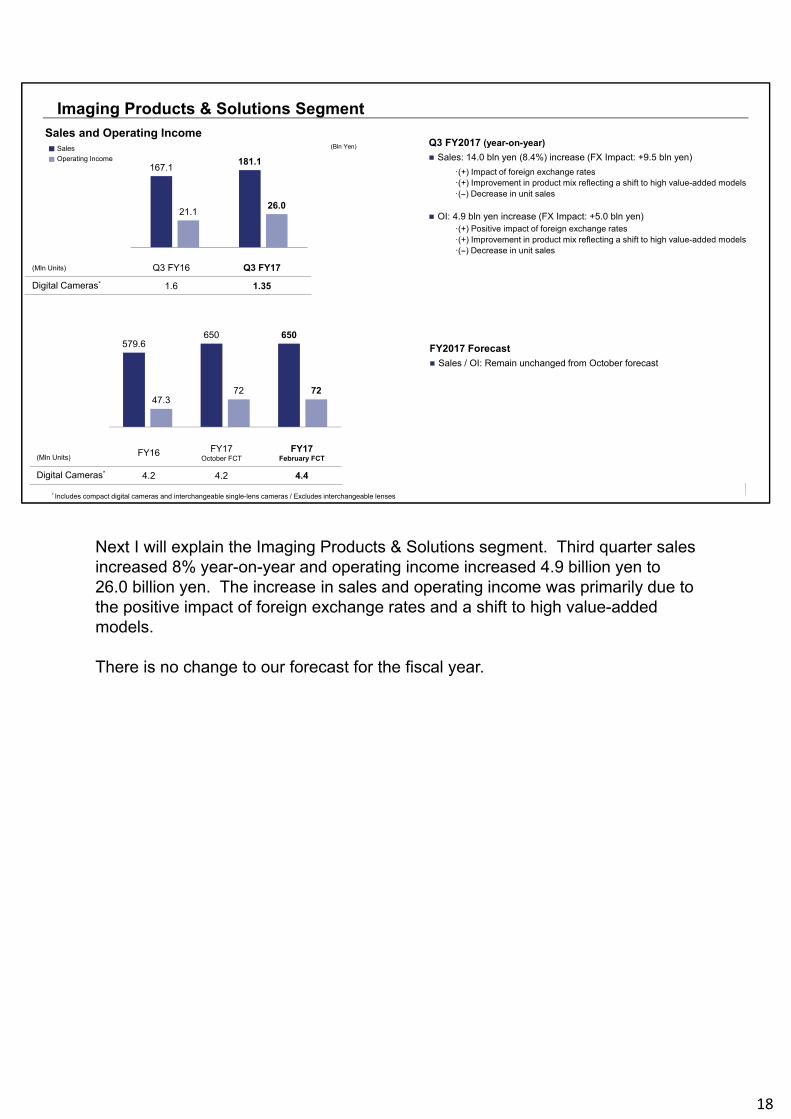
Q3 FY2017 (year-on-year)
Sales: 14.0 bln yen (8.4%) increase (FX Impact: +9.5 bln yen)
·(+) Impact of foreign exchange rates·(+) Improvement in product mix reflecting a shift to high value-added models·(--) Decrease in unit sales
OI: 4.9 bln yen increase (FX Impact: +5.0 bln yen)·(+) Positive impact of foreign exchange rates·(+) Improvement in product mix reflecting a shift to high value-added models·(--) Decrease in unit sales
FY2017 Forecast
Sales / OI: Remain unchanged from October forecast
* Includes compact digital cameras and interchangeable single-lens cameras / Excludes interchangeable lenses
(Mln Units) FY16 FY17October FCT
FY17February FCT
Digital Cameras* 4.2 4.2 4.4
579.6650 650
47.372 72
167.1181.1
21.126.0
(Mln Units) Q3 FY16 Q3 FY17
Digital Cameras* 1.6 1.35
(Bln Yen)Sales
Operating Income
Sales and Operating Income
Next I will explain the Imaging Products & Solutions segment. Third quarter sales increased 8% year-on-year and operating income increased 4.9 billion yen to 26.0 billion yen. The increase in sales and operating income was primarily due to the positive impact of foreign exchange rates and a shift to high value-added models.
There is no change to our forecast for the fiscal year.
18
Mobile Communications Segment
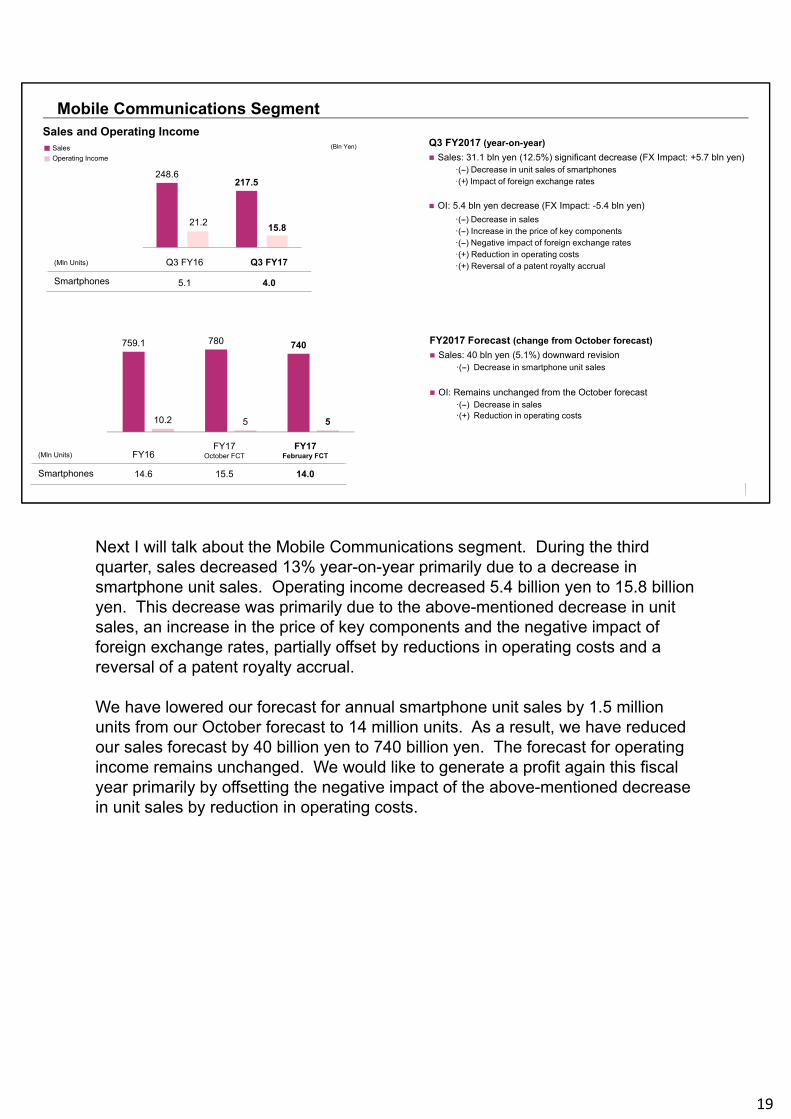
Q3 FY2017 (year-on-year)
Sales: 31.1 bln yen (12.5%) significant decrease (FX Impact: +5.7 bln yen)·(--) Decrease in unit sales of smartphones·(+) Impact of foreign exchange rates
OI: 5.4 bln yen decrease (FX Impact: -5.4 bln yen)
·(--) Decrease in sales·(--) Increase in the price of key components·(--) Negative impact of foreign exchange rates·(+) Reduction in operating costs·(+) Reversal of a patent royalty accrual
FY2017 Forecast (change from October forecast)
Sales: 40 bln yen (5.1%) downward revision·(--) Decrease in smartphone unit sales
OI: Remains unchanged from the October forecast·(--) Decrease in sales·(+) Reduction in operating costs
(Mln Units) FY16FY17
October FCT FY17
February FCT
Smartphones 14.6 15.5 14.0
759.1 780 740
10.2 5 5
(Mln Units) Q3 FY16 Q3 FY17
Smartphones 5.1 4.0
248.6217.5
21.215.8
(Bln Yen)
Sales and Operating IncomeSales
Operating Income
Next I will talk about the Mobile Communications segment. During the third quarter, sales decreased 13% year-on-year primarily due to a decrease in smartphone unit sales. Operating income decreased 5.4 billion yen to 15.8 billion yen. This decrease was primarily due to the above-mentioned decrease in unit sales, an increase in the price of key components and the negative impact of foreign exchange rates, partially offset by reductions in operating costs and a reversal of a patent royalty accrual.
We have lowered our forecast for annual smartphone unit sales by 1.5 million units from our October forecast to 14 million units. As a result, we have reduced our sales forecast by 40 billion yen to 740 billion yen. The forecast for operating income remains unchanged. We would like to generate a profit again this fiscal year primarily by offsetting the negative impact of the above-mentioned decrease in unit sales by reduction in operating costs.
19
Q3 FY16 Q3 FY17
Image Sensors* Sales 172.6 200.3
Semiconductors Segment
Q3 FY2017 (year-on-year)
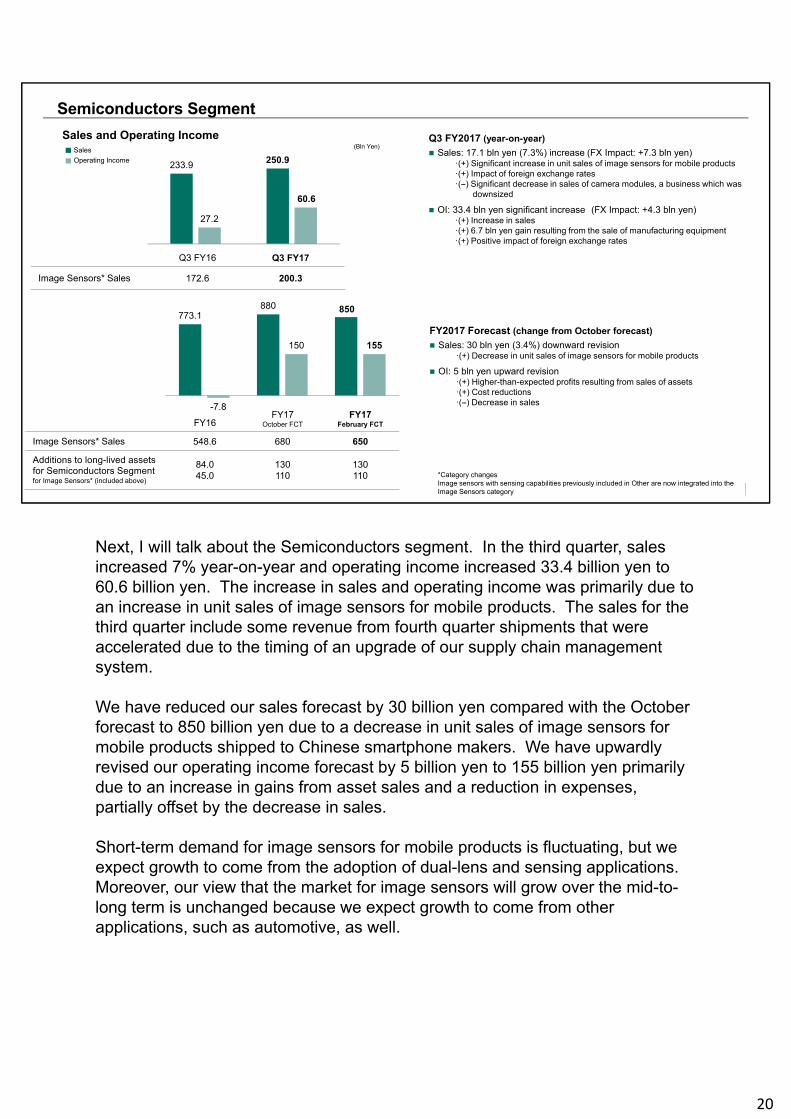
Sales: 17.1 bln yen (7.3%) increase (FX Impact: +7.3 bln yen)·(+) Significant increase in unit sales of image sensors for mobile products·(+) Impact of foreign exchange rates·(--) Significant decrease in sales of camera modules, a business which was
downsized
OI: 33.4 bln yen significant increase (FX Impact: +4.3 bln yen)·(+) Increase in sales·(+) 6.7 bln yen gain resulting from the sale of manufacturing equipment ·(+) Positive impact of foreign exchange rates
FY2017 Forecast (change from October forecast)
Sales: 30 bln yen (3.4%) downward revision·(+) Decrease in unit sales of image sensors for mobile products
OI: 5 bln yen upward revision·(+) Higher-than-expected profits resulting from sales of assets ·(+) Cost reductions·(--) Decrease in sales
FY16FY17
October FCT FY17
February FCT
Image Sensors* Sales 548.6 680 650
Additions to long-lived assets for Semiconductors Segmentfor Image Sensors* (included above)
84.045.0
130110
130110
773.1880 850
-7.8
150 155
233.9 250.9
27.2
60.6
*Category changesImage sensors with sensing capabilities previously included in Other are now integrated into the Image Sensors category
(Bln Yen)Sales
Operating Income
Sales and Operating Income
Next, I will talk about the Semiconductors segment. In the third quarter, sales increased 7% year-on-year and operating income increased 33.4 billion yen to 60.6 billion yen. The increase in sales and operating income was primarily due to an increase in unit sales of image sensors for mobile products. The sales for the third quarter include some revenue from fourth quarter shipments that were accelerated due to the timing of an upgrade of our supply chain management system.
We have reduced our sales forecast by 30 billion yen compared with the October forecast to 850 billion yen due to a decrease in unit sales of image sensors for mobile products shipped to Chinese smartphone makers. We have upwardly revised our operating income forecast by 5 billion yen to 155 billion yen primarily due to an increase in gains from asset sales and a reduction in expenses, partially offset by the decrease in sales.
Short-term demand for image sensors for mobile products is fluctuating, but we expect growth to come from the adoption of dual-lens and sensing applications. Moreover, our view that the market for image sensors will grow over the mid-to-long term is unchanged because we expect growth to come from other applications, such as automotive, as well.
20
Financial Services Segment
Q3 FY2017 (year-on-year)
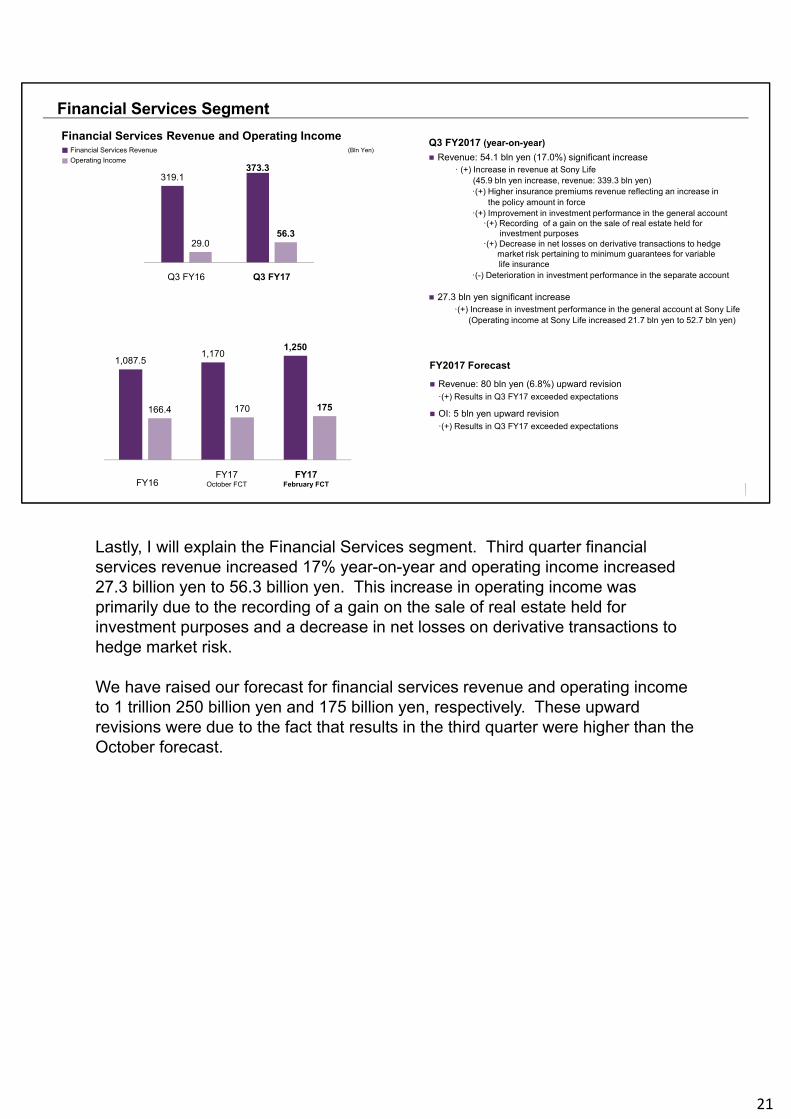
Revenue: 54.1 bln yen (17.0%) significant increase· (+) Increase in revenue at Sony Life
(45.9 bln yen increase, revenue: 339.3 bln yen) ·(+) Higher insurance premiums revenue reflecting an increase in
the policy amount in force ·(+) Improvement in investment performance in the general account
·(+) Recording of a gain on the sale of real estate held forinvestment purposes
·(+) Decrease in net losses on derivative transactions to hedgemarket risk pertaining to minimum guarantees for variable life insurance
·(-) Deterioration in investment performance in the separate account
27.3 bln yen significant increase·(+) Increase in investment performance in the general account at Sony Life
(Operating income at Sony Life increased 21.7 bln yen to 52.7 bln yen)
FY2017 Forecast
Revenue: 80 bln yen (6.8%) upward revision·(+) Results in Q3 FY17 exceeded expectations
OI: 5 bln yen upward revision ·(+) Results in Q3 FY17 exceeded expectations
1,087.51,170
1,250
166.4 170 175
Q3 FY16 Q3 FY17
FY16FY17
October FCT FY17
February FCT
319.1373.3
29.056.3
(Bln Yen)Financial Services Revenue
Operating Income
Financial Services Revenue and Operating Income
Lastly, I will explain the Financial Services segment. Third quarter financial services revenue increased 17% year-on-year and operating income increased 27.3 billion yen to 56.3 billion yen. This increase in operating income was primarily due to the recording of a gain on the sale of real estate held for investment purposes and a decrease in net losses on derivative transactions to hedge market risk.
We have raised our forecast for financial services revenue and operating income to 1 trillion 250 billion yen and 175 billion yen, respectively. These upward revisions were due to the fact that results in the third quarter were higher than the October forecast.
21
+201.3 (Improvement)
Operating CF +378.8 Other -36.5
-24.4
+176.9
Cash – Debt *1
(Net Cash Position)
(Billion yen)
-24.4 +176.9
As of March 31, 2017
Dividend payment
Adjusted net income*2
Increase in working capital*4
Other investing CF
Increase in film cost
FX / Other
Other operating CF
Payments for purchases of fixed assets
-27.8
+428.3 -483.3
-179.2
-279.1
+38.1 -8.7
+243.0
As of December 31, 2017
*1 Please refer to P. 21.*2 Net income(loss) + Other operating (income) expense, net + (Gain) loss on sale or devaluation of securities investments, net [Operating CF of Sony without Financial Services]*3 Depreciation and amortization [Operating CF of Sony without Financial Services]*4 (Increase) decrease in notes and accounts receivable, trade + (Increase) decrease of inventories + Increase (decrease) in notes and accounts payable, trade [Operating CF of Sony without Financial Services]
・Please refer to F-12 for a Condensed Statements of Cash Flows for Sony without Financial Services in “Financial Statements”.
Investing CF -141.1
Amortization of film costs
+259.7
Amortization*3
+210.3
Operating CF + Investing CF +237.7
Q3 FY2017 Cash Flow (CF) Analysis (Sony without Financial Services)
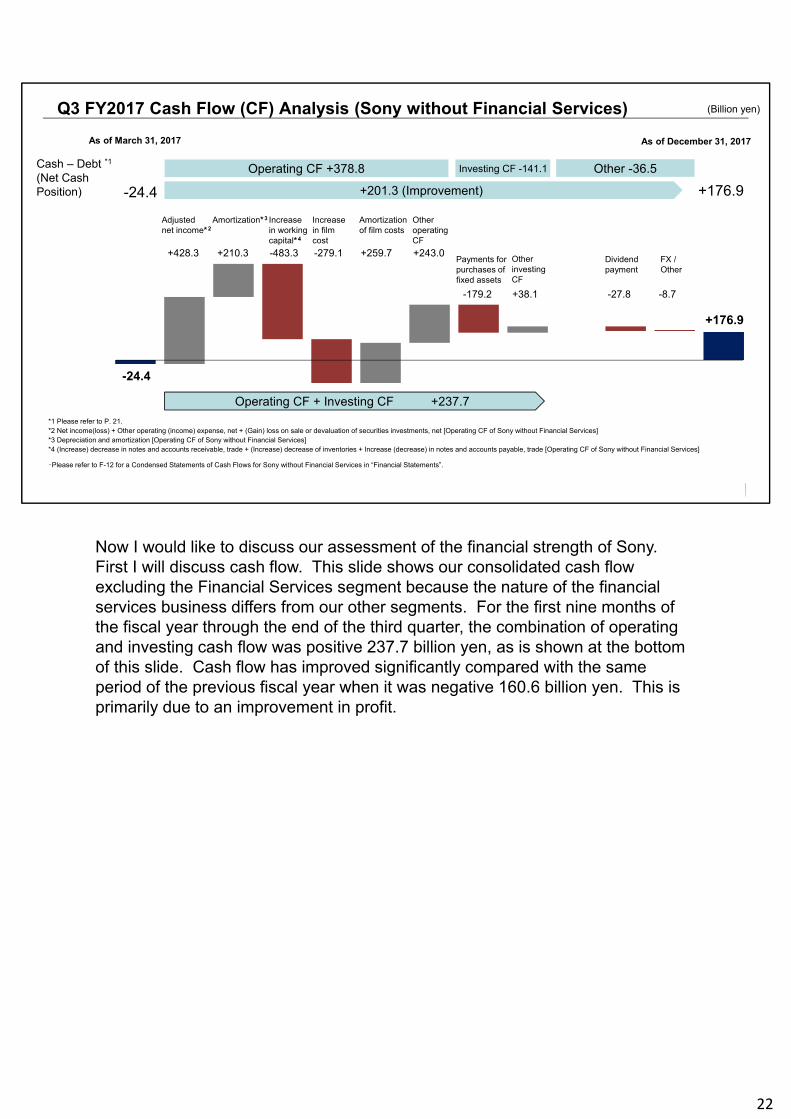
Now I would like to discuss our assessment of the financial strength of Sony. First I will discuss cash flow. This slide shows our consolidated cash flow excluding the Financial Services segment because the nature of the financial services business differs from our other segments. For the first nine months of the fiscal year through the end of the third quarter, the combination of operating and investing cash flow was positive 237.7 billion yen, as is shown at the bottom of this slide. Cash flow has improved significantly compared with the same period of the previous fiscal year when it was negative 160.6 billion yen. This is primarily due to an improvement in profit.
22
Balance Sheet as of December 31, 2017
Consolidated without Financial Services
Sony Corporation’sstockholders’ equity
2,262.0
Consolidated
Sony Corporation’sstockholders’ equity
3,039.9
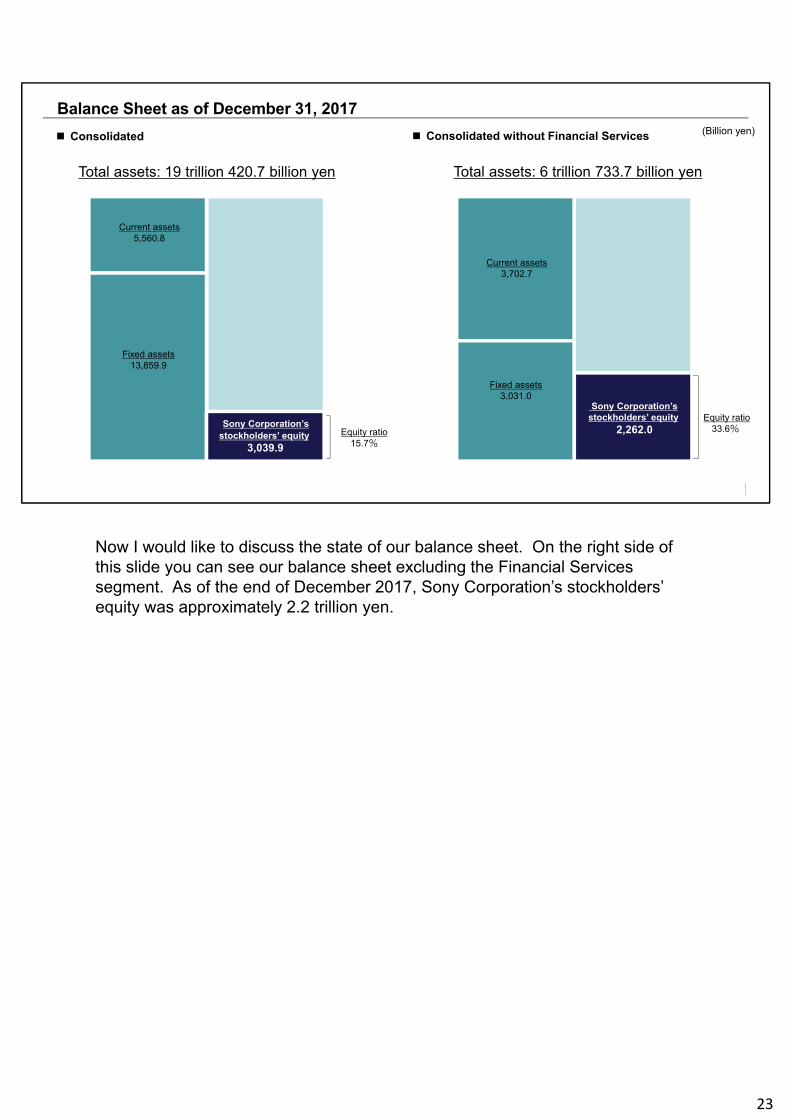
Total assets: 19 trillion 420.7 billion yen Total assets: 6 trillion 733.7 billion yen
Current assets5,560.8
Fixed assets13,859.9
Current assets3,702.7
Fixed assets3,031.0
Equity ratio15.7%
Equity ratio33.6%
(Billion yen)
Now I would like to discuss the state of our balance sheet. On the right side of this slide you can see our balance sheet excluding the Financial Services segment. As of the end of December 2017, Sony Corporation’s stockholders’ equity was approximately 2.2 trillion yen.
23
1Q 2Q 3Q 4Q 1Q 2Q 3Q 4Q 1Q 2Q 3Q 4Q 1Q 2Q 3Q 4Q 1Q 2Q 3Q 4Q 1Q 2Q 3Q 4Q 1Q 2Q 3Q 4Q 1Q 2Q 3Q 4Q 1Q 2Q 3Q 4Q 1Q 2Q 3Q 4Q 1Q 2Q 3Q
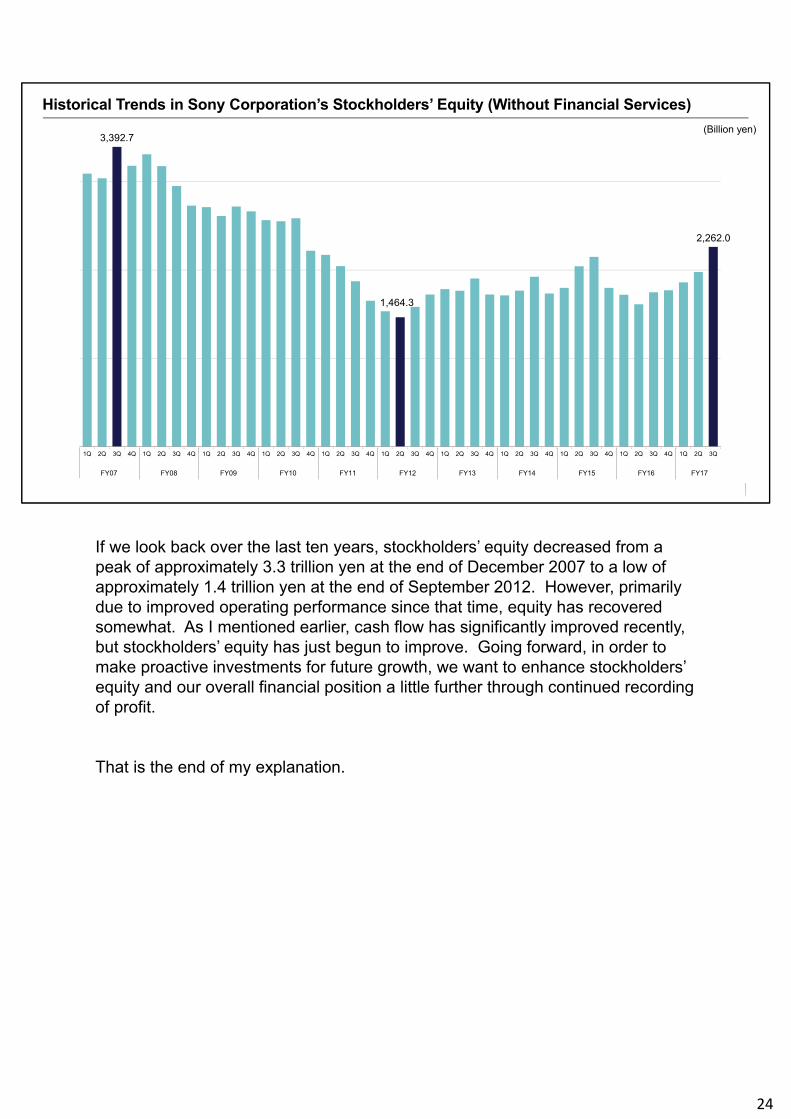
Historical Trends in Sony Corporation’s Stockholders’ Equity (Without Financial Services)
3,392.7
1,464.3
2,262.0
FY07 FY08 FY09 FY10 FY11 FY12 FY13 FY14 FY15 FY16 FY17
(Billion yen)
If we look back over the last ten years, stockholders’ equity decreased from a peak of approximately 3.3 trillion yen at the end of December 2007 to a low of approximately 1.4 trillion yen at the end of September 2012. However, primarily due to improved operating performance since that time, equity has recovered somewhat. As I mentioned earlier, cash flow has significantly improved recently, but stockholders’ equity has just begun to improve. Going forward, in order to make proactive investments for future growth, we want to enhance stockholders’ equity and our overall financial position a little further through continued recording of profit.
That is the end of my explanation.
24

25

Cautionary StatementStatements made in this presentation with respect to Sony’s current plans, estimates, strategies and beliefs and other statements that are not historical facts are
forward-looking statements about the future performance of Sony. Forward-looking statements include, but are not limited to, those statements using words such as“believe,” “expect,” “plans,” “strategy,” “prospects,” “forecast,” “estimate,” “project,” “anticipate,” “aim,” “intend,” “seek,” “may,” “might,” “could” or “should,” and words of similarmeaning in connection with a discussion of future operations, financial performance, events or conditions. From time to time, oral or written forward-looking statements mayalso be included in other materials released to the public. These statements are based on management’s assumptions, judgments and beliefs in light of the informationcurrently available to it. Sony cautions investors that a number of important risks and uncertainties could cause actual results to differ materially from those discussed in theforward-looking statements, and therefore investors should not place undue reliance on them. Investors also should not rely on any obligation of Sony to update or reviseany forward-looking statements, whether as a result of new information, future events or otherwise. Sony disclaims any such obligation. Risks and uncertainties that mightaffect Sony include, but are not limited to:
(i) the global economic and political environment in which Sony operates and the economic and political conditions in Sony’s markets, particularly levels of consumerspending;
(ii) foreign exchange rates, particularly between the yen and the U.S. dollar, the euro and other currencies in which Sony makes significant sales and incursproduction costs, or in which Sony’s assets and liabilities are denominated;
(iii) Sony’s ability to continue to design and develop and win acceptance of, as well as achieve sufficient cost reductions for, its products and services, including imagesensors, game and network platforms, smartphones and televisions, which are offered in highly competitive markets characterized by severe price competitionand continual new product and service introductions, rapid development in technology and subjective and changing customer preferences;
(iv) Sony’s ability and timing to recoup large-scale investments required for technology development and production capacity;(v) Sony’s ability to implement successful business restructuring and transformation efforts under changing market and regulatory conditions;(vi) changes in laws, regulations and government policies in the markets in which Sony operates, including those related to taxation and corporate social
responsibility;(vii) Sony’s ability to implement successful hardware, software, and content integration strategies, and to develop and implement successful sales and distribution
strategies in light of new technologies and distribution platforms;(viii) Sony’s continued ability to devote sufficient resources to research and development and, with respect to capital expenditures, to prioritize investments correctly
(particularly in the electronics businesses);(ix) Sony’s ability to maintain product quality and customer satisfaction with its products and services;(x) the effectiveness of Sony’s strategies and their execution, including but not limited to the success of Sony’s acquisitions, joint ventures and other strategic
investments;(xi) significant volatility and disruption in the global financial markets or a ratings downgrade;(xii) Sony’s ability to forecast demands, manage timely procurement and control inventories;(xiii) Sony's reliance on external business partners, including for the procurement of parts, components, software and network services for its products or services, the
manufacturing, supply and distribution of its products, and its other business operations;(xiv) the outcome of pending and/or future legal and/or regulatory proceedings;(xv) shifts in customer demand for financial services such as life insurance and Sony’s ability to conduct successful asset liability management in the Financial
Services segment;(xvi) the impact of changes in interest rates and unfavorable conditions or developments (including market fluctuations or volatility) in the Japanese equity markets on
the revenue and operating income of the Financial Services segment;(xvii) the ability of Sony, its third-party service providers or business partners to anticipate and manage cybersecurity risk, including the risk of unauthorized access to
Sony’s business information, potential business disruptions or financial losses; and(xviii) risks related to catastrophic disasters or similar events.
Risks and uncertainties also include the impact of any future events with material adverse impact.
26