Consolidated Financial Resultsfor 3Q FY2017 (9 months ... · PDF fileConsolidated Financial...
23
© 2018 Internet Initiative Japan Inc. Internet Initiative Japan Inc. TSE1(3774), NASDAQ(IIJI) February 8, 2018 Consolidated Financial Results for 3Q FY2017 (9 months ended December 31, 2017)
Transcript of Consolidated Financial Resultsfor 3Q FY2017 (9 months ... · PDF fileConsolidated Financial...

© 2018 Internet Initiative Japan Inc.
Internet Initiative Japan Inc.TSE1(3774), NASDAQ(IIJI)February 8, 2018
Consolidated Financial Results for 3Q FY2017 (9 months ended December 31, 2017)

© 2018 Internet Initiative Japan Inc.
Agenda
Ⅰ. Summary of 3Q FY2017 Financial Results
Ⅲ. Reference Materials
Ⅱ. Consolidated Financial Results for 3Q FY2017
1

© 2018 Internet Initiative Japan Inc.
Ⅰ. Summary of 3Q FY2017 Financial Results
2
bn = billion %, YoY=1Q-3Q17 compared to 1Q-3Q16
*Income before income tax expense**Net income attributable to IIJ
3Q17(3 months) YoY 1Q-3Q17 Results YoY FY17 Targets YoYRevenue JPY44.6 bn +13.0% JPY127.6 bn +12.3% JPY176.0 bn +11.5%Gross Margin JPY6.7 bn +12.5% JPY19.8 bn +10.8% JPY28.2 bn +11.7%Operating Income JPY1.5 bn +20.9% JPY3.8 bn +19.7% JPY6.5 bn +26.6%Pre-tax income* JPY1.9 bn +40.1% JPY4.3 bn +26.1% JPY6.5 bn +19.8%Net income** JPY1.2 bn +49.6% JPY2.7 bn +40.7% JPY4.0 bn +26.3%
Cloud & SI
Enterprise Network Services Mobile & IoT
Further Business Developments
Internet connectivity revenue grew largely +24.0%YoY with MVNE etc.• IP revenue also stably increasing, expect stronger growth with CDN etc.
Security-related revenue grew largely +26.8%YoY• Strong demands for DDoS protection, secure Web & Mail services
With Omnibus, acquiring demands for WAN and NW replacement• WAN revenue +9.2%YoY, Omnibus revenue more than quadrupled YoY
Omnibus expanding its service functions (WAN enhancement from 1Q18)Construction of our own data center in Chiba prefecture
• Expect future operation cost to be approx. 20% lower with better operation productivity by integrated service facility, outside air cooling & AI control
Differentiate from others with enterprise solution & MVNE• Total mobile revenue: +34.8%YoY, MVNE revenue: +77.7%YoY• MVNE clients as of 3Q17-end: 135 (+7 from 2Q17-end)
Launching Full MVNO services from Mar. 2018 gradually • Private global network, flexible billing control for IoT usage,
original overseas roaming, chip SIM etc. 3Q17-end IoT prospective orders approx. 280: such as
NW cameras, factory IoT • JV with Chubu Electric Power for connected home IoT business• Strong interest to be our partners along with Full MVNO launch
Cryptocurrency exchange and settlement business with prominent Japanese companies• DeCurret Inc. IIJ’s equity method investee with 35% ownership• Launching services from 2H18
CDN JV with Japanese major broadcasting companies “JOCDN” developing business and accumulating orders
• To provide CDN service to major contents holder from 1Q18Over 100 prospects “IIJ electronic contact/communication Note
service” cloud-based collaboration platform allowing various professional involved in home-based cares to share healthcare information, Enhancing partnership with university professors for new ideas for healthcare
Differentiating with Private cloud strategy: Revenue +13.7%YoY• VMware virtualization PF, Multi-cloud, Unified Operation Management etc.
Realizing competitive advantages towards complex projects with Cloud, Security, Network +SI • SI construction +4.0%YoY, SI operation & maintenance +7.3%YoY
Overseas business developing almost as plannedAsian subsidiaries continuously expanding business • 1Q-3Q17 revenue JPY4.25 bn, operating deficit JPY0.08 bn
Expect FY17 to turn positive • Strong interests for GDPR solution, accumulating orders
Expanding existing business steadily: recurring revenue grew 14.2%YoYGrasping business opportunity like FinTech with accumulated business assets of technology, system
infrastructure, customer base and more
© 2018 Internet Initiative Japan Inc.
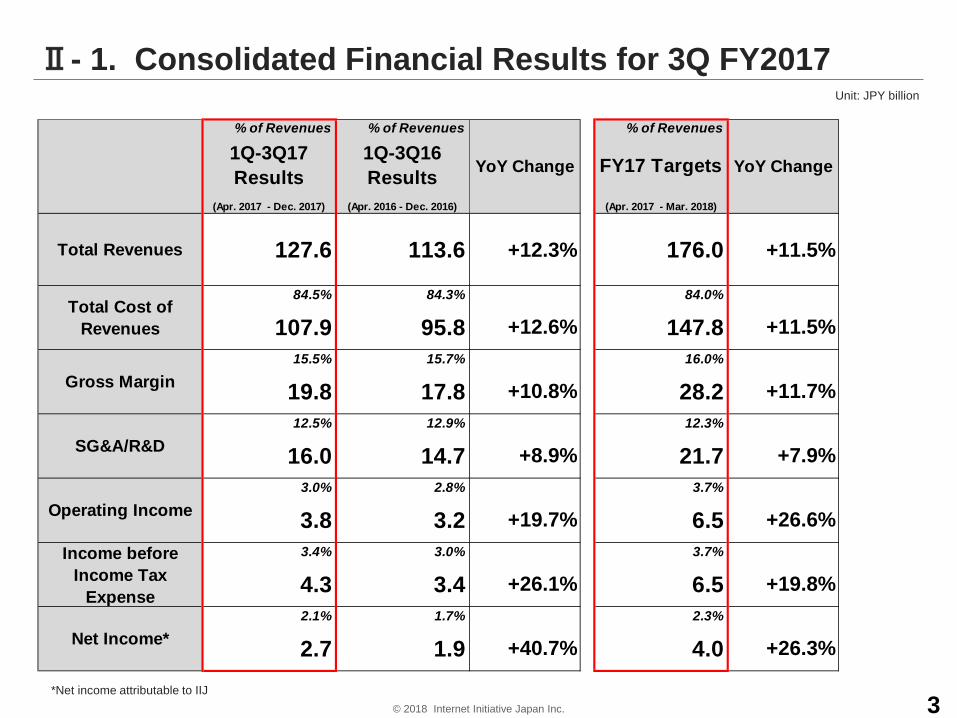
Ⅱ- 1. Consolidated Financial Results for 3Q FY2017Unit: JPY billion
*Net income attributable to IIJ3
% of Revenues % of Revenues % of Revenues
1Q-3Q17Results
1Q-3Q16Results FY17 Targets
(Apr. 2017 - Dec. 2017) (Apr. 2016 - Dec. 2016) (Apr. 2017 - Mar. 2018)
84.5% 84.3% 84.0%
107.9 95.8 +12.6% 147.8 +11.5%15.5% 15.7% 16.0%
19.8 17.8 +10.8% 28.2 +11.7%12.5% 12.9% 12.3%
16.0 14.7 +8.9% 21.7 +7.9%3.0% 2.8% 3.7%
3.8 3.2 +19.7% 6.5 +26.6%3.4% 3.0% 3.7%
4.3 3.4 +26.1% 6.5 +19.8%2.1% 1.7% 2.3%
2.7 1.9 +40.7% 4.0 +26.3%Net Income*
Income beforeIncome Tax
Expense
Operating Income
Gross Margin
SG&A/R&D
YoY Change
Total Cost ofRevenues
Total Revenues 127.6 113.6 +12.3%
YoY Change
+11.5%176.0

© 2018 Internet Initiative Japan Inc.
Ⅱ- 2. Revenues
4
FY16: 157,789 [+12.2%]1Q-3Q16: 113,602 [+14.3%] 1Q-3Q17: 127,612 [+12.3%]
Unit: JPY millionNW Services
ATM Operation Business
Equipment Sales
Systems Integration (SI)
Outsourcing Service
Internet Connectivity Services (Enterprise)
WAN Service
Internet Connectivity Services (Consumer) Systems Operation and MaintenanceSystems Construction
Recurring Revenue*1Q-3Q17: JPY107,770 million (up 14.2% YoY)(84.5% of 1Q-3Q17 revenues)
One-time Revenue *1Q-3Q17: JPY16,806 million (up 3.9% YoY)(13.2% of 1Q-3Q17revenues)
[ ] , YoY = compared to the same period in a previous year
• One-time revenues, which are systems construction and equipment sales, are recognized when systems or equipment are delivered and accepted by customers• Recurring revenues represent the following monthly recurring revenues: Internet Connectivity Services for Enterprise, Internet Connectivity Services for Consumer, Outsourcing
Services, WAN Services, and Systems Operation and Maintenance
[+15.0%] [+12.0%] [+16.0%] [+7.1%] [+13.2%] [+10.8%] [+13.0%]

© 2018 Internet Initiative Japan Inc.
Ⅱ- 3. Cost of Revenues and Gross Margin Ratio
5
[+17.8%] [+14.6%] [+19.8%] [+6.9%] [+13.3%] [+11.5%]
FY16: 132,542 [+14.3%]1Q-3Q17: 107,856 [+12.6%]1Q-3Q16: 95,722 [+17.4%]
Gross Margin
NW Services
NW ServicesGross margin ratio:
ATM Operation Business
SI
Equipment SalesSI
Overall
Cost of revenues:
Total1Q-3Q17: JPY19,756 million (up 10.8% YoY)1Q-3Q16: JPY17,830 million (up 0.2% YoY)
NW Services1Q-3Q17: JPY13,890 million (up 13.8% YoY)1Q-3Q16: JPY12,207 million (up 9.6% YoY) Mobile gross margin amount continued to
increase YoY. Mobile gross margin ratio on a slightly decreasing trend QoQ along with an increase in MVNE transactions
The revised NTT DOCOMO’s interconnectivity charge, fixed in Mar. 2017, decreased by 14% YoY (unlike the previous revisions, the calculation excluded the cost for lending SIM). Charge is expected to be revised in Mar. 2018.
SI1Q-3Q17: JPY4,403 million (up 4.5% YoY)1Q-3Q16: JPY4,214 million (down 22.9% YoY)
Unit: JPY million[ ] , YoY = compared to the same period in a previous year
QoQ = 3Q17 compared to 2Q17
[+13.1%]

© 2018 Internet Initiative Japan Inc.
Ⅱ- 4. Network Services (1)Revenues
6
Internet Connectivity (Enterprise) 1Q-3Q17: up 24.0% YoY
• MVNE & enterprise mobile solution continued to increase 3Q17-end subs.: 744 thousand (up 48.5% YoY)
Internet Connectivity (Consumer) 1Q-3Q17: up 17.6% YoY
• “IIJmio Mobile Services” 3Q17-end subs.: 987 thousand (up 8.2%YoY)
Outsourcing Services 1Q-3Q17: up 18.0% YoY,
• Security-related revenue continued to grow 1Q-3Q17 : up 26.8% YoY
WAN Services 1Q-3Q17: up 9.2% YoY
(*) To focus our resources on mobile services, IIJ sold all the shares of common stock of hi-ho, Inc. which was IIJ’s wholly owned subsidiary and mainly provides fixed Internet connectivity services for consumer, on Dec. 31, 2017
(**) Total contracted bandwidth is calculated by multiplying number of contracts by contracted bandwidths respectively for IP service, data center connectivity service and IIJ FiberAccess/F and IIJ DSL/F of Internet connectivity services (Enterprise).
NW Services Revenues
Mobile
Unit: JPY million[ ] , YoY = compared to the same period in a previous year
QoQ = 3Q17 compared to 2Q17
FY16: 92,996 [+17.3%]
5,693 6,415 7,010 7,587 8,238
1Q-3Q16: 68,481 [+17.6%]
8,498
Outsourcing ServicesInternet Connectivity Services (Consumer) (*)
WAN Services
Total Contracted Bandwidth(**) (Gbps)Internet Connectivity Services (Enterprise)
9,042
1Q-3Q17: 80,000 [+16.8%]
Mobile services:1Q-3Q17: up 34.8% YoY
Non-mobile services:1Q-3Q17: up 9.8% YoY
© 2018 Internet Initiative Japan Inc.
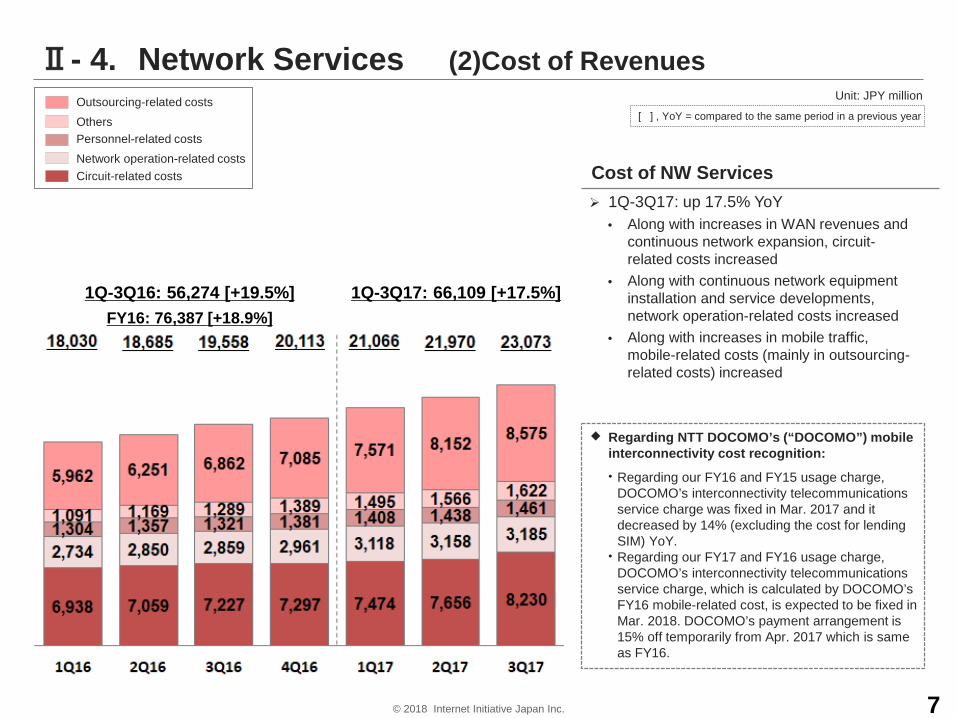
Ⅱ- 4. Network Services (2)Cost of Revenues
7
OthersOutsourcing-related costs
Personnel-related costsNetwork operation-related costsCircuit-related costs
1Q-3Q17: up 17.5% YoY• Along with increases in WAN revenues and
continuous network expansion, circuit-related costs increased
• Along with continuous network equipment installation and service developments, network operation-related costs increased
• Along with increases in mobile traffic, mobile-related costs (mainly in outsourcing-related costs) increased
Regarding NTT DOCOMO’s (“DOCOMO”) mobile interconnectivity cost recognition:• Regarding our FY16 and FY15 usage charge,
DOCOMO’s interconnectivity telecommunications service charge was fixed in Mar. 2017 and it decreased by 14% (excluding the cost for lending SIM) YoY.
• Regarding our FY17 and FY16 usage charge, DOCOMO’s interconnectivity telecommunications service charge, which is calculated by DOCOMO’s FY16 mobile-related cost, is expected to be fixed in Mar. 2018. DOCOMO’s payment arrangement is 15% off temporarily from Apr. 2017 which is same as FY16.
Unit: JPY million[ ] , YoY = compared to the same period in a previous year
Cost of NW Services
FY16: 76,387 [+18.9%] 1Q-3Q16: 56,274 [+19.5%] 1Q-3Q17: 66,109 [+17.5%]

© 2018 Internet Initiative Japan Inc.
Ⅱ- 5. Systems Integration (SI) (1)Revenues
8
Systems Construction 1Q-3Q17 revenue: up JPY558 million YoY Large-scale construction projects orders received
in 3Q17: • Virtual desktop infrastructure for a prominent service
business operator• External web server for a major broadcast station• NW construction for a major automotive
manufacturer• Back office system for a major travel agency• Cloud migration of large BtoC site
etc.
1Q-3Q17 revenue: up JPY1,885 million YoY Continuous revenue growth mainly due to the
accumulation of systems construction which migrated to systems operation and maintenance phase as well as continuous increase in private Cloud revenue• 1Q-3Q17 revenue from private Cloud: up 11.5% YoY• 1Q-3Q17 revenue from SI construction: up 4.5% YoY
86.4% of 3Q17 Cloud-related revenue is recognized in systems operation and maintenance revenues (13.6% in outsourcing)
Systems construction revenues
Order backlog (sum of systems construction and equipment sales)
Order received (sum of systems construction and equipment sales)
Systems operation and maintenance revenues
Cloud revenues within systems operation and maintenance revenues
Unit: JPY million
[ ] , YoY = compared to the same period in a previous year
6,564 6,758 7,709 5,691 6,664 6,879 5,658
FY16: 22,626 [+7.0%]1Q-3Q16: 13,973 [+21.0%]
10,586 10,608 9,505 11,178 10,326 8,376 10,325
FY16: 35,123 [+6.3%]1Q-3Q16: 25,885 [+6.2%]
Systems Operation and Maintenance
1Q-3Q17: 14,530 [+4.0%]
1Q-3Q17: 27,771 [+7.3%]
© 2018 Internet Initiative Japan Inc.
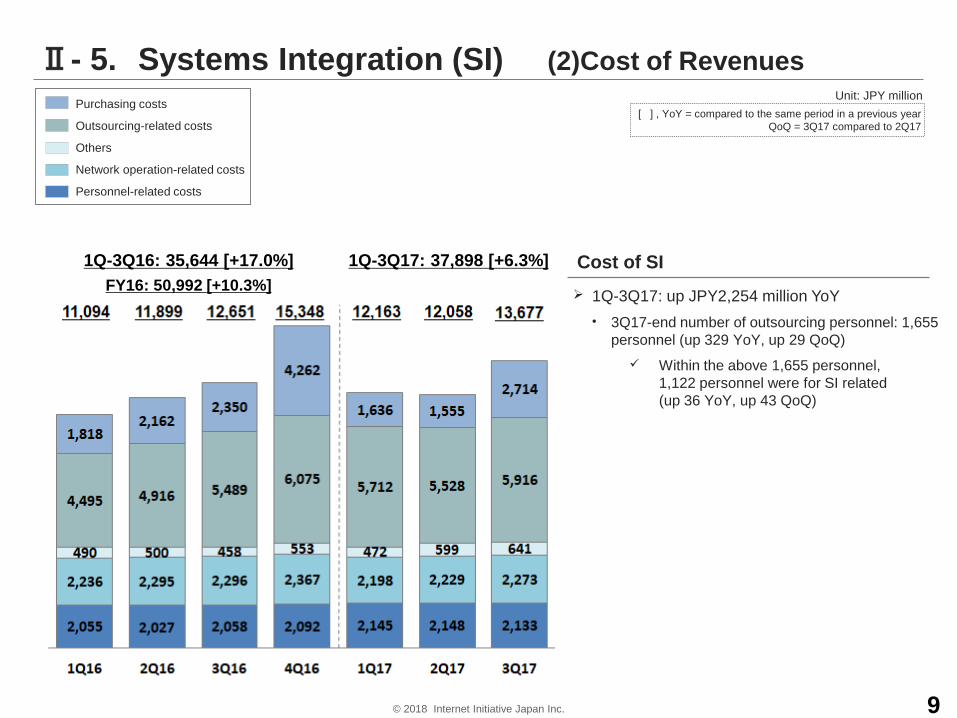
Ⅱ- 5. Systems Integration (SI) (2)Cost of Revenues
9
Others
Purchasing costs
Outsourcing-related costs
Personnel-related costs
Network operation-related costs
1Q-3Q17: up JPY2,254 million YoY• 3Q17-end number of outsourcing personnel: 1,655
personnel (up 329 YoY, up 29 QoQ) Within the above 1,655 personnel,
1,122 personnel were for SI related(up 36 YoY, up 43 QoQ)
Cost of SI
Unit: JPY million[ ] , YoY = compared to the same period in a previous year
QoQ = 3Q17 compared to 2Q17
FY16: 50,992 [+10.3%]1Q-3Q16: 35,644 [+17.0%] 1Q-3Q17: 37,898 [+6.3%]
© 2018 Internet Initiative Japan Inc.
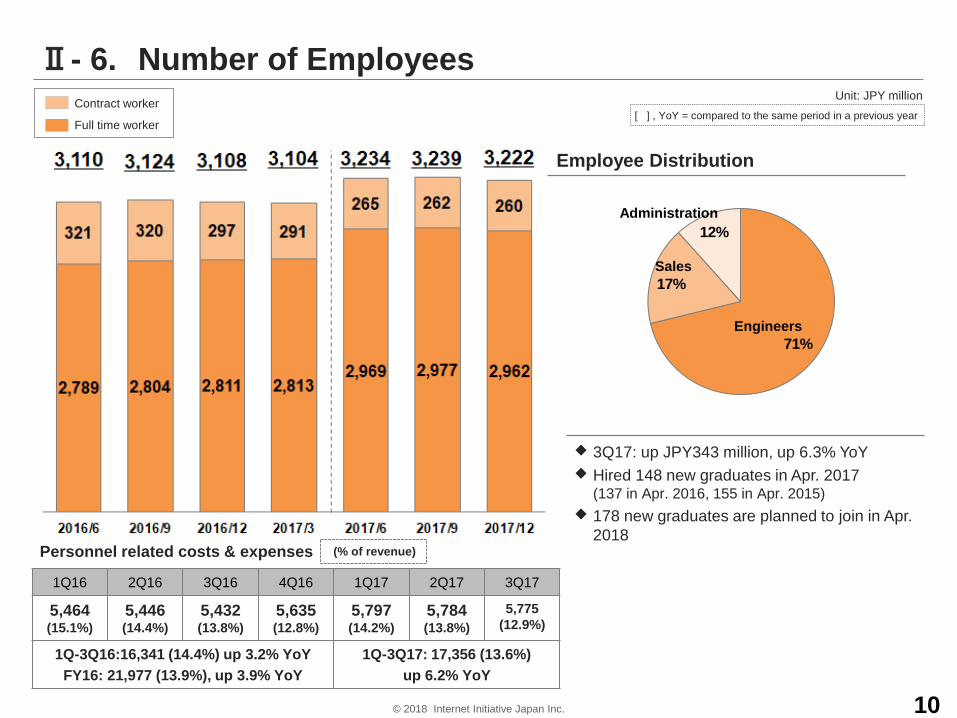
Ⅱ- 6. Number of Employees
10
71%
17%
12%
Personnel related costs & expenses
Employee Distribution
Engineers
Sales
Administration
Contract worker
Full time worker
(% of revenue)
Unit: JPY million[ ] , YoY = compared to the same period in a previous year
1Q16 2Q16 3Q16 4Q16 1Q17 2Q17 3Q17
5,464(15.1%)
5,446(14.4%)
5,432(13.8%)
5,635(12.8%)
5,797(14.2%)
5,784(13.8%)
5,775(12.9%)
1Q-3Q16:16,341 (14.4%) up 3.2% YoYFY16: 21,977 (13.9%), up 3.9% YoY
1Q-3Q17: 17,356 (13.6%)up 6.2% YoY
3Q17: up JPY343 million, up 6.3% YoY Hired 148 new graduates in Apr. 2017
(137 in Apr. 2016, 155 in Apr. 2015) 178 new graduates are planned to join in Apr.
2018

© 2018 Internet Initiative Japan Inc.
Ⅱ- 7. SG&A Expenses/R&D
11
( )Sales & marketing expenses
General & administrative expenses
Research & development expenses
% of total revenues
1Q-3Q17: up 13.8% YoY• Advertising expenses, sales commission
expenses, and personnel-related expenses increased
SG&A related to ATM operation business
Placed 1,101 ATMs as of December 31, 2017
Unit: JPY million
1Q-3Q17: up 2.4% YoY• Personnel-related expenses increased
1Q16 2Q16 3Q16 4Q16 1Q17 2Q17 3Q1743.5 51.1 42.9 47.0 35.5 44.8 36.4
Sales & marketing expenses
General & administrative expenses
Unit: JPY million[ ] , YoY = compared to the same period in a previous year
FY16: 20,113 (12.7%)
1Q-3Q16: 14,675 [+7.0%]
(13.7%) (13.1%) (12.1%)
(5.7%) (5.2%) (4.8%)
(7.6%) (7.6%) (7.0%)
(12.3%)
(5.2%)
(6.9%)
(13.2%)
(5.2%)
(7.7%)
(12.6%)
(4.8%)
(7.6%)
1Q-3Q17: 15,980 [+8.9%]
(11.8%)
(4.3%)
(7.2%)
© 2018 Internet Initiative Japan Inc.
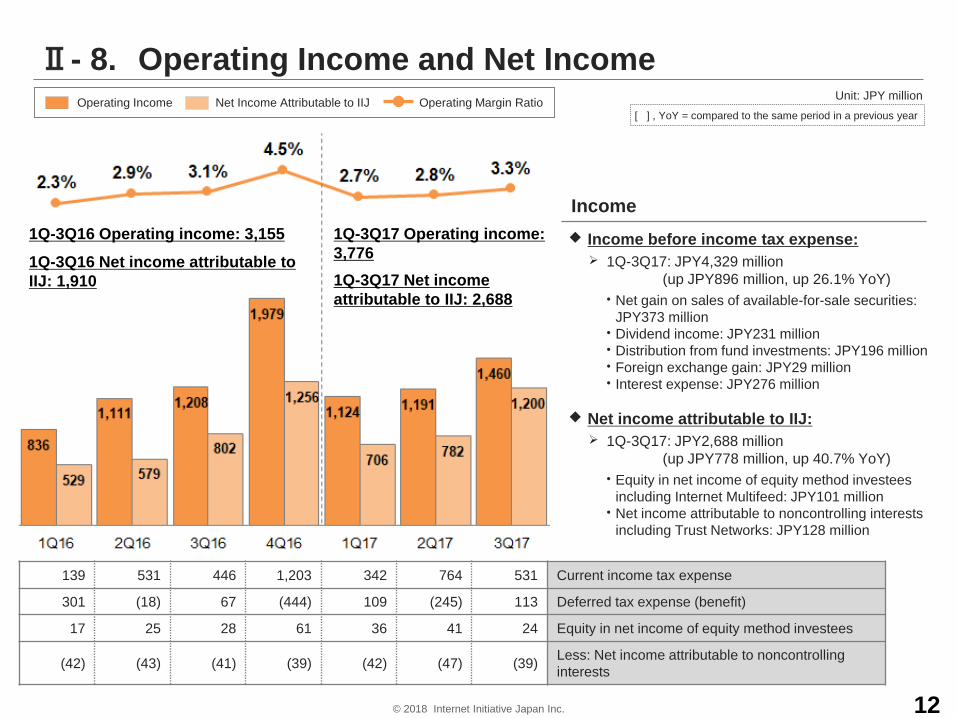
Ⅱ- 8. Operating Income and Net Income
12
Operating Income Net Income Attributable to IIJ Operating Margin Ratio
Income before income tax expense: 1Q-3Q17: JPY4,329 million
(up JPY896 million, up 26.1% YoY)• Net gain on sales of available-for-sale securities:
JPY373 million • Dividend income: JPY231 million• Distribution from fund investments: JPY196 million• Foreign exchange gain: JPY29 million• Interest expense: JPY276 million
Net income attributable to IIJ: 1Q-3Q17: JPY2,688 million
(up JPY778 million, up 40.7% YoY)• Equity in net income of equity method investees
including Internet Multifeed: JPY101 million• Net income attributable to noncontrolling interests
including Trust Networks: JPY128 million
1Q-3Q16 Operating income: 3,1551Q-3Q16 Net income attributable to IIJ: 1,910
139 531 446 1,203 342 764 531 Current income tax expense
301 (18) 67 (444) 109 (245) 113 Deferred tax expense (benefit)
17 25 28 61 36 41 24 Equity in net income of equity method investees
(42) (43) (41) (39) (42) (47) (39) Less: Net income attributable to noncontrolling interests
Income
Unit: JPY million[ ] , YoY = compared to the same period in a previous year
1Q-3Q17 Operating income: 3,7761Q-3Q17 Net income attributable to IIJ: 2,688

© 2018 Internet Initiative Japan Inc.
Ⅱ- 9. Consolidated Balance Sheets (Summary)
13 Total IIJ Shareholders’ Equity to Total Assets: 48.6% as of Mar. 31, 2017, 46.8% as of Dec. 31, 2017
Unit: JPY million

© 2018 Internet Initiative Japan Inc.
Ⅱ- 10. Consolidated Cash Flows
Investing Activities
Financing Activities
Operating Activities
MajorBreakdown
YoY Change
Net income 2,816 +779
Depreciation and amortization 9,156 +1,150
Fluctuations of operating assets and liabilities (3,486) +2,493
MajorBreakdown
YoY Change
Purchase of property and equipment (11,785) (3,845)
of purchase of land (1,205) (1,205)
Proceeds from sales of property & equipment(mainly lease-back transaction) 2,757 +538
Proceeds from sale of stock of a subsidiary(net of cash divested) 726 +726
MajorBreakdown
YoY Change
Principal payments under capital leases (4,230) (695)
Dividends paid (1,217) (91)
Long-term bank borrowings 7,000 (1,500)
Unit: JPY million[ ] , YoY = compared to the same period in a previous year
14
FY16: 7,3681Q-3Q16: 4,408 1Q-3Q17: 8,296
FY16: (7,376)1Q-3Q16: (5,389) 1Q-3Q17: (8,272)
FY16: 2,4921Q-3Q16: 2,831 1Q-3Q17: 1,049

© 2018 Internet Initiative Japan Inc.
Ⅱ- 11. Other Financial Data (CAPEX etc.)
Capital Lease
Cash CAPEX
CAPEX Depreciation and Amortization
Adjusted EBITDA
Unit: JPY million
Revenue and Adjusted EBITDA Annual Growth
FY16: 16,5311Q-3Q16: 12,258
FY16: 10,894
FY16: 16,109
15
1Q-3Q17: 12,931[+15.9%]
1Q-3Q17: 15,756 1Q-3Q17:9,1561Q-3Q16: 8,006
1Q-3Q16: 11,161[-1.8%]
[+7.6%] [+7.7%][+14.3%]
[+12.2%][+11.5%]
[+9.2%]
Adjusted EBITDARevenue (JPY billion)
[ ] = YoY
Including payment of JPY1.2 billion for land

© 2018 Internet Initiative Japan Inc.
Cloud Customer Base
As of Dec. 2015 As of Dec. 2016 As of Dec. 2017
Ⅲ - 1. Cloud Business DevelopmentsCloud-related revenue Unit: JPY billion 3Q17 revenue Unit: JPY billion
Task-specific SaaS 0.53General purpose SaaS 0.08
Private3.32
*Monthly Recurring ChargeMRC* over JPY0.5 millionMRC* over JPY1.0 million
1,520310
190
1,630
210
3301,370
290180
Public 0.62
Cloud-related revenueQuarter-end month’s revenue
1Q-3Q16: 11.59 [+11.6%] 1Q-3Q17: 13.18 [+13.7%]FY16: 15.66 [+11.1%]
16
[ ]=Year over Year change
Differentiating with Private Cloud Strategy VMware Virtualization Platform continued to grow
• Migration from on premise system to cloud are increasing: a prominent travel agency’s service platform, group common communication platform etc.
Connecting with other systems via multi-cloud• Local government’s internal business system etc.
Comprehensively monitoring and operating total systems with “Unified Operation Management Service (UOM)• Providing the service to a major logistics company etc.
Increasing demands for virtual desktop services along with growing security concerns, several ten thousand accounts for a major financial institution
Competitive advantage of IIJ Raptor ASP type high speed foreign exchange system launched in
Nov. 2010 Top share in the Japanese market for ASP FX system, 13
clients include Nomura securities, Sony Bank, Kabu.com and Hirose Tsusyo
Revenue recognized in Task-specific SaaS Raptor will be provided to DeCurret as its system platform
3Q17 Cloud revenue recognition 86.4% in systems operation and maintenance 13.6% in outsourcing services

© 2018 Internet Initiative Japan Inc.
Ⅲ - 2. Mobile and IoT Business DevelopmentsTotal subscription & revenue IIJmio Mobile (consumer) & IIJ Mobile (enterprise)
Total subscription (thousand) Total revenue (JPY billion)
IIJmio MobileIIJ Mobile
Subscription (thousand):
MVNE
Revenue (JPY billion):
IIJmio Mobile
IIJ Mobile
FY16: 26.70(+71.3% YoY)
< >
17
YoY=Year over Year changeQoQ = 3Q17 compared to 2Q17
Advancing as a total MVNO towards both consumer and enterprise 3Q17-end MVNE clients: 135 (+7 QoQ) Continued to be profitable by gathering enterprise and
consumer traffic Enterprise mobile (excluding MVNE) strongly growing 3Q17 revenue JPY0.96 billion (+17.2%YoY, +11.7%QoQ)
• Accumulating solutions such as security cameras, IP transceiver, taxi dispatch system, TV conference system in response to work style reform
Full-MVNO Preparation on track for service launch in Mar. 2018
• Private global network, inventory control with flexible billing management for IoT usage, direct overseas roaming, chip SIM etc.
Originating IoT-related business Establish JV with Chubu Electric Power for Connected
Homes IoT business (Apr. 2018) IoT-related prospective orders & PoC continued increasing
• SIM card for automobile, security cameras etc.• 3Q17-end prospective orders: approx. 280
1Q-3Q16: 19.12(+77.9%YoY)
1Q-3Q17: 25.78(+34.8%YoY)
© 2018 Internet Initiative Japan Inc.
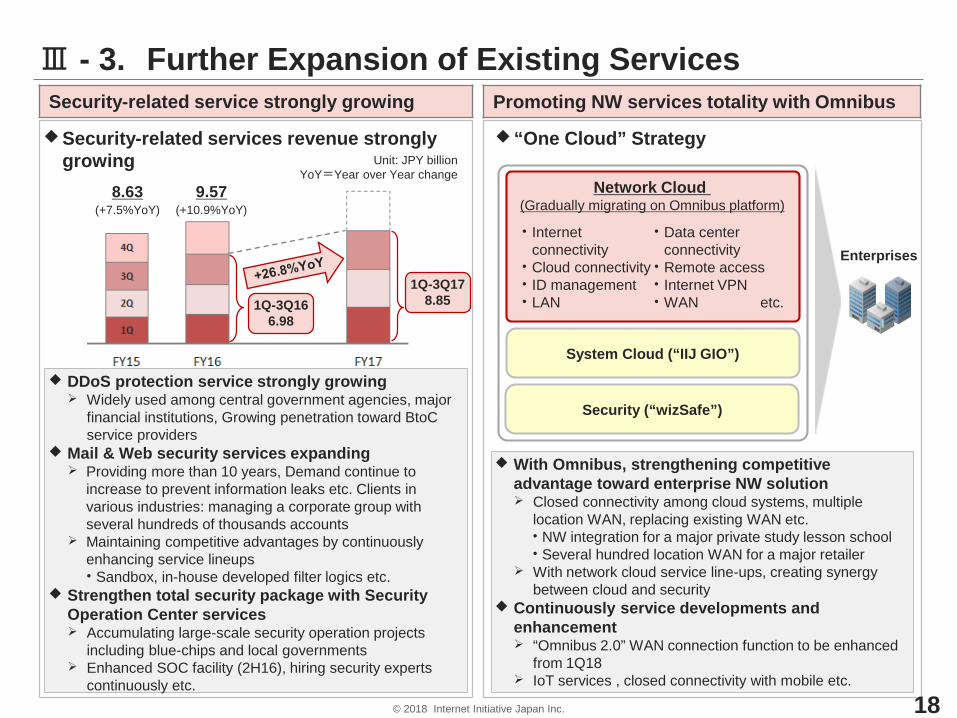
Ⅲ - 3. Further Expansion of Existing Services
Security-related services revenue strongly growing
(+10.9%YoY)(+7.5%YoY)9.578.63
DDoS protection service strongly growing Widely used among central government agencies, major
financial institutions, Growing penetration toward BtoC service providers
Mail & Web security services expanding Providing more than 10 years, Demand continue to
increase to prevent information leaks etc. Clients in various industries: managing a corporate group with several hundreds of thousands accounts
Maintaining competitive advantages by continuously enhancing service lineups• Sandbox, in-house developed filter logics etc.
Strengthen total security package with Security Operation Center services Accumulating large-scale security operation projects
including blue-chips and local governments Enhanced SOC facility (2H16), hiring security experts
continuously etc.
“One Cloud” Strategy
1Q-3Q166.98
1Q-3Q178.85
Enterprises
System Cloud (“IIJ GIO”)
• Internet connectivity
• Cloud connectivity • ID management• LAN
• Data center connectivity
• Remote access• Internet VPN• WAN etc.
Security (“wizSafe”)
Network Cloud (Gradually migrating on Omnibus platform)
Security-related service strongly growing Promoting NW services totality with Omnibus
With Omnibus, strengthening competitive advantage toward enterprise NW solution Closed connectivity among cloud systems, multiple
location WAN, replacing existing WAN etc. • NW integration for a major private study lesson school • Several hundred location WAN for a major retailer
With network cloud service line-ups, creating synergy between cloud and security
Continuously service developments and enhancement “Omnibus 2.0” WAN connection function to be enhanced
from 1Q18 IoT services , closed connectivity with mobile etc.
Unit: JPY billionYoY=Year over Year change
18

© 2018 Internet Initiative Japan Inc. 19
Ⅲ - 4. Further Business Developments (FinTech)
Name DeCurret Inc. (IIJ’s equity method investee)
Est. January 2018
Capital JPY5.23 billion (as of mid-Feb.)
Shareholder IIJ (ownership 35%), 18 other companies
DirectorsPresident: Kazuhiro Tokita (IIJ senior managing executive officer)Part-time directors: IIJ CEO, IIJ COO, IIJ CFO
Providing cryptocurrency exchange and settlement services altogether
Exchange service (from 2H18)• Providing users to exchange various cryptocurrency real time
24 hours 365 days, mainly for consumers Basic function of Wallet will be launched Differentiate with highly reliable system, low bid-ask spread,
and security requirement such as AML/KYC* Bid-ask spread as revenue
Settlement service (from FY19)• Cryptocurrency settlement at location such as E-commerce,
retail shops, BtoBtoC and BtoC business model Co-working with capital partners Bid-ask spread and system usage as revenue
Company Profile
Business
Impact on IIJ’s consolidated financial results etc.<PL> Impacted by equity in net income/loss
of equity method investeesFY18: Assume approx. JPY0.6 bn
equity in net loss FY19: Equity in net loss to become smallerFY20: Turn positive, equity in net income to expand thereafter
Competitive Advantages Trading system leveraging the existing IIJ Raptor system
• Top share ASP FX system in Japan, proving to 13 major Japanese financial institutions Core-engine, dealing system, connecting multiple fx exchanges,
investor service platform, operator management function etc. • Able to launch services by expanding IIJ Raptor function Approx. 70% of DeCurret service system is leveraged from the
existing IIJ Raptor system Executing business with prominent capital partners
• Expect to include electronic money, bank coins and more Aim to be a common platform for partners’ cryptocurrency distribution
• Future potential: connecting payment data and accounting, smart contract, BtoB settlement and more by leveraging blockchain technology
Business Target
<Business>• Raptor & cloud to grow• IIJ owns 35% of DeCurret’s
value* AML(Anti-Money Laundering). KYC(Know Your Customer) refers to a
procedures to verify customer, which is required when opening accounts. In cryptocurrency transaction, KYC is performed through blockchain which reduces the hassle and cost for identity verification.
Members & Usersover 5 million
Members & UsersSettlement revenueExchange revenue
Over 30 million
Revenueover JPY10 bn
© 2018 Internet Initiative Japan Inc. 20
Ⅲ - 4. Further Business Developments (FinTech)Shareholders of DeCurret
© 2018 Internet Initiative Japan Inc. 21
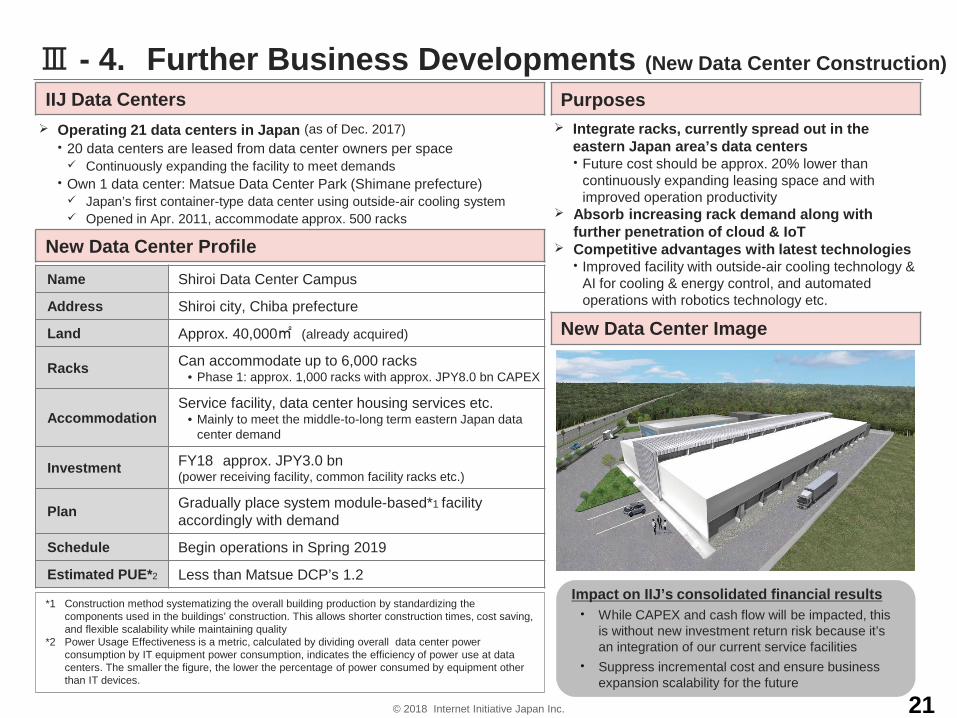
Ⅲ - 4. Further Business Developments (New Data Center Construction)
Operating 21 data centers in Japan (as of Dec. 2017)• 20 data centers are leased from data center owners per space Continuously expanding the facility to meet demands
• Own 1 data center: Matsue Data Center Park (Shimane prefecture) Japan’s first container-type data center using outside-air cooling system Opened in Apr. 2011, accommodate approx. 500 racks
Name Shiroi Data Center Campus
Address Shiroi city, Chiba prefecture
Land Approx. 40,000㎡ (already acquired)
Racks Can accommodate up to 6,000 racks• Phase 1: approx. 1,000 racks with approx. JPY8.0 bn CAPEX
AccommodationService facility, data center housing services etc.
• Mainly to meet the middle-to-long term eastern Japan data center demand
Investment FY18 approx. JPY3.0 bn(power receiving facility, common facility racks etc.)
Plan Gradually place system module-based*1 facilityaccordingly with demand
Schedule Begin operations in Spring 2019
Estimated PUE*2 Less than Matsue DCP’s 1.2
Purposes Integrate racks, currently spread out in the
eastern Japan area’s data centers• Future cost should be approx. 20% lower than
continuously expanding leasing space and with improved operation productivity
Absorb increasing rack demand along with further penetration of cloud & IoT
Competitive advantages with latest technologies• Improved facility with outside-air cooling technology &
AI for cooling & energy control, and automated operations with robotics technology etc.
*1 Construction method systematizing the overall building production by standardizing the components used in the buildings’ construction. This allows shorter construction times, cost saving, and flexible scalability while maintaining quality
*2 Power Usage Effectiveness is a metric, calculated by dividing overall data center power consumption by IT equipment power consumption, indicates the efficiency of power use at data centers. The smaller the figure, the lower the percentage of power consumed by equipment other than IT devices.
New Data Center Image
Impact on IIJ’s consolidated financial results• While CAPEX and cash flow will be impacted, this
is without new investment return risk because it’s an integration of our current service facilities
• Suppress incremental cost and ensure business expansion scalability for the future
IIJ Data Centers
New Data Center Profile

※ Forward-looking statementsStatements made in this presentation regarding IIJ’s or managements’ intentions, beliefs, expectations,or predictions for the future are forward-looking statements that are based on IIJ’s and managements’current expectations, assumptions, estimates and projections about its business and the industry.These forward-looking statements, such as statements regarding revenues, operating and netprofitability are subject to various risks, uncertainties and other factors that could cause IIJ’s actualresults to differ materially from those contained in any forward-looking statement. These risks,uncertainties and other factors include but not limited to:• a decrease of corporate spending or capital expenditure due to depression in the Japanese
economy and/or corporate earnings decreased,• an inability to achieve anticipated results and cause negative impact on profitability,• a possibility that less of reliability for our services and loss of business chances due to interruption
or suspension of our services,• an excess increase and fluctuation in network-rerated cost, mobile-related cost, outsourcing cost,
personnel cost etc,• a possibility to lose business opportunity due to our inadequate resources in personnel and others,• an increase in competition and strong pricing pressure,• the recording of an impairment loss as a result of an impairment test on the non-amortized
intangible assets such as goodwill,• a decline in value and trading value of our holding securities.
Please refer to IIJ’s filings on Form 20-F of its annual report and other filings with the United StatesSecurities and Exchange Commission ("SEC") for other risks.
※ Contact InformationIIJ Investor Relations
Iidabashi Grand Bloom, 2-10-2 Fujimi, Chiyoda-ku, Tokyo, Japan 102-0071TEL: 81-3-5205-6500 URL: https://www.iij.ad.jp/en/ir/ E-Mail: [email protected]