1H FY2017 Financial Results (presentation material) · ②Consolidated Income statement 5...
24
1 1H FY2017 Financial Results (presentation material) November 17, 2017 CMK CORPORATION CMK CORPORATION (Stock code:6958)
Transcript of 1H FY2017 Financial Results (presentation material) · ②Consolidated Income statement 5...

1
1H FY2017 Financial Results(presentation material)
November 17, 2017
CMK CORPORATION
CMK CORPORATION
(Stock code:6958)

Contents
2
1.Consolidated financial results for
1H FY2017
2.Trends of Automotive PWB market and Sales performance of CMK
3. Supplementary material onfinancial results
1.Consolidated financial results for 1H FY2017
3

①Key points of 1H FY 2017 Financial results
4
Consolidated financial results for 1H FY2017
• Continued momentum in the increasing orders of our key products
for automotive use
• Sales increased and profitability improved simultaneously, reflecting the impact of production capacity enhancements and productivity improvements
37,148 35,785 39,584
41,981
884 860
1,791
2,136
0
1,000
2,000
3,000
0
10,000
20,000
30,000
40,000
50,000
2H FY 2015
Results
1H FY 2016
Results
2H FY 2016
Results
1H FY2017
Results
Opera
ting in
com
e (M
illions o
f Yen)
Sale
s (Millio
ns o
f Yen)
Sales Operating income
0
②Consolidated Income statement
5
Consolidated financial results for 1H FY2017
1H FY 2016Results
1H FY 2017Results
YoY
Change %
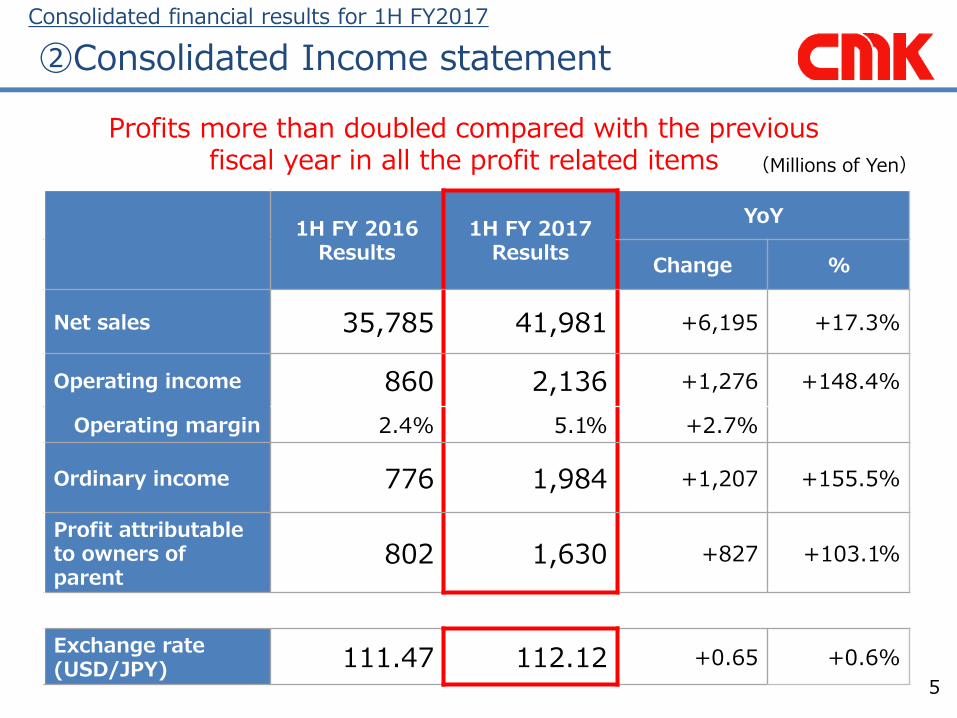
Net sales 35,785 41,981 +6,195 +17.3%
Operating income 860 2,136 +1,276 +148.4%
Operating margin 2.4% 5.1% +2.7%
Ordinary income 776 1,984 +1,207 +155.5%
Profit attributable to owners of parent
802 1,630 +827 +103.1%
Exchange rate(USD/JPY) 111.47 112.12 +0.65 +0.6%
(Millions of Yen)
Profits more than doubled compared with the previous fiscal year in all the profit related items

253
298
13
14
3
4
11
11
8
14
67
76
0 50 100 150 200 250 300 350 400 450
1H FY 2016
Results
1H FY 2017
Results
Car electronics
357
419
(Hundred Millions of Yen)
AV equipment Digital still cameraMobile communications Amusement Others
1H FY 2017Results
1H FY 2016Results
Car electronics
AV equipment Digital still cameraMobile communications Amusement Others
③Sales by application
6
Consolidated financial results for 1H FY2017
• Steady growth in sales of products for automotive use continued, driven by the progress of automotive electrification
• Among products for amusement use, sales for popular game equipment use increased
+18.1%

④Enhancing overseas production capability
Consolidated financial results for 1H FY2017
As we are continuously at full production capacity in all factories,further production capacity enhancement is under consideration
7
Thailand
China
CMK Corporation (THAILAND) co., ltd. (Double-sided PWBs, Multilayered PWBs, HDI PWBs)
・ Order intake mainly of products for automotive use remains strong
・ In the end of September, enhanced production capacity by 30% compared with the previous fiscal year(acceleration of the initial schedule)
CMK electronics (WUXI) co., ltd.(HDI PWBs)
・ HDI PWBs adopted in products for automotive use increased
・ In the end of June, enhanced production capacity by 30% compared with the previous fiscal year
CMKC (Dong Guan) ltd.(Double-sided PWBs, HDI PWBs)
・ The factory manufacturing products for automotive usebeing operated continuously at full capacity

235 256 260
6.3
8.9
12.7
0
3
6
9
12
15
18
0
50
100
150
200
250
300
1H FY 2016
Results
2H FY 2016
Results
1H FY 2017
Results
Opera
ting in
com
e
(Hundre
d M
illions o
f Yen)
Sale
s (Hundre
d M
illions o
f Yen)
Changes in Japan profit and loss
Net Sales Operating income
Operating margin
4.9%
⑤Improving domestic productivity
8
Consolidated financial results for 1H FY2017
• Domestic operating margin increased by1.4% as a result of our focus on productivity improvements mainly in Niigata factory
• Further improvement in profits expected in the second half
Operating margin
2.7%
Focus o
n im
pro
vin
g
pro
ductiv
ity
Dow
nsiz
ing o
f dom
estic
pro
ductio
n site
s
Operating margin
3.5%

⑥Analysis of changes in Operating income
9
Consolidated financial results for 1H FY2017
8.6
1.9
18.7
3.0 ▲10.9
21.3
1H FY 2016
Operating income
(Results)
1H FY 2017
Operating income
(Results)
Streamliningbusiness operations
Profit increasedue to sales growth
Improved yieldsIncreased productivity Decreased sales prices
Cost reduction etc.
On the momentum of continuing strong orders mainly of products for automotive use, financial results improved driven by profit growth through sales increase as a result of production capacity enhancements
(Hundred Millions of Yen)

⑦Forecast of Consolidated Income statement
10
Consolidated financial results for 1H FY2017
FY 2016Results
FY 2017Forecast
YoY
Change %
Net sales 75,370 80,000 +4,629 +6.1%
Operating income 2,652 4,000 +1,347 +50.8%
Operating margin 3.5% 5.0% +1.5%
Ordinary income 2,628 3,700 +1,071 +40.7%
Profit attributable to owners of parent
2,153 3,000 +846 +39.3%
Exchange rate(USD/JPY) 109.28 110.00 +0.72 +0.7%
(Millions of Yen)

2.Trends of Automotive PWB market and Sales performance of CMK
11

1. Increase in the number of sales of new cars Strong sales of new cars continue globally
The car ownership rate in China and India where maintain high economic growth rates still remains at a low level and the markets are expected to grow further
2. Growing popularity of environment friendly next generation automobiles (PHV/EV etc.) This year, regulations for fuel efficiency and emission control of
automobiles are tightened in many countries around the world
Automakers have switched over to the development of next generation automobiles which are expected to become more popular rapidly in future
3. Widespread adoption of the Advanced Driving Assistance System (ADAS) Adaption of ADAS increased rapidly, driven by growing needs for active
safety and driving assistance
Japanese government sets a target to increase the adaption rate of Emergency Brake Assist into new cars up to 90% or more by 2020
①Trends of Automotive market
12
Trends of Automotive PWB market and Sales performance of CMK

More use of ECU to meet demand for environment friendly and highly functional automobiles
(ECU with an annual growth of 10% and over between 2015~2021)
②Progress of automotive electrification
13
Trends of Automotive PWB market and Sales performance of CMK
ADAS/Automatic operating system
Radar sensor
Car camera
Power Window smart motor
Driving Control and Safety ECUSmart sensor/Actuator
Battery monitoring
Hybrid control
DC-DC converter
Motor drive
Vehicle battery charger
Powertrain ECU
Idle reduction
DI engine
Power management
Head lamp
Body electronics ECUInformation and
Communication ECU
HV/PHV/EV/FCV ECU
IVI system
Telematics
※Source:prepared by CMK reference to Fuji Chimera Research [Comprehensive Study of In–Vehicle Electronic Devices & Components 2017]
The number of ECU embedded in automobiles increased dramatically, driven by widespread use of next generation automobiles and ADAS

③Change in the number of ECU used in automobiles
14
Trends of Automotive PWB market and Sales performance of CMK
※Source:prepared by CMK reference to Fuji Chimera Research [Present situation and future prospect of the
automotive ECU market in 2014], [Comprehensive Study of In–Vehicle Electronic Devices & Components 2017]
The number of ECU embedded in automobiles increased ahead of the forecast in 2014, reflecting the accelerated progress of automotive electrification
20.2
22.7 21.6
30.4
0
5
10
15
20
25
30
35
2016 2017 2018 2020 2025
Num
ber o
f ECU
(unit)
Number of ECU per an automobile
As of 2014Prospect・Forecast
As of 2017Prospect・Forecast
+34%
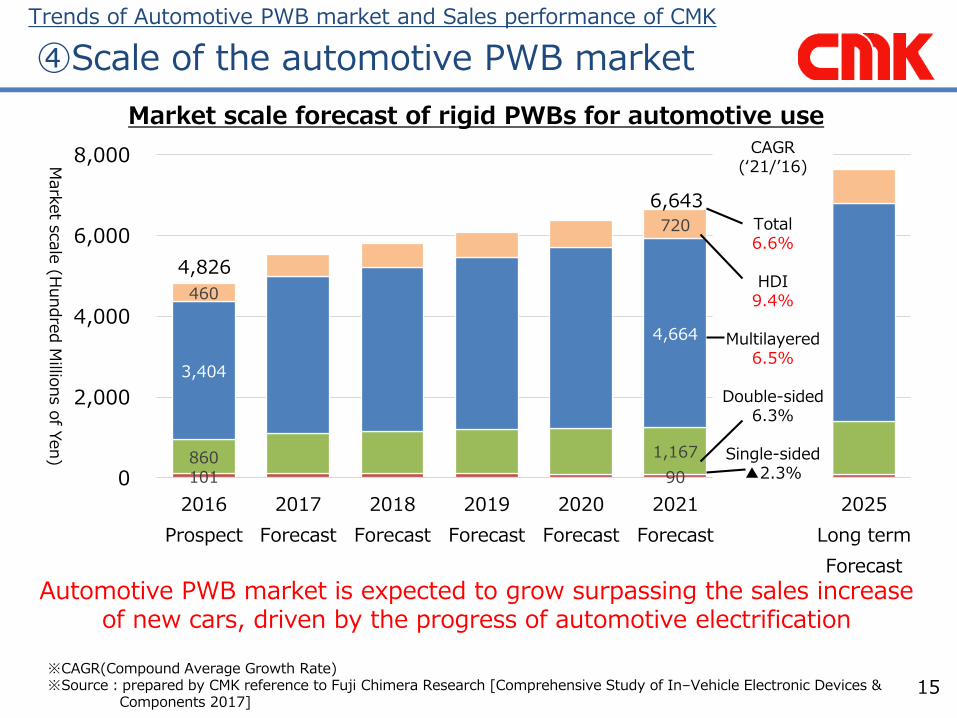
④Scale of the automotive PWB market
15
Automotive PWB market is expected to grow surpassing the sales increase of new cars, driven by the progress of automotive electrification
101 90 860 1,167
3,404
4,664
460
720
0
2,000
4,000
6,000
8,000
2016
Prospect
2017
Forecast
2018
Forecast
2019
Forecast
2020
Forecast
2021
Forecast
2025
Long term
Forecast
Mark
et sc
ale
(Hundre
d M
illions o
f Yen)
Market scale forecast of rigid PWBs for automotive use
4,826
6,643
CAGR(‘21/’16)
Total6.6%
HDI9.4%
Multilayered6.5%
Double-sided6.3%
Single-sided▲2.3%
Trends of Automotive PWB market and Sales performance of CMK
※CAGR(Compound Average Growth Rate)※Source:prepared by CMK reference to Fuji Chimera Research [Comprehensive Study of In–Vehicle Electronic Devices &
Components 2017]
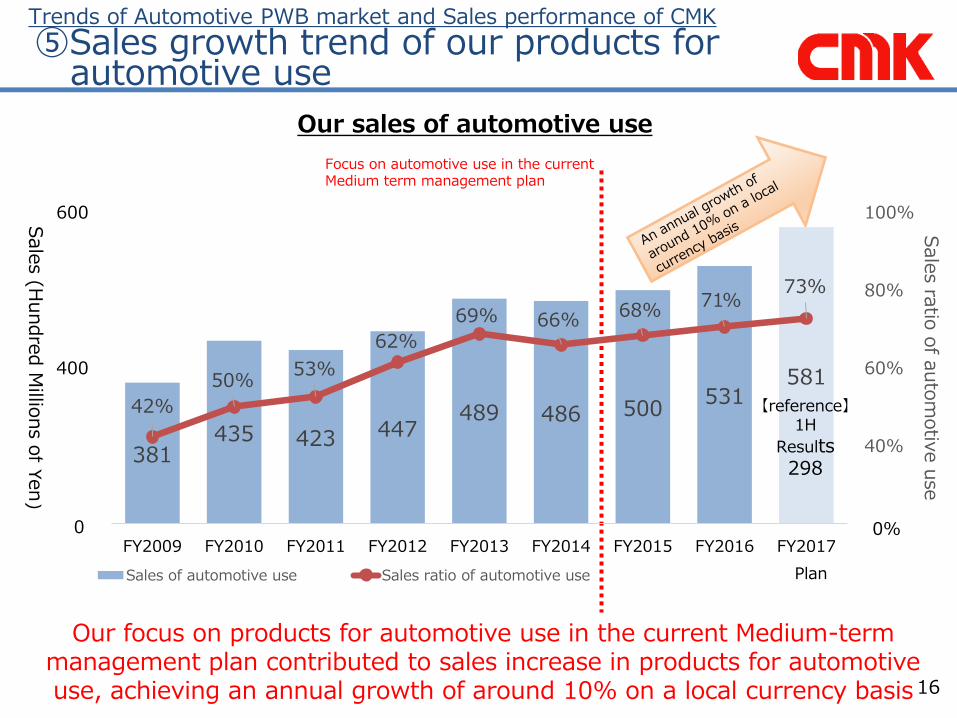
⑤Sales growth trend of our products forautomotive use
16
Our focus on products for automotive use in the current Medium-term management plan contributed to sales increase in products for automotive use, achieving an annual growth of around 10% on a local currency basis
Trends of Automotive PWB market and Sales performance of CMK
381 435 423 447
489 486 500 531
581
42%
50%53%
62%
69% 66%68%
71%73%
20%
40%
60%
80%
100%
200
400
600
FY2009 FY2010 FY2011 FY2012 FY2013 FY2014 FY2015 FY2016 FY2017
Sale
s ratio
of a
uto
motiv
e u
se
Sale
s (Hundre
d M
illions o
f Yen)
Our sales of automotive use
Sales of automotive use Sales ratio of automotive use
Focus on automotive use in the current Medium term management plan
【reference】1H
Results298
Plan
0 0%

⑥Applications of PWBs and CMK’s positioning
17
Our focus on potential market growth, added value to products and highly reliable business areas contributed to increase sales of PWBs for Powertrain/Driving Control and Safety, and HDI PWBs every year
Trends of Automotive PWB market and Sales performance of CMK
Require
d re
liability
Valu
e-a
dded P
roducts
Mark
et g
row
th
Single-sided Double-sided Multilayered HDI
Powertrain
Engine Management System, Inverter etc.
Driving Controland Safety
Brake Control System, Electric Stability Control, airbag, Millimeter-Wave Radar, Car camera, Tire Pressure Monitoring System etc.
Car navigation, View monitor,Intelligent Transport Systems etc.
Information and Communication
Body Electronics Climate Control
Headlamp, mater panel etc.
Air conditioner, Mirror Control, Power seat, Sunroof etc.

⑦Sales promotion for foreign customers
18
Trends of Automotive PWB market and Sales performance of CMK
• ‘Overseas sales expansion’ is set as one of our key strategies in the current Medium-term management plan to strengthen sales activity targeting foreign customers
【Progress status】
Orders of products for automotive use from major foreign customers increased steadily as originally planned
CMKC (Dong Guan) in China achieved more than doubled ratio of sales to foreign customers in the first half of this fiscal year compared with the previous fiscal year
CMK Thailand expects to increase sales to foreign customers significantly
CMK stays ahead of the competition in automotive PWB market by expanding sales to foreign customers as well as focusing on growing areas
3. Supplementary material onfinancial results
19

① Sales by application
20
Supplementary material on financial results
1H FY2016Results
1H FY2017Results
YoYChange
FY2017Forecast
Car electronics 253 298 +45 581
Mobile communications 13 14 +1 29
AV equipment 3 4 +0 15
Digital still camera 11 11 -0 20
Amusement 8 14 +5 21
Others 67 76 +8 130
Total 357 419 +61 800
(Hundred Millions of yen)

②Sales by type of PWBs
21
Supplementary material on financial results
1H FY2016Results
1H FY2017Results
YoYChange
FY2017Forecast
HDI PWBs 101 129 +27 235
Multilayered PWBs 152 177 +25 357
Double-sided PWBs 69 76 +6 129
Others 34 36 +2 76
Total 357 419 +61 800
( Hundred Millions of yen )

③ Financial results by region
22
Supplementary material on financial results
1H FY2016Results
1H FY2017Results
YoYChange
FY2017Forecast
SalesOperating
incomeSales
Operating income
SalesOperating
incomeSales
Operating income
Japan 235 6.3 260 12.7 +24 +6.4 493 19.9
China 104 3.0 141 6.3 +36 +3.2 277 16.8
Southeast Asia 78 1.3 99 2.2 +21 +0.8 210 6.7
Europe & North America
27 1.2 29 1.8 +2 +0.5 54 3.1
Total 446 12.0 531 23.1 +85 +11.1 1,034 46.7
Adjustment ▲88 ▲3.4 ▲111 ▲1.8 ▲23 +1.6 ▲234 ▲6.7
Consolidated 357 8.6 419 21.3 +61 +12.7 800 40.0
( Hundred Millions of yen )
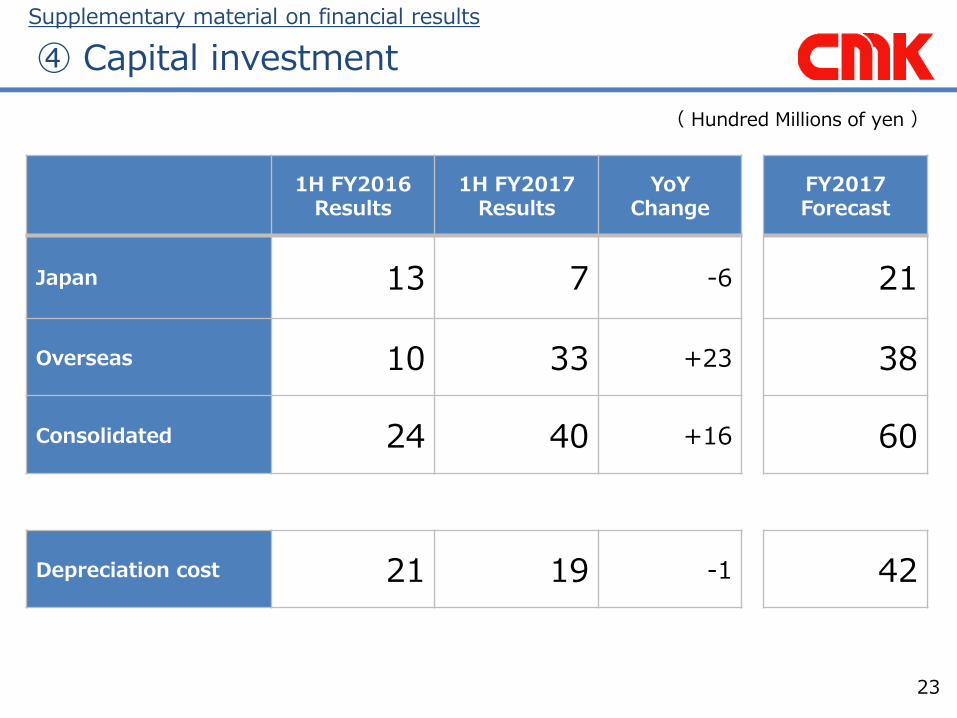
④ Capital investment
23
Supplementary material on financial results
1H FY2016Results
1H FY2017Results
YoYChange
FY2017Forecast
Japan 13 7 -6 21
Overseas 10 33 +23 38
Consolidated 24 40 +16 60
Depreciation cost 21 19 -1 42
( Hundred Millions of yen )

24
END
Future-related information and descriptions in this material are just forward-looking statements and not guarantees for future achievements
(Amounts are rounded, and % is rounded to one decimal place.)


![FY2017 Financial Results · 2018-05-21 · ©2018 Topcon Corporation 5 FY2017 Financial Results by Business [Consolidated] FY2016 FY2017](https://static.fdocuments.in/doc/165x107/5f7157b8a702f55df61cd566/fy2017-financial-results-2018-05-21-2018-topcon-corporation-5-fy2017-financial.jpg)