Q3 2021 Earnings Call Presentation
11
2021 Third Quarter Earnings Call Presentation November 12, 2021 Greg Yull | President & CEO Jeff Crystal | CFO
Transcript of Q3 2021 Earnings Call Presentation

2021 Third Quarter Earnings Call PresentationNovember 12, 2021
Greg Yull | President & CEOJeff Crystal | CFO

INTERTAPE POLYMER GROUP 2November 12, 2021
Safe Harbor Statement Certain statements and information included in this presentation constitute "forward-looking information" within the meaning of applicable Canadian securities legislation and "forward-looking statements" within the meaning of Section 27A of the Securities Act of 1933, as amended, and Section 21E of the Securities Exchange Act of 1934, as amended (collectively, "forward-looking statements"), which are made in reliance upon the protections provided by such legislation for forward-looking statements. All statements other than statements of historical facts included in this presentation, including statements regarding the Company's structural improvements, as well as the tailwinds and headwinds affecting the Company's performance; the Company's goals for managing dollar spread; the Company's 2021 outlook; and the Company's positioning to deliver consistent GDP+ growth; may constitute forward-looking statements. These forward-looking statements are based on current beliefs, assumptions, expectations, estimates, forecasts and projections made by the Company's management. Words such as "may," "will," "should," "expect," "continue," "intend," "estimate," "anticipate," "plan," "foresee," "believe," or "seek" or the negatives of these terms or variations of them or similar terminology are intended to identify such forward-looking statements. Although the Company believes that the expectations reflected in these forward-looking statements are reasonable, these statements, by their nature, involve risks and uncertainties and are not guarantees of future performance. Such statements are also subject to assumptions concerning, among other things: business conditions and growth or declines in the Company's industry, the Company's customers' industries and the general economy, including as a result of the impact of COVID-19; the anticipated benefits from the Company's greenfield projects and manufacturing facility expansions; the impact of fluctuations in raw material prices and freight costs; the anticipated benefits from the Company's acquisitions and partnerships; the anticipated benefits from the Company's capital expenditures; the quality and market reception of the Company's products; the Company's anticipated business strategies; risks and costs inherent in litigation; legal and regulatory developments, including as related to COVID-19; the Company's ability to maintain and improve quality and customer service; anticipated trends in the Company's business; anticipated cash flows from the Company's operations; availability of funds under the Company's 2021 Credit Facility; the Company's flexibility to allocate capital as a result of the 2021 Senior Unsecured Notes offering; the Company's ability to continue to control costs; and other factors beyond the Company's control. The Company can give no assurance that these statements and expectations will prove to have been correct. Actual outcomes and results may, and often do, differ from what is expressed, implied or projected in such forward-looking statements, and such differences may be material. You are cautioned not to place undue reliance on any forward-looking statement.
For additional information regarding important factors that could cause actual results to differ materially from those expressed in these forward-looking statements and other risks and uncertainties, and the assumptions underlying the forward-looking statements, you are encouraged to read "Item 3. Key Information - Risk Factors," "Item 5. Operating and Financial Review and Prospects (Management's Discussion & Analysis)" and statements located elsewhere in the Company's annual report on Form 20-F for the year ended December 31, 2020 and the other statements and factors contained in the Company's filings with the Canadian securities regulators and the US Securities and Exchange Commission. Each of these forwardlooking statements speaks only as of the date of this presentation. The Company will not update these statements unless applicable securities laws require it to do so.
This presentation contains certain non-GAAP financial measures as defined under applicable securities legislation, including adjusted EBITDA, adjusted EBITDA margin, adjusted net earnings, adjusted earnings per share and free cash flow. The Company has included these non-GAAP financial measures because it believes such non-GAAP financial measures improve the period-to-period comparability of the Company’s results and provide investors with more insight into, and an additional tool to understand and assess, the performance of the Company's ongoing core business operations. The Company has included adjusted EBITDA and adjusted EBITDA margin because it believes that they allow investors to make a more meaningful comparison between periods of the Company’s performance, underlying business trends and the Company’s ongoing operations. The Company further believes these measures may be useful in comparing its operating performance with the performance of other companies that may have different financing and capital structures, and tax rates. Adjusted EBITDA excludes costs that are not considered by management to be representative of the Company’s underlying core operating performance, including certain non-operating expenses, non-cash expenses and, where indicated, non-recurring expenses. In addition, adjusted EBITDA is used by management to set targets and is a metric that, among others, can be used by the Company’s Human Resources and Compensation Committee to establish performance bonus metrics and payout, and by the Company’s lenders and investors to evaluate the Company’s performance and ability to service its debt, finance capital expenditures and acquisitions, and provide for the payment of dividends to shareholders. The Company has included adjusted net earnings and adjusted earnings per share because it believes that they permit investors to make a more meaningful comparison of the Company’s performance between periods presented by excluding certain non-operating expenses, non-cash expenses and, where indicated, non-recurring expenses. In addition, adjusted net earnings and adjusted earnings per share are used by management in evaluating the Company’s performance because it believes they provide indicators of the Company’s performance that are often more meaningful than GAAP financial measures for the reasons stated in the previous sentence. The Company has included free cash flows because it is used by management and investors in evaluating the Company’s performance and liquidity. As required by applicable securities legislation, the Company has provided definitions of these non-GAAP financial measures contained in this presentation, as well as a reconciliation of each of them to the most directly comparable GAAP financial measure, on its website at http://www.itape.com under “Investor Relations” and “Events and Presentations” and “Investor Presentations”. You are encouraged to review the related GAAP financial measures and the reconciliation of non-GAAP financial measures to their most directly comparable GAAP financial measures set forth on the website and should consider non-GAAP financial measures only as a supplement to, not as a substitute for or as a superior measure to, measures of financial performance prepared in accordance with GAAP.
Variance, ratio and percentage changes in this presentation are based on unrounded numbers. All dollar amounts are in US dollars.
INTERTAPE POLYMER GROUP 3November 12, 2021
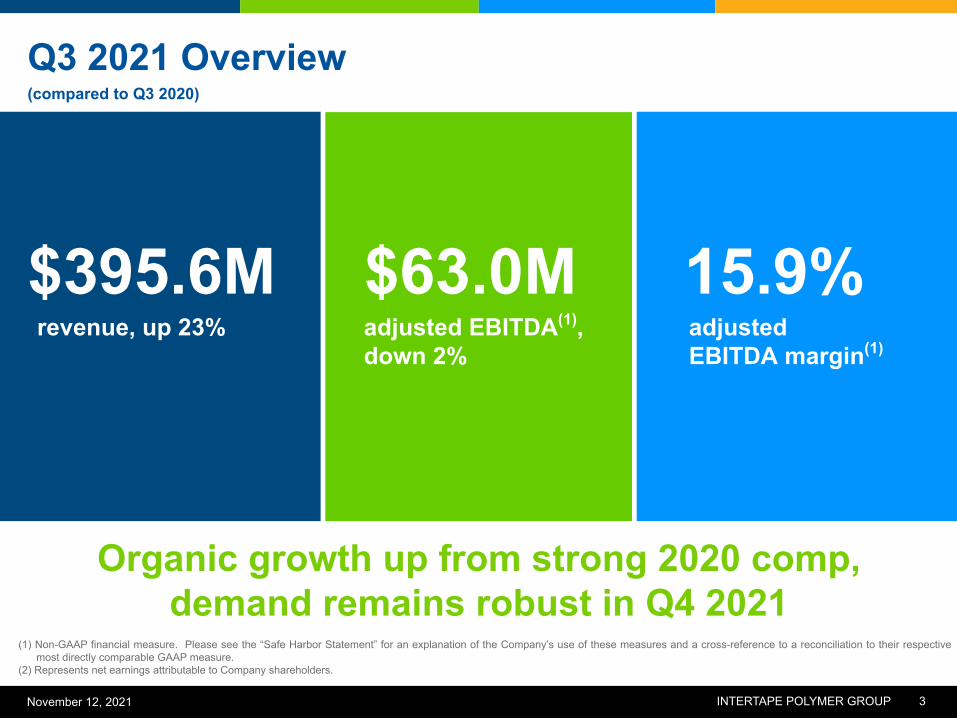
Q3 2021 Overview
(compared to Q3 2020)
revenue, up 23%
15.9%adjustedEBITDA margin(1)
$395.6M
(1) Non-GAAP financial measure. Please see the “Safe Harbor Statement” for an explanation of the Company’s use of these measures and a cross-reference to a reconciliation to their respective most directly comparable GAAP measure.
(2) Represents net earnings attributable to Company shareholders.
Organic growth up from strong 2020 comp,demand remains robust in Q4 2021
$63.0Madjusted EBITDA(1),down 2%
INTERTAPE POLYMER GROUP 4November 12, 2021
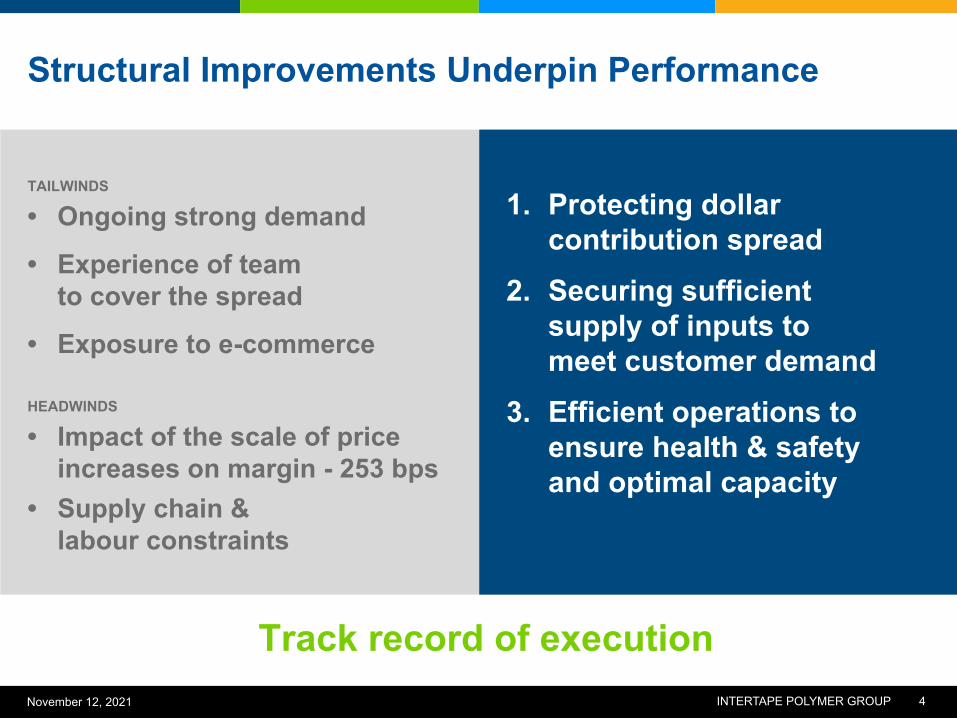
Track record of execution
Structural Improvements Underpin Performance
TAILWINDS
• Ongoing strong demand
• Experience of teamto cover the spread
• Exposure to e-commerce
HEADWINDS
• Impact of the scale of price increases on margin - 253 bps
• Supply chain &labour constraints
1. Protecting dollar contribution spread
2. Securing sufficientsupply of inputs tomeet customer demand
3. Efficient operations to ensure health & safetyand optimal capacity

INTERTAPE POLYMER GROUP 5November 12, 2021
Strong Demand Trends Continuing
Fulfillment / E-commerce27%
Q3 2021 Growth Trends(2)IPG: 2020 End Market Revenue Diversity(1)
General Manufacturing28%
Transportation4%
Retail9%
Other 7%
Building & Construction10%
Food & Beverage 15%
(1) Management estimates for twelve months ending December 31, 2020.(2) Compared to the three months ended September 30, 2020.
E-commerce product bundle demonstrateddouble-digit organic growth vs. record comp(2)
STRONGEST PERFORMERS
Dispensing machines
Carton sealing tapes*
Water-activated tape
Protective packaging
Films*
E-c
omm
erce
rela
ted
prod
ucts
* Product categories disproportionately impacted by pandemic in 2020 period
INTERTAPE POLYMER GROUP 6November 12, 2021
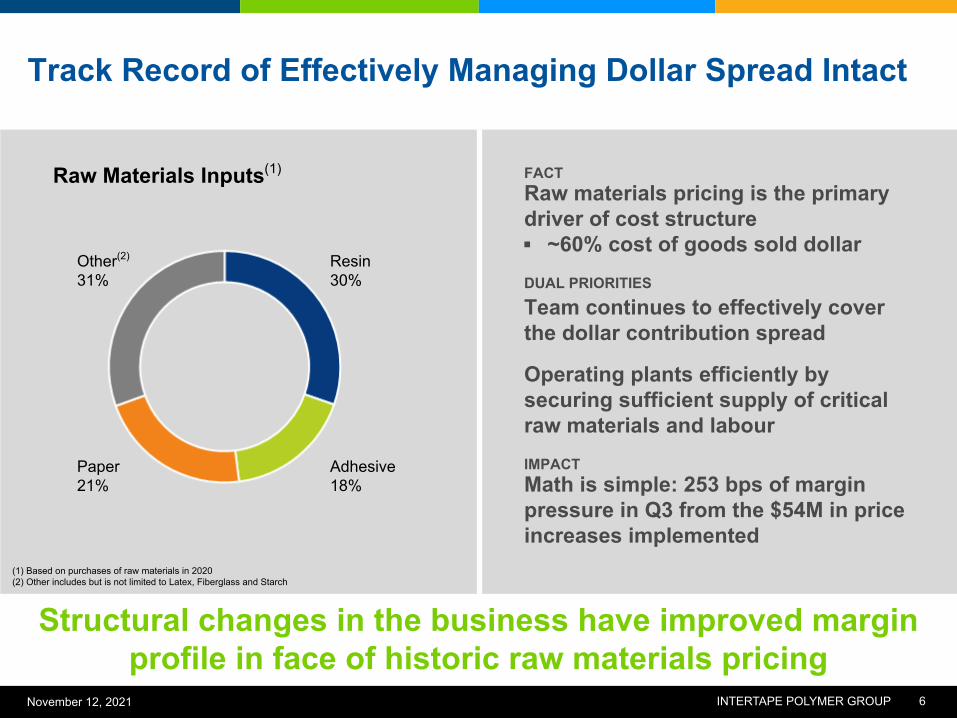
Track Record of Effectively Managing Dollar Spread Intact
Resin30%
FACTRaw materials pricing is the primary driver of cost structure▪ ~60% cost of goods sold dollarDUAL PRIORITIES
Team continues to effectively coverthe dollar contribution spread
Operating plants efficiently bysecuring sufficient supply of critical raw materials and labour IMPACTMath is simple: 253 bps of margin pressure in Q3 from the $54M in price increases implemented
Raw Materials Inputs(1)
Other(2)
31%
Paper21%
Adhesive18%
(1) Based on purchases of raw materials in 2020(2) Other includes but is not limited to Latex, Fiberglass and Starch
Structural changes in the business have improved margin profile in face of historic raw materials pricing
INTERTAPE POLYMER GROUP 7November 12, 2021
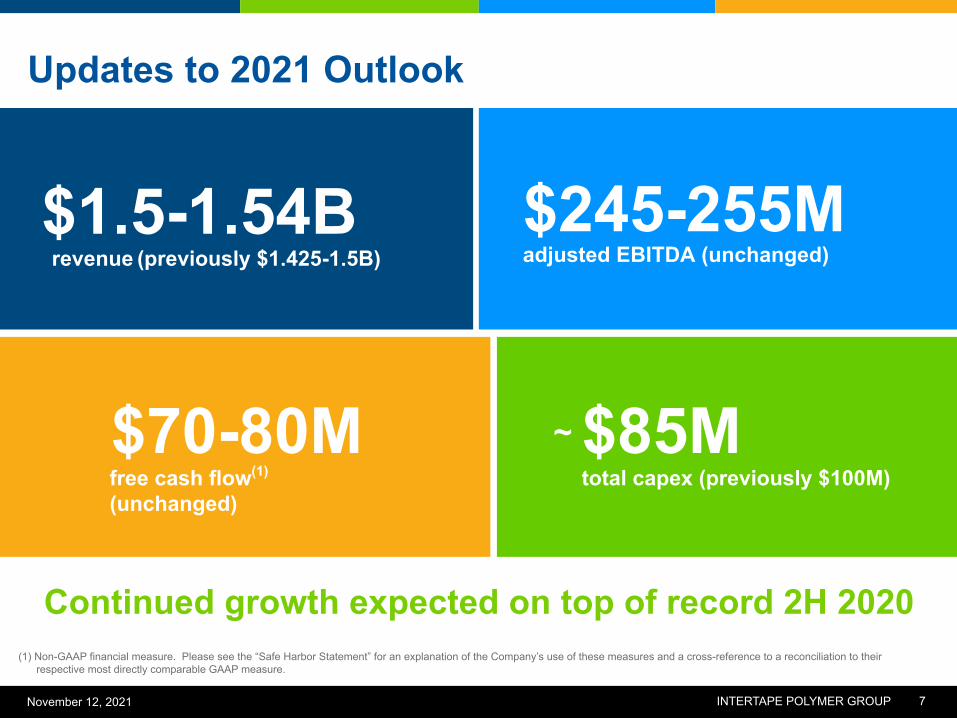
$85Mtotal capex (previously $100M)
Updates to 2021 Outlook
revenue (previously $1.425-1.5B)$1.5-1.54B
Continued growth expected on top of record 2H 2020(1) Non-GAAP financial measure. Please see the “Safe Harbor Statement” for an explanation of the Company’s use of these measures and a cross-reference to a reconciliation to their
respective most directly comparable GAAP measure.
free cash flow(1)
(unchanged)
$70-80M
$245-255Madjusted EBITDA (unchanged)
~

INTERTAPE POLYMER GROUP 8November 12, 2021
Q3 2020 to Q3 2021 2020 YTD to 2021 YTDPrior period 323.0 868.9 Volume/Mix effect 14.0 4.3 % 136.2 15.7 %Price effect 54.3 16.8 % 100.1 11.5 %Acquisitions (1) 2.1 0.6 % 2.1 0.2 %Foreign exchange impact 2.1 0.7 % 10.4 1.2 %Current period 395.6 22.5 % 1,117.8 28.6 %
Revenue Analysis(USD Millions)
+ Dispensing machines+ Certain carton sealing tapes+ Water-activated tape+ Protective packaging
$14M volume/mix growth on record COVID quarter in 2020
Demand Drivers:
Q3 2020 to Q3 2021
+ Certain carton sealing tapes+ Water-activated tape+ Films+ Machines+ Wovens+ Protective packaging
Demand Drivers:
2020 YTD to 2021 YTD
(1) Results for Neuvopak reflected beginning on the date acquired, July 30, 2021.

INTERTAPE POLYMER GROUP 9November 12, 2021
Q3 2021 Q3 2020Q3 2021 vs
Q3 2020 2021 YTD 2020 YTD2021 YTD vs
2020 YTDRevenue 395.6 323.0 22.5 % 1,117.8 868.9 28.6 %Gross profit 87.0 84.1 3.5 % 258.9 200.3 29.2 %Gross margin 22.0 % 26.0 % (403 bps) 23.2 % 23.1 % 11 bpsSG&A 43.0 38.6 11.5 % 133.9 104.1 28.6 %Finance costs (2) 9.8 8.7 13.1 % 38.5 13.3 190.7 %IPG Net Earnings 25.3 26.7 (5.2) % 58.7 55.6 5.7 %IPG EPS, fully diluted 0.42 0.45 (6.5) % 0.97 0.94 3.8 %Adjusted net earnings (3) 30.0 31.5 (4.6) % 92.6 57.4 61.3 %Adjusted EPS, fully diluted (3) 0.50 0.53 (5.9) % 1.53 0.97 58.5 %Adjusted EBITDA 63.0 64.5 (2.3) % 188.9 143.5 31.7 %Adjusted EBITDA margin 15.9 % 20.0 % (403 bps) 16.9 % 16.5 % 39 bpsEffective tax rate 17.7 % 19.6 % (197 bps) 22.3 % 20.2 % 217 bps
Summary Q3 2021 Results(USD Millions) (1)
(1) Excluding earnings per share (“EPS”).(2) 2021 YTD includes debt issuance costs of $3.6 million that were written off as well as an early redemption premium and other costs of $14.4 million recorded in connection with the
redemption of the $250 million 7.00% senior unsecured notes which were scheduled to mature on October 15, 2026 and 2020 YTD includes a gain resulting from a fair value adjustment to the Company's contingent consideration related to the acquisition of Nortech Packaging LLC and Custom Assembly Solutions, Inc. on February 11, 2020.
(3) Non-GAAP financial measure. Please see the “Safe Harbor Statement” for an explanation of the Company’s use of these measures and a cross-reference to a reconciliation to their respective most directly comparable GAAP measure.

INTERTAPE POLYMER GROUP 10November 12, 2021
Positioned to deliver consistent GDP+ growth
Structurally Different Business in Last 5 Years
▪ Continued organic growth from ourproduct bundle approach in e-commerce
▪ Proven ability to manage spread betweenselling prices and cost of raw materials
▪ Disciplined capital allocation with capexin highest growth product categories
▪ Strengthened margin profile in face ofrecord raw materials pricing
▪ Improved free cash flow profile intandem with capex investments
▪ Improved capital structure with 2.3x total leverage ratio

INTERTAPE POLYMER GROUP 11November 12, 2021
E-commerce Food and Beverage Building & Construction
Transportation Manufacturing Agriculture