Q3 2017 Earnings Conference Call -...
8
Q3 2017 Earnings Conference Call November 7, 2017 Barry Pennypacker – President & Chief Executive Officer Dave Antoniuk – SVP & Chief Financial Officer Ion Warner – VP Marketing & Investor Relations
Transcript of Q3 2017 Earnings Conference Call -...

Q3 2017 Earnings Conference Call
November 7, 2017Barry Pennypacker – President & Chief Executive Officer
Dave Antoniuk – SVP & Chief Financial Officer
Ion Warner – VP Marketing & Investor Relations
2
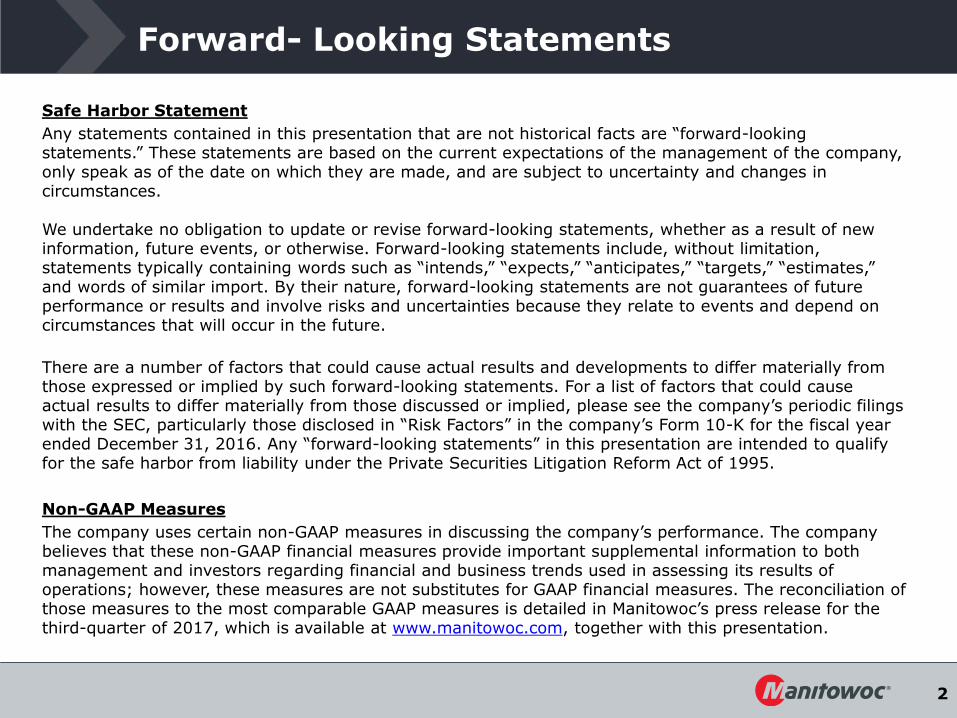
Forward- Looking Statements
Safe Harbor Statement
Any statements contained in this presentation that are not historical facts are “forward-looking statements.” These statements are based on the current expectations of the management of the company, only speak as of the date on which they are made, and are subject to uncertainty and changes in circumstances.
We undertake no obligation to update or revise forward-looking statements, whether as a result of new information, future events, or otherwise. Forward-looking statements include, without limitation, statements typically containing words such as “intends,” “expects,” “anticipates,” “targets,” “estimates,” and words of similar import. By their nature, forward-looking statements are not guarantees of future performance or results and involve risks and uncertainties because they relate to events and depend on circumstances that will occur in the future.
There are a number of factors that could cause actual results and developments to differ materially from those expressed or implied by such forward-looking statements. For a list of factors that could cause actual results to differ materially from those discussed or implied, please see the company’s periodic filings with the SEC, particularly those disclosed in “Risk Factors” in the company’s Form 10-K for the fiscal year ended December 31, 2016. Any “forward-looking statements” in this presentation are intended to qualify for the safe harbor from liability under the Private Securities Litigation Reform Act of 1995.
Non-GAAP Measures
The company uses certain non-GAAP measures in discussing the company’s performance. The company believes that these non-GAAP financial measures provide important supplemental information to both management and investors regarding financial and business trends used in assessing its results of operations; however, these measures are not substitutes for GAAP financial measures. The reconciliation of those measures to the most comparable GAAP measures is detailed in Manitowoc’s press release for the third-quarter of 2017, which is available at www.manitowoc.com, together with this presentation.
3
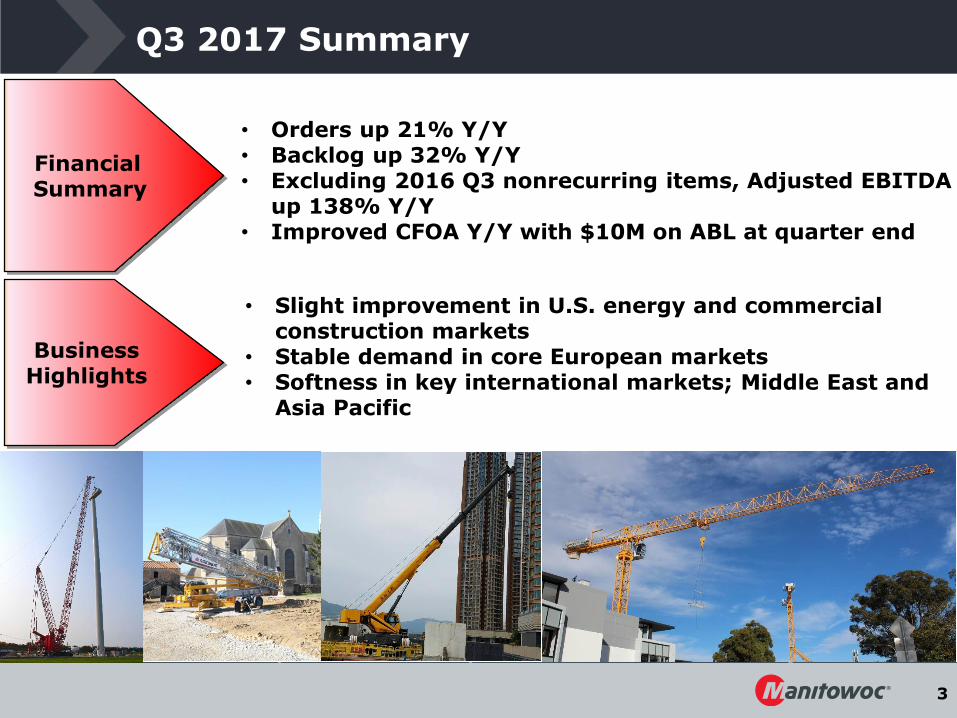
• Slight improvement in U.S. energy and commercial construction markets
• Stable demand in core European markets• Softness in key international markets; Middle East and
Asia Pacific
Q3 2017 Summary
• Orders up 21% Y/Y• Backlog up 32% Y/Y• Excluding 2016 Q3 nonrecurring items, Adjusted EBITDA
up 138% Y/Y• Improved CFOA Y/Y with $10M on ABL at quarter end
FinancialSummary
BusinessHighlights
4
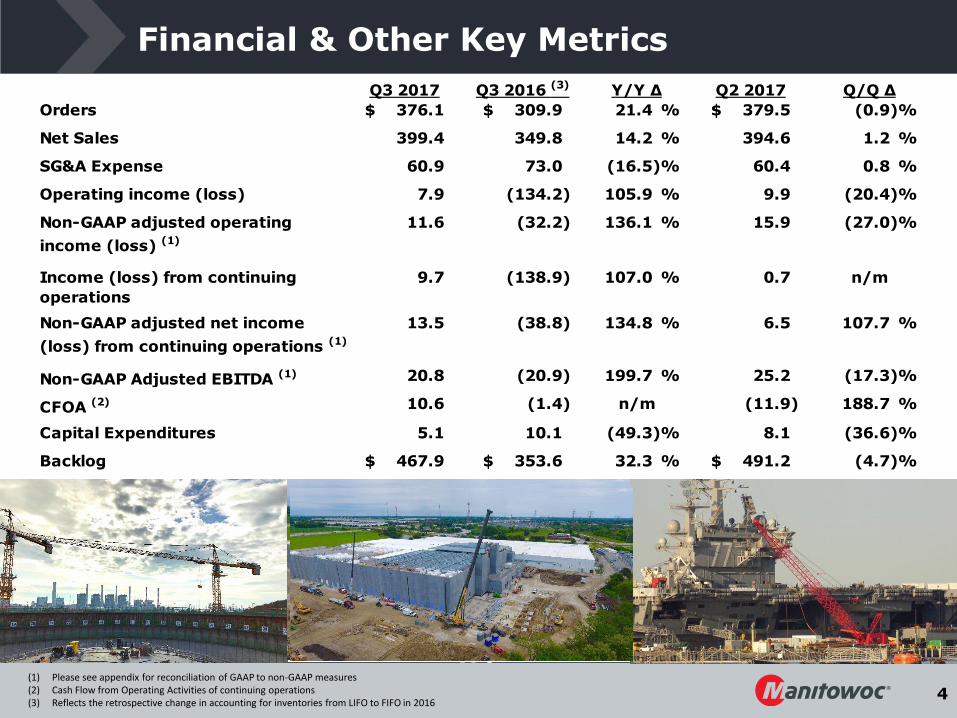
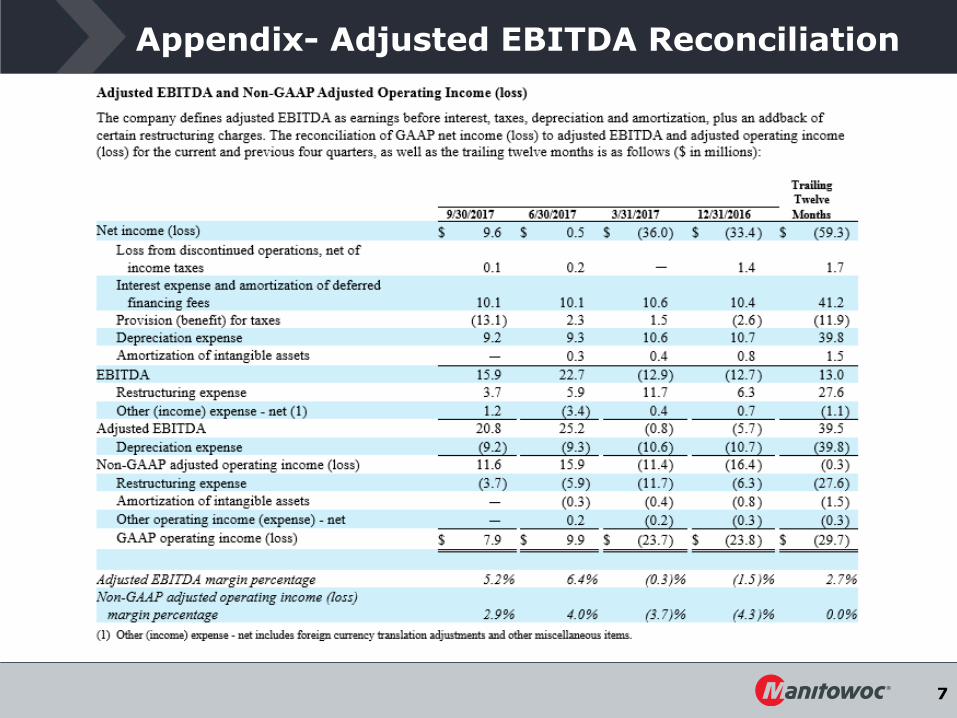
Financial & Other Key Metrics
(1) Please see appendix for reconciliation of GAAP to non-GAAP measures(2) Cash Flow from Operating Activities of continuing operations(3) Reflects the retrospective change in accounting for inventories from LIFO to FIFO in 2016
Q3 2017 Q3 2016 (3) Y/Y ∆ Q2 2017 Q/Q ∆
Orders 376.1$ 309.9$ 21.4 % 379.5$ (0.9)%
Net Sales 399.4 349.8 14.2 % 394.6 1.2 %
SG&A Expense 60.9 73.0 (16.5)% 60.4 0.8 %
Operating income (loss) 7.9 (134.2) 105.9 % 9.9 (20.4)%
Non-GAAP adjusted operating
income (loss) (1)
11.6 (32.2) 136.1 % 15.9 (27.0)%
Income (loss) from continuing
operations
9.7 (138.9) 107.0 % 0.7 n/m
Non-GAAP adjusted net income
(loss) from continuing operations (1)
13.5 (38.8) 134.8 % 6.5 107.7 %
Non-GAAP Adjusted EBITDA (1) 20.8 (20.9) 199.7 % 25.2 (17.3)%
CFOA (2) 10.6 (1.4) n/m (11.9) 188.7 %
Capital Expenditures 5.1 10.1 (49.3)% 8.1 (36.6)%
Backlog 467.9$ 353.6$ 32.3 % 491.2$ (4.7)%
5
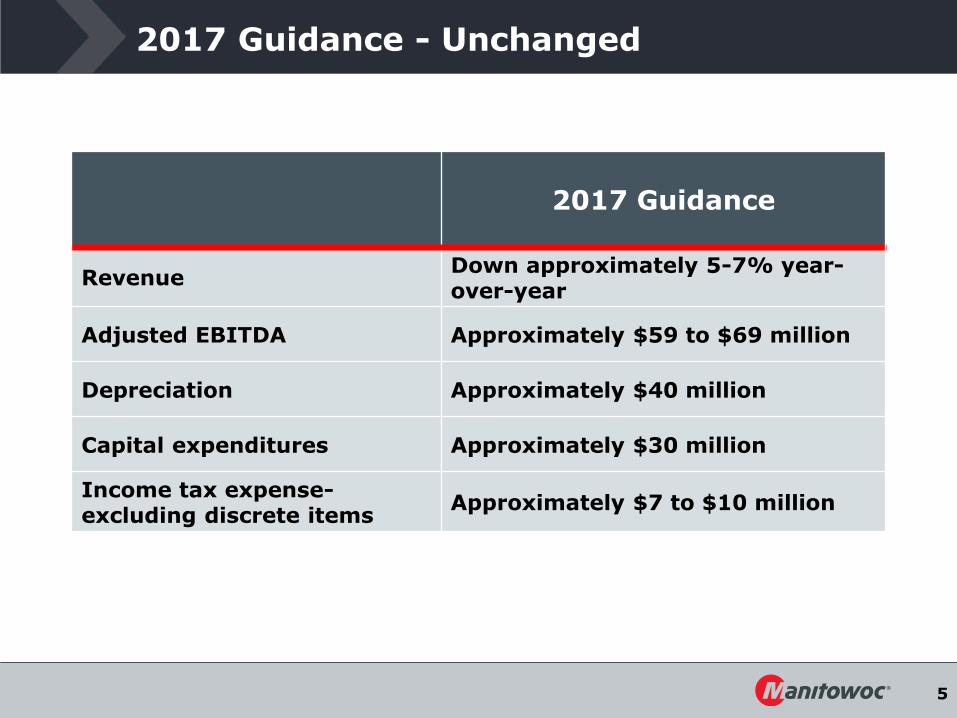
2017 Guidance - Unchanged
2017 Guidance
RevenueDown approximately 5-7% year-over-year
Adjusted EBITDA Approximately $59 to $69 million
Depreciation Approximately $40 million
Capital expenditures Approximately $30 million
Income tax expense-excluding discrete items
Approximately $7 to $10 million
6
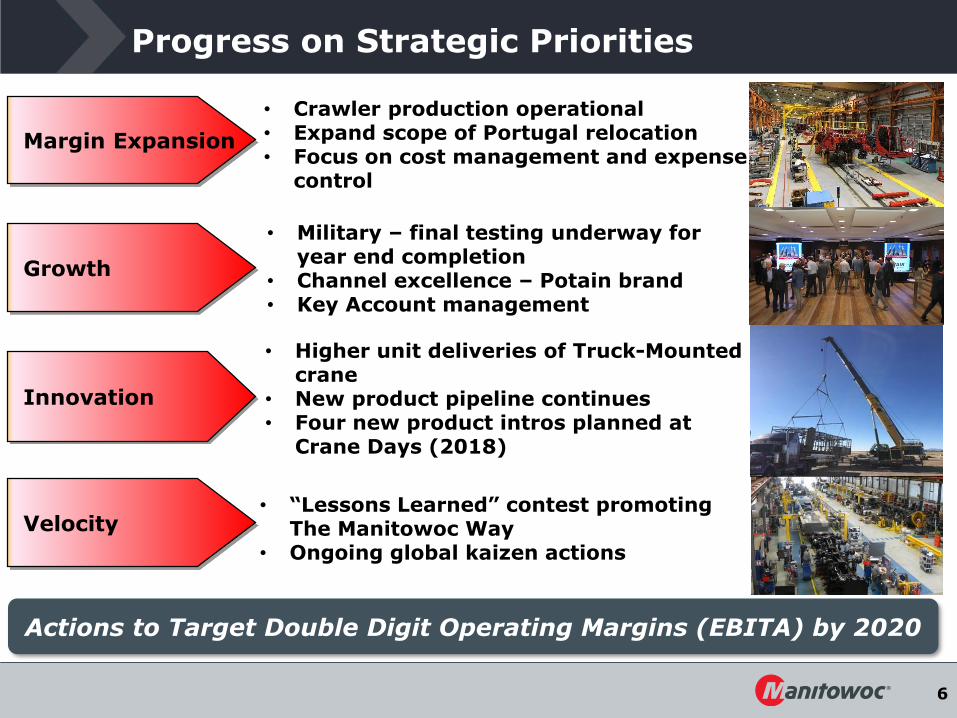
Progress on Strategic Priorities
• Higher unit deliveries of Truck-Mounted crane
• New product pipeline continues• Four new product intros planned at
Crane Days (2018)
• Crawler production operational• Expand scope of Portugal relocation• Focus on cost management and expense
control
Margin Expansion
Innovation
Growth
Velocity
Actions to Target Double Digit Operating Margins (EBITA) by 2020
• Military – final testing underway for year end completion
• Channel excellence – Potain brand• Key Account management
• “Lessons Learned” contest promoting The Manitowoc Way
• Ongoing global kaizen actions
7
Appendix- Adjusted EBITDA Reconciliation

8