Supplemental Slides to Q3 2016 Earnings Call
21
Supplemental Slides to Q3 2016 Earnings Call – November 1, 2016
-
Upload
tribuneir -
Category
Investor Relations
-
view
307 -
download
1
Transcript of Supplemental Slides to Q3 2016 Earnings Call

Supplemental Slides to Q3 2016 Earnings Call – November 1, 2016

The statements contained in this presentation include certain forward-looking statements that are based largely on the current expectations of tronc, Inc. and reflect various estimates and assumptions by us. Forward-looking statements are subject to certain risks, trends and uncertainties that could cause actual results and achievements to differ materially from those expressed in such forward-looking statements. Such risks, trends and uncertainties, which in some instances are beyond our control, are described under the heading “Risk Factors” in tronc’s filings with the Securities and Exchange Commission, and include:
competition and other economic conditions including fragmentation of the media landscape and competition from other media alternatives;
changes in advertising demand, circulation levels and audience shares;
our ability to develop and grow our online businesses;
our success in implementing expense mitigation efforts;
our success in implementing our strategic and branding initiatives;
our reliance on revenue from printing and distributing third-party publications;
changes in newsprint price;
macroeconomic trends and conditions;
our ability to adapt to technological changes;
our ability to realize benefits or synergies from acquisitions or divestitures or to operate our businesses effectively following acquisitions or divestitures;
our reliance on third-party vendors for various services;
adverse results from litigation, such as the stockholder derivative lawsuits, governmental investigations or tax-related proceedings or audits;
our ability to attract, integrate and retain our senior management team and employees;
our ability to satisfy pension and other postretirement employee benefit obligations;
changes in accounting standards;
the effect of labor strikes, lockouts and labor negotiations;
regulatory and judicial rulings;
our indebtedness and ability to comply with debt covenants applicable to our debt facilities;
our ability to satisfy future capital and liquidity requirements;
our ability to access the credit and capital markets at the times and in the amounts needed and on acceptable terms; and
other events beyond our control that may result in unexpected adverse operating results.
The words “may,” “believe,” “anticipate,” “expect,” “project,” “should,” “intend”, “plan,” “outlook,” “estimate” and similar expressions generally identify forward-looking statements. Whether or not any such forward-looking statements are in fact achieved will depend on future events, some of which are beyond our control. You are cautioned not to place undue reliance on such forward-looking statements, which are being made as of the date of this presentation. We undertake no obligation to update any forward-looking statements, whether as a result of new information, future events or otherwise, except as required by law.
Supplemental Slides to Q3 2016 Earnings Call – November 1, 2016
DISCLAIMER
Supplemental Slides to Q2 2016 Earnings Call – August
3, 2016 1

Supplemental Slides to Q2 2016 Earnings Call – August
3, 2016 2
3
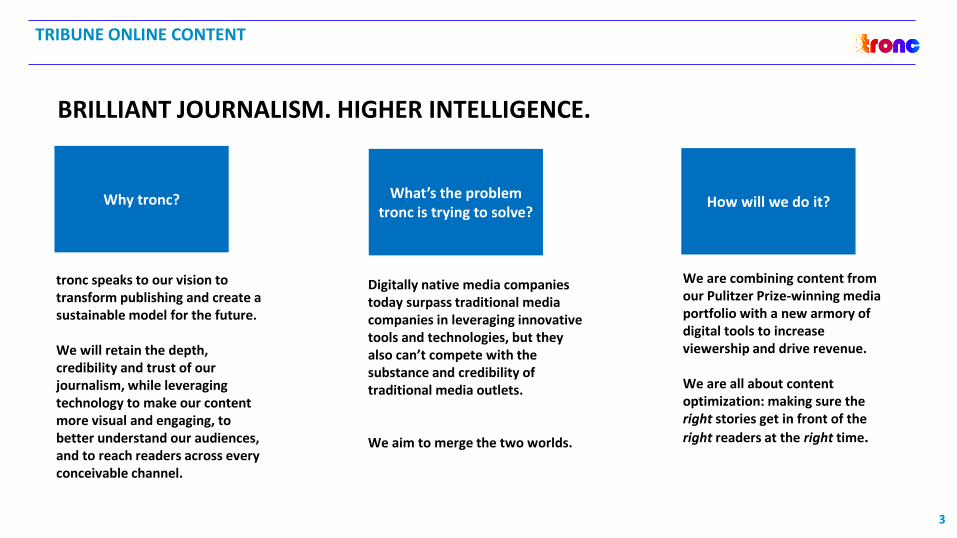
TRIBUNE ONLINE CONTENT
Why tronc? What’s the problem tronc is trying to solve?
How will we do it?
tronc speaks to our vision to transform publishing and create a sustainable model for the future. We will retain the depth, credibility and trust of our journalism, while leveraging technology to make our content more visual and engaging, to better understand our audiences, and to reach readers across every conceivable channel.
Digitally native media companies today surpass traditional media companies in leveraging innovative tools and technologies, but they also can’t compete with the substance and credibility of traditional media outlets. We aim to merge the two worlds.
We are combining content from our Pulitzer Prize-winning media portfolio with a new armory of digital tools to increase viewership and drive revenue. We are all about content optimization: making sure the right stories get in front of the
right readers at the right time.
BRILLIANT JOURNALISM. HIGHER INTELLIGENCE.
3

4
REORGANIZED FOR THE FUTURE
TRONC IS REVITALIZING THE ORGANIZATION IN TWO REPORTABLE SEGMENTS
Traditional Publishing Business (troncM)│ Digital (troncX)
4
troncM troncX
F:\Word Processing\2013 - 04 (Apr)\04-10\Adler, Jeffrey\USPopulation Density Map_v3.ai250 or more 50-249.9 10-49.9 Less than 10
Population Per Square Mile
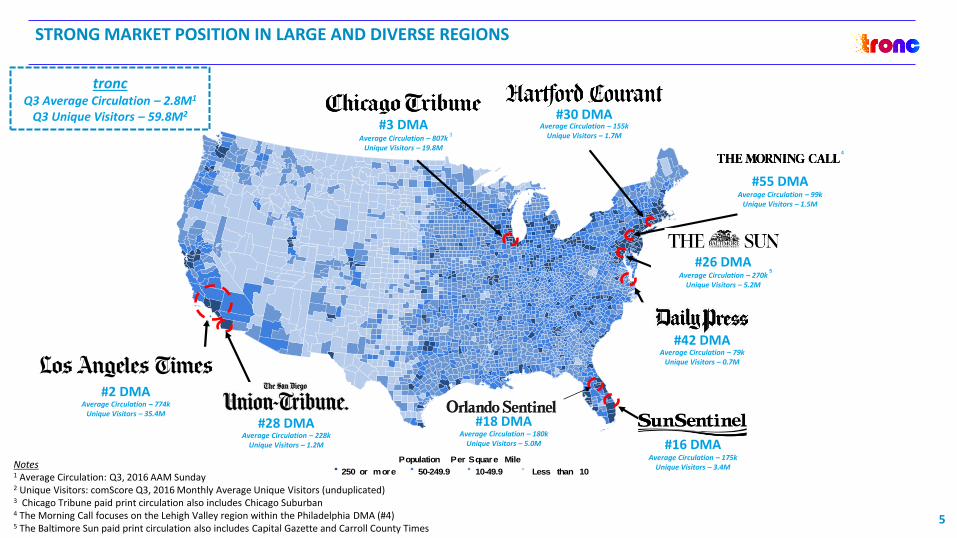
STRONG MARKET POSITION IN LARGE AND DIVERSE REGIONS
#30 DMA
#55 DMA
#3 DMA
#26 DMA
#18 DMA
#16 DMA
#42 DMA
#28 DMA
#2 DMA
Notes 1 Average Circulation: Q3, 2016 AAM Sunday 2 Unique Visitors: comScore Q3, 2016 Monthly Average Unique Visitors (unduplicated) 3 Chicago Tribune paid print circulation also includes Chicago Suburban 4 The Morning Call focuses on the Lehigh Valley region within the Philadelphia DMA (#4) 5 The Baltimore Sun paid print circulation also includes Capital Gazette and Carroll County Times
Average Circulation – 807k Unique Visitors – 19.8M
Average Circulation – 155k Unique Visitors – 1.7M
Average Circulation – 99k Unique Visitors – 1.5M
Average Circulation – 270k Unique Visitors – 5.2M
Average Circulation – 79k Unique Visitors – 0.7M
Average Circulation – 175k Unique Visitors – 3.4M
Average Circulation – 180k Unique Visitors – 5.0M
Average Circulation – 228k Unique Visitors – 1.2M
Average Circulation – 774k Unique Visitors – 35.4M
3
5
5
4
tronc Q3 Average Circulation – 2.8M1
Q3 Unique Visitors – 59.8M2
Supplemental Slides to Q2 2016 Earnings Call – August
3, 2016

6
CONSOLIDATED FINANCIALS ($’S IN MILLIONS)
6
Total Consolidated Revenue was down 6.8% in the 3rd Quarter 2016
vs. 2015 (and down 2.9% YTD 2016 vs. 2015)
GAAP Net Income was down in the quarter versus last year
Included in GAAP Net Income in Q3, 2016 was a non-cash
charge related to a deferred tax provision
Adjusted EBITDA (AEBITDA)1 was up in Q3 2016 vs. 2015 by $8.3M
(↑29.2%)
AEBITDA1 margins have improved 270 basis points (BP) comparing
Q3 of 2016 vs. 2015
AEBITDA1 margins are up 230 BP YTD 2016 vs. 2015
Last Twelve Months (LTM) AEBITDA1 as of Q3 2016 is now $182M
REV
ENU
E G
AA
P
NET
INC
OM
E N
ON
-GA
AP
A
dj E
BIT
DA
1
Highlights Q3 YTD Q3
1Adjusted EBITDA (AEBITDA) is a non-GAAP measure. Please refer to the definition of Adjusted EBITDA and the Reconciliation of GAAP to Non-GAAP in the appendix

ROLLING LAST TWELVE MONTHS (LTM) CONSOLIDATED ADJUSTED EBITDA1
($’S IN MILLIONS)
1Adjusted EBITDA (AEBITDA) is a non-GAAP measure. Please refer to the definition of Adjusted EBITDA and the Reconciliation of GAAP to Non-GAAP in the appendix 7

8
BALANCE SHEET ($’S IN MILLIONS)
8
Strengthened Balance Sheet 2016, YTD
Largest Cash Balance since the spin in 2014
$146M Cash increase since 2015
Ongoing Debt and Pension Reductions
$27M↓ since end of 2015
Substantial reduction in Net Debt [Debt – Cash]
1.03x Net Debt to LTM AEBITDA
Flexibility to execute key strategies
Cash
Working Capital
Debt Pension and post-retirement
benefits payable
Net Debt1 (Total Debt – Cash)
Highlights
L-T
Deb
t S-
T p
ort
ion
L-
T D
eb
t $376
$390
1Debt ($376M in Q3, 2016 and $390M in Q4, 2015) less Unrestricted Cash ($187M in Q3, 2016 and $41M in Q4, 2015)

REPORTING SEGMENTS
troncM
Traditional Publishing
Revenue
Print Advertising (Display, Classifieds, Preprints)
Circulation (Home Delivery, Single Copy, Other)
Commercial Services (Print and Delivery)
Direct Mail
Expenses
Content, Ad Sales, Manufacturing & Distribution, Marketing,
Shared Services and Administrative
troncX
Digital
Revenue
Digital Advertising on web, tablet and mobile
Digital Advertising through partnerships
Digital-Only Subscriptions
Digital Content Monetization
Expenses
Dedicated Digital Staff (Sales, Content, Technology)
Allocated Digital and Shared Costs
9
Corporate / Eliminations
Management, Legal, Financial Reporting, etc…
Elimination of inter-company revenue and profit

10
SEGMENT FINANCIALS ($’S IN MILLIONS)
10
REV
ENU
E N
ON
-GA
AP
A
dj E
BIT
DA
1
Q3 YTD Q3 Q3 YTD Q3
REV
ENU
E N
ON
-GA
AP
A
dj E
BIT
DA
1
Q3 YTD Q3 Q3 YTD Q3
1Adjusted EBITDA (AEBITDA) is a non-GAAP measure. Please refer to the definition of Adjusted EBITDA and the Reconciliation of GAAP to Non-GAAP in the appendix

11
DIGITAL STRATEGY AND TRENDS
KEY HIGHLIGHTS
UNIQUE VISITORS (M)1
1 Unique Visitors: comScore Q3, 2016 Monthly Average (unduplicated)
11
DIGITAL ONLY SUBSCRIBERS (000’S)
Key Highlights
Video creation
Launch of data intelligence tool
Transition to new Recruitment Advertising Platform with RealMatch
Solidify the sales infrastructure
Technology infrastructure enhancements
Back office enhancements

12
FULL YEAR 2016 GUIDANCE ($’S IN MILLIONS)
12
Revenue Guidance
Adjusted EBITDA Guidance
$1,610 – 1,630M $1,610 – 1,630M
$172 – 177M
$170 – 175M

13
APPENDIX
Supplemental Slides to Q2 2016 Earnings Call – August
3, 2016

This presentation includes references to Adjusted EBITDA (also referred to as “Adj EBITDA” or “AEBITDA”). This measure is not presented in accordance with generally accepted accounting principles in the United States (US GAAP), and tronc’s use of these terms may vary from that of others in the Company’s industry. This measures should not be considered as an alternative to net income (loss), income from operations, net income (loss) per diluted share, revenues or any other performance measures derived in accordance with US GAAP as measures of operating performance or liquidity.
Adjusted EBITDA (AEBITDA)
Adjusted EBITDA is defined as net income before equity in earnings of unconsolidated affiliates, income taxes, loss on early debt extinguishment, interest expense, other (expense) income, realized gain (loss) on investments, stock-based compensation expense, reorganization items, restructuring charges, transaction expenses, depreciation and amortization, net income attributable to non-controlling interests, and certain unusual and non-recurring items (including spin-related costs). Management believes that because Adjusted EBITDA excludes (i) certain non-cash expenses (such as depreciation, amortization, stock-based compensation, and gain/loss on equity investments) and (ii) expenses that are not reflective of the Company’s core operating results over time (such as restructuring costs, including the employee voluntary separation program and gain/losses on employee benefit plan terminations, litigation or dispute settlement charges or gains, and transaction-related costs), this measure provides investors with additional useful information to measure the company’s financial performance, particularly with respect to changes in performance from period to period. The Company's management uses Adjusted EBITDA (a) as a measure of operating performance; (b) for planning and forecasting in future periods; and (c) in communications with the Company’s Board of Directors concerning the Company’s financial performance. In addition, Adjusted EBITDA, or a similarly calculated measure, is used as the basis for certain financial maintenance covenants that the Company is subject to in connection with certain credit facilities. Since not all companies use identical calculations, the Company's presentation of Adjusted EBITDA may not be comparable to other similarly titled measures of other companies and should not be used by investors as a substitute or alternative to net income or any measure of financial performance calculated and presented in accordance with GAAP. Instead, management believes Adjusted EBITDA should be used to supplement the Company’s financial measures derived in accordance with GAAP to provide a more complete understanding of the trends affecting the business.
Although Adjusted EBITDA is frequently used by investors and securities analysts in their evaluations of companies, Adjusted EBITDA has limitations as an analytical tool, and investors should not consider it in isolation or as a substitute for, or more meaningful than, amounts determined in accordance with GAAP. Some of the limitations to using non-GAAP measures as an analytical tool are: they do not reflect the Company’s interest income and expense, or the requirements necessary to service interest or principal payments on the Company’s debt; they do not reflect future requirements for capital expenditures or contractual commitments; and although depreciation and amortization charges are non-cash charges, the assets being depreciated and amortized will often have to be replaced in the future, and non-GAAP measures do not reflect any cash requirements for such replacements.
APPENDIX: NON-GAAP
Supplemental Slides to Q2 2016 Earnings Call – August
3, 2016 14

RECONCILIATION OF NET INCOME (LOSS) TO ADJUSTED EBITDA (AEBITDA) ($’S IN 000’S)
15
Reconciliation of Net Loss to Adjusted EBITDA:
Three months ended Nine months ended
September 25,
2016 September 27,
2015 % Change ............
September 25, 2016
September 27, 2015 % Change
Net loss ........................................................................... $ (10,472 ) $ (8,601 ) 21.8 % $ (12,879 ) $ (2,688 ) *
Income tax expense (benefit) .......................................... 4,352 (6,345 ) * 3,303 (2,803 ) *
Loss on equity investments, net ...................................... 190 535 (64.5 %) 487 542 *
Interest expense, net ....................................................... 6,673 6,923 (3.6 %) 20,116 19,121 5.2 %
Reorganization items, net ................................................ 93 (80 ) * 236 773 (69.5 %)
Income (loss) from operations ........................................ 836 (7,568 ) * 11,263 14,945 (24.6 %)
Depreciation and amortization ........................................ 14,375 14,303 0.5 % 42,799 40,161 6.6 %
Restructuring and transaction costs(1) ............................. 17,020 11,079 53.6 % 40,120 28,515 40.7 %
Stock-based compensation.............................................. 2,181 2,059 5.9 % 6,000 5,060 18.6 %
Employee voluntary separation program ........................ 2,172 — * 13,540 — *
Litigation settlement(2) ..................................................... — 9,100 * — 9,100 *
Gain from termination of post-retirement benefits (3) ..... —
(650 ) * —
(9,099 ) *
Adjusted EBITDA(3) .......................................................... $ 36,584 $ 28,323 29.2 % $ 113,722 $ 88,682 28.2 %
* Represents positive or negative change in excess of 100%
(1) - Restructuring and transaction costs include costs related to tronc's internal restructuring, such as severance and IT outsourcing costs, and transaction
costs related to completed and potential acquisitions.
(2) - Adjustment to litigation settlement reserve.
(3) - In the first quarter of 2015, the Company did not deduct a gain of $7.8 million related to the termination of certain postretirement benefits in the
determination of Adjusted EBITDA. Management reassessed this gain and determined it is expected to be a non-recurring item and should be deducted
in the determination of Adjusted EBITDA. Accordingly, the 2015 Adjusted EBITDA as presented, includes such adjustment for the non-recurring gain
from termination of certain post-retirement benefits.
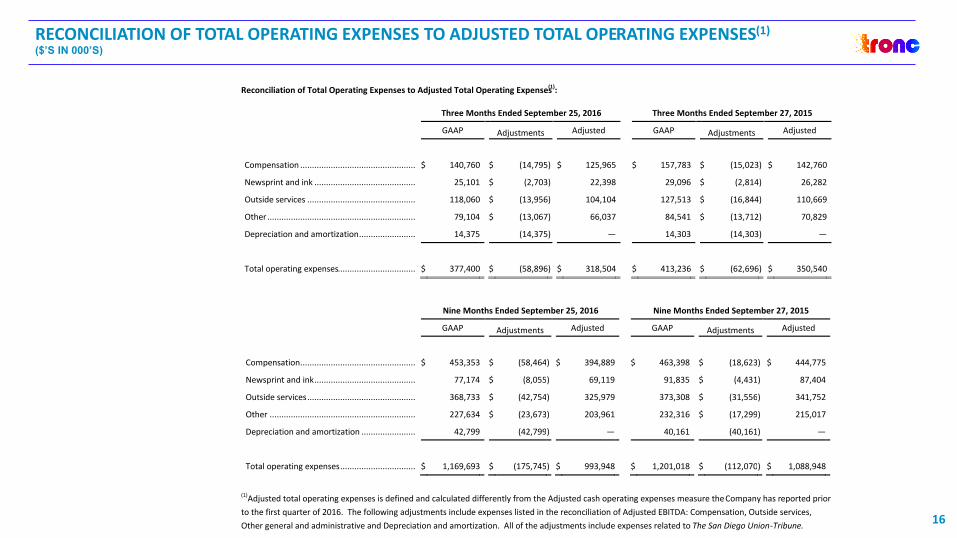
RECONCILIATION OF TOTAL OPERATING EXPENSES TO ADJUSTED TOTAL OPERATING EXPENSES(1)
($’S IN 000’S)
16
Reconciliation of Total Operating Expenses to Adjusted Total Operating Expenses(1):
Three Months Ended September 25, 2016 Three Months Ended September 27, 2015
GAAP Adjustments Adjusted GAAP Adjustments Adjusted
Compensation .................................................. $ 140,760 $ (14,795 ) $ 125,965 $ 157,783 $ (15,023 ) $ 142,760
Newsprint and ink ............................................ 25,101 $ (2,703 ) 22,398 29,096 $ (2,814 ) 26,282
Outside services ............................................... 118,060 $ (13,956 ) 104,104 127,513 $ (16,844 ) 110,669
Other ................................................................ 79,104 $ (13,067 ) 66,037 84,541 $ (13,712 ) 70,829
Depreciation and amortization ......................... 14,375 (14,375 ) — 14,303 (14,303 ) —
Total operating expenses .................................. $ 377,400 $ (58,896 ) $ 318,504 $ 413,236 $ (62,696 ) $ 350,540
Nine Months Ended September 25, 2016 Nine Months Ended September 27, 2015
GAAP Adjustments Adjusted GAAP Adjustments Adjusted
Compensation .................................................. $ 453,353 $ (58,464 ) $ 394,889 $ 463,398 $ (18,623 ) $ 444,775
Newsprint and ink ............................................ 77,174 $ (8,055 ) 69,119 91,835 $ (4,431 ) 87,404
Outside services ............................................... 368,733 $ (42,754 ) 325,979 373,308 $ (31,556 ) 341,752
Other ............................................................... 227,634 $ (23,673 ) 203,961 232,316 $ (17,299 ) 215,017
Depreciation and amortization ........................ 42,799 (42,799 ) — 40,161 (40,161 ) —
Total operating expenses ................................. $ 1,169,693 $ (175,745 ) $ 993,948 $ 1,201,018 $ (112,070 ) $ 1,088,948
(1)Adjusted total operating expenses is defined and calculated differently from the Adjusted cash operating expenses measure the Company has reported prior
to the first quarter of 2016. The following adjustments include expenses listed in the reconciliation of Adjusted EBITDA: Compensation, Outside services,
Other general and administrative and Depreciation and amortization. All of the adjustments include expenses related to The San Diego Union-Tribune.

RECONCILIATION OF NET INCOME (LOSS) TO ADJUSTED EBITDA (AEBITDA) ($’S IN 000’S)
17
18
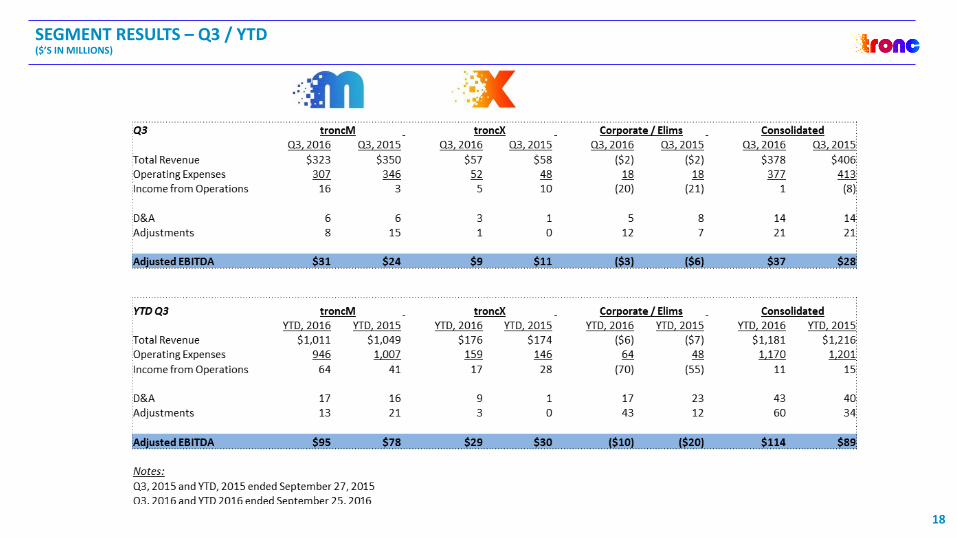
SEGMENT RESULTS – Q3 / YTD ($’S IN MILLIONS)
18
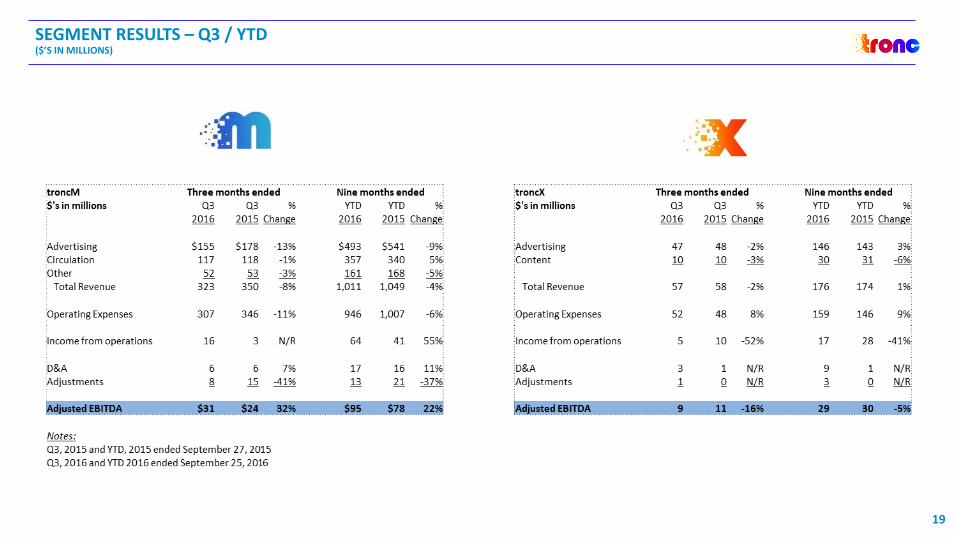
19
SEGMENT RESULTS – Q3 / YTD ($’S IN MILLIONS)
19

Supplemental Slides to Q2 2016 Earnings Call – August
3, 2016