Q2 2017 U.S. Multifamily Figures - Not Your Typical … · cbre research 2 u.s.multifamily |q22017...
12
Q2 2017 U.S. MULTIFAMILY FIGURES
-
Upload
nguyenduong -
Category
Documents
-
view
214 -
download
0
Transcript of Q2 2017 U.S. Multifamily Figures - Not Your Typical … · cbre research 2 u.s.multifamily |q22017...

Q2 2017U.S. MULTIFAMILYFIGURES

2 U.S. MULTIFAMILY | Q2 2017 FIGURESCBRE RESEARCH
Q2 2017 U.S. MULTIFAMILY FIGURES – EXECUTIVE SUMMARYMULTIFAMILY MARKET REMAINS IN HIGH GEAR
• The U.S. multifamily market remains healthy, with high levels of demand and a moderate vacancy rate of 4.6%. However, continued new supply over the past few years has begun to affect vacancy and rents.
• Completions for the year ending in Q2 totaled 259,400 units, while net absorption totaled 220,300 units. This moderate imbalance pushed vacancy up slightly over the past year and has kept rent growth to a minimum in most markets.
• The investment arena remains very active, albeit with acquisitions lower than in the prior year. The preliminary Q2 total of $33.6 billion was higher than Q1.
• NCREIF returns are lower than in recent years; for the year ending Q2 2017, the return was 6.28%.
Vacancy Rate4.6%
Net Absorption*220,300 Units
Completions*259,400 Units
Acquisitions Volume*$145 Billion
Arrows indicate change from previous year.*Total past four quarters.
3 U.S. MULTIFAMILY | Q2 2017 FIGURESCBRE RESEARCH
FIGURE 12017 DEVELOPMENT VERY ACTIVE; NET ABSORPTION STAYS HEALTHY
Source: CBRE Research, CBRE Econometric Advisors, Q2 2017. Based on the 62 metro markets tracked by CBRE EA. Note that new property completions and net absorption are counted in the quarter in which the property reaches occupancy stabilization.
• The Q2 2017 supply and demand statistics confirm that multifamily development remains very active and that net absorption continues at a robust pace. Leasing typically is strongest in the second quarter of each year.
• Completions totaled 64,800 units in Q2 and 115,600 units in H1 2017. Both figures are very close to the prior year; the Q2 total is 3.4% below Q2 2016 while the H1 figure is 4% above H1 2016.
• The trailing four-quarter completions total was 259,400 units, the second-highest level in the past 20 years after Q1 2017.
• Demand remains very strong. The Q2 2017 net absorption total of 113,200 units increased by 1.2% from a year earlier. The H1 2017 total of 149,800 units was 3.8% higher than last year’s H1 total.
• For the year ending Q2 2017, net absorption reached 220,300 units. Although this level was one of the highest in the current expansion period, it represented only 84.9% of the completions total.
111 106 109 127 78
50 72 126
187 201
255
116 77
31
-3
40
255
87122 117
239
193215
150
-100
0
100
200
300
2006 2007 2008 2009 2010 2011 2012 2013 2014 2015 2016 H1 2017
Completions Net AbsorptionUnits (000s)

4 U.S. MULTIFAMILY | Q2 2017 FIGURESCBRE RESEARCH
FIGURE 2CONSTRUCTION STARTS EBB
05
101520253035
Q2 2005 Q2 2006 Q2 2007 Q2 2008 Q2 2009 Q2 2010 Q2 2011 Q2 2012 Q2 2013 Q2 2014 Q2 2015 Q2 2016 Apr-May 2017
Units (000s)
Source: CBRE Research, CBRE Econometric Advisors, Q2 2017. Based on the 62 metro markets tracked by CBRE EA.
• Full Q2 data for markets tracked by CBRE Econometric Advisors have yet to be released. However, the April and May statistics showed a slower pace of monthly starts than in Q1 2017 and Q4 2016. The Q2 monthly average was running at 31,400 starts, down 19% from Q1.
• For the entire U.S. in June, the U.S. Census Bureau reported a seasonally adjusted annual rate of 359,000 units (5+ units perbuilding). This level reflects very active development, but is down from 2016’s 380,800-unit total.

5 U.S. MULTIFAMILY | Q2 2017 FIGURESCBRE RESEARCH
FIGURE 3NEW YORK AND DALLAS/FT. WORTH LEAD THE COUNTRY FOR MULTIFAMILY COMPLETIONS
• Nearly half of deliveries for the year ending in Q2 2017 were in nine metros, led by New York (30,900 units), Dallas/Ft. Worth (18,200), Washington, D.C. (13,600) and Houston (13,200).
• Among the 20 markets with the most deliveries over the past year, Nashville had the highest completions-to-inventory ratio, followed by Austin, San Antonio and Charlotte. Demand is also robust in these markets, but the elevated construction activityshould be closely monitored for signs of overbuilding.
• The leading markets for net absorption for the year ending in Q2 were New York, Los Angeles/Southern California, Dallas/Ft. Worth, San Francisco Bay Area and Washington, D.C.
• Demand outpaced new supply in five of 20 major metros over the past year: San Francisco Bay Area, Los Angeles/Southern California, Minneapolis, Boston and Orlando.
Source: CBRE Research, CBRE Econometric Advisors, Q2 2017. Ratios based on unrounded statistics.
Rank by New
Supply Metro Market
New Supply Ending
Q2 2017New Supply As % of Inventory
Net Absorption Year Ending
Q2 2017
Net Absorption As % of
Inventory
Net Absorption As % of New
Supply1 New York Metro 30,900 1.4 26,500 1.2 85.72 Dallas/Ft. Worth 18,200 2.7 13,700 2.0 75.33 Washington, D.C. 13,600 2.4 12,200 2.2 89.84 Houston 13,200 2.2 4,100 0.7 31.25 Los Angeles/Southern California 11,900 0.8 16,000 1.1 134.06 Miami/South Florida 11,400 2.0 6,900 1.2 60.57 Seattle 10,000 2.8 9,100 2.5 90.68 Austin 9,300 4.7 6,900 3.4 74.09 San Francisco Bay Area 9,100 1.6 12,400 2.2 136.4
10 Denver 9,000 3.1 7,800 2.6 86.711 Chicago 8,600 1.2 5,400 0.8 62.612 Nashville 7,700 6.0 6,400 5.0 83.613 Atlanta 7,400 1.8 6,000 1.4 80.314 San Antonio 7,200 4.6 5,600 3.6 78.115 Boston 6,600 1.4 7,200 1.6 109.316 Charlotte 6,600 4.5 5,400 3.6 81.517 Phoenix 6,500 1.9 5,500 1.6 84.618 Minneapolis 5,400 2.1 6,100 2.4 114.419 Orlando 4,800 2.5 4,900 2.5 101.220 Portland 4,500 2.4 3,300 1.8 74.6

6 U.S. MULTIFAMILY | Q2 2017 FIGURESCBRE RESEARCH
FIGURE 4VACANCY RISES MODESTLY YEAR-OVER-YEAR
0
2
4
6
8
-150
-50
50
150
250
Q2 2005 Q2 2007 Q2 2009 Q2 2011 Q2 2013 Q2 2015 Q2 2017
Vacancy Rate (%)Y-o-Y Vacancy Change (bps) Y-o-Y Vacancy Change (L) Vacancy Rate (R)
Source: CBRE Research, CBRE Econometric Advisors, Axiometrics Inc., Q2 2017. Based on the 62 metro markets tracked by CBRE EA.
• Q2’s vacancy rate was a relatively healthy 4.6%, and below the 20-year average of 5.3%.
• The Q2 vacancy rate is up a modest 20 basis points (bps) from the prior year—the fifth consecutive quarter in which vacancy rose on a year-over-year basis.
• Minneapolis had the lowest Q2 vacancy rate (2.7%) among all 62 markets tracked by CBRE EA. Other metros with vacancy rates below 4% were Metro New York, Providence, Detroit, Sacramento, Columbus, Los Angeles/Southern California, San Diego, Seattle and Boston.
• The oil patch metros of Oklahoma City, Tulsa and Houston had the highest vacancy rates—8.6%, 8.0% and 7.8%, respectively.
• For the year ending Q2, vacancy fell by more than half a percentage point in four markets: Honolulu, Albuquerque, Greensboro and Tucson.
• Vacancy rose by more than half a point in 17 markets; Houston, Tulsa, Kansas City and Austin had the largest increases (1 point or more).

7 U.S. MULTIFAMILY | Q2 2017 FIGURESCBRE RESEARCH
Source: CBRE Research, CBRE Econometric Advisors, Axiometrics Inc., Q2 2017. Based on the 62 metro markets tracked by CBRE EA.
• The average U.S. monthly rent for an apartment was $1,648 in Q2 or $1.89 per sq. ft.
• The average monthly rent fell by 0.5% year-over-year—the first time since early 2009 that rents declined. The 20-year historical average for annual rent growth is 2.6%.
• The average rent change is skewed particularly by New York. While the suburban components of New York registered annual rent growth (Newark +2.0% and Long Island +3.8%), New York City rents declined by 6.6% and the overall metro average fell by 5.9%.
• Rents by class and type of submarket have not been released yet. However, suburban submarkets are generally outpacing urban, and older product is generally outpacing new product due to the new supply, especially in the urban core submarkets.
1200
1300
1400
1500
1600
1700
-9
-6
-3
0
3
6
Q2 2005 Q2 2007 Q2 2009 Q2 2011 Q2 2013 Q2 2015 Q2 2017
Monthly Rent ($)Y-o-Y Rent Change (%) Y-o-Y Change (L) Monthly Rent per Unit (R)
FIGURE 5RENTS EDGING DOWN

8 U.S. MULTIFAMILY | Q2 2017 FIGURESCBRE RESEARCH
FIGURE 6MAJORITY OF MARKETS REGISTERED RENT INCREASES
Rank Metro MarketRent Change Y-o-Y (%)
1 Orlando 4.8
2 Atlanta 3.8
3 Seattle 3.6
4 San Diego 3.4
5 Phoenix 3.3
6 Denver 3.1
7 Columbus 2.9
8 Detroit 2.9
9 Cleveland 2.7
10 Dallas/Ft. Worth 2.2
11 Indianapolis 2.2
12 Minneapolis 2.1
13 Washington, D.C. 2.0
14 Charlotte 1.8
15 Los Angeles/Southern California 1.8
Rank Metro MarketRent Change Y-o-Y (%)
16 Tampa 1.8
17 Miami/South Florida 1.7
18 San Francisco Bay Area 1.6
19 Las Vegas 1.5
20 Portland 1.4
21 San Antonio 1.4
22 St. Louis 0.8
23 Cincinnati 0.8
24 Baltimore 0.6
25 Austin 0.5
26 Chicago 0.2
27 Boston -0.2
28 Philadelphia -2.3
29 Houston -3.4
30 New York Metro -5.9
Source: CBRE Research, CBRE Econometric Advisors, Q2 2017. Ratios based on unrounded statistics. Metros with an inventory of 135,000+ units.
• Most markets (81%) registered rent gains for the year ending Q2 2017, which averaged 2.2%.
• Among the 30 markets with an inventory of at least 135,000 units, Orlando had the largest growth rate at 4.8%. Five metros had gains of between 3% and 4%: Atlanta, Seattle, San Diego, Phoenix and Denver.
• The San Francisco Bay Area’s 1.6% rent increase is a notable improvement from the past few quarters, in which rent had declined year-over-year. Of the three metro divisions that make up the Bay Area (San Francisco, San Jose and Oakland), San Francisco had the highest rent growth rate at 2.6%.
9 U.S. MULTIFAMILY | Q2 2017 FIGURESCBRE RESEARCH
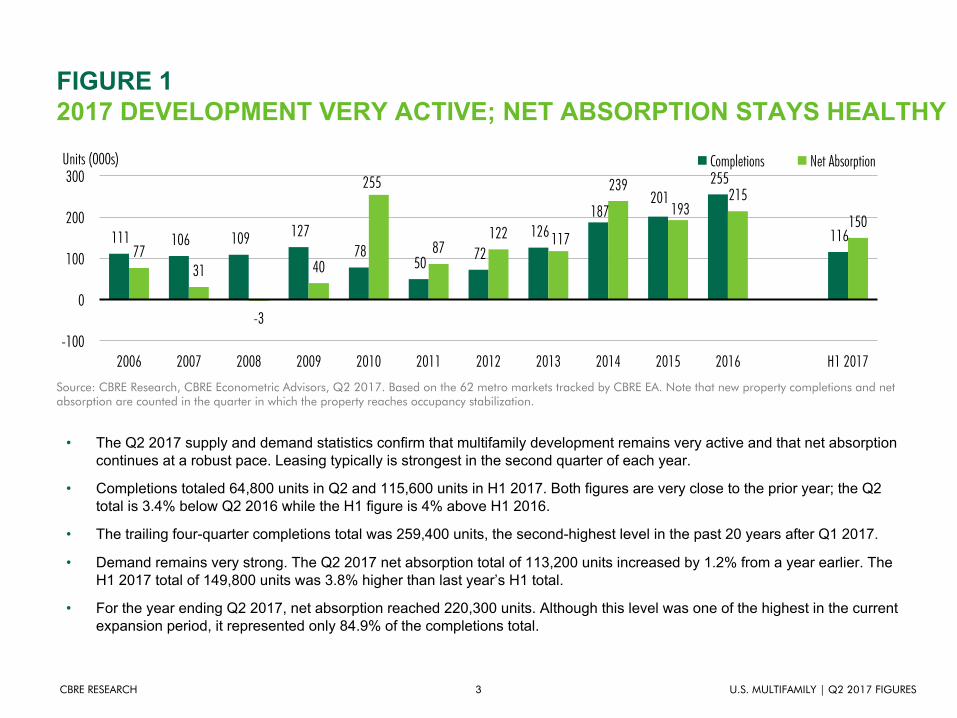
FIGURE 7Q2 ACQUISITIONS INCREASE FROM Q1, BUT DECREASE FROM A YEAR AGO
Source: CBRE Research, Real Capital Analytics, Q2 2017.
• Q2 2017 investment totals reflect continued moderation in buying activity this year, albeit at a much slower rate of decline than in Q1. From a historical standpoint, 2017’s acquisitions pace is still very strong.
• The $35.2 billion acquisitions total for Q2 2017 is up by 28.7% from Q1 2017, but down by 0.9% from a year ago. The $62.6 billion total for H1 2017 is down by 17.3% from a year ago.
• The most active buyers so far this year are private buyers looking for value-add opportunities. Institutional investors and buyers of core product have been less active than in the past few years, but were much more active in Q2 than Q1.
0
10
20
30
40
50
60
Q2 2005 Q2 2006 Q2 2007 Q2 2008 Q2 2009 Q2 2010 Q2 2011 Q2 2012 Q2 2013 Q2 2014 Q2 2015 Q2 2016 Q2 2017
Transaction Volume ($ Billions)

10 U.S. MULTIFAMILY | Q2 2017 FIGURESCBRE RESEARCH
FIGURE 8NCREIF INVESTMENT RETURNS REFLECT SUSTAINED INCOME, BUT REDUCED APPRECIATION GROWTH
Source: CBRE Research, NCREIF, Q2 2017. All returns are reported on an unlevered basis.
• NCREIF’s National Property Index for apartment holdings was 6.28% for the year ending Q2 2017, with appreciation at 1.72% and income at 4.51%. The income portion has edged down slightly over the past few years; the decline in the total return has been primarily due to lower levels of appreciation.
• The garden apartments subindex is more favorable at 8.40% and the high-rise subindex less favorable at 5.06%.
• The current level reflects moderation from prior quarters, especially for the appreciation component of the index. It is alsobelow the 20-year average of 9.47%.
• Southern California’s Inland Empire had the highest total return of 14.61% for the year ending Q2 2017, followed by Orange County (10.22%), Charlotte (10.04%) and Denver (9.48%).
21.214.6 11.4
-7.3 -17.5
18.2 15.511.2 10.4 10.3 12.0
7.3 6.3
-30
-20
-10
0
10
20
30
2005 2006 2007 2008 2009 2010 2011 2012 2013 2014 2015 2016 Q2 2017
Appreciation Income Total(%)

11 U.S. MULTIFAMILY | Q2 2017 FIGURESCBRE RESEARCH
FIGURE 9OUTLOOK: MULTIFAMILY DEMAND PROJECTED TO REMAIN HEALTHY, BUT RENTAL GROWTH MODEST
Source: CBRE Research, CBRE Econometric Advisors, Q2 2017, baseline scenario forecasts. Based on the 62 metro markets tracked by CBRE EA. Note that new property completions and net absorption are counted in the quarter in which the property reaches occupancy stabilization.
• Demand for multifamily housing is expected to stay very strong over the next 12 months. Net absorption should reach 228,600 units, up 3.7% from the year ending Q2 2017.
• Completions should rise even more. CBRE EA forecasts that 306,200 new units will be delivered over the next 12 months, an 18% increase from the year ending Q2 2017.
• Because of this supply-demand imbalance, vacancy is expected to increase slightly to 5.0% in Q2 2018, up 40 bps from Q2 2017.
• Rent growth is projected to average 1.2% over the next 12 months—modest and below the historical average.
• Among the larger markets, Orlando is forecast to have the top rent growth at 5.9%. The Bay Area’s recovery is reflected in its rent growth forecasts, which are among the highest in the country: Oakland 5.3%, San Francisco 4.2% and San Jose 4.1%. Seattle is also a leader with a projected 4.2% increase in rents over the next 12 months.
67 65 79
51 65
86 96
60 64
112
49
21 37
113
53 74
47 54
3.0
3.5
4.0
4.5
5.0
5.5
0
30
60
90
120
150
Q2 2016 Q3 2016 Q4 2016 Q1 2017 Q2 2017 Q3 2017 Q4 2017 Q1 2018 Q2 2018
Vacancy Rate (%)Completions Net Absorption VacancyUnits (000s)
Forecast
(L) (L) (R)

FOR MORE INFORMATION, PLEASE CONTACT:
Brian McAuliffePresidentCapital Markets, Institutional Properties+1 312 935 [email protected]
Jeff MajewskiExecutive Managing DirectorHead of Production, AmericasCapital Markets+1 713 787 [email protected]
Peter DonovanExecutive Managing DirectorCapital Markets, Multifamily+1 617 217 [email protected]
Colleen Pentland LallyDirectorCapital Markets+1 617 217 [email protected]
Mitchell W. KiffeSenior Managing Director | Co-Head of National ProductionDebt & Structured FinanceCapital Markets+1 703 905 [email protected]
Spencer G. LevyAmericas Head of Research & Senior Economic Advisor+1 617 912 [email protected] Spencer on Twitter: @SpencerGLevyFollow Spencer on LinkedIn
Jeanette I. Rice, CREAmericas Head of Multifamily Research+1 214 979 [email protected] Jeanette on Twitter: @RiceJeanette
Maximilian SaiaEconomist+1 213 613 [email protected]
Disclaimer: Information contained herein, including projections, has been obtained from sources believed to be reliable. While we do not doubt its accuracy, we have not verified it and make no guarantee, warranty or representation about it. It is your responsibility to confirm independently its accuracy and completeness. This information is presented exclusively for use by CBRE clients and professionals and all rights to the material are reserved and cannot be reproduced without prior written permission of CBRE.