Q1 - Singulus Technologies · The market research company IHS iSuppli forecast rising global sales...
24
Report for the 1 st Half 2013 Consolidated Statements IFRS as of June 30, 2013 (unaudited)
Transcript of Q1 - Singulus Technologies · The market research company IHS iSuppli forecast rising global sales...

Q1.2013
Report for the 1st Half 2013Consolidated Statements IFRS
as of June 30, 2013 (unaudited)
2 R E p O R T F I R S T H A L F Y E A R 2 013
Financial Key Figures of the First Half-Year Slightly Improved Compared with the Prior-Year Period
→ Important key figures for the 1st half 2013 above prior-year levels→ Demand for Blu-ray significant above plans→ Additional order intake for BLULINE II after completion of quarter→ Positive EBIT for 2013 still targeted→ Weak order intake for Solar
The key financial figures of the 1st half 2013 of the SINGULUS TECHNOLOGIES AG (SINGULUS TECHNOLOGIES) have improved compared with the same period one year ago due to the increased order intake for production machines for the BLULINE II type in the Optical Disc segment and the existing order backlog in the Semiconductor and Solar divisions. In the first six months of 2013 SINGULUS TECHNOLOGIES overall achieved slightly higher sales than in the comparable period for 2012. Sales for the half-year amounted to € 49.2 million (previous year: € 43.6 million). In the 2nd quarter € 26.4 million were achieved (previous year: € 27.6 million). While the order intake in the 1st half 2012 amounted to € 87.0 million due to a major order in the Solar segment, order intake with a total volume of € 48.8 million
was recorded in the course of the 1st half of the business year 2013. The order intake in the 2nd quarter amounted to € 33.2 million, which was slightly above the prior-year level of € 31.3 million. As of June 30, 2013 the order backlog accordingly stood at € 39.7 million, which is below the € 70.2 million achieved in the prior-year period. The earnings before interest and taxes (EBIT) has improved compared with the prior year. In the 1st half of 2013 earnings before interest and taxes (EBIT) stood at € -6.5 million (previous year: € -12.4 million). In the quarter under review the EBIT was slightly negative and came to € -1.6 million (previous year: € -6.7 million).

R E p O R T F I R S T H A L F Y E A R 2 013 3
In addition, in the current quarter there were replacement investments on part of our customers for CD and DVD production machines, which proves the efficiency in the production of CDs and DVDs on the international markets. The markets for Blu-ray Discs continue to perform favorably in 2013. Accordingly, in May 2013 the DEG (Digital Entertainment Group) announced a growth for Blu-ray Discs sales for the leading US market of approxi-mately 30 % compared with the prior-year period 2012. The number of new releases jumped by 37 % compared with the prior-year period. In a survey in
Business trends and market development Optical DiscThe globally rising penetration of the Blu-ray Disc results in improved demand for production machines in the current year compared with the previous year. Until June 30, 2013 more production systems were sold than in the prior-year period. Additional order intake was recorded in July after the completion of the half-year. Fortunately, for the current business year the volume sales of BLULINE II machines for the production of Blu-ray Discs are significant above our own forecasts.
June 2013 the market research institute NPD Group USA assessed that 44 % of consumers actively use physical media (CD, DVD and Blu-ray Disc) and only 5 % use downloads.
Towards the end of the year the market introduction of the new Xbox One with a Blu-ray Disc drive by Microsoft is expected. The offering of corresponding games on Blu-ray format will probably also result in an additional pick-up in demand for the discs and therefore also for the machines produced by SINGULUS TECHNOLOGIES. Initial orders for this application were already received.
→ HIgH-teCH wItH BLULINe II
Fascination Blu-ray – Ready for 4K TV

4 R E p O R T F I R S T H A L F Y E A R 2 013
pursuant to a study by the market research institute NPD Solarbuzz dated July 2, 2013. This would correspond to a year-over-year increase of 22 %.
In view of the ongoing anti-dumping proceedings against Chinese photovoltaic producers and already resolved, temporary duties, the prices for solar modules are also recovering slowly. As a result, in Europe the prices for crystalline solar modules from China increased by four percent and additional price hikes are expected. Nevertheless, there is still excess capacity for production output for cells and modules, which leads to a continuing investment restraint for production equipment in the solar market. If this situation prevails in the 3rd quarter of 2013 and no significant orders can be acquired in this segment, this will have a corresponding adverse impact on the earnings targets of the company.
highlighted. However, so far no major order intakes were realized in the 1st half of 2013. SINGULUS TECHNOLOGIES as a high-performance technology supplier for crystalline and thin-film solar cells is excel-lently positioned and therefore has very good opportunities to benefit at the forefront amongst the start of a new investment cycle in the photovoltaics industry.
However, the global market for solar modules is still charac-terized by excess capacities in 2013 as well. More than 60 % of the demand of 15 GW in the first half-year 2013 originated from four countries: Germany, China, Japan and the US. During the course of the 2nd half of 2013 the global photovoltaics demand will presumably reach additional 20 GW. Accordingly, the demand for 2013 will probably rise to 35.1 GW
Business trends and market development Solar The market for photovoltaics continues to remain difficult. Against the backdrop of this difficult market environment, the development of SINGULUS TECHNOLOGIES’ Solar division falls short of our expectations. SINGULUS TECHNOLOGIES is in close contact with customers, which plan investments in the set-up of new cell manufacturing lines or so-called upgrades of existing production lines. In particular, project talks with renowned customers in Asia, the Middle East, South- and Central America and especially in South Africa should be
→ tHIN FILm SoLAR
Refined Glass Surfaces Providing Energy

R E p O R T F I R S T H A L F Y E A R 2 013 5
Business trends and market development SemiconductorIn the 1st half of 2013 SINGULUS TECHNOLOGIES intensively progressed the assembly and completion of the machines ordered in the year 2012. In the meantime all machines are in the commissioning stage or will be delivered in the 2nd half of 2013. Talks with major customers are at a project stage and are expected to result in new order intake. The market research company IHS iSuppli forecast rising global sales for the semiconductor market to US-$ 324.6 billion, which means a growth of 4.3 % compared with the prior year, as well as a continuous growth
in sales in the next couple of years to a level of global sales of US-$ 412.8 billion by 2016. In this context the market for MRAM components as a sub- market within the semiconductor market is currently still in an early development stage. Correspondingly, the market research company VLSIresearch projects a significant growth for MRAM wafers in the next years. Many large memory producers such as Everspin, Hynix, Micron and Samsung amongst others have announced to invest into the MRAM development and manufacturing. Toshiba presented an MRAM chip in last year’s December. Crocus Technologies, a semiconductor producer based in the Silicon Valley, is currently
→ NANo VACUUm CoAtINg
Thin Film Layer for New Applications
setting up a modern MRAM production line as a joint venture with the Russian stock-listed company Rusnano.
If the MRAM memory components will establish themselves in the next couple of years due to their specific advantages, the transition towards the industrial mass production is expected. For the expected market of new MRAM wafer SINGULUS TECHNOLOGIES is currently working on presenting new machine concepts, which satisfy the demand for more efficient ultra-high vacuum coating machines with an increased wafer capacity.

6 R E p O R T F I R S T H A L F Y E A R 2 013
Sales and earningsSales in the first six months in 2013 came to € 49.2 million, above the prior-year level of € 43.6 million. This increase is due to higher sales in the segments Optical Disc (€ +5.2 million) and Semicon-ductor (€ +3.2 million). Within the Solar division sales declined by € 2.8 million. Sales of € 26.4 million in the 2nd quarter 2013 (previous year: € 27.6 million) were thus slightly lower than the prior-year level. Sales are split into € 21.4 million in the Optical Disc segment (previous year: € 17.0 million), Solar at € 2.1 million (previous year: 6.8 million) and Semicon-ductors at € 2.9 million (previous year: € 3.8 million).
The percentage regional breakdown of sales for the 2nd quarter 2013 was as follows: Europe 24.6 % (previous year: 34.4 %), Asia 10.2 % (previous year: 20.3 %), North and South America 44.7 % (previous year: 41.7 %) as well as Africa and Australia 20.5 % (previous year: 3.6 %). For the entire 1st half of 2013 the percentage regional sales breakdown was as follows: Europe 25.2 % (previous year: 34.2 %), Asia 16.1 % (previous year: 25.9 %), North and South America 47.3 % (previous year: 36.9 %) as well as Africa and Australia 11.4 % (previous year: 3.0 %). In the 1st half of 2013 SINGULUS TECHNOLOGIES realized a gross profit margin in the amount of 20.0 % (previous year: 24.9 %). The gross profit margin in the 2nd quarter 2013 stood at 24.8 % (previous year: 23.2 %).
Key financial figures
order intake and order backlogThe order intake in the 1st half of 2013 amounted to 48.8 million (previous year: € 87.0 million), below the level achieved in the 1st half of 2012. In the quarter under review the order intake came to € 33.2 million (previous year: € 31.3 million). The order backlog as per June 30, 2013 amounted to € 39.7 million and was thus also slightly below the comparable level as of June 30, 2012 (€ 70.2 million).
R E p O R T F I R S T H A L F Y E A R 2 013 7
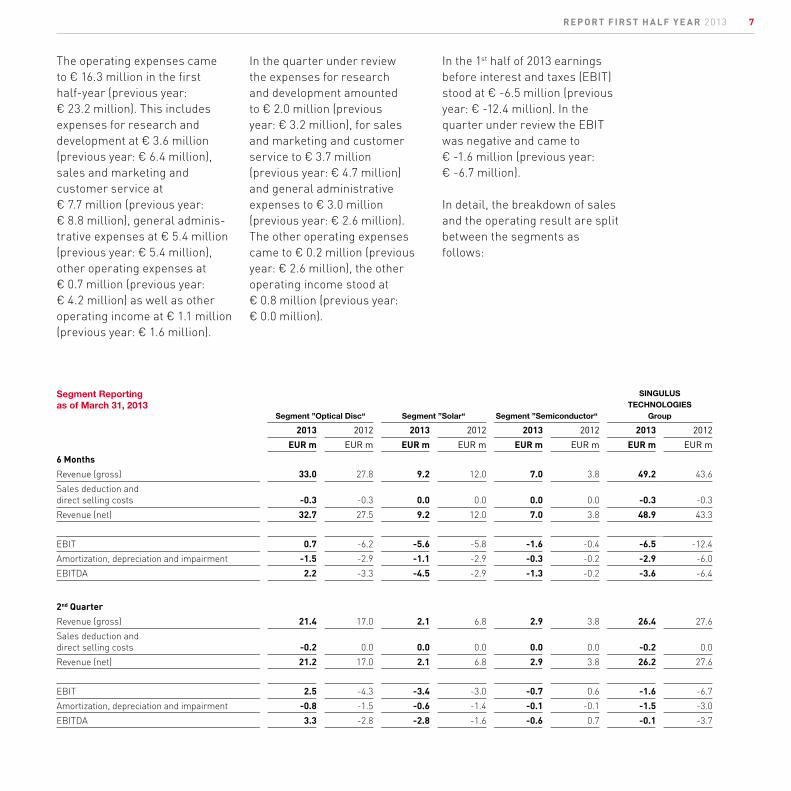
Segment Reporting as of march 31, 2013
Segment ”optical Disc“ Segment ”Solar“ Segment ”Semiconductor“
SINgULUS teCHNoLogIeS
group
2013 2012 2013 2012 2013 2012 2013 2012
EUR m EUR m EUR m EUR m EUR m EUR m EUR m EUR m
6 Months
Revenue (gross) 33.0 27.8 9.2 12.0 7.0 3.8 49.2 43.6
Sales deduction anddirect selling costs -0.3 -0.3 0.0 0.0 0.0 0.0 -0.3 -0.3
Revenue (net) 32.7 27.5 9.2 12.0 7.0 3.8 48.9 43.3
EBIT 0.7 -6.2 -5.6 -5.8 -1.6 -0.4 -6.5 -12.4
Amortization, depreciation and impairment -1.5 -2.9 -1.1 -2.9 -0.3 -0.2 -2.9 -6.0
EBITDA 2.2 -3.3 -4.5 -2.9 -1.3 -0.2 -3.6 -6.4
2nd Quarter
Revenue (gross) 21.4 17.0 2.1 6.8 2.9 3.8 26.4 27.6
Sales deduction anddirect selling costs -0.2 0.0 0.0 0.0 0.0 0.0 -0.2 0.0
Revenue (net) 21.2 17.0 2.1 6.8 2.9 3.8 26.2 27.6
EBIT 2.5 -4.3 -3.4 -3.0 -0.7 0.6 -1.6 -6.7
Amortization, depreciation and impairment -0.8 -1.5 -0.6 -1.4 -0.1 -0.1 -1.5 -3.0
EBITDA 3.3 -2.8 -2.8 -1.6 -0.6 0.7 -0.1 -3.7
In the quarter under review the expenses for research and development amounted to € 2.0 million (previous year: € 3.2 million), for sales and marketing and customer service to € 3.7 million (previous year: € 4.7 million) and general administrative expenses to € 3.0 million (previous year: € 2.6 million). The other operating expenses came to € 0.2 million (previous year: € 2.6 million), the other operating income stood at € 0.8 million (previous year: € 0.0 million).
The operating expenses came to € 16.3 million in the first half-year (previous year: € 23.2 million). This includes expenses for research and development at € 3.6 million (previous year: € 6.4 million), sales and marketing and customer service at € 7.7 million (previous year: € 8.8 million), general adminis-trative expenses at € 5.4 million (previous year: € 5.4 million), other operating expenses at € 0.7 million (previous year: € 4.2 million) as well as other operating income at € 1.1 million (previous year: € 1.6 million).
In the 1st half of 2013 earnings before interest and taxes (EBIT) stood at € -6.5 million (previous year: € -12.4 million). In the quarter under review the EBIT was negative and came to € -1.6 million (previous year: € -6.7 million). In detail, the breakdown of sales and the operating result are split between the segments as follows:

8 R E p O R T F I R S T H A L F Y E A R 2 013
Balance Sheet and Liquidity The long-term assets amounted to € 54.5 million and were therefore around the previous year’s level (previous year: € 53.4 million). The capitalized development expenses amounted to € 6.6 million (December 31, 2012: € 7.1 million). In the first six months of 2013 the capitalized investments in developments totaled € 1.5 million (previous year: € 1.9 million). Scheduled write-offs and amortization on capitalized development expenses amounted to € 1.0 million in the 1st half of 2013 (previous year: € 3.1 million). In the quarter under review capitalized invest-ments development expenses amounted to € 0.4 million (previous year: € 1.0 million). Scheduled write-offs and amortization on capitalized development expenses amounted to € 0.5 million in the quarter under review (previous year: € 1.6 million). Property, plant and equipment increased by € 0.7 million to € 8.2 million
(December 31, 2012: € 7.5 million). This is mainly due to the transfer of a development machine (€ 1.0 million) from capitalized development expenses to property, plant and equipment. The capital expenditure in property, plant and equipment remained around the prior- year level and amounted to € 0.4 million in the 1st half of 2013 (previous year: € 0.4 million). In the quarter under review capitalized investments development expenses amounted to € 0.2 million (previous year: € 0.3 million). Most of the spending was used for replacement investments. In the period under review the other intangible assets dropped by € 1.1 million. This change is mainly due to periodic write-offs on the acquired customer base at that time from the acquisition of the Blu-ray Disc activities of the Oerlikon Balzer AG in the amount of € 0.6 million. In addition, the accounts receivable due in more than 12 months declined by € 1.8 million to € 5.3 million in the period under review (December 31, 2012: € 3.5 million).
Current assets declined by € 17.4 million during the period under review. The reason is a decline in cash and cash equivalents in the amount of € 15.7 million due to the payment of interest for the bond (€ -4.7 million), the capital deployment for ongoing production orders and the weak business activities in the 1st half of 2013. Furthermore, accounts receivable due within one year rose by € 2.0 million. Inventories decreased by € 6.5 million mainly due to the sale of inventoried machines in the Optical Disc division and amounted to € 39.6 million in total at the end of the period under review. Furthermore, the other receivables and other assets increased by € 2.3 million to € 27.0 million. This rise is predominantly caused by prepayments received for current projects.
R E p O R T F I R S T H A L F Y E A R 2 013 9
buyback program. Furthermore, the long-term bank liabilities declined by € 1.3 million owing to the term to maturity and the corresponding transfer to short-term liabilities in connection with the regular repayment of the KfW loan.
Shareholders’ equityThe shareholders’ equity in the Group declined by € 8.6 million in the quarter under review and stood at € 65.9 million as of June 30, 2013 (December 31, 2012: € 74.5 million). Equity in the amount of € 65.0 million is attributable to the shareholders of the parent company and € 0.9 million to minorities.Accordingly, the equity ratio amounts to 34.6 % (December 31, 2012: 36.1 %). Cash FlowIn the 1st half 2013 the operating cash flow in the Group was negative at € -5.1 million, but was nevertheless € 2.9 million higher than the prior-year level of € -8.0 million. Due to the issue of the corporate bond in March 2012 the cash flows from investing activities and from
The short-term liabilities declined by € 4.2 million compared with the year-end level of 2012. Specifically, short-term financing liabilities from the issue of the corporate bond declined by € 2.3 million. This is in connection with the payment of the coupon as of March 23, 2013 in the amount of € 4.7 million. In addition, the liabilities from production orders declined by € 4.4 million due to the completion of current orders, which are accounted for pursuant to the percentage- of-completion method. Accounts payable and other short-term liabilities declined by € 1.1 million and € 1.2 million, respectively. In contrast, prepayments received for current orders in the Optical Disc segment rose by € 4.9 million. The long-term liabilities declined by € 3.5 million compared with the year-end level of 2012. This results from a reduction of long-term financing liabilities from the issuance of the bond (€ -1.8 million) due to the bond
financing activities differ materially from the prior-year levels. The cash flow from investing activities came to € -2.0 million (previous year: € -33.4 million). The prior-year period was characterized by the investment of liquid funds from the inflow due to the bond in the amount of € 30.0 million. These funds with a term to maturity exceeding three months are reported in the investing segment of the cash flow calculation. The cash flow from financing activities amounted to € -8.5 million in the first half 2013 and was characterized by the payment of interest for the corporate bond (€ 4.7 million). In the previous year, the cash flow from financing activities amounted to € 57.2 million due to the cash inflow from the issue of the bond. Overall, in the 1st half of 2013 the funds in the cash flow statements declined by € 15.7 million analogous to the decline in cash and cash equivalents reported in the balance sheet.

10 R E p O R T F I R S T H A L F Y E A R 2 013
Risk Report During the first six months of the business year 2013 there were no changes regarding the risks depicted in the Annual Report for the year 2012.
Development of costs and pricesFrom our perspective the selling prices developed as planned in the 1st half of the business year. Material and personnel expenses also developed according to our budgets. However, the price situation in the Solar segment strongly depends on the future developments of demand in this market.
Research and developmentAt € 3.7 million the expenditures for developments in the 1st half of 2013 were around the prior-year’s level (previous year: € 3.8 million). The expenditures for development activities came to € 1.7 million (previous year: € 2.1 million) in the quarter under review.
employeesDue to the implemented streamlining of the international activities as well as due to the cost reduction measures in the area of wet-chemical machines at our site in Fürstenfeldbruck, the number of employees in the SINGULUS TECHNOLOGIES Group declined from 444 employees as of June 30, 2012 to 362 employees as of June 30, 2013. During the 1st half of 2013 381 employees were employed on average in the group of companies (previous year: 449 employees).
Changes in the executive and Supervisory Boards There were no changes of the members of the Executive and Supervisory Boards in the period under review. Ms. Christine Kreidl, who was appointed as successor of Mr. Günter Bachmann in December 2012 by the relevant Local Court as Supervisory Board member until the following Annual General Meeting, was elected to the Supervisory Board in the course of the Annual General Meeting on June 6, 2013 with more than 99 % of the shareholder votes present.

R E p O R T F I R S T H A L F Y E A R 2 013 11
outlook for the business year 2013
We are currently anticipating to once again grow sales in the segments Optical Disc, Solar and Semiconductor in 2013 compared with 2012 and expect to complete the business year in the Group with an overall slightly positive operating result (EBIT). However, adjusting for financing expenses a slightly negative net result for the Group pursuant to IFRS would result. To achieve the growth in sales in the Solar division projected in our forecasts it is required to achieve a corresponding, order intake in the 3rd quarter 2013. To strengthen and further develop the existing business areas the company pursued the targeted development of new
the SINgULUS Stock The SINGULUS TECHNOLOGIES shares started the 2nd quarter 2013 on April 2, 2012 with a share price of € 1.27. At the end of the 1st half of the year the stock closed at € 1.38 on June 28. Accordingly, SINGULUS TECHNOLOGIES has a market capitalization of € 67.5 million.
Corporate bondWith the approval of the Super-visory Board the Executive Board of SINGULUS TECHNOLOGIES resolved to again prolong the buyback program of the corporate bonds issued on March 23, 2012, which was commenced on December 11, 2012 and limited to June 30, 2013, until December 31, 2013 and to increase the total volume to € 5.0 million at maximum. The other conditions of the program remain unchanged.
products and application areas based on its core competencies in order to open new markets with this. This strategic further development of the existing product portfolio by internal measures is in the focus in the business year 2013. At the same time we are reviewing reasonable acquisition opportu-nities to strengthen the sustainable development at SINGULUS TECHNOLOGIES. With the consistent and successful implementation of this strategy we expect a return to a long-term growth path once again. Yours sincerely, The Executive Board SINGULUS TECHNOLOGIES AG

12 R E p O R T F I R S T H A L F Y E A R 2 013
Consolidated Balance Sheet as of June 30, 2013 and December 31, 2012 (IFRS unaudited)
ASSetS June 30, 2013 Dec. 31, 2012
[EUR m] [EUR m]
Cash and cash equivalents 40.2 55.9
Trade receivables 25.0 23.0
Receivables from construction contracts 3.9 3.4
Other receivables and other assets 27.0 24.7
Total receivables and other assets 55.9 51.1
Raw materials, consumables and supplies 15.6 20.0
Work in process 24.0 26.1
Total inventories 39.6 46.1
Total current assets 135.7 153.1
Trade receivables 5.3 3.5
Borrowings 3.9 3.7
Property, plant and equipment 8.2 7.5
Capitalized development costs 6.6 7.1
Goodwill 21.7 21.7
Other intangible assets 7.8 8.9
Deferred tax assets 1.0 1.0
Total non-current assets 54.5 53.4
Total assets 190.2 206.5

R E p O R T F I R S T H A L F Y E A R 2 013 13
Consolidated Balance Sheet as of June 30, 2013 and December 31, 2012 (IFRS unaudited)
LIABILItIeSJune 30, 2013 Dec. 31, 2012
[EUR m] [EUR m]
Cash and cash equivalents 40.2 55.9
Trade receivables 25.0 23.0
Receivables from construction contracts 3.9 3.4
Other receivables and other assets 27.0 24.7
Total receivables and other assets 55.9 51.1
Raw materials, consumables and supplies 15.6 20.0
Work in process 24.0 26.1
Total inventories 39.6 46.1
Total current assets 135.7 153.1
Trade receivables 5.3 3.5
Borrowings 3.9 3.7
Property, plant and equipment 8.2 7.5
Capitalized development costs 6.6 7.1
Goodwill 21.7 21.7
Other intangible assets 7.8 8.9
Deferred tax assets 1.0 1.0
Total non-current assets 54.5 53.4
Total assets 190.2 206.5
June 30, 2013 Dec. 31, 2012
[EUR m] [EUR m]
Trade payables 6.7 7.8
Current bank liabilities 2.5 2.5
Prepayments received 8.6 3.7
Liabilities from construction contracts 11.7 16.1
Current financial liabilities from the issuance of bonds 1.3 3.6
Other current liabilities 11.5 12.7
Provisions for restructuring measures 4.9 5.1
Provisions for taxes 0.2 0.3
Other provisions 2.4 2.2
Total current liabilities 49.8 54.0
Non-current financial liabilities from the issuance of bonds 56.5 58.3
Non-current bank liabilities 0.4 1.7
Provisions for restructuring measures 7.0 7.5
Pension provisions* 10.6 10.5
Total non-current liabilities 74.5 78.0
Total liabilities 124.3 132.0
Subscribed capital 48.9 48.9
Capital reserves 77.2 77.2
Reserves* 2.2 2.2
Retained earnings* -63.3 -54.8
Equity attributable to owners of the parent 65.0 73.5
Non-controlling interests 0.9 1.0
Total equity and liabilities 65.9 74.5
Total equity and liabilities 190.2 206.5
* Prior-year figures adjusted

14 R E p O R T F I R S T H A L F Y E A R 2 013
Consolidated Income Statement as of June 30, 2013 and 2012 (IFRS unaudited)
2nd Quarter 6 Months
2013 2012 2013 2012
[EUR m] [in %] [EUR m] [in %] [EUR m] [in %] [EUR m] [in %]
Revenue (gross) 26.4 100.8 27.6 100.0 49.2 100.6 43.6 100.7
Sales deductions and direct selling costs -0.2 -0.8 0.0 0.0 -0.3 -0.6 -0.3 -0.7
Revenue (net) 26.2 100.0 27.6 100.0 48.9 100.0 43.3 100.0
Cost of sales -19.7 -75.2 -21.2 -76.8 -39.1 -80.0 -32.5 -75.1
Gross profit on sales 6.5 24.8 6.4 23.2 9.8 20.0 10.8 24.9
Research and development -2.0 -7.6 -3.2 -11.6 -3.6 -7.4 -6.4 -14.8
Sales and customer service -3.7 -14.1 -4.7 -17.0 -7.7 -15.7 -8.8 -20.3
General administration -3.0 -11.5 -2.6 -9.4 -5.4 -11.0 -5.4 -12.5
Other operating expenses -0.2 -0.8 -2.6 -9.4 -0.7 -1.4 -4.2 -9.7
Other operating income 0.8 3.1 0.0 0.0 1.1 2.2 1.6 3.7
Total operating expenses -8.1 -30.9 -13.1 -47.5 -16.3 -33.3 -23.2 -53.6
EBIT -1.6 -6.1 -6.7 -24.3 -6.5 -13.3 -12.4 -28.6
Finance income 0.6 2.3 0.3 1.1 1.2 2.5 0.5 1.2
Finance costs -1.5 -5.7 -1.7 -6.2 -2.9 -5.9 -2.0 -4.6
EBT -2.5 -9.5 -8.1 -29.3 -8.2 -16.8 -13.9 -32.1
Tax expenses/income -0.2 -0.8 0.5 1.8 -0.4 -0.8 1.6 3.7
profit or loss for the period -2.7 -10.3 -7.6 -27.5 -8.6 -17.6 -12.3 -28.4
Thereof attributable to: - - - -
Owners of the parent -2.7 -7.5 -8.5 -12.2
Minority interests 0.0 -0.1 -0.1 -0.1
[in €] [in €] [in €] [in €]
Basic earnings per share based on the profit for the period (in EUR) attributable to owners of the parent -0.05 -0,.15 -0.17 -0.25
Diluted earnings per share based on the profit for the period (in EUR) attributable to owners of the parent -0.05 -0.15 -0.17 -0.25
Basic number of shares. pieces 48,930,314 48,930,314 48,930,314 48,930,314
Diluted number of shares. pieces 48,930,314 48,930,314 48,930,314 48,930,314
R E p O R T F I R S T H A L F Y E A R 2 013 15
Consolidated Income Statement as of June 30, 2013 and 2012 (IFRS unaudited)
Statement of Changes in Consolidated equityas of June 30, 2013 and 2012 (IFRS unaudited)
Consolidated Statement of Comprehensive Incomeas of June 30, 2013 and 2012 (IFRS unaudited)
2nd Quarter 6 Months
June 30, 2013 June 30, 2012 June 30, 2013 June 30, 2012[EUR m] [EUR m] [EUR m] [EUR m]
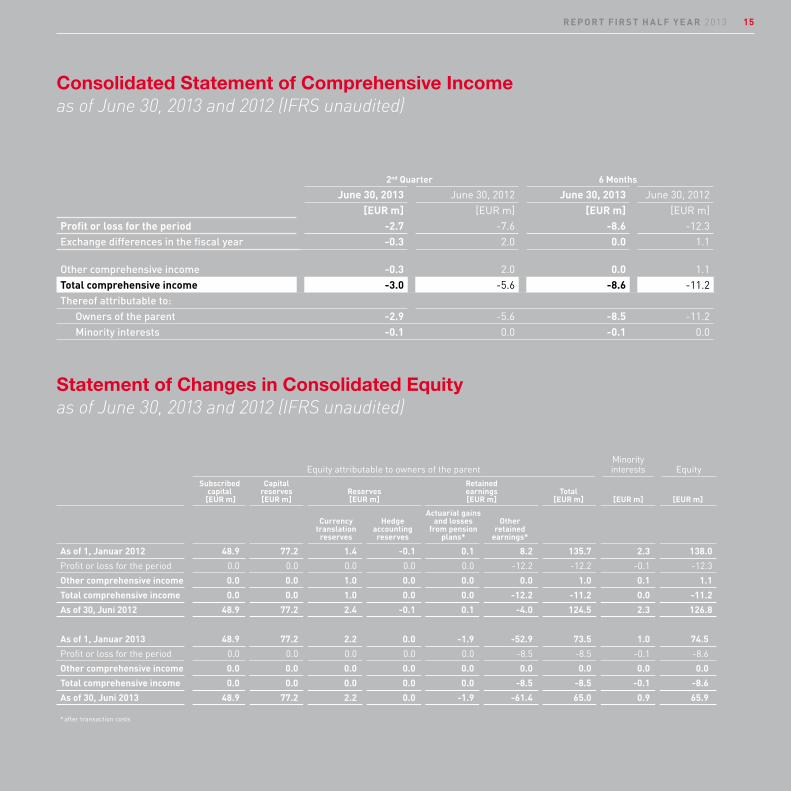
profit or loss for the period -2.7 -7.6 -8.6 -12.3Exchange differences in the fiscal year -0.3 2.0 0.0 1.1
Other comprehensive income -0.3 2.0 0.0 1.1Total comprehensive income -3.0 -5.6 -8.6 -11.2Thereof attributable to: Owners of the parent -2.9 -5.6 -8.5 -11.2 Minority interests -0.1 0.0 -0.1 0.0
Equity attributable to owners of the parentMinorityinterests Equity
Subscribedcapital
[EUR m]
Capitalreserves [EUR m]
Reserves [EUR m]
Retainedearnings [EUR m]
Total [EUR m]
[EUR m]
[EUR m]
Currencytranslation
reserves
Hedgeaccountingreserves
Actuarial gainsand losses
from pensionplans*
Otherretained
earnings*
As of 1, Januar 2012 48.9 77.2 1.4 -0.1 0.1 8.2 135.7 2.3 138.0
Profit or loss for the period 0.0 0.0 0.0 0.0 0.0 -12.2 -12.2 -0.1 -12.3
Other comprehensive income 0.0 0.0 1.0 0.0 0.0 0.0 1.0 0.1 1.1
Total comprehensive income 0.0 0.0 1.0 0.0 0.0 -12.2 -11.2 0.0 -11.2
As of 30, Juni 2012 48.9 77.2 2.4 -0.1 0.1 -4.0 124.5 2.3 126.8
As of 1, Januar 2013 48.9 77.2 2.2 0.0 -1.9 -52.9 73.5 1.0 74.5
Profit or loss for the period 0.0 0.0 0.0 0.0 0.0 -8.5 -8.5 -0.1 -8.6
Other comprehensive income 0.0 0.0 0.0 0.0 0.0 0.0 0.0 0.0 0.0
Total comprehensive income 0.0 0.0 0.0 0.0 0.0 -8.5 -8.5 -0.1 -8.6
As of 30, Juni 2013 48.9 77.2 2.2 0.0 -1.9 -61.4 65.0 0.9 65.9
* after transaction costs

16 R E p O R T F I R S T H A L F Y E A R 2 013
Consolidated Cash Flow Statementas of June 30, 2013 and 2012 (IFRS unaudited)
June 30, 2013 June 30, 2012*[EUR m] [EUR m]
Cash flows from operating activities Profit or loss for the period -8.6 -12.3 Adjustment to reconcile profit or loss for the period to net cash flow Amortization, depreciation and impairment of non-current assets 2.9 6.0 Net allocation to pension provisions 0.0 0.1 Other non-cash income -0.3 0.5 Net interest income* 1.7 1.5 Net tax expense* 0.4 -1.6 Change in trade receivables* -3.8 8.3 Change in contract work -4.9 -3.1 Change in other receivables and other assets -1.6 -1.1 Change in inventories 6.6 -14.5 Change in trade payables -1.1 1.6 Change in other liabilities* -0.8 1.6 Change in prepayments 4.9 5.1 Change in loans to customers -0.2 0.0 Change in provisions from restructuring measures -0.7 0.0 Change in other provisions 0.1 0.1 Interest paid for bank loans* -0.3 -0.4 Interest received* 1.2 0.5 Income taxes paid* -0.6 3.5 -0.3 4.3Net cash from/used in operating activities* -5.1 -8.0* Prior-year figures adjusted

R E p O R T F I R S T H A L F Y E A R 2 013 17
June 30, 2013 June 30, 2012*[EUR m] [EUR m]
Cash flows from investing activities* Cash paid for investments in development projects -1.5 -1.9 Change in cash and cash equivalents (with terms longer than 3 months)* 0.0 -30.0 Cash paid for investments in other intangible assets and property,
plant and equipment -0.5 -0.5 Cash paid for the acquisition of Oerlikon‘s Blu-Ray business 0.0 -2.0 -1.0 -33.4 Net cash from/used in investing activities* -2.0 -33.4Cash flows from financing activities
Cash received from the issue of a bond 0.0 58.4 Cash used to pay down loans -1.2 -1.3 Redemption of bonds -1.9 0.0 Change in financial assets subject to restrictions on disposal -0.7 0.1 Interests paid for bond -4.7 -8.5 0.0 57.2 Net cash from/used in financing activities -8.5 57.2Decrease in cash and cash equivalents -15.6 15.8
Effect of exchange rate changes -0.1 0.2Cash and cash equivalents in the statement of cash flowsat the beginning of the fiscal year 40.9 17.8Cash and cash equivalents in the statement of cash flowsat the end of the fiscal year 25.2 33.8
Time deposits with terms longer than 3 months 15.0 30.0Cash and cash equivalents at the end of the fiscal year 40.2 63.8
* Prior-year figures adjusted

18 R E p O R T F I R S T H A L F Y E A R 2 013
Notes to the interim results (unaudited)
The SINGULUS TECHNOLOGIES Aktiengesellschaft (hereinafter also “SINGULUS TECHNOLOGIES” or the “Company”) is an exchange-listed stock corporation domiciled in Germany. The consolidated financial accounts presented for the interim reporting of the SINGULUS TECHNOLOGIES AG and its subsidiaries (the “Group”) for the 1st half of the business year 2013 were approved for publication by decision of the Executive Board as of August 12, 2013. The consolidated financial accounts were drawn up in Euro (EUR/€). If not stated otherwise, all figures are in millions of Euro (million €). Due to statements in million € differences in rounding may occur.
Accounting and valuation principlesThe preparation of the abbreviated consolidated interim results for the period from January 1 to June 30, 2013 was made pursuant to IAS 34 “Interim Financial Reporting”. The abbreviated consolidated interim results do not include all of the notes and information required for the reporting for the full business year and should be read in conjunction with the consolidated financial accounts as of December 31, 2012. The preparation of the annual results pursuant to IAS 34 requires estimates and assumptions by the management, affecting the level of the reported assets, liabilities, income, expenses as well as contingent liabilities. These assumptions and estimates mainly affect the Group-consistent determination of useful life expectancy, the write-offs of assets, the
valuation of provisions, the recoverability of receivables, the determination of realizable terminal values in the area of inventories as well as the realizability of future tax relieves. The actual values can differ from the assumptions and estimates made on a case by case basis. Changes are recognized affecting earnings at the time of the knowledge gained. The accounting and valuation methods applied in the consolidated accounts for the interim reporting correspond to those applied for the most recent consolidated financial report as of the end of the business year 2012. For a detailed description of the accounting principles please refer to the notes of the consolidated financial statements of our Annual Report 2012. In June 2011 the IASB published changes of IAS 19 - Employee Benefits - which were adopted by the EU in June 2012. The changes of IAS 19 are principally manda-torily applicable with retrospective effect for accounts for the business commencing on or after January 1, 2013. The Group adjusted the reported prior-year figures for the effects from the changes of IAS 19. For the valuation of the provisions for pensions the Group has so far applied the corridor approach. The abolishment of the corridor method due to the changed IAS 19 has an effect on the actuarial gains and losses directly in the balance sheet and resulted in an increase in the provisions for pensions in the amount of € 2.7 million as well as a reduction of the shareholders’ equity in the same amount. The consolidated profit and loss statements will be unaffected by actuarial gains and losses in the future, since they are included in the other result from now on.

R E p O R T F I R S T H A L F Y E A R 2 013 19
Intangible assetsCapitalized development expenses, goodwill, customer bases as well as concessions, intellectual property rights and other intangibles are included under intangible assets. As of June 30, 2013, the capitalized development expenses amounted to € 6.6 million (December 31, 2012: € 7.1 million). In the 1st half of 2013 the investments in developments totaled € 1.5 million (previous year: € 1.9 million). In the same period scheduled write-offs and amortization amounted to € 1.0 million (previous year: € 3.1 million). In the quarter under review development expenses amounted to € 0.4 million (previous year: € 1.0 million), the scheduled amortization for the respective period amounted to € 0.5 million (previous year: € 1.6 million).
Property, plant & equipmentIn the 1st half of the business year 2013 € 0.4 million were invested in property, plant & equipment (previous year: € 0.4 million). During the same period scheduled depreciation amounted to € 0.8 million (previous year: € 0.8 million). In the quarter under review capital expenditure amounted to € 0.2 million (previous year: € 0.3 million), the scheduled amortization for the respective period amounted to € 0.4 million (previous year: € 0.4 million).
Contingent liabilities and other financial obligationsThe contingent liabilities and other financial obligations not included in the consolidated accounts as of June 30, 2013 amount to € 47.6 million (December 31, 2012: € 47.6 million) and mainly include rent and leasing obligations (€ 28.1 million), guarantees for prepayments received (€ 16.1 million) as well as guarantees (€ 2.9 million).
Management does not have knowledge about facts that could have a materially adverse impact on the business operations, the financial situation or the business results of the company.
June 30, 2013 Dec. 31, 2012
EUR m EUR m
Accounts receivable –short-term 29.8 27.4
Receivables from production orders 3.9 3.4
Accounts receivable –long-term 5.3 4.1
less write-offs -4.8 -5.0
34.2 29.9
With the reporting as of December 31, 2012 term deposits with a maturity of more than three months were no longer reported as a component of the funds in the cash flow statements pursuant to IAS 7.7. The changes in term deposits with a remaining term to maturity exceeding three months are separately reported since then within the cash flow from investing activities. Correspondingly, below the cash flow statements a transition towards cash and cash equivalents in the balance sheet was included. In addition, with the reporting as of December 31, 2012 interest payments made and received (IAS 7.31) as well as cash flow from income taxes (IAS 7.35) were separately reported. Pursuant to IAS 8.42 the respective figures for the year 2012 were adjusted accordingly.
Scope of consolidationIn addition to the SINGULUS TECHNOLOGIES AG the consolidated financial statements include all companies, which are legally or factually controlled by the company. In the interim report as of June 30, 2013, in addition to the SINGULUS TECHNOLOGIES AG one domestic and 12 foreign subsidiaries were included. No companies have been added or deleted from the scope of consolidation in the current business year.
Accounts receivableThe accounts receivable as of June 30, 2013 are split as follows:

20 R E p O R T F I R S T H A L F Y E A R 2 013
Geographical informationas of June 2013
GermanyRest ofEurope
North andSouth
America AsiaAfrica and Australia
EUR m EUR m EUR m EUR m EUR m
Sales bycountry of origin 36.0 3.3 8.5 1.4 0.0
Country ofdestination 4.3 8.1 23.3 7.9 5.6
Geographical informationas of June 2012
GermanyRest ofEurope
North andSouth
America AsiaAfrica and Australia
EUR m EUR m EUR m EUR m EUR m
Sales bycountry of origin 28.7 2.9 5.8 6.2 0.0
Country ofdestination 7.8 7.1 16.1 11.3 1.3
geographical breakdown of sales
Sales reductions and individual selling expensesThe sales reductions include cash discounts granted. The individual selling expenses are mainly composed of expenses for packaging, freight and commissions.
general administrative expensesThe administrative expenses include the expenses for the management, personnel expenses, the finance and accounting departments as well as the corresponding expenses for rent and company cars. Furthermore, they include the ongoing IT expenses, legal and consulting fees, expenses for investor relations activities, the Annual General Meeting and the annual financial statements.
Research and development expensesIn addition to the research and non-capitalizable development expenses, the research and development expenses in the 2nd quarter of 2013 also include the scheduled amortization of capitalized development expenses in the amount of € 0.5 million (previous year: € 1.6 million). During the 1st half of 2013 write-offs on capitalized development activities amounted to € 1.0 million (previous year: € 3.1 million).
Financial income and financing expensesThe interest income/expenses are composed as follows:
Financial instrumentsAttributable time valueCash and cash equivalents as well as accounts payable regularly have a short term to maturity. The balance sheet values are approximately the attributable time values. The same holds true for short-term accounts receivables and other assets. The attributable time values of long-term accounts receivable corresponds to the present values corre-sponding to the payments of the assets subject to the relevant interest rate parameters. As a valuation price for the foreign exchange forwards concluded, for cash rates the ECB reference prices and for forward rates the relevant forward rate prices of the relevant commercial banks are used. The attributable time value of the exchange-listed bonds corresponds to the exchange price at the balance sheet date plus the book value of the accrued interest liabilities as of the balance sheet date.
June 30, 2013
June 30, 2012
EUR m EUR m
Interest income from long-term customer claims 0.6 0.4
Interest income from time deposits/sight deposits 0.2 0.1
other interest income 0.4 0.0
Financing expenses from issuance of bond -2.5 -1.4
other financing expenses -0.4 -0.6
-1.7 -1.5

R E p O R T F I R S T H A L F Y E A R 2 013 21
Valuation category
Book value Attributable time value
June 30, 2013 Dec. 31, 2012 June 30, 2013 Dec. 31, 2012
EUR m EUR m EUR m EUR m
Financial assets
Cash and cash equivalents L&R 40.2 55.9 40.2 55.9
Borrowings L&R 3.9 3.7 3.9 3.7
Other assets L&R 18.3 17.6 18.3 17.6
Derivatives Hedging derivatives FAHfT 0.1 0.1 0.1 0.1
Accounts receivable L&R 30.3 26.5 30.3 26.5
Receivables from production orders L&R 3.9 3.4 3.9 3.4
Financial liabilities
Corporate bond FLAC 57.8 61.9 52.5 47.8
Loans with variable interest rate FLAC 2.9 4.2 2.9 4.2
Derivatives Hedging derivatives Other derivatives
HD 0.0 0.0 0.0 0.0
FLHfT 0.0 0.0 0.0 0.0
Accounts payable FLAC 6.7 7.8 6.7 7.8
Off-balance sheet instruments
Loan commitments to customers 1.3 1.5 1.3 1.5
Total L&R 96.6 107.1 96.6 107.1
Total FAHfT 0.1 0.1 0.1 0.1
Total FLAC 67.4 73.9 62.1 59.8
Total FLHfT 0.0 0.0 0.0 0.0
Total HD 0.0 0.0 0.0 0.0
Annotations to the abbreviations:
L&R: Loans and Receivables FAHfT: Financial Assets Held for Trading
FLAC: Financial Liabilities Measured at Amortised CostFLHfT: Financial Liabilities Held for TradingHD Hedging derivatives
The attributable time values of liabilities owed to banks correspond to the repayment amount of the bank loan at the balance sheet date. The maximum credit risk is reflected by the book values of the financial assets and liabilities.
The following table displays the book values and the corre-sponding time values of all financial instruments included in the consolidated financial statement by class.

22 R E p O R T F I R S T H A L F Y E A R 2 013
Liabilities, which are valued at the attributable time value:
As of June 30, 2013 Level 1 Level 2 Level 3
Attributable time value of financial assets that are earnings relevant EUR m EUR m EUR m EUR m
Foreign exchange contracts – hedging 0.1 - 0.1 -
As of December 31, 2012 Level 1 Level 2 Level 3
Attributable time value of financial assets that are earnings relevant EUR m EUR m EUR m EUR m
Foreign exchange contracts – hedging 0.1 - 0.1 -
As of June 30, 2013 Level 1 Level 2 Level 3
Attributable time value of financial liabilities that are earnings relevant EUR m EUR m EUR m Mio. €
Foreign exchange contracts – hedging 0.0 - 0.0 -
As of December 31, 2012 Level 1 Level 2 Level 3
Attributable time value of financial liabilities that are earnings relevant EUR m EUR m EUR m EUR m
Foreign exchange contracts – hedging 0.0 - 0.0 -
Financial liabilities accounted for at net book value resulted in a net loss of € 2.6 million (previous year: € 1.6 million). The net losses are exclusively attributable to interest payments.
Hierarchy of attributable time valuesThe Group applies the following hierarchy for the calcu-lation and reporting of the corresponding time values of financial instruments as per valuation method: Level 1: listed (unadjusted) prices on active markets for similar assets or liabilities,
Level 2: methods, in which all input parameters which have a material impact on the calculated attributable time value, can be observed directly or indirectly, Level 3: methods, which use input parameters, which have a material impact on the calculated attributable time value and which are not based on observable market data. Assets, which are valued at the attributable time value:

R E p O R T F I R S T H A L F Y E A R 2 013 23
earnings per shareFor the calculation of the undiluted earnings per share the earnings attributable to the bearers of the common shares of the parent company are divided by the weighted average number of shares in circulation during the period under review. For the calculation of the diluted earnings per share the earnings attributable to the bearers of the common shares of the parent company are divided by the weighted average number of common shares in circulation during the period under review in addition to the weighted average number of shares resulting from the conversion of all potential common shares with dilution effect into common shares. Dilution effects were neither recorded in the period under review nor in the same period one year ago. In the period from the balance sheet date until the drawing up of the consolidated financial statements there were no additional transactions of common shares or potential common shares.
events after the Balance Sheet DateThere were no events with material impact after the completion of the quarter under review.
Shareholdings of Board members As of the balance sheet date, the members of the Executive and Supervisory Boards of the SINGULUS TECHNOLOGIES AG held the following number of shares, convertible bonds and stock options:
The following members of the Supervisory Board are shareholders of the company:
June 30, 2013 shares
Dr.-Ing. Stefan Rinck 9,619
Markus Ehret 7,000
16,619
June 30, 2013 shares
Dr.-Ing. Wolfhard Leichnitz 39,344
Furthermore, at the end of the quarter under review members of the Executive Board had themselves purchased the following number of shares of the SINGULUS TECHNOLOGIES AG:
Affirmation of the Legal Representatives“We assert to our best knowledge and belief that pursuant to the applicable accounting principles for the interim financial reporting the consolidated financial statements reflect the true situation of the asset, financial and earnings situation of the Group. The consolidated interim status report depicts the course of business including the financial results and the situation of the Group in a way reflecting the true situation and describing the material opportunities and risks of the foreseeable developments of the Group during the remainder of the business year.” Kahl am Main, August 2013 SINGULUS TECHNOLOGIES AG
The Executive Board
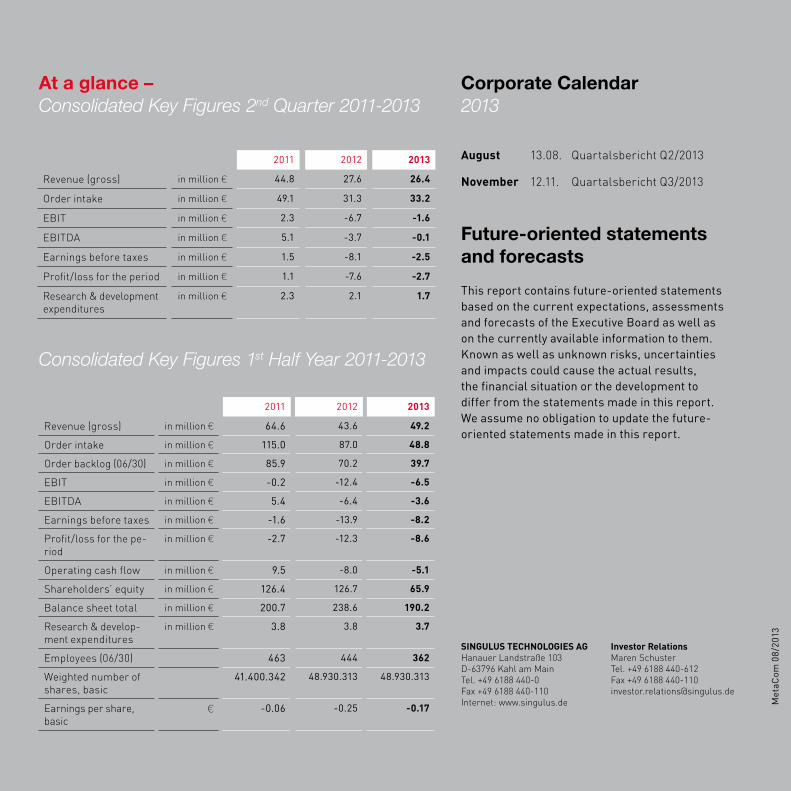
Future-oriented statementsand forecasts
This report contains future-oriented statementsbased on the current expectations, assessmentsand forecasts of the Executive Board as well ason the currently available information to them.Known as well as unknown risks, uncertaintiesand impacts could cause the actual results,the financial situation or the development todiffer from the statements made in this report.We assume no obligation to update the future- oriented statements made in this report.
Corporate Calendar2013
August 13.08. Quartalsbericht Q2/2013
November 12.11. Quartalsbericht Q3/2013
SINGULUS TECHNOLOGIES AG Hanauer Landstraße 103 D-63796 Kahl am Main Tel. +49 6188 440-0 Fax +49 6188 440-110 Internet: www.singulus.de
Investor Relations Maren Schuster Tel. +49 6188 440-612 Fax +49 6188 440-110 [email protected]
Met
aCom
08/
2013
At a glance – Consolidated Key Figures 2nd Quarter 2011-2013
Consolidated Key Figures 1st Half Year 2011-2013
2011 2012 2013
Revenue (gross) in million € 44.8 27.6 26.4
Order intake in million € 49.1 31.3 33.2
EBIT in million € 2.3 -6.7 -1.6
EBITDA in million € 5.1 -3.7 -0.1
Earnings before taxes in million € 1.5 -8.1 -2.5
Profit/loss for the period in million € 1.1 -7.6 -2.7
Research & development expenditures
in million € 2.3 2.1 1.7
2011 2012 2013
Revenue (gross) in million € 64.6 43.6 49.2
Order intake in million € 115.0 87.0 48.8
Order backlog (06/30) in million € 85.9 70.2 39.7
EBIT in million € -0.2 -12.4 -6.5
EBITDA in million € 5.4 -6.4 -3.6
Earnings before taxes in million € -1.6 -13.9 -8.2
Profit/loss for the pe-riod
in million € -2.7 -12.3 -8.6
Operating cash flow in million € 9.5 -8.0 -5.1
Shareholders’ equity in million € 126.4 126.7 65.9
Balance sheet total in million € 200.7 238.6 190.2
Research & develop-ment expenditures
in million € 3.8 3.8 3.7
Employees (06/30) 463 444 362
Weighted number ofshares, basic
41.400.342 48.930.313 48.930.313
Earnings per share, basic
€ -0.06 -0.25 -0.17
![SINGULUS TECHNOLOGIES Management Board · Management Team of SINGULUS TECHNOLOGIES. page 2 [SINGULUS newsSolar] |ISSUE 37 APRIL 2010 SINGULUS TECHNOLOGIES is pleased to invite you](https://static.fdocuments.in/doc/165x107/5b614bc07f8b9a4a488c371c/singulus-technologies-management-management-team-of-singulus-technologies-page.jpg)