Q1 2021 Financial Results
20
Q1 2021 Financial Results June 2, 2021
Transcript of Q1 2021 Financial Results

Q1 2021 Financial Results June 2, 2021

2
DISCLAIMERFORWARD-LOOKING STATEMENTS & INFORMATION
This presentation contains forward-looking statements and forward-looking information within the meaning of the
Private Securities Litigation Reform Act of 1995 applicable securities laws. The words “expected'', “estimated”,
“scheduled”, “could”, “should”, “anticipated”, “long-term”, “opportunities”, “potential”, “continue”, “likely”, “may”,
“will”, “positioned”, “possible”, “believe”, “expand” and variations of these terms and similar expressions, or the
negative of these terms or similar expressions, are intended to identify forward-looking information or statements. But
the absence of such words does not mean that a statement is not forward-looking. All statements that are not
statements of either historical or current facts, including among other things, our expected financial performance,
expectations or objectives regarding future and market charter rate expectations and, in particular, the effects of
COVID-19 on our financial condition and operations and the product tanker industry in general, are forward-looking
statements. Forward-looking information is based on the opinions, expectations and estimates of management of Pyxis
Tankers Inc. (“we”, “our” or “Pyxis”) at the date the information is made, and is based on a number of assumptions and
subject to a variety of risks and uncertainties and other factors that could cause actual events or results to differ
materially from those projected in the forward-looking information. Although we believe that the expectations and
assumptions on which such forward-looking statements and information are based are reasonable, those are not
guarantees of our future performance and you should not place undue reliance on the forward-looking statements
and information because we cannot give any assurance that they will prove to be correct. Since forward-looking
statements and information address future events and conditions, by their very nature they involve inherent risks and
uncertainties and actual results and future events could differ materially from those anticipated or implied in such
information. Factors that might cause or contribute to such discrepancy include, but are not limited to, the risk factors
described in our Annual Report on Form 20-F for the year ended December 31, 2020 and our other filings with the
Securities and Exchange Commission (the “SEC”). The forward-looking statements and information contained in this
presentation are made as of the date hereof. We do not undertake any obligation to update publicly or revise any
forward-looking statements or information, whether as a result of new information, future events or otherwise, except in
accordance with U.S. federal securities laws and other applicable securities laws.
This presentation and any oral statements made in connection with it are for informational purposes only and do not
constitute an offer to buy or sell our securities. For more complete information about us, you should read the
information in this presentation together with our filings with the SEC, which may be accessed at the SEC’s website
(http://www.sec.gov).

3
Q1 2021 SUMMARY
Disappointing operating performance
► Time charter equivalent revenues of $4.3 million* for 3 months ended March 31, 2021
►Net loss of $2.1 million, or $0.07 loss per share, basic and diluted
►Adjusted EBITDA of $0.8 million**
► Late March, completed refinancing $24 million Entrust loan secured by the Pyxis Epsilon
with Alpha Bank $17 million loan, which has an interest rate of Libor plus 3.35% and is
repayable over 5 years, plus $7.275 million in cash- 7.5% p.a. interest rate savings with
reasonable quarterly amortization
►At March 31, 2021 net funded debt/total capitalization of 31%
► Late April, signed $20 million agreement to purchase 46,652 dwt 2013 Hyundai Mipo built
MR2, delivery expected by early July 2021; funding with $13.5 Million bank loan and cash
►As of June 1st, 100% of available days for Q2, 2021 booked at avg. MR2 gross TC rate of ~
$13,330/day
Short-term challenges but positive longer-term sector fundamentals
►Depressed spot charter rates have continued, but period market slightly better
► Effects from Covid-19 continued to delay return in demand for transportation fuels, but
expanding vaccine distribution should help create compelling recovery story for the sector
► Longer-term demand fundamentals should improve with global economic rebound (IMF -
6% GDP growth returns in 2021 with 4.4% in 2022) combined with normalized refined
products inventory levels
►MR2 tanker orderbook still historically low and declining; scrapping starting to increase; net
supply growth of ~2%/yr. in 2021-22
►While second-hand MR2’s prices have increased 6%+ since January, still attractive values in
light of potential better chartering environment starting later this year
Q1 2021 Financial &
Operational
Highlights
MR2 Product Tanker
Market Update
* Time charter equivalent (“TCE”) revenues are voyage revenues less voyage related costs and commissions; please see Exhibit I – Definitions
** Please see Exhibit II – Non-GAAP Measures

4
FLEET & EMPLOYMENT OVERVIEWPOSITIONED FOR UPSIDE OPPORTUNITIES
Fle
et
De
tails
Fle
et
Em
plo
ym
en
t
Ove
rvie
w
Our mixed chartering strategy provides upside opportunities through spot trading when rates improve and
stable, visible cash flows from time charters
Current Charter
Vessel ShipyardVessel
Type
Carrying
Capacity
(dwt)
Year BuiltType of
CharterCharter
rate (1)Earliest
Redelivery Date
Pyxis Epsilon SPP / S.Korea MR 50,295 2015 Time $14,000 June 2021
Pyxis Theta(2) SPP / S.Korea MR 51,795 2013 Time $14,000 June 2021
Pyxis Malou(3) SPP / S.Korea MR 50,667 2009 Time $12,000 July 2021
Northsea Alpha (4) Kejin / China Small Tanker 8,615 2010 Spot n/a n/a
Northsea Beta (4) Kejin / China Small Tanker 8,647 2010 Spot n/a n/a
Total 170,019Avg. Age
9.7 Years
10% of the remaining days of 2021 are covered, exclusive of charters’ options
(1) These tables are as of June 1, 2021 and show gross rates and do not reflect commissions payable.
(2) Pyxis Theta is scheduled to have her intermediate survey during the third quarter of 2021 with expected off-hire of 5 days and estimated cost of $0.1 million.
(3) Pyxis Malou is fixed on a time charter for 6 months, minus 40 or plus 50 days in charter’s option, at $12,000 per day
(4) Management is pursuing sale or other long-term strategy for small tankers.
Vessel
Apr Feb Mar
Pyxis Epsilon
Pyxis Theta
Pyxis Malou
Northsea Alpha
Northsea Beta
Jan
Fixed Employment Charterers Optional Period Spot Employment Open Days Drydocking / BWTS Days
2021 2022
May June July Aug Sept Oct Nov Dec
MARKET UPDATEPRODUCT TANKER INDUSTRY

6
► Lower global commercial and personal activities combined with de-stocking of
refined product inventories has resulted in less demand for tankers and depressed
charter rates, especially in the spot market, during Q1 2021;
► Higher one-year T/C rates provide positive indicator, especially for modern Eco-
Efficient tankers; Wider Eco premium of ~$1.5K/d vs. older Standard MR due to
higher consumption of more expensive bulker fuel;
► According to a leading industry source, floating storage of clean products has
dramatically declined since May, 2020, and onshore OECD inventory levels are
near 5 year averages as refinery maintenance/turnarounds have concluded;
► As demonstrated in a large portion of North America and Western Europe,
broadening distribution of effective vaccines have proven to be critical for
potential social and economic recovery; and
► Recent positive trends in economic data regarding personal consumption and
industrial activity should further improve demand of refined petroleum products;
Easing of mobility restrictions should increase consumption of transportation fuels;
Difficult
Chartering
Conditions
Continue
MR2 PRODUCT TANKER MARKET UPDATEQ1 2021– CONTINUED CHALLENGES IN CHARTER RATES

7
► IEA (May 10th) revised 2021 estimate of global oil consumption to increase 5.4
Mb/d over 2020 due to 1H softness in Europe, OECD Americas and India but left
its overall view of 2H 2021 intact; Expected 7% rise from Q1 to reach 99.6Mb/d at
YE 2021;
► Rising U.S. refinery utilization, currently 87%, highest since March, 2020;
► Un-even economic recovery and varying inventory positions could create
arbitrage opportunities and cause spot charter rates to temporarily jump (e.g.,
Colonial Pipeline);
► Historically, seaborne trade of refined products highly correlated to global GDP
growth; the IMF revised upward its growth estimates to 6% in 2021 with a further
4.4% increase in 2022*;
► Longer-term product tanker demand further supported by increasing worldwide
refinery throughput and capacity additions, led by Middle East and Asia, leading
to ton-mile expansion, and return of growth in U.S. and Chinese petroleum
products exports; and
► IEA announced shutdowns of 1.7M b/d of refinery capacity are primarily located
in the OECD which should result in greater importing of products into many of
these mature markets.
Recovery in
Demand should be
on the Horizon
* International Monetary Fund – April, 2021
MR2 PRODUCT TANKER MARKET UPDATE - continuedRE-BUILDING DEMAND EXPECTED TO PROGRESS OVER NEAR-TERM

8
► Declining MR2 order book:
• 6.3%* of worldwide fleet or 100 vessels (down from high of 25% in 2009);
• Low new ordering continues;
• Limited capacity additions scheduled beyond 2021 as extensive construction
backlogs at Asian Shipyards for containerships and bulkers have push-out
potential new tanker deliveries slots into 2023+; and
• New ship and engine designs, rapidly escalating construction costs, stricter
environmental regulations, evolving selection of potential lower-carbon fuels
and scrubber debate further complicate new ordering by owners.
► Increasing demolition levels:
• 6.9%* of global fleet or 110 MR2 are 20 yrs old or more;
• Increasing environmental regulations, such as, ballast water treatment
upgrades, should require significant additional capital expenditures/ship and
more dry-docking days; and
• Current depressed chartering conditions, higher running costs and strong
scrap prices should further accelerate demolition – by early May, 16 MR’s
scrapped – if run rate continues, highest # of demolitions in 11 years.
► Availability of low cost bank debt continues to be challenging and further limits
new vessel ordering.
► We expect MR2 net supply growth to be ~2%/yr. in 2021-22.* Source: Drewry – March 2021, 40-54,999 dwt product tankers, excludes Jones Act vessels
Attractive Long-
Term Supply
Outlook
MR2 PRODUCT TANKER MARKET UPDATE - continuedPOSITIVE VESSEL SUPPLY OUTLOOK

9
MR2 PRODUCT TANKER MARKET UPDATE - continuedATTRACTIVE ENTRY POINT FOR VESSEL ACQUISITION
*Ship Broker indications
**Source: Drewry – March 2021, excludes Jones Act vessels, period 2011- Feb 2021
***Tier III vessel, exclusive of higher specifications, yard supervision costs and spares, no scrubber
Positive Long-
term Industry
Fundamentals
& Reasonable
Vessel Values
Offer
Attractive Entry
Point
Type ($ million) May 2021 *
Historical
Average ** Difference
New Build (delivery 1H ’23) *** $35.8 $34.8 3%
5 yr. Old 27.5 26.4 4%
10 yr. Old 18.4 17.4 6%

PYXIS TANKERSFINANCIAL SUMMARY – Q1 2021

11
UNAUDITED FINANCIAL HIGHLIGHTSTHREE MONTHS ENDED MARCH 31, 2020 & 2021
Three Months ended
March 31,
2020* 2021
Revenues, net ($000s) $6,635 $5,242
Voyage related costs & commissions (1,682) (961)
Time charter equivalent revenues ** $4,953 $4,281
Time / spot charter revenue mix 55% / 45% 66% / 34%
Total operating days 416 394
Daily time charter equivalent rate $11,917 $10,865
Fleet Utilization 1 91.4% 87.6%
* *Subject to rounding; Please see Exhibit I –Definitions
Lower TCE
Revenues due to
Poor Chartering
Environment
in Q1 2021
* Pyxis Delta, 2006 built MR, was sold on January 13, 2020, and has been excluded from the calculations for the three months ended March
31, 2020 (the vessel had been under TC employment for approximately 2 days in January when it was re-delivered from charterers in order
to be sold).

12
Three Months ended
March 31,
2020 2021
In ‘000 USD except per share data
Revenues, net $6,635 $5,242
Expenses:
Voyage related costs and commissions (1,682) (961)
Vessel operating expenses (2,728) (2,508)
General and administrative expenses (564) (642)
Management fees, related parties (181) (149)
Management fees, other (238) (194)
Amortization of special survey costs (49) (101)
Depreciation (1,095) (1,091)
Gain from the sale of vessel, net 7 -
Operating income / (loss) 105 (404)
Other expenses:
Gain from financial derivative instrument 3 -
Loss from debt extinguishment - (458)
Interest and finance costs, net (1,318) (1,141)
Net loss ($1,210) ($2,003)
Dividend Series A Convertible Preferred Stock - (85)
Net loss attributable to commons shareholders ($1,210) ($2,088)
Loss per share (basic & diluted) ($0.06) ($0.07)
Adjusted EBITDA* $1,242 $788
UNAUDITED INCOME STATEMENTTHREE MONTHS ENDED MARCH 31, 2020 & 2021
* Please see Exhibit II – Non-GAAP Measures
Lower TCE
Revenues &
Loss from Loan
Refi Impacted
Q1 2021
Bottom Line

13
(amounts in $, except Utilization %)Three Months Ended
March 31,
2020 2021
Eco-Efficient MR2: (2 of our vessels)
Average TCE * 15,676 13,679
Opex * 5,915 6,324
Utilization % 97.3% 100.0%
Eco-Modified MR2: (1 of our vessels)
TCE 14,875 10,856
Opex 6,664 6,660
Utilization % 100.0% 100.0%
Small Tankers: (2 of our vessels)Average TCE 5,603 6,785
Opex 4,962 4,278
Utilization % 81.3% 68.9%
Fleet: (5 of our vessels) **
TCE 11,917 10,865
Opex 5,683 5,573
Utilization % 91.4% 87.6%
RECENT DAILY FLEET DATATHREE MONTHS ENDED MARCH 31, 2020 & 2021
* Please see Exhibit I – Definitions
** Pyxis Delta, a standard MR, was sold on January 13, 2020 and has been excluded from the calculations for the period ended March 31, 2020
Tough
Chartering
Environment,
but Overall
Opex
Remained
Stable &
Consistent in
Q1 2021
14
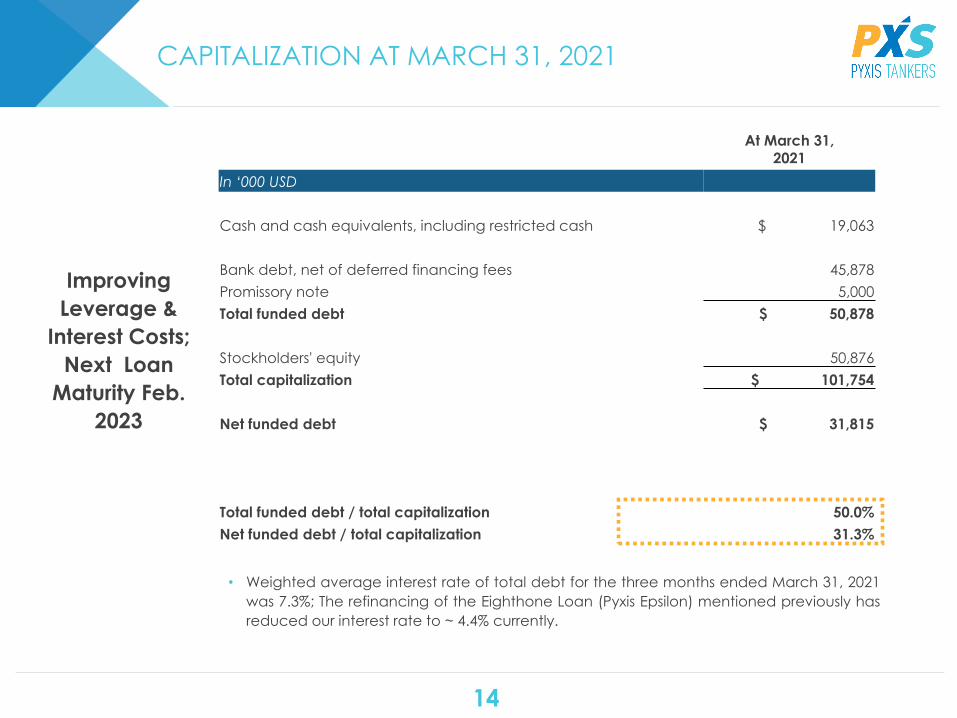
CAPITALIZATION AT MARCH 31, 2021
• Weighted average interest rate of total debt for the three months ended March 31, 2021
was 7.3%; The refinancing of the Eighthone Loan (Pyxis Epsilon) mentioned previously has
reduced our interest rate to ~ 4.4% currently.
Improving
Leverage &
Interest Costs;
Next Loan
Maturity Feb.
2023
At March 31,
2021
In ‘000 USD
Cash and cash equivalents, including restricted cash $ 19,063
Bank debt, net of deferred financing fees 45,878
Promissory note 5,000
Total funded debt $ 50,878
Stockholders' equity 50,876
Total capitalization $ 101,754
Net funded debt $ 31,815
Total funded debt / total capitalization 50.0%
Net funded debt / total capitalization 31.3%

15
COMPANYEMERGING GROWTH - PURE PLAY PRODUCT TANKER COMPANY
► Focus on modern medium range (“MR”) product tankers with “eco” features
►Modern tanker fleet of five IMO-certified vessels - weighted average age of 9.0 years
►Management pursuing a sale or other long-term strategy relating to small tankers
►2013 built MR acquisition expected to join fleet by July, 2021
Growth Oriented
with Attractive,
Modern Fleet
► Long-standing relationships with first-class customers worldwide
►All MRs currently fixed under short-term, staggered TC’s; small tankers in spot market
►100% of available days in Q2 2021 booked with average MR rate ~$13.3K/day
►Positioned to capitalize when charter rates improve
Reputable Customer
Base & Diversified
Chartering Strategy
►Disciplined, substantially fixed cost structure creates opportunity for greater earnings power
when rates improve
►Competitive daily operating costs to peer group
► Improved capitalization and liquidity with long-lived debt
Competitive Cost
Structure & Good
Capitalization
► Strong mgmt. team with ~100 years of combined industry and capital markets experience
► Founder/CEO has proven track record and is a major shareholder
►Board members consist of respected industry figures with significant experience
Experienced,
Incentivized
Management
& Prominent Board
►Expected slowdown in net supply growth in 2021-22 of ~2%/yr
►Relatively low and declining MR2 orderbook stands at ~6.3%*
► Increased scrapping expected – 6.9%* of worldwide MR2 fleet 20 years old or more
►Potential global economic recovery from Covid-19 vaccinations could lead to sustainable
period of better charter rates starting Fall, 2021
Favorable Industry
Fundamentals
Create Attractive
Entry Point
* Source: Drewry, March 2021

DEFINITIONSEXHIBIT I

17
EXHIBIT I | DEFINITIONS
Earnings before interest, taxes, depreciation and amortization (“EBITDA”) represents the sum of net income / (loss), interest and finance costs,
depreciation and amortization and, if any, income taxes during a period. Adjusted EBITDA represents EBITDA before certain non-operating or
non-recurring charges, such as, vessel impairment charges, gain from debt extinguishment, gain /(loss) on sale of vessel and stock
compensation. EBITDA and Adjusted EBITDA are not recognized measurements under U.S. GAAP. EBITDA and Adjusted EBITDA are presented as
we believe that they provide investors with means of evaluating and understanding how our management evaluates operating performance.
These non-GAAP measures should not be considered in isolation from, as substitutes for, or superior to financial measures prepared in
accordance with U.S. GAAP. In addition, these non-GAAP measures do not have standardized meanings, and are therefore, unlikely to be
comparable to similar measures presented by other companies. EBITDA and Adjusted EBITDA do not reflect cash requirements for capital
expenditures or debt service, nor changes in working capital.
Daily time charter equivalent (“TCE”) rate is a standard shipping industry performance measure of the average daily revenue performance of a
vessel on a per voyage basis. TCE is not calculated in accordance with U.S. GAAP. We utilize TCE because we believe it is a meaningful
measure to compare period-to-period changes in our performance despite changes in the mix of charter types (i.e., spot charters, time
charters and bareboat charters) under which our vessels may be employed between the periods. Our management also utilizes TCE to assist
them in making decisions regarding employment of the vessels. We calculate TCE by dividing revenues, net after deducting voyage related
costs and commissions by operating days for the relevant period. Voyage related costs and commissions primarily consist of brokerage
commissions, port, canal and fuel costs that are unique to a particular voyage, which would otherwise be paid by the charterer under a time
charter contract.
Vessel operating expenses (“Opex”) per day are our vessel operating expenses for a vessel, which primarily consist of crew wages and related
costs, insurance, lube oils, communications, spares and consumables, tonnage taxes as well as repairs and maintenance, divided by the
ownership days in the applicable period.
We define total daily operational costs as vessel Opex, technical and commercial management fees plus allocable general and administrative
expenses, applied on a daily basis, typically in comparison of our eco-efficient and eco-modified MR’s. These costs can vary period to period
by fleet composition, vessel delivery, operating structure, management organization and dry-dockings.
We calculate fleet utilization (“Utilization”) by dividing the number of operating days during a period by the number of available days during
the same period. We use fleet utilization to measure our efficiency in finding suitable employment for our vessels and minimizing the amount of
days that our vessels are off-hire for reasons other than scheduled repairs or repairs under guarantee, vessel upgrades, special surveys and
intermediate dry-dockings or vessel positioning. Ownership days are the total number of days in a period during which we owned each of the
vessels in our fleet. Ownership days are an indicator of the size of our fleet over a period and affect both the amount of revenues generated
and the amount of expenses incurred during the respective period. Available days are the number of ownership days in a period, less the
aggregate number of days that our vessels were off-hire due to scheduled repairs or repairs under guarantee, vessel upgrades or special
surveys and intermediate dry-dockings and the aggregate number of days that we spent positioning our vessels during the respective period
for such repairs, upgrades and surveys. Available days measures the aggregate number of days in a period during which vessels should be
capable of generating revenues. Operating days are the number of available days in a period, less the aggregate number of days that our
vessels were off-hire or out of service due to any reason, including technical breakdowns and unforeseen circumstances. Operating days
measures the aggregate number of days in a period during which vessels actually generate revenues.

NON-GAAP MEASURESEXHIBIT II

19
EXHIBIT II | NON-GAAP MEASURES
(in thousands of U.S. Dollars)
Three Months Ended
March 31,
2020 2021
Reconciliation of Net loss to Adjusted EBITDA
Net loss $ (1,210) $ (2,003)
Depreciation 1,095 1,091
Amortization of special survey costs 49 101
Interest and finance costs, net 1,318 1,141
EBITDA $ 1,252 $ 330
Loss from debt extinguishment - 458
Gain from financial derivative instrument (3) -
Gain from the sale of vessel, net (7) -
Adjusted EBITDA $ 1,242 $ 788

20
CONTACT
Pyxis Tankers Inc.
K.Karamanli 59
Maroussi 15125, Greece
Email: [email protected]
www.pyxistankers.com
Henry Williams
CFO & Treasurer
Phone: +1 516 455 0106/ +30 210 638 0200
Email: [email protected]