Deutsche Telekom Q1 2021 results
33
Deutsche Telekom Q1 2021 results
Transcript of Deutsche Telekom Q1 2021 results

Deutsche TelekomQ1 2021 results

This presentation contains forward-looking statements that reflect the current views of Deutsche Telekom management with respect to future events. These forward-looking statements include statements with regard to the expected development of revenue, earnings, profits from operations, depreciation and amortization, cash flows and personnel-related measures. You should consider them with caution. Such statements are subject to risks and uncertainties, most of which are difficult to predict and are generally beyond Deutsche Telekom’s control. Among the factors that might influence our ability to achieve our objectives are the progress of our workforce reduction initiative and other cost-saving measures, and the impact of other significant strategic, labor or business initiatives, including acquisitions, dispositions and business combinations, and our network upgrade and expansion initiatives. In addition, stronger than expected competition, technological change, legal proceedings and regulatory developments, among other factors, may have a material adverse effect on our costs and revenue development. Further, the economic downturn in our markets, and changes in interest and currency exchange rates, may also have an impact on our business development and the availability of financing on favorable conditions. Changes to our expect-ations concerning future cash flows may lead to impairment write downs of assets carried at historical cost, which may materially affect our results at the group and operating segment levels.
If these or other risks and uncertainties materialize, or if the assumptions underlying any of these statements prove incorrect, our actual performance may materially differ from the performance expressed or implied by forward-looking statements. We can offer no assurance that our estimates or expectations will be achieved. Without prejudice to existing obligations under capital market law, we do not assume any obligation to update forward-looking statements to take new information or future events into account or otherwise.
In addition to figures prepared in accordance with IFRS, Deutsche Telekom also presents alternative performance measures, including, among others, EBITDA, EBITDA margin, adjusted EBITDA, adjusted EBITDA after leases, adjusted EBITDA margin, adjusted EBIT, adjusted net income, free cash flow, free cash flow after leases, gross debt, net debt after leases and net debt. These alternative performance measures should be considered in addition to, but not as a substitute for, the information prepared in accordance with IFRS. Alternative performance measures are not subject to IFRS or any other generally accepted accounting principles. Other companies may define these terms in different ways.
Disclaimer
2

Q1 2021 resultssector leading growth
T-Mobile
• Strong growth with customers and EBITDA. FY guidance raised
• 40 MHz of C-band spectrum acquired
• Sprint integration ahead of plan and synergy guidance raised
• Analyst Day lays out FCF and buyback targets
Ex US
• 4.6% adj. EBITDA AL growth, FY guidance raised
• Progress with 5G and FTTH
• New wholesale agreements approved by BNetzA
Group
• Organic total service revenue growth 2.4%
• Performance better than anticipated. Guidance raised across the board
• Climate ambitions raised
• 60 cents dividend for 2020 paid (in April)
3
Adj. EBITDA AL (Organic growth) Q1 2021 Reported growthAdj. EBITDA AL1
€ mn
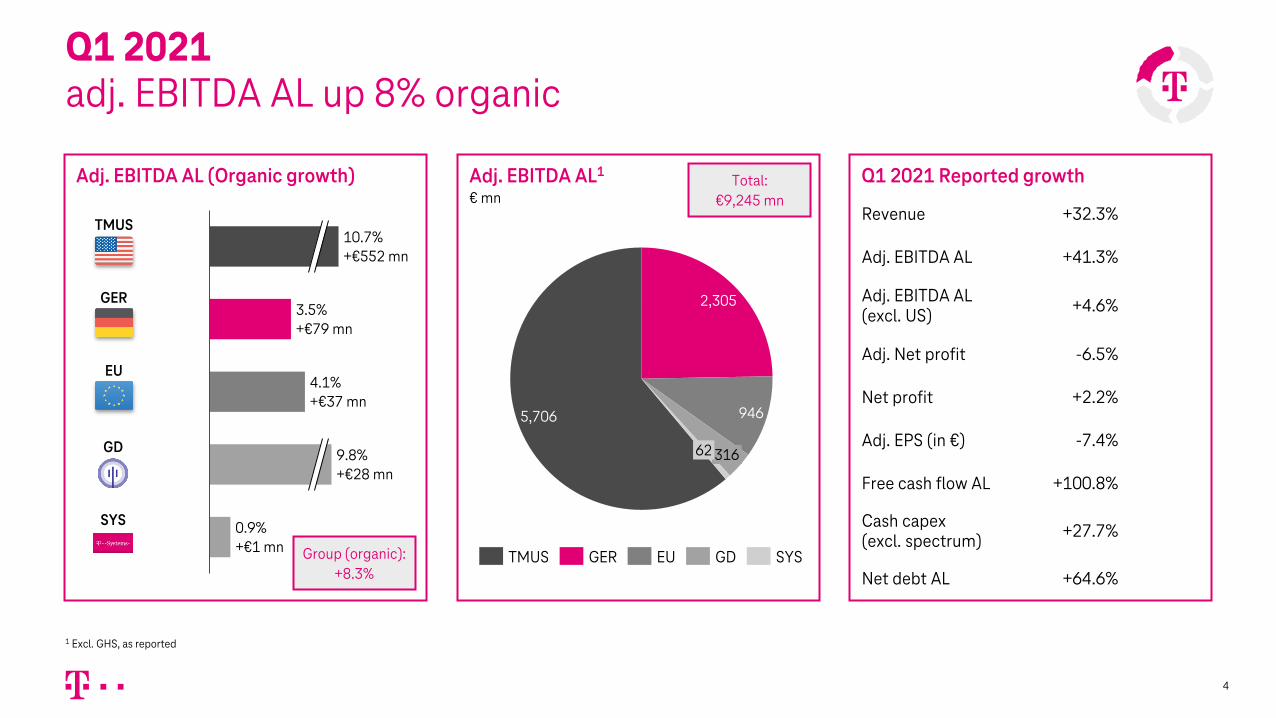
Q1 2021adj. EBITDA AL up 8% organic
4
Revenue +32.3%
Adj. EBITDA AL +41.3%
Adj. EBITDA AL (excl. US) +4.6%
Adj. Net profit -6.5%
Net profit +2.2%
Adj. EPS (in €) -7.4%
Free cash flow AL +100.8%
Cash capex (excl. spectrum) +27.7%
Net debt AL +64.6%
2,305
5,706 946
31662
10.7%+€552 mn
3.5%+€79 mn
4.1%+€37 mn
9.8%+€28 mn
0.9%+€1 mn
GER
TMUS
EU
SYS
GD
TMUS SYSGER EU GDGroup (organic): +8.3%
Total: €9,245 mn
1 Excl. GHS, as reported

Fiber networksFiber homes1
mn
Networksleading with 5G, FTTH on track
5
1 EU8: FTTC, FTTH/B lines and cable/ED3. GER: FTTC and FTTH/B lines 2 Extended range on 600 MHz, Ultra capacity on 2.5 GHz
36.3
13.7
35.9
Q1/21Q4/20
14.049.6 50.3
+0.7
FTTH (1Gbps)Fiber homesmn
Q1/21
5.6
2.2
Q4/20
6.1
2.3
7.8 8.4
+0.6
EU GER
5G TM USExtended range2
mn POPs280 295
Q4/20 Q1/21
+15
5G ex USGermany% of POPs
6780
Q4/20 Q1/21
+13
5G TM USUltra capacity 5G2
mn POPs
106140
Q4/20 Q1/21
+34
GER
• YE target raised to > 90% of population
EU
• 5G coverage at 19%
• NL: “Umlaut” network test shows T-Mobile’s 5G network has best coverage in all categories (urban, rural, road, rail)
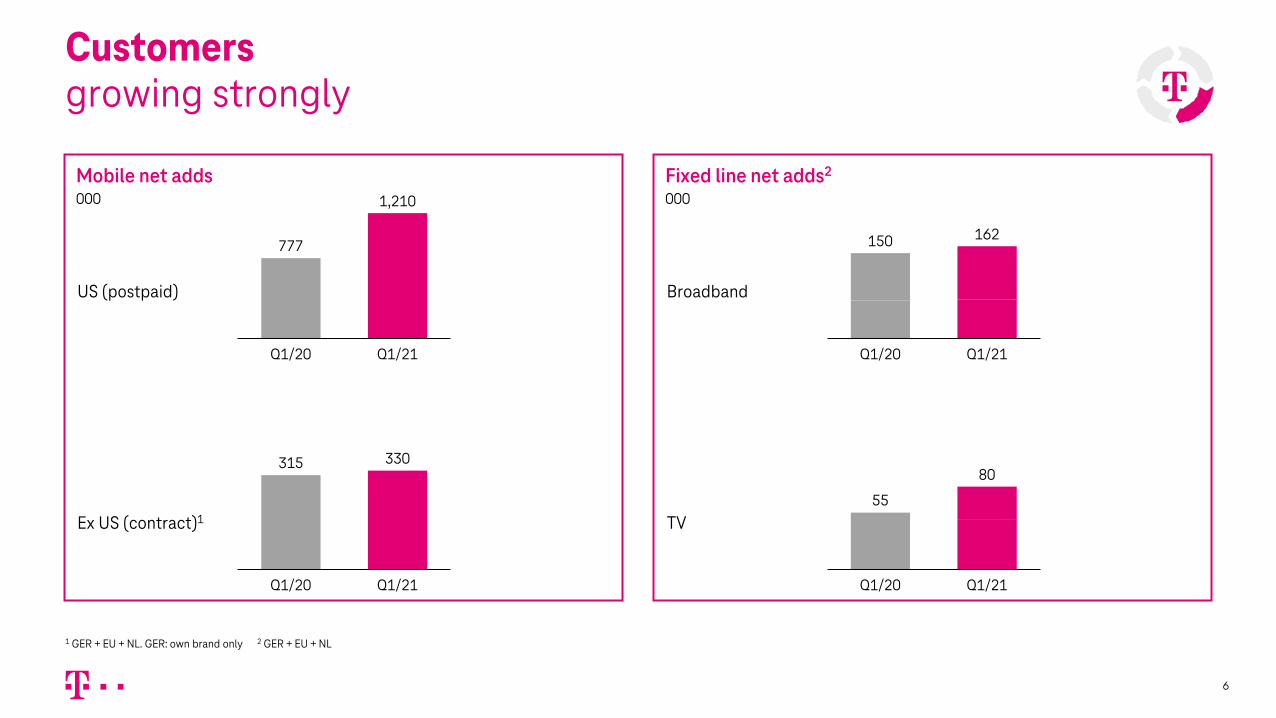
Mobile net adds000
Customersgrowing strongly
6
777
1,210
Q1/20 Q1/21
US (postpaid)
315 330
Q1/20 Q1/21
Ex US (contract)1
Fixed line net adds2
000
Q1/21Q1/20
150 162
55 32
Q1/20 Q1/21
80
Broadband
TV
1 GER + EU + NL. GER: own brand only 2 GER + EU + NL
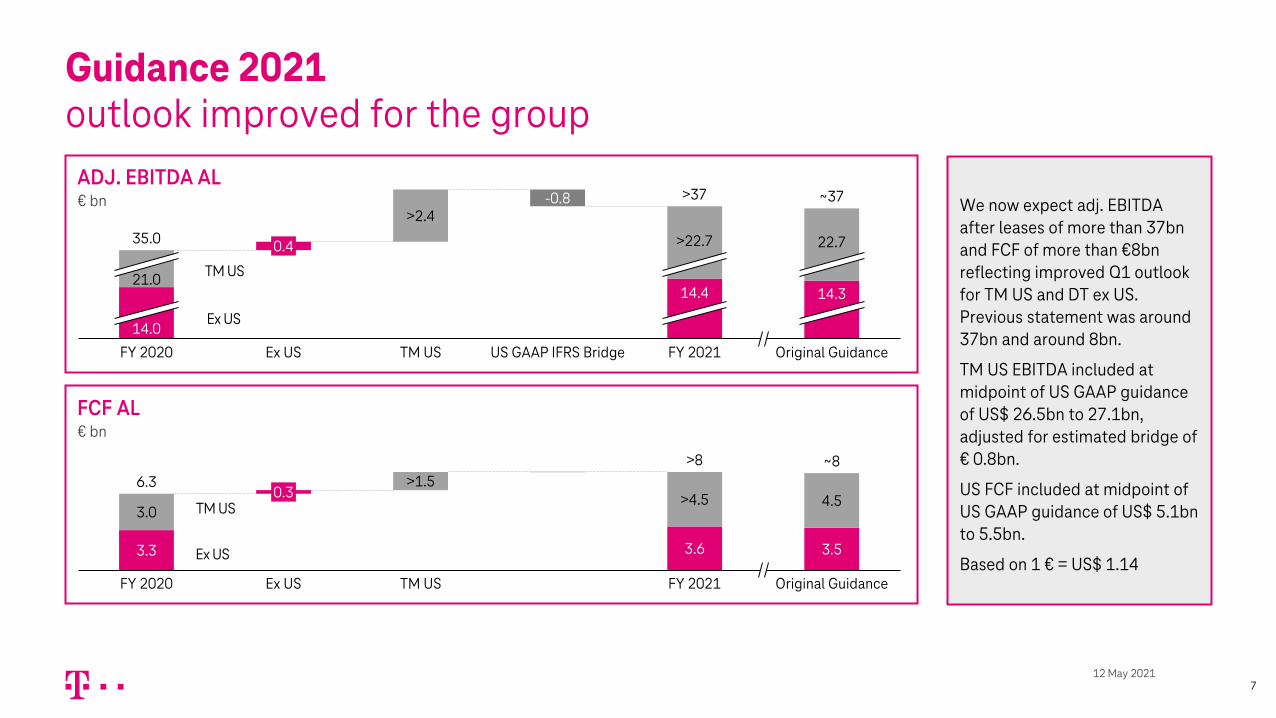
FCF AL€ bn
ADJ. EBITDA AL € bn >37-0.8
>2.4
Original Guidance
14.4
Ex US
0.4
~37
35.0
14.3
FY 2020 US GAAP IFRS Bridge
22.7>22.7
FY 2021
14.0
21.0
TM US
3.3
>4.53.0
Ex USFY 2020
0.3
Original Guidance
>1.5
TM US
3.6
FY 2021
4.5
3.5
6.3>8 ~8
Guidance 2021 outlook improved for the group
7
We now expect adj. EBITDA after leases of more than 37bn and FCF of more than €8bn reflecting improved Q1 outlook for TM US and DT ex US. Previous statement was around 37bn and around 8bn.
TM US EBITDA included at midpoint of US GAAP guidance of US$ 26.5bn to 27.1bn, adjusted for estimated bridge of € 0.8bn.
US FCF included at midpoint of US GAAP guidance of US$ 5.1bn to 5.5bn.
Based on 1 € = US$ 1.14
Ex US
TM US
Ex US
TM US
12 May 2021

Review Q1 2021
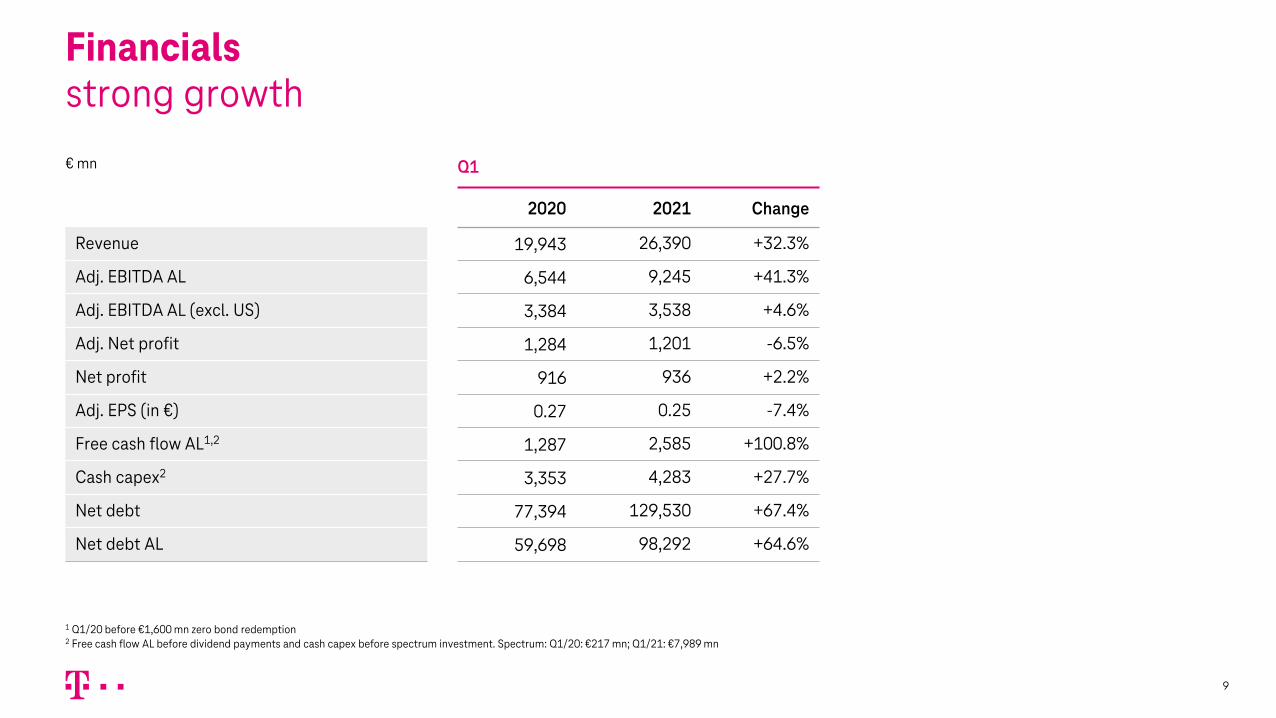
Financialsstrong growth
9
€ mn Q1
2020 2021 Change
Revenue 19,943 26,390 +32.3%
Adj. EBITDA AL 6,544 9,245 +41.3%
Adj. EBITDA AL (excl. US) 3,384 3,538 +4.6%
Adj. Net profit 1,284 1,201 -6.5%
Net profit 916 936 +2.2%
Adj. EPS (in €) 0.27 0.25 -7.4%
Free cash flow AL1,2 1,287 2,585 +100.8%
Cash capex2 3,353 4,283 +27.7%
Net debt 77,394 129,530 +67.4%
Net debt AL 59,698 98,292 +64.6%
1 Q1/20 before €1,600 mn zero bond redemption2 Free cash flow AL before dividend payments and cash capex before spectrum investment. Spectrum: Q1/20: €217 mn; Q1/21: €7,989 mn
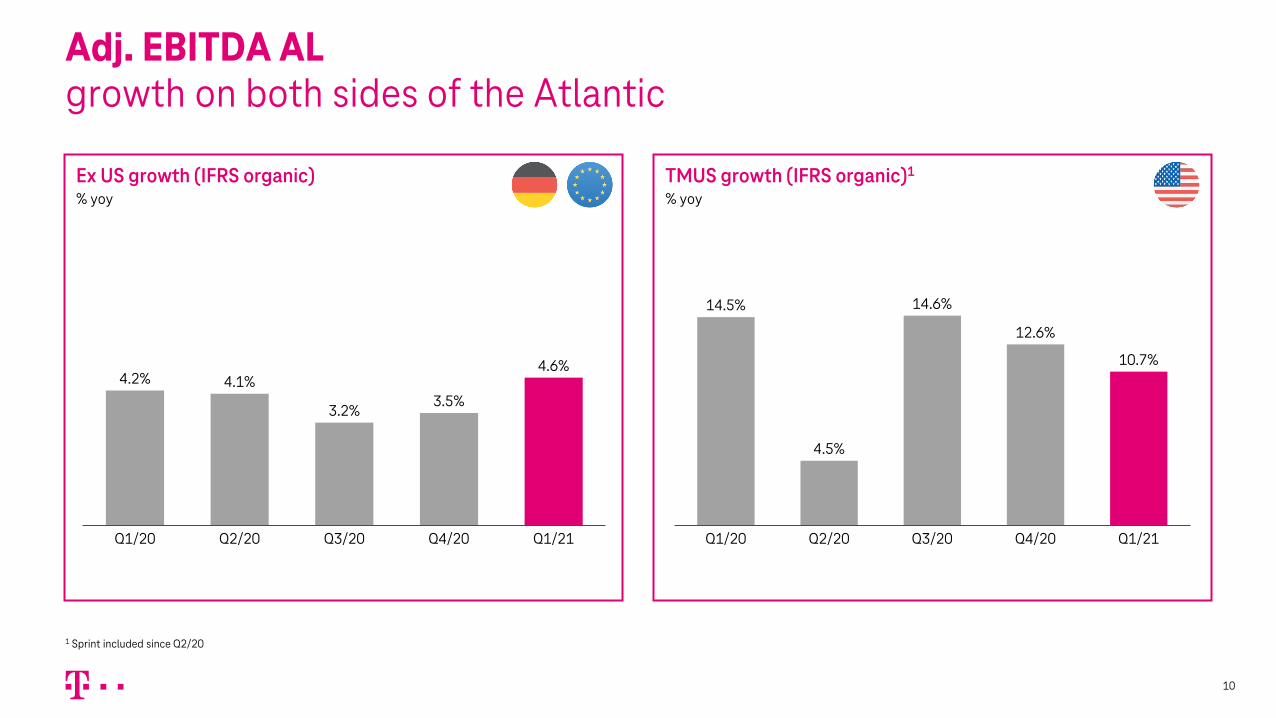
Adj. EBITDA ALgrowth on both sides of the Atlantic
10
TMUS growth (IFRS organic)1
% yoyEx US growth (IFRS organic)% yoy
Q1/20
3.2%
Q2/20
4.1%
Q1/21Q3/20 Q4/20
4.2%3.5%
4.6%
4.5%
Q3/20Q1/20 Q1/21Q2/20 Q4/20
14.6%14.5%
12.6%
10.7%
1 Sprint included since Q2/20

Germany18th consecutive quarter of EBITDA growth
11
Adj. EBITDA AL (as reported)€ mn
Revenues (as reported)€ mn
Adj. EBITDA AL growth (organic)1
% yoyRevenue growth (organic)1
% yoy
Q1/21Q1/20
2,230 2,305
+3.4%
Q3/20Q1/20 Q4/20Q2/20 Q1/21
0.7%
-1.1%
0.6% 0.6%
2.9%
Q1/21Q3/20
2.2%
Q1/20 Q2/20
1.3%
Q4/20
2.0%1.1%
3.5%
5,9425,830
Q1/21Q1/20
+1.9%
1 2021 quarterly trends in new reporting structure. Organic view reflects transfer of certain business units into GHS as of 01.01.2021, currency and the accounting change to certain principal agent transactions. Impact -54 mn Revenue and -4 mn on adj. EBITDA AL
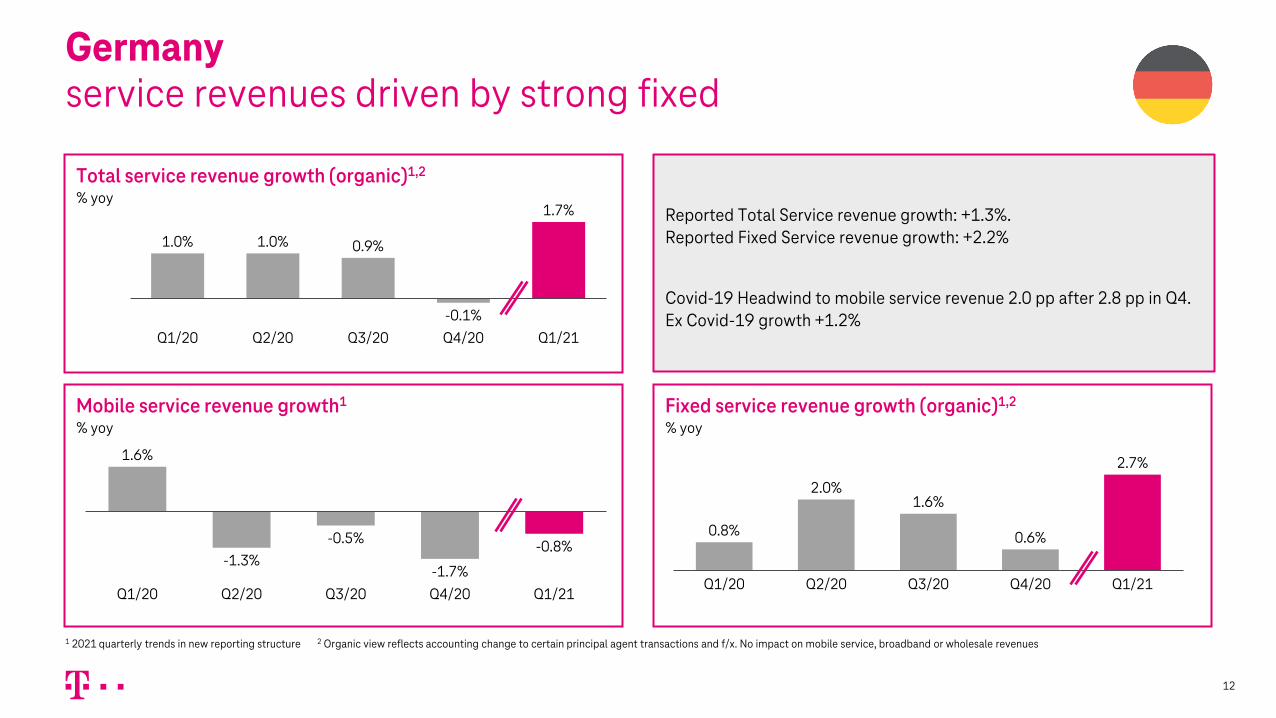
Germanyservice revenues driven by strong fixed
12
Total service revenue growth (organic)1,2
% yoy
Q2/20
1.0%
Q1/21Q1/20
1.0%
Q3/20 Q4/20
0.9%
-0.1%
1.7%
Mobile service revenue growth1
% yoyFixed service revenue growth (organic)1,2
% yoy
-1.3%
1.6%
Q1/20 Q2/20 Q3/20 Q4/20 Q1/21
-0.5%
-1.7%
-0.8%
Q4/20 Q1/21Q1/20 Q2/20 Q3/20
0.8%
2.0%1.6%
0.6%
2.7%
Reported Total Service revenue growth: +1.3%. Reported Fixed Service revenue growth: +2.2%
Covid-19 Headwind to mobile service revenue 2.0 pp after 2.8 pp in Q4. Ex Covid-19 growth +1.2%
1 2021 quarterly trends in new reporting structure 2 Organic view reflects accounting change to certain principal agent transactions and f/x. No impact on mobile service, broadband or wholesale revenues
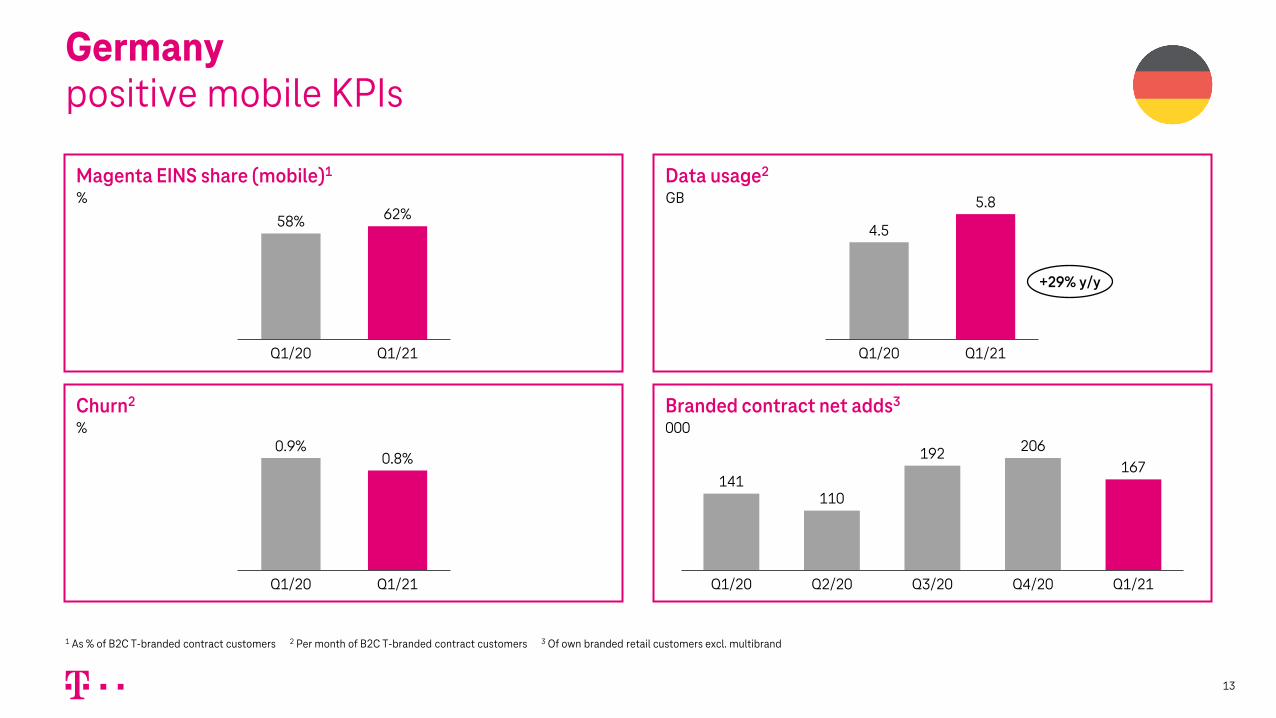
Data usage2
GBMagenta EINS share (mobile)1
%
Branded contract net adds3
000Churn2
%
Germanypositive mobile KPIs
13
Q1/20 Q1/21
4.5
5.858% 62%
Q1/21Q1/20
Q1/20
0.9%
Q1/21
0.8%
141110
192 206167
Q1/21Q1/20 Q2/20 Q3/20 Q4/20
+29% y/y
1 As % of B2C T-branded contract customers 2 Per month of B2C T-branded contract customers 3 Of own branded retail customers excl. multibrand
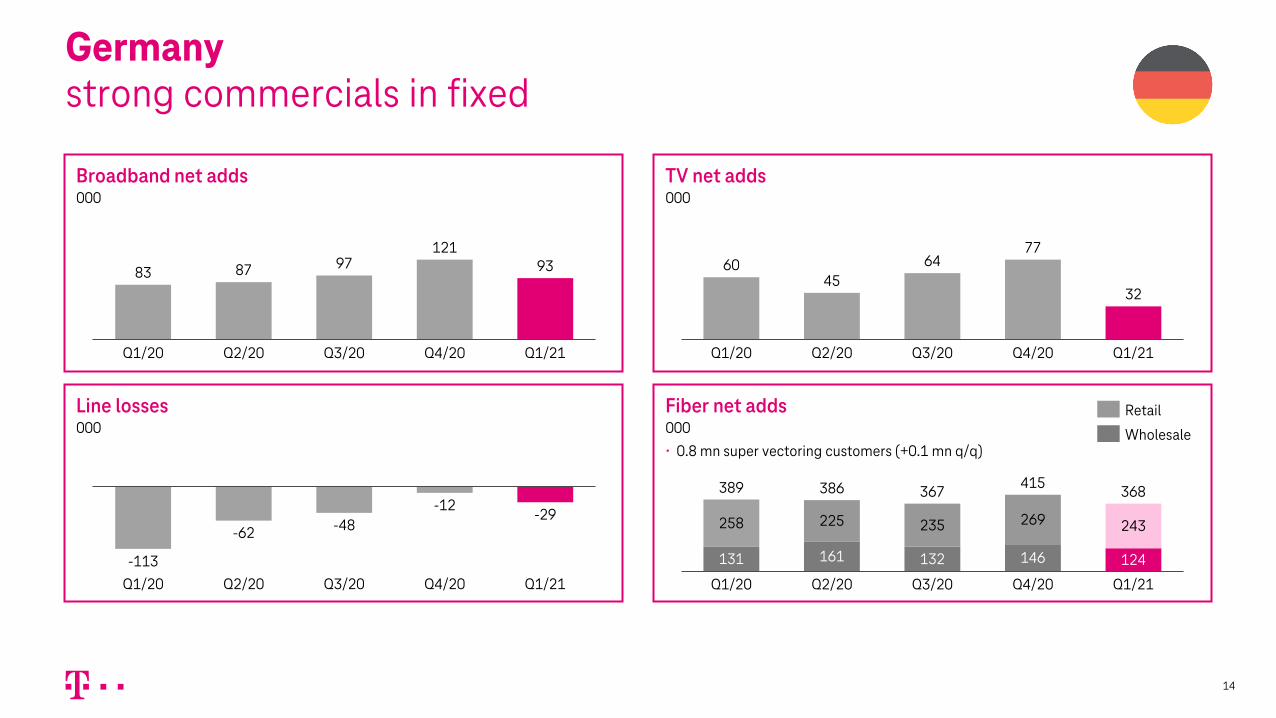
TV net adds000
Broadband net adds000
Fiber net adds000
• 0.8 mn super vectoring customers (+0.1 mn q/q)
Line losses000
Germanystrong commercials in fixed
14
131 161 132 146 124
258 225 235 269 243
Q1/20
415367
Q2/20
386
Q3/20
389
Q4/20 Q1/21
368
-113
-62 -48-12
-29
Q1/21Q4/20Q1/20 Q2/20 Q3/20
83 87 97121
93
Q4/20Q3/20Q1/20 Q2/20 Q1/21
6045
6477
32
Q1/20 Q2/20 Q3/20 Q4/20 Q1/21
Retail
Wholesale
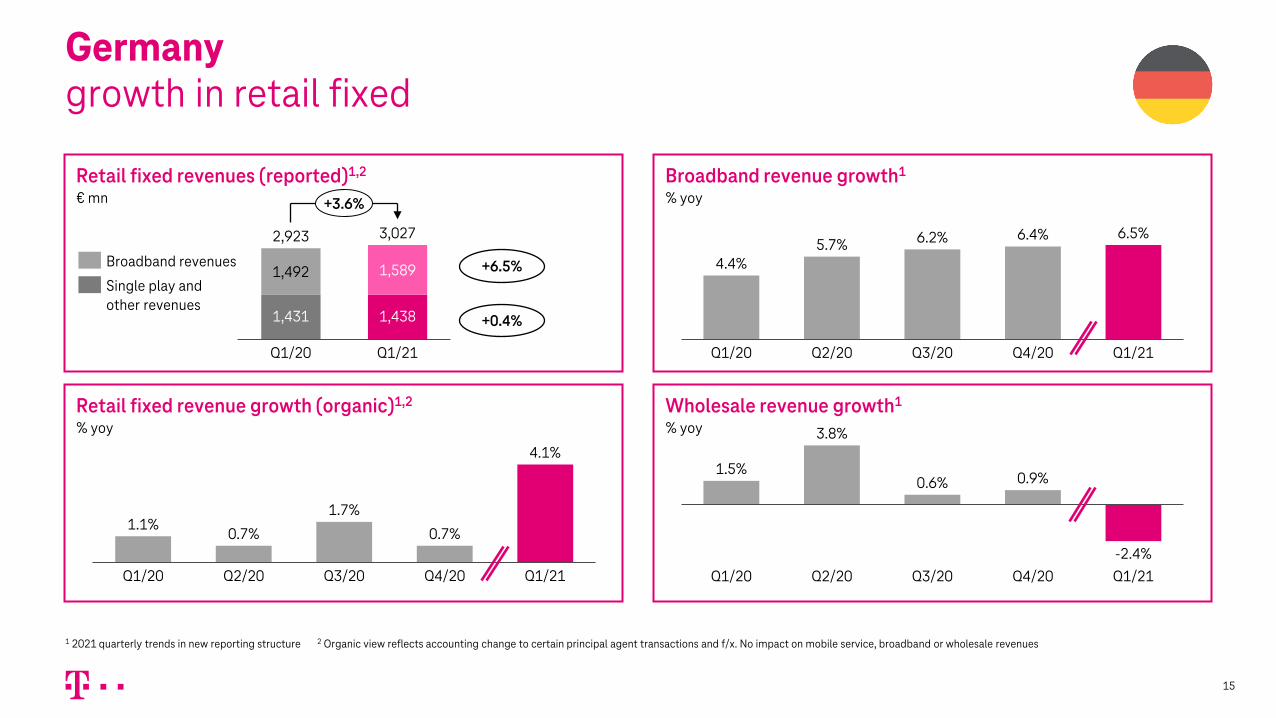
Broadband revenue growth1
% yoyRetail fixed revenues (reported)1,2
€ mn
Wholesale revenue growth1
% yoyRetail fixed revenue growth (organic)1,2
% yoy
Germanygrowth in retail fixed
15
1,431
1,492
Q1/21Q1/20
1,589
1,438
2,923 3,027
+3.6%
4.4%
Q4/20Q1/20
6.2%
Q2/20 Q3/20 Q1/21
5.7%6.4% 6.5%
3.8%
1.5%
Q1/21Q2/20Q1/20 Q3/20
0.6%
Q4/20
0.9%
-2.4%Q2/20 Q1/21Q1/20 Q3/20
0.7%
Q4/20
1.1%1.7%
0.7%
4.1%
+6.5%
+0.4%
Single play andother revenues
Broadband revenues
1 2021 quarterly trends in new reporting structure 2 Organic view reflects accounting change to certain principal agent transactions and f/x. No impact on mobile service, broadband or wholesale revenues

New “Commitment” model1
€ per month
16
Old “Kontingent” model1
€ per month
16.6
250 Mbps
13.3
11.850 Mbps
18.1100 Mbps
18.6 23.4 16.0
50 Mbps 12.0
14.0
500 Mbps
100 Mbps
1 Gbps
250 Mbps
15.7
17.7
19.7
• 10-year commitments (plus 3- year extension)
• Layer2 bitstream no longer (ex ante) price-regulated
• FTTH charges agreed; clear more-for-more logic
• FTTH wholesale premium agreed for rural areas
• Recurring bitstream charges increased
• 50 & 100 Mbps effectively billed tariffs lower in 2021/22 and higher from 2023
• 250 Mbps effectively billed tariffs to remain slightly below 2020 level
• Large percentage of wholesale revenues assured
Germanynew fiber commitment model
recurring fee
upfront payment
1 Calculatory fees for Layer2 bitstream access incl. upfront investment (as calculated by the BNetzA)
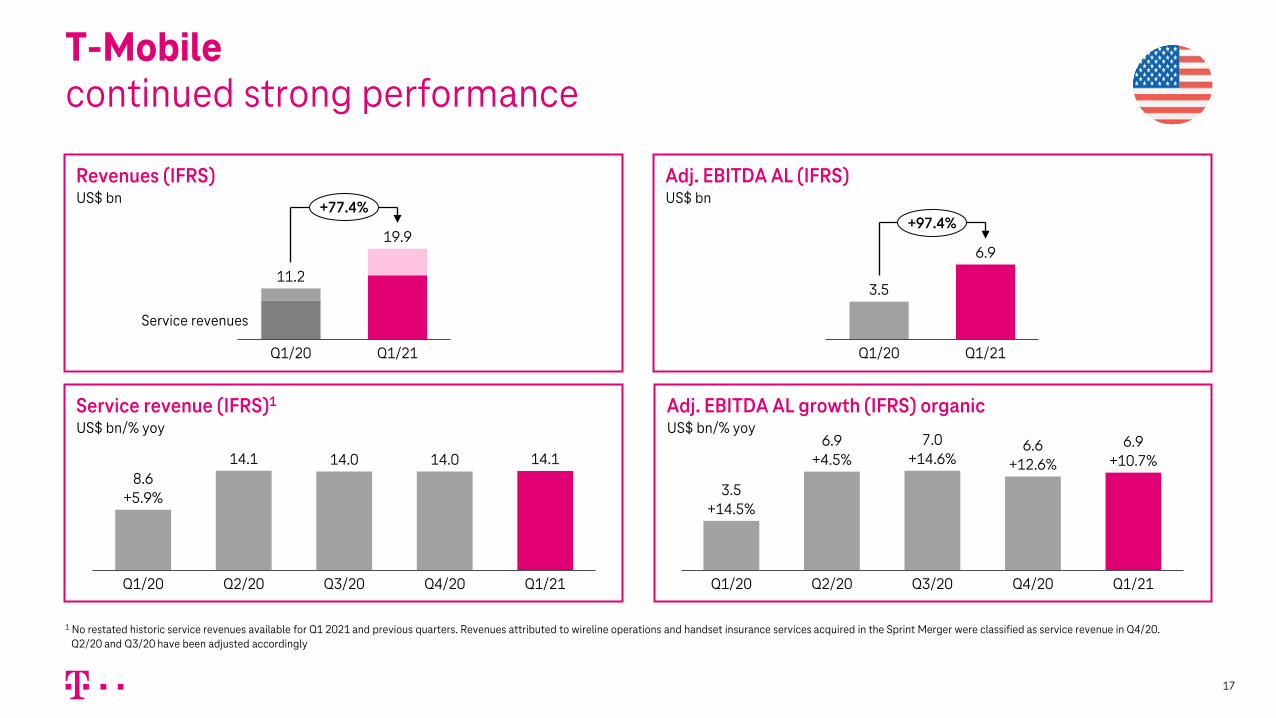
Adj. EBITDA AL (IFRS)US$ bn
Revenues (IFRS)US$ bn
Adj. EBITDA AL growth (IFRS) organicUS$ bn/% yoy
Service revenue (IFRS)1
US$ bn/% yoy
T-Mobilecontinued strong performance
17
Q1/21Q1/20
3.5
6.9
+97.4%
11.2
Q1/21Q1/20
Service revenues
19.9
+77.4%
7.0+14.6%
6.9+4.5%
Q1/20
3.5+14.5%
Q1/21
6.9+10.7%
Q2/20 Q3/20 Q4/20
6.6+12.6%14.1 14.0 14.1
Q2/20Q1/20
8.6+5.9%
14.0
Q3/20 Q1/21Q4/20
1 No restated historic service revenues available for Q1 2021 and previous quarters. Revenues attributed to wireline operations and handset insurance services acquired in the Sprint Merger were classified as service revenue in Q4/20. Q2/20 and Q3/20 have been adjusted accordingly
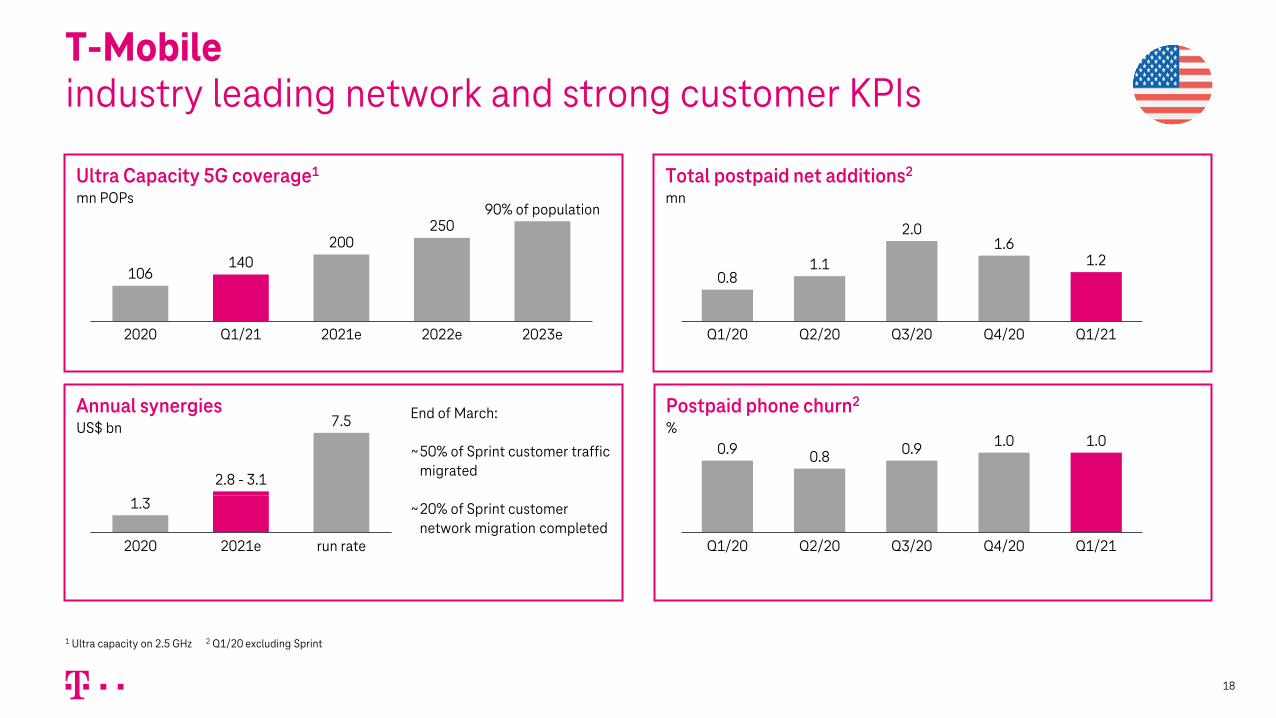
T-Mobileindustry leading network and strong customer KPIs
18
Total postpaid net additions2
mn
Q4/20Q3/20Q1/20 Q1/21Q2/20
0.81.1
2.01.6
1.2
Postpaid phone churn2
%
Q1/20 Q2/20
0.9
Q3/20 Q1/21Q4/20
0.9 0.81.0 1.0
1 Ultra capacity on 2.5 GHz 2 Q1/20 excluding Sprint
5G EXTENDED RANGE 5G ULTRA CAPACITYUltra Capacity 5G coverage1
mn POPs
106140
200250
2023e
90% of population
2020 Q1/21 2021e 2022e
Annual synergiesUS$ bn
2020 2021e run rate
1.3
2.8 - 3.1
7.5 End of March:
~50% of Sprint customer traffic migrated
~20% of Sprint customer network migration completed
Adj. EBITDA AL€ mn
Revenues€ mn
Adj. EBITDA AL growth (organic)% yoy
Revenue growth (organic)% yoy
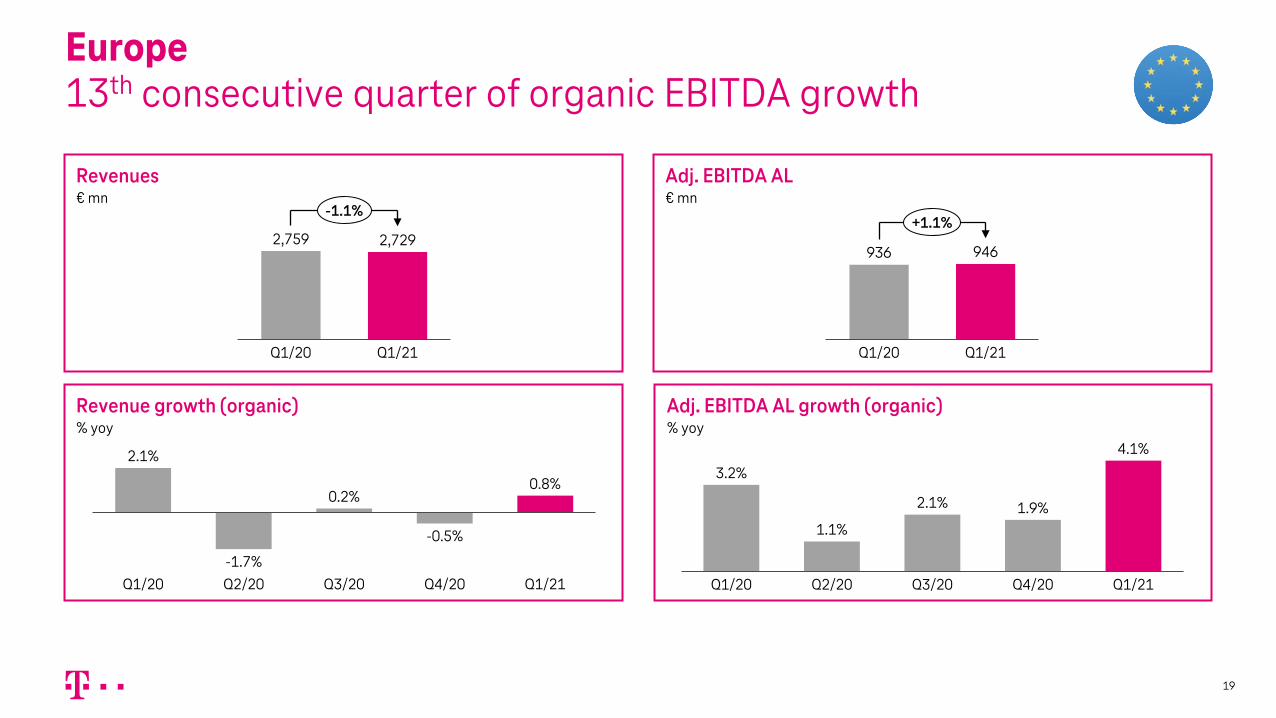
Europe13th consecutive quarter of organic EBITDA growth
19
Q1/21Q1/20
2,7292,759
-1.1%
936 946
Q1/20 Q1/21
+1.1%
Q1/20 Q2/20
2.1%
Q3/20 Q4/20
0.2%
Q1/21-1.7%
-0.5%
0.8%
1.9%1.1%
Q1/20 Q2/20
2.1%
3.2%
Q3/20 Q1/21Q4/20
4.1%

Broadband net adds2
000Mobile contract net adds1
000
TV net adds000
FMC net adds000
Europestrong net adds in all categories
20
-5
20 26
71
48
Q1/20 Q4/20Q2/20 Q3/20 Q1/21
5368 59
87
58
Q1/203 Q1/21Q2/20 Q3/20 Q4/20
197234
258 248
191
Q1/20 Q2/20 Q3/20 Q1/21Q4/20
108
164212 216
151
Q1/21Q4/20Q3/20Q1/20 Q2/20
1 M2M customers have been re-allocated to prepay as of Q1/20. Historic figures have been adjusted 2 Definition alignment in Q1/21. Historic numbers are adjusted 3 Organic view. Excludes 15k subs acquired in the Czech Republic

Adj. EBITDA AL€ mn
Order entry (LTM) € bn
Revenue growth (organic)1
% yoyAdj. EBITDA AL growth (organic)1
% yoy
Revenues€ mn
T-Systemsprofitability stabilized
21
Q1/20 Q1/21
4.64.6
+0.3%
Q1/20 Q1/21
1,062 1,015
-4.4%
60 62
Q1/20 Q1/21
+3.3%
-10.2%Q1/20 Q3/20Q2/20 Q4/20 Q1/21
0.9%
-2.9%-6.1%
-3.1%
Q1/20 Q3/20 Q4/20Q2/20 Q1/21
95.2%
-16.2%-11.9% -11.3%
0.9%
Growth in Public Cloud offset by decline in mature businesses.
EBITDA AL outlook for 2021 stable.
1 2021 quarterly trends in new reporting structure

Adj. EBITDA AL€ mn
Revenues€ mn
Adj. EBITDA AL growth (organic)% yoy
Revenue growth (organic)% yoy
Group Developmentongoing strong performance
22
247 282
476 513
Q1/21-13-15
Q1/20
GD Towers
NL
Other
708 782
+10.5%
145 169
136 151
Others
GD Towers-12
Q1/21Q1/20
-4
NL269 316
+17.5%
3.8%
Q1/20
2.1%
Q2/20 Q3/20 Q1/21Q4/20
4.8%
0.9%
5.0%
Q1/21Q4/20Q1/20 Q2/20 Q3/20
5.5%
13.2%
5.6%
1.6%
9.8%
Mobile service revenue growth (organic)% yoy
Contract net adds000
Adj. EBITDA AL growth (organic)% yoy
Broadband net adds000
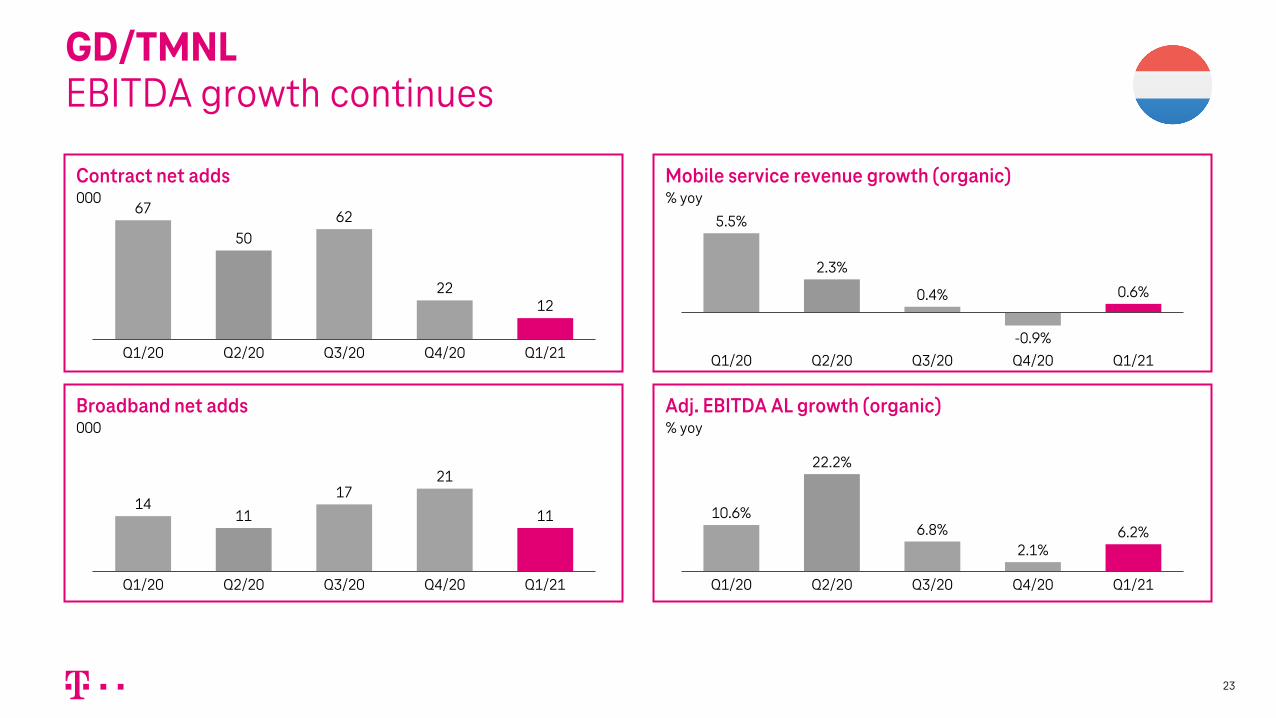
GD/TMNLEBITDA growth continues
23
67
5062
2212
Q4/20Q3/20Q2/20Q1/20 Q1/21
Q1/20 Q3/20
22.2%
Q2/20 Q4/20
10.6%6.8%
2.1%
Q1/21
6.2%
Q4/20Q3/20
2.3%
Q1/21Q1/20 Q2/20-0.9%
5.5%
0.4% 0.6%
1411
1721
11
Q1/21Q1/20 Q2/20 Q3/20 Q4/20
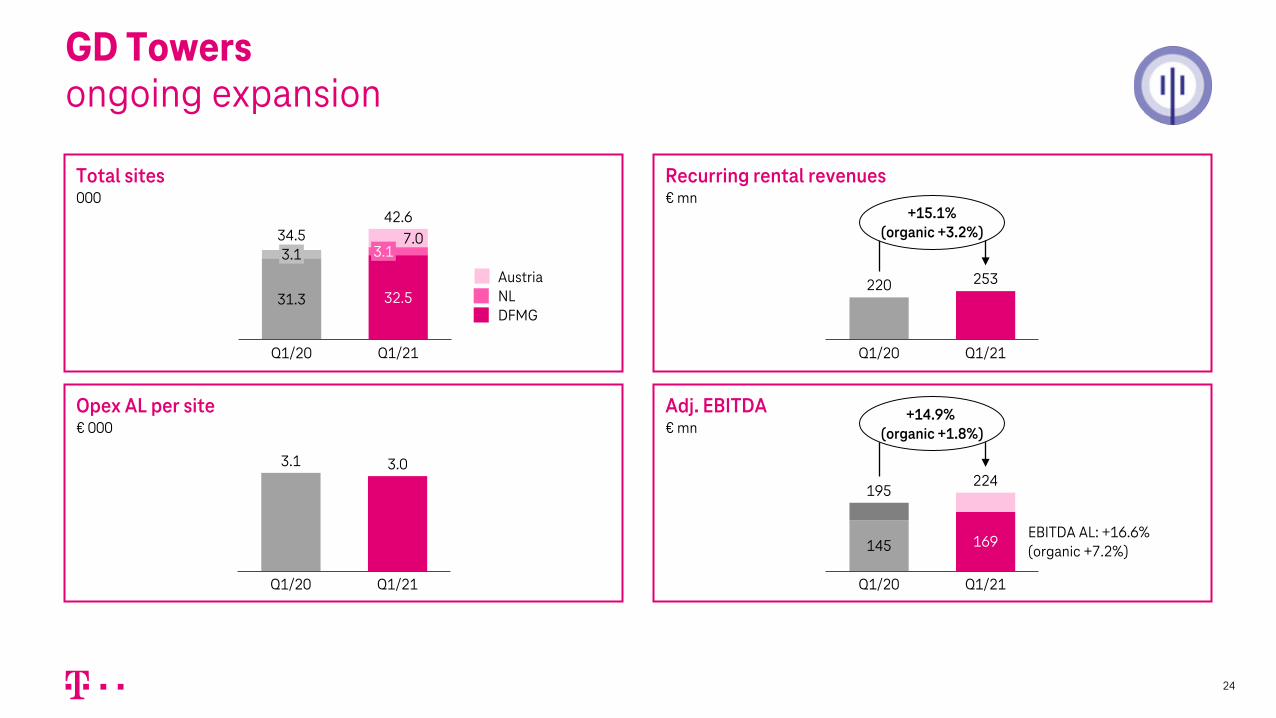
Recurring rental revenues€ mn
Total sites000
Adj. EBITDA € mn
Opex AL per site€ 000
GD Towersongoing expansion
24
7.042.6
3.1
31.3
Q1/20
34.5
32.5
3.1
Q1/21
220 253
Q1/20 Q1/21
+15.1%(organic +3.2%)
145 169
195
Q1/21Q1/20
EBITDA AL: +16.6% (organic +7.2%)
224
+14.9%(organic +1.8%)
Q1/20 Q1/21
3.1 3.0
AustriaNLDFMG
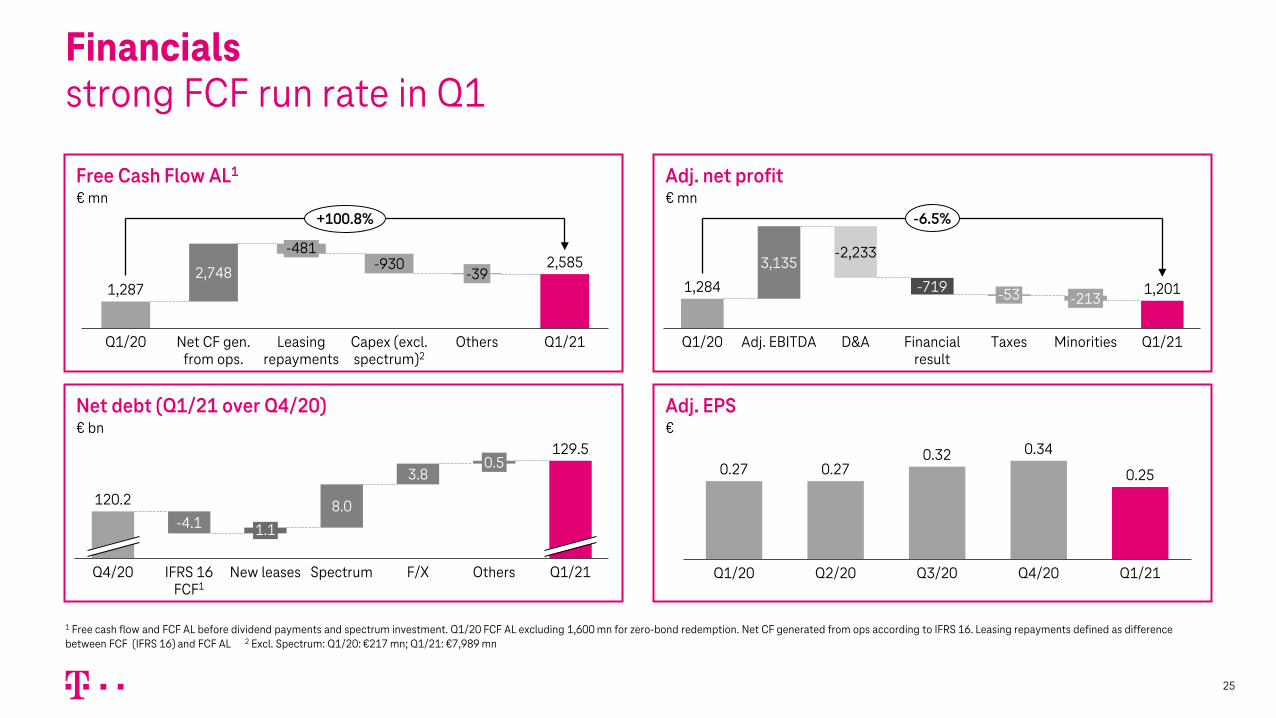
Adj. net profit€ mn
Free Cash Flow AL1
€ mn
Adj. EPS€
Net debt (Q1/21 over Q4/20)€ bn
Financialsstrong FCF run rate in Q1
25
0.27
Q2/20Q1/20
0.320.25
Q1/21Q3/20 Q4/20
0.270.34
Leasing repayments
Net CF gen. from ops.
Q1/20
2,748
Capex (excl. spectrum)2
-481-930
-39
Others Q1/21
1,287
2,585
+100.8%
3,135
Q1/20
-213
Adj. EBITDA Financial result
-2,233
1,201-719
Q1/21D&A
-53
MinoritiesTaxes
1,284
-6.5%
Q4/20
129.5
-4.1
0.5
IFRS 16 FCF1
1.1
New leases
120.2 8.0
Spectrum
3.8
F/X Others Q1/21
1 Free cash flow and FCF AL before dividend payments and spectrum investment. Q1/20 FCF AL excluding 1,600 mn for zero-bond redemption. Net CF generated from ops according to IFRS 16. Leasing repayments defined as difference between FCF (IFRS 16) and FCF AL 2 Excl. Spectrum: Q1/20: €217 mn; Q1/21: €7,989 mn
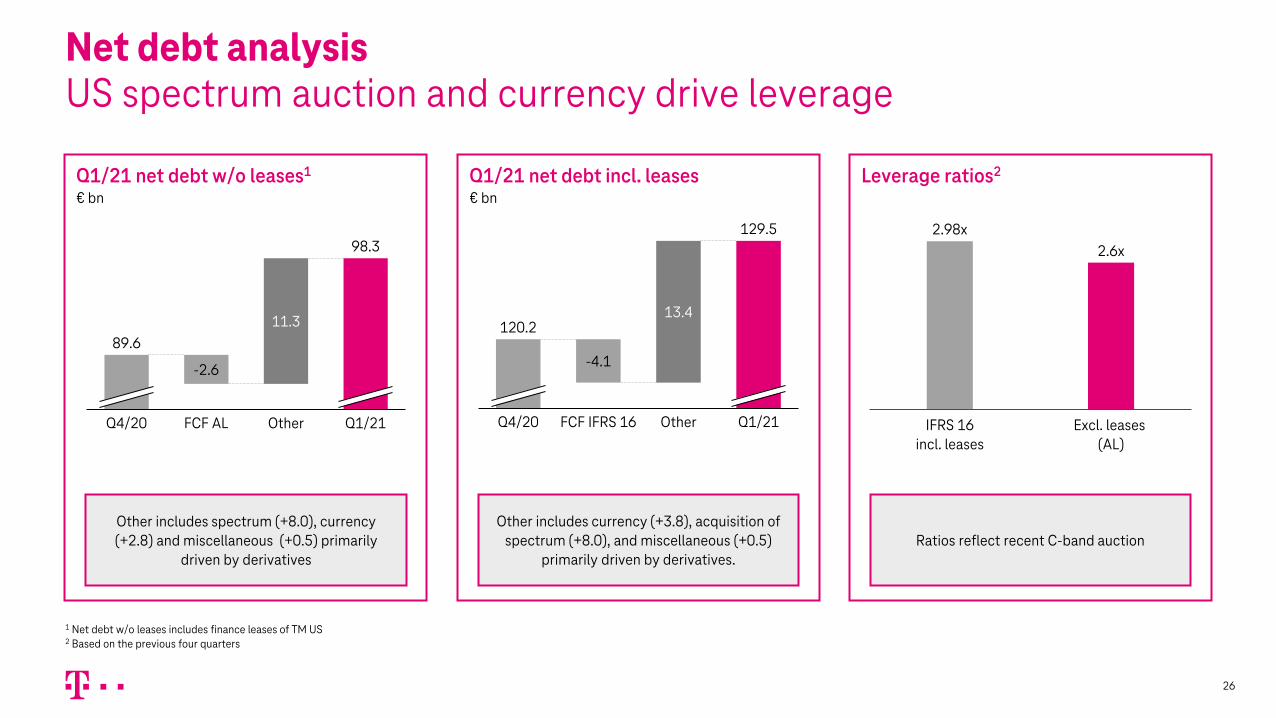
Q1/21 net debt w/o leases1
€ bn
FCF ALQ4/20
-2.6
11.3
Other Q1/21
89.6
98.3
Net debt analysisUS spectrum auction and currency drive leverage
26
Leverage ratios2
2.6x2.98x
IFRS 16incl. leases
Excl. leases (AL)
Ratios reflect recent C-band auction
Q1/21 net debt incl. leases€ bn
13.4
-4.1
Q4/20 FCF IFRS 16 Other Q1/21
120.2
129.5
Other includes currency (+3.8), acquisition of spectrum (+8.0), and miscellaneous (+0.5)
primarily driven by derivatives.
Other includes spectrum (+8.0), currency (+2.8) and miscellaneous (+0.5) primarily
driven by derivatives
1 Net debt w/o leases includes finance leases of TM US 2 Based on the previous four quarters
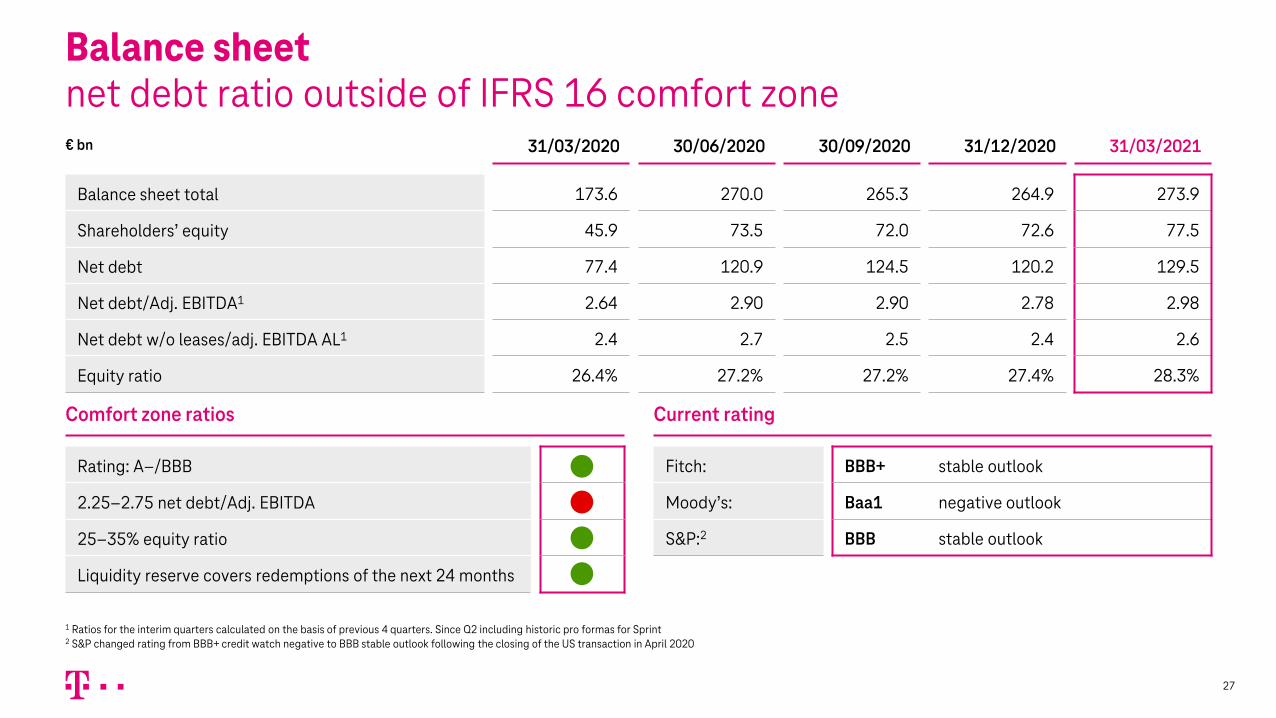
Balance sheet net debt ratio outside of IFRS 16 comfort zone
27
€ bn 31/03/2020 30/06/2020 30/09/2020 31/12/2020 31/03/2021
Balance sheet total 173.6 270.0 265.3 264.9 273.9
Shareholders’ equity 45.9 73.5 72.0 72.6 77.5
Net debt 77.4 120.9 124.5 120.2 129.5
Net debt/Adj. EBITDA1 2.64 2.90 2.90 2.78 2.98
Net debt w/o leases/adj. EBITDA AL1 2.4 2.7 2.5 2.4 2.6
Equity ratio 26.4% 27.2% 27.2% 27.4% 28.3%
Comfort zone ratios
Rating: A–/BBB
2.25–2.75 net debt/Adj. EBITDA
25–35% equity ratio
Liquidity reserve covers redemptions of the next 24 months
Current rating
Fitch: BBB+ stable outlook
Moody’s: Baa1 negative outlook
S&P:2 BBB stable outlook
1 Ratios for the interim quarters calculated on the basis of previous 4 quarters. Since Q2 including historic pro formas for Sprint 2 S&P changed rating from BBB+ credit watch negative to BBB stable outlook following the closing of the US transaction in April 2020

Appendix

FCF AL excl. US
€ bn FY 2020 Q1 2020 Q1 2021
Adj. EBITDA AL 14.0 3.4 3.5
Cash Capex -7.7 -1.9 -1.7
Proceeds from sale of fixed assets +0.2 +0.1 +0.0
Special Factors Cash -1.4 -0.4 -0.4
Interest ex leasing -0.6 -0.1 -0.2
Cash Taxes -0.6 -0.1 -0.2
Other (working capital etc.) -0.4 -0.4 +0.4
FCF AL 3.3 0.6 1.4
29

Outlook 2021/22 as per annual report 2020 (1/2)1
€ bn 2020 pro forma 2021e 2022e
Revenue Group 106.7 Slight increase Stable
Germany 23.6 Slight increase Slight increase
US (in USD) 76.4 Slight increase Stable
Europe 11.3 Stable Stable
Systems Solutions 4.2 Slight decrease Stable
Group Development 3.0 Slight increase Increase
Service Revs Group 83.3 Increase Increase
US (in USD) 55.4 Increase Increase
Adj. EBITDA AL Group 37.6 37.0 Increase
Germany 9.2 9.4 Increase
US (in USD) 26.8 25.8 Increase
Europe 3.9 3.9 Slight increase
Systems Solutions 0.3 0.3 Slight increase
Group Development 1.2 1.2 Increase
301) See annual report 2020 for additional details
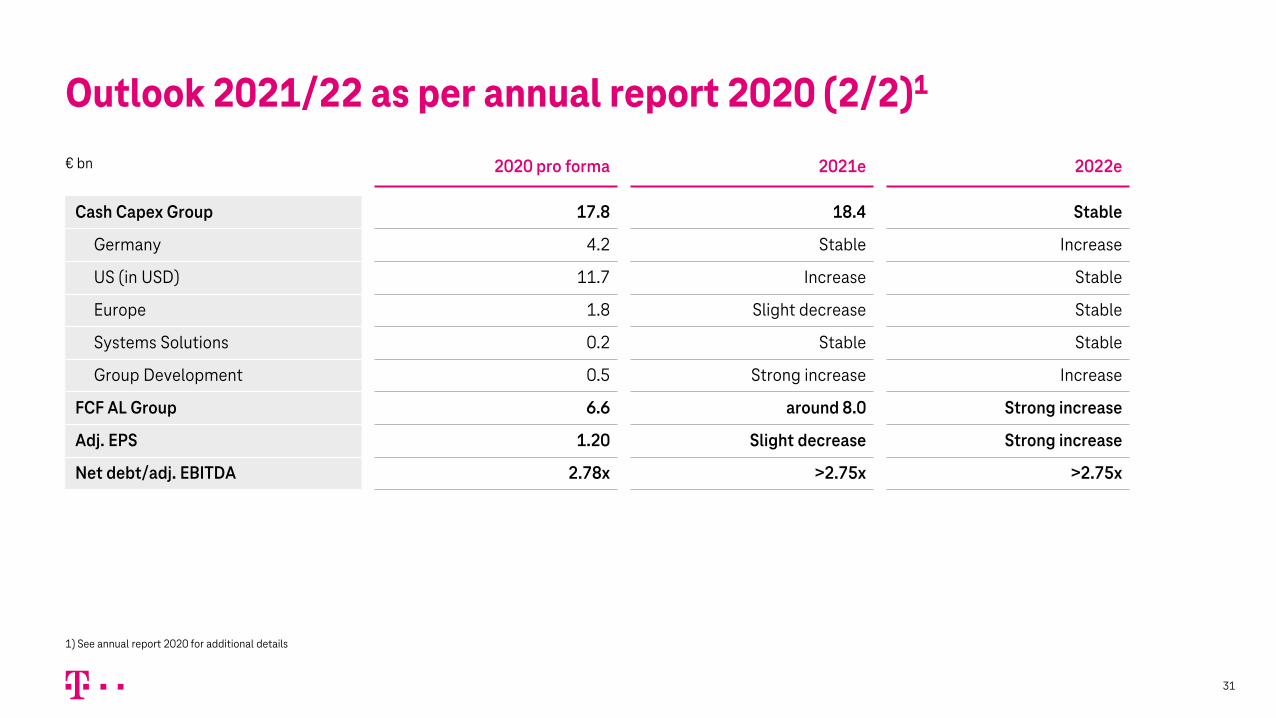
Outlook 2021/22 as per annual report 2020 (2/2)1
€ bn 2020 pro forma 2021e 2022e
Cash Capex Group 17.8 18.4 Stable
Germany 4.2 Stable Increase
US (in USD) 11.7 Increase Stable
Europe 1.8 Slight decrease Stable
Systems Solutions 0.2 Stable Stable
Group Development 0.5 Strong increase Increase
FCF AL Group 6.6 around 8.0 Strong increase
Adj. EPS 1.20 Slight decrease Strong increase
Net debt/adj. EBITDA 2.78x >2.75x >2.75x
31
1) See annual report 2020 for additional details

The conference call will be held on May 12 at 2:00 PM CET, 1:00 PM GMT, 8 AM ET.DT Participants: Christian Illek (CFO), Hannes Wittig (Head of IR)
32
Conference call with Q&A session
• The link to the webcast will be provided 20 minutes before the call starts: https://www.telekom.com/21Q1
• To ask a question, just type your question into the box below the stream
• We webcast in HD Voice Quality• The recording will be uploaded to YouTube after the call
DE 0800 5889185 code 1265248#
UK 0808 2380676 code 1265248#
US +1 866 2201433 code 1265248#
Other +49 69 22222624 code 1265248#
++++
Webcast Dial-in
NEW: to participate in the dial-in conference please register via the following link:
https://registration Q1 2021 resultsDTAG
Investor Relations Contact details
Further questions please contact the IR department
33
Phone +49 228 181 – 8 88 80
www.telekom.com/investors www.twitter.com/DT_IR
E-Mail [email protected] Contact details for all IR representatives:
Follow us on @DT_IR
www.telekom.com/ircontacts
IR YouTube ChannelIR Webpage IR Twitter Account
http://www.telekom.com/youtube_ir