
Analyst Meeting Q1/2021 Operating Results
39
World’s Greenergy Icon Evolving the world through the greener ways 1 Analyst Meeting Q1/2021 Operating Results 19 May 2021 Ticker: BCPG (SET)
Transcript of Analyst Meeting Q1/2021 Operating Results
World’s Greenergy IconEvolving the world through the greener ways 11
Analyst MeetingQ1/2021 Operating Results19 May 2021Ticker: BCPG (SET)

Source :https://www.miningweekly.com

Source :https://www.miningweekly.com

5
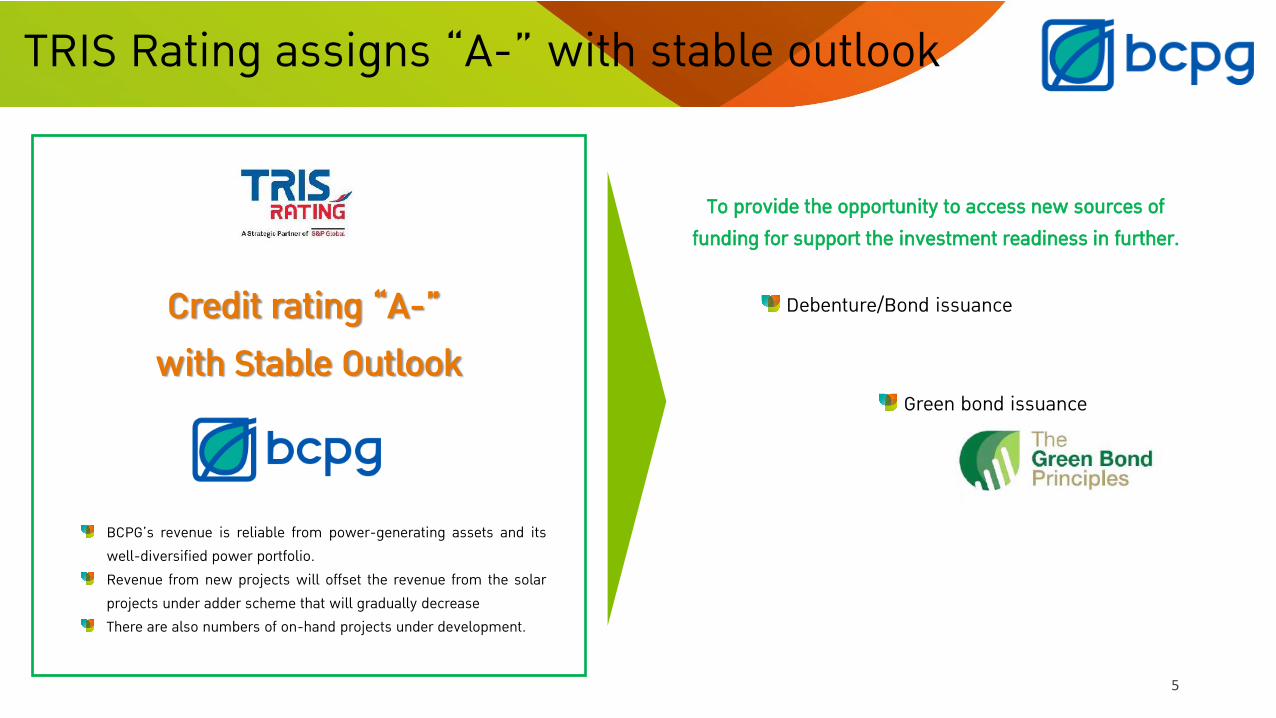
TRIS Rating assigns “A-” with stable outlook
BCPG’s revenue is reliable from power-generating assets and its well-diversified power portfolio. Revenue from new projects will offset the revenue from the solar projects under adder scheme that will gradually decrease There are also numbers of on-hand projects under development.
To provide the opportunity to access new sources of funding for support the investment readiness in further.
Credit rating “A-” with Stable Outlook
Debenture/Bond issuance
Green bond issuance
6
Key developments
Performance & Guidelines
Agenda
Portfolio & Pipelines

7
Key developments
Performance & Guidelines
Agenda
Portfolio & Pipelines
8
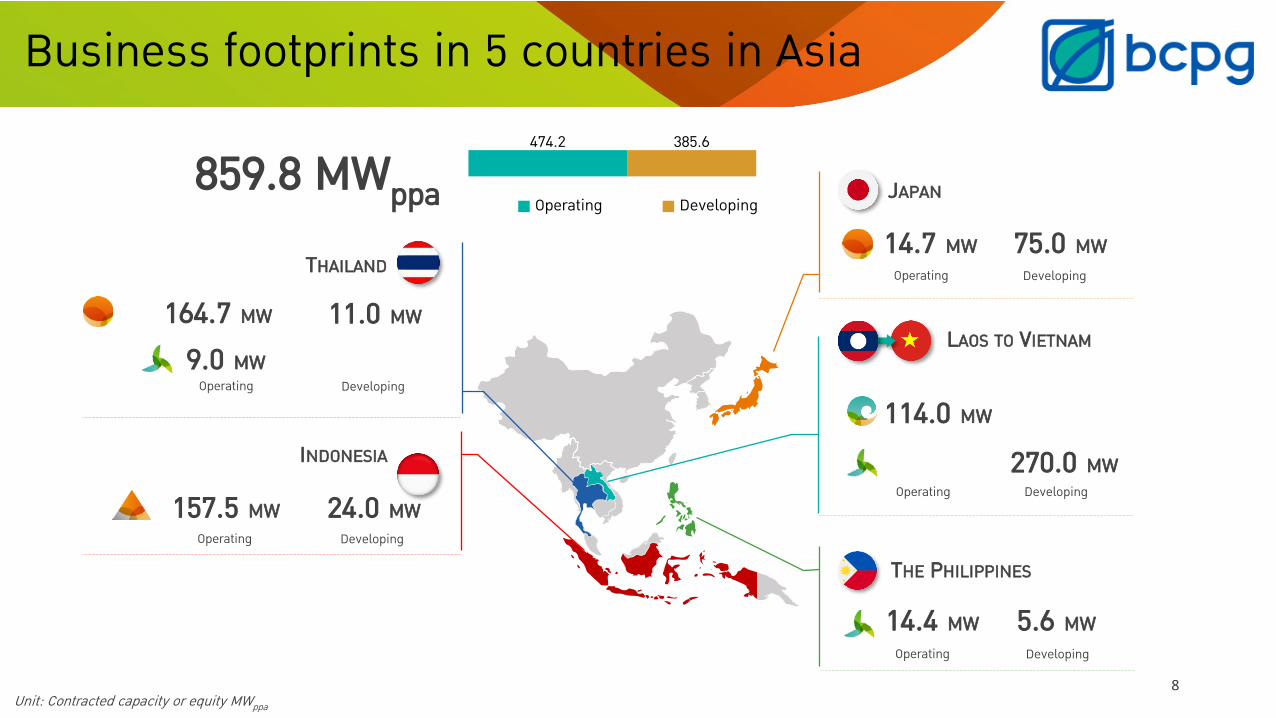
859.8 MWppa
164.7 MW 11.0 MW
THAILAND
Operating Developing
157.5 MW 24.0 MW
INDONESIA
Operating Developing
14.4 MW 5.6 MW
THE PHILIPPINES
Operating Developing
14.7 MW 75.0 MW
JAPAN
Operating Developing
114.0 MW
LAOS TO VIETNAM
Unit: Contracted capacity or equity MWppa
9.0 MW
474.2 385.6
Operating Developing
270.0 MWDevelopingOperating
Business footprints in 5 countries in Asia
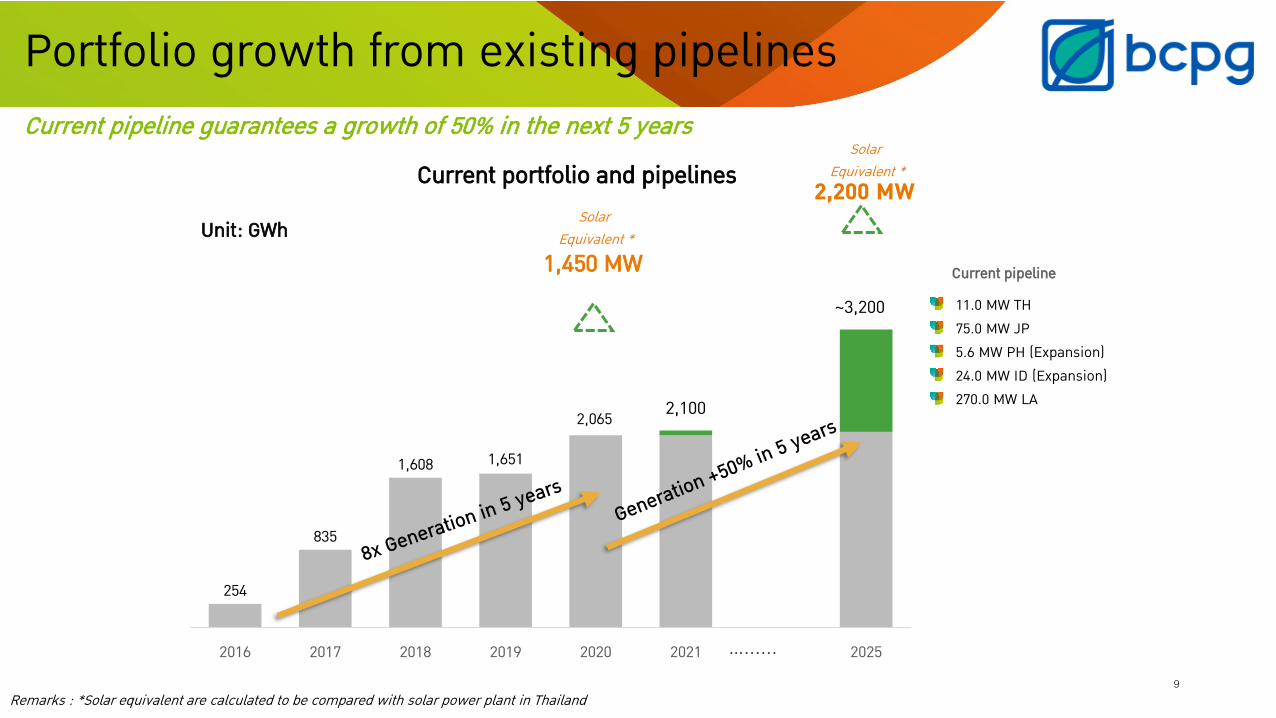
254
835
1,608 1,651
2,065
2016 2017 2018 2019 2020 2021 20259
…......
Remarks : *Solar equivalent are calculated to be compared with solar power plant in Thailand
Unit: GWh
Current portfolio and pipelines
Current pipeline guarantees a growth of 50% in the next 5 years
Solar Equivalent *
11.0 MW TH75.0 MW JP 5.6 MW PH (Expansion)24.0 MW ID (Expansion)270.0 MW LA
Current pipeline1,450 MW
2,200 MWSolar
Equivalent *
Portfolio growth from existing pipelines
2,100
~3,200
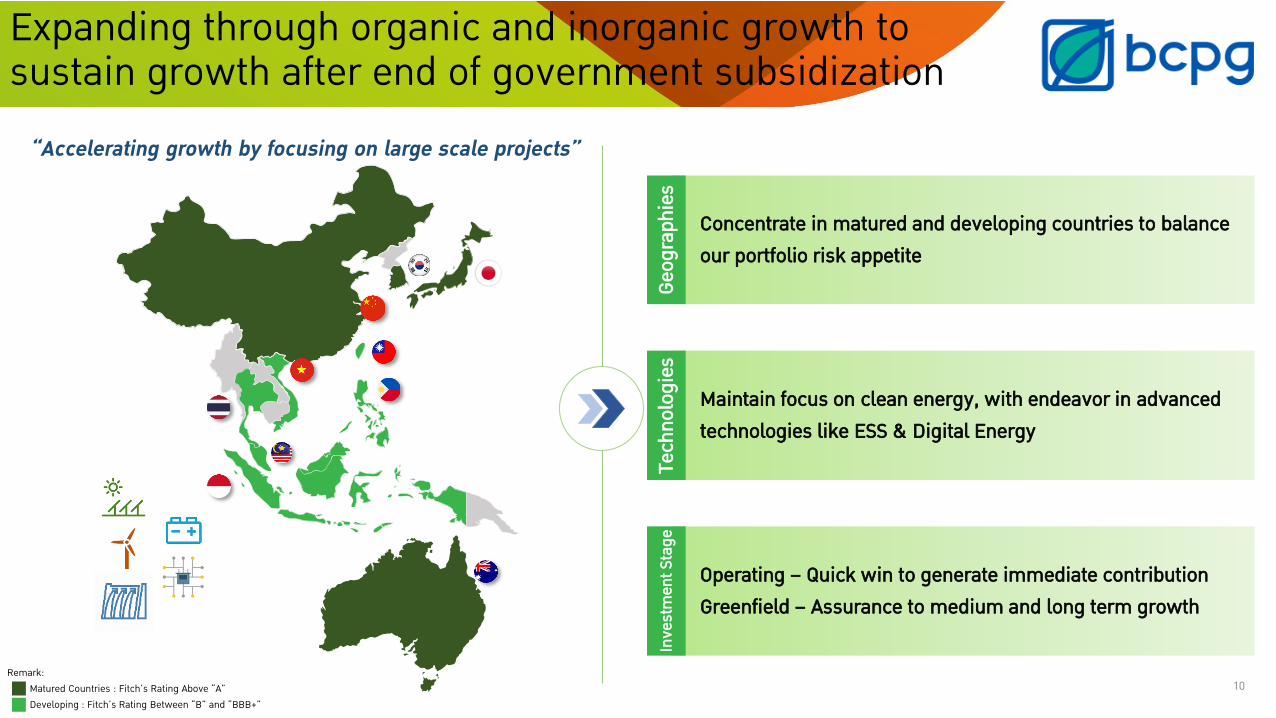
Concentrate in matured and developing countries to balance our portfolio risk appetite
Operating – Quick win to generate immediate contributionGreenfield – Assurance to medium and long term growth
Geog
raph
ies
Maintain focus on clean energy, with endeavor in advanced technologies like ESS & Digital Energy
Tech
nolo
gies
Inve
stm
ent S
tage
10
Expanding through organic and inorganic growth to sustain growth after end of government subsidization
Remark:Matured Countries : Fitch’s Rating Above “A”Developing : Fitch’s Rating Between “B” and “BBB+”
“Accelerating growth by focusing on large scale projects”

11
Key developments
Performance & Guidelines
Agenda
Portfolio & Pipelines
12
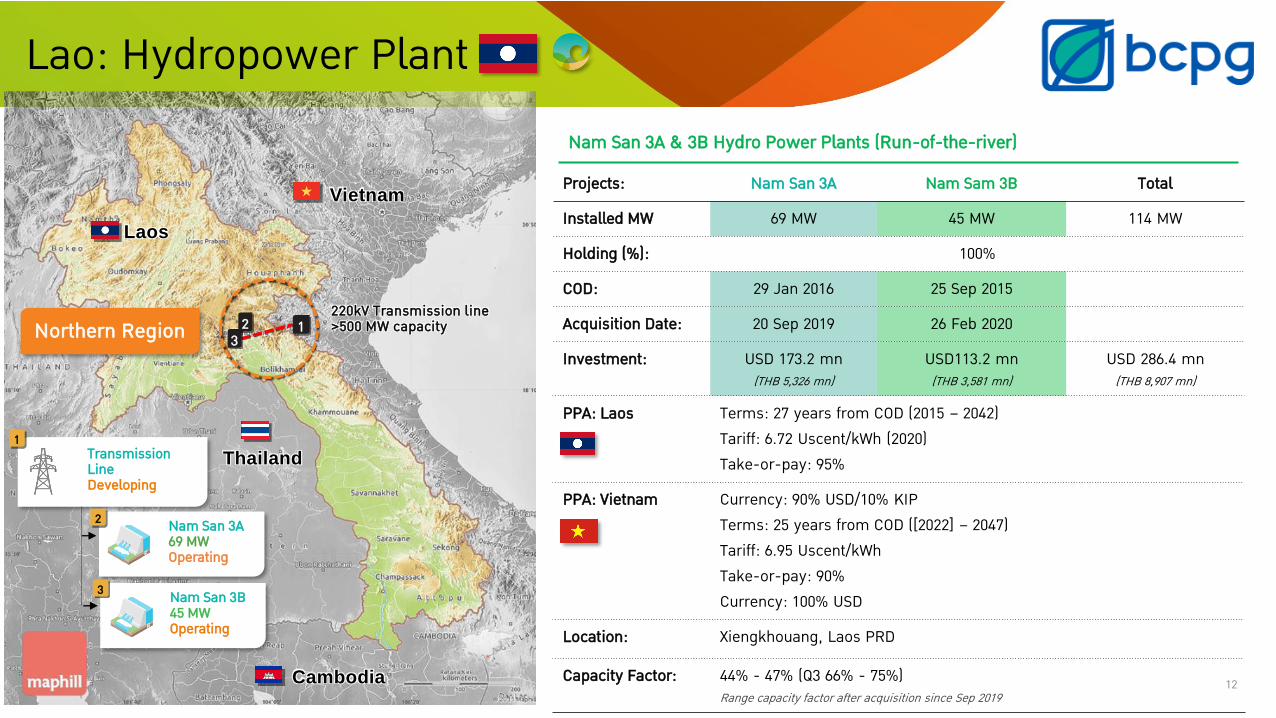
Lao: Hydropower PlantNam San 3A & 3B Hydro Power Plants (Run-of-the-river)
Projects: Nam San 3A Nam Sam 3B Total
Installed MW 69 MW 45 MW 114 MW
Holding (%): 100%
COD: 29 Jan 2016 25 Sep 2015
Acquisition Date: 20 Sep 2019 26 Feb 2020
Investment: USD 173.2 mn(THB 5,326 mn)
USD113.2 mn(THB 3,581 mn)
USD 286.4 mn(THB 8,907 mn)
PPA: Laos Terms: 27 years from COD (2015 – 2042)Tariff: 6.72 Uscent/kWh (2020)Take-or-pay: 95%
PPA: Vietnam Currency: 90% USD/10% KIPTerms: 25 years from COD ([2022] – 2047)Tariff: 6.95 Uscent/kWhTake-or-pay: 90%Currency: 100% USD
Location: Xiengkhouang, Laos PRD
Capacity Factor: 44% - 47% (Q3 66% - 75%)Range capacity factor after acquisition since Sep 2019
Nam San 3A 69 MWOperating
Nam San 3B 45 MWOperating
Transmission LineDeveloping
Thailand
Cambodia
Vietnam
32 1
Laos
220kV Transmission line>500 MW capacity
1
2
3
Northern Region
Developing: 0.0 MWOperating: 114.0 MW
Hold: 100.0%
Subsidiaries
13
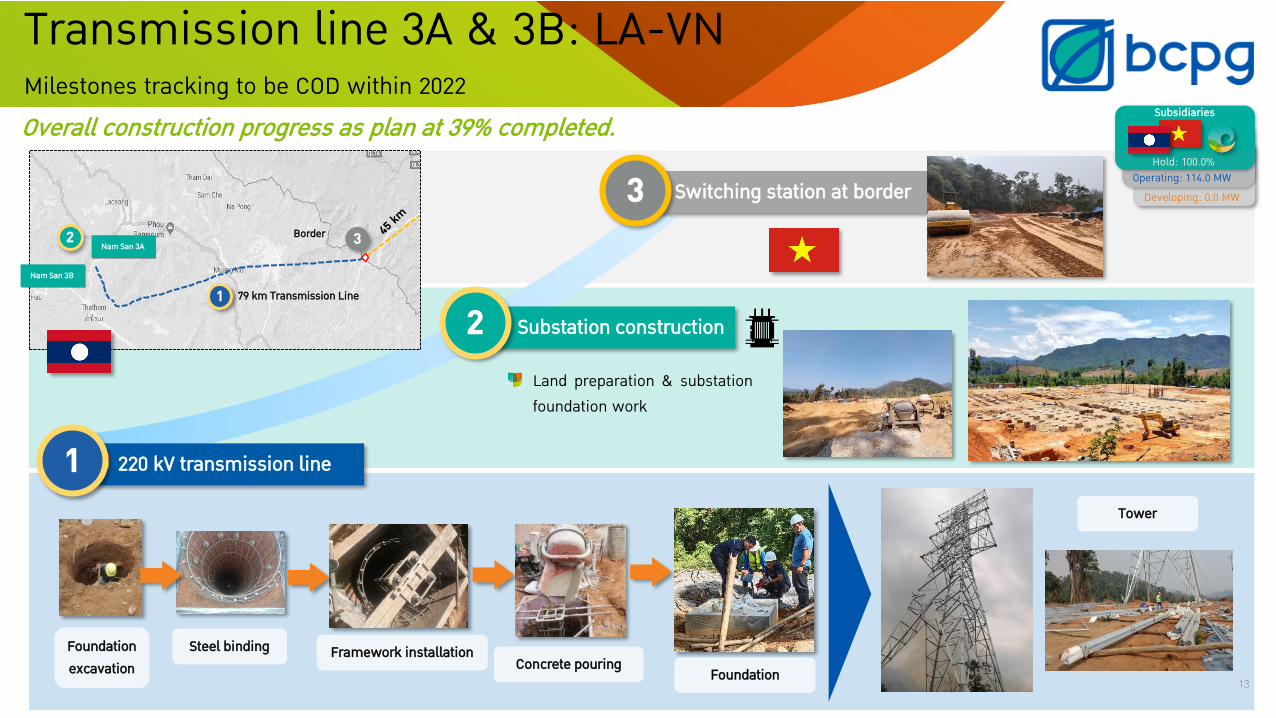
220 kV transmission line
Transmission line 3A & 3B: LA-VNMilestones tracking to be COD within 2022
1
Substation construction2
Switching station at border3
79 km Transmission Line
BorderNam San 3A
Nam San 3B
1
2 3
Foundation excavation
Steel binding Framework installationConcrete pouring Foundation
Land preparation & substation foundation work
Overall construction progress as plan at 39% completed.
Tower
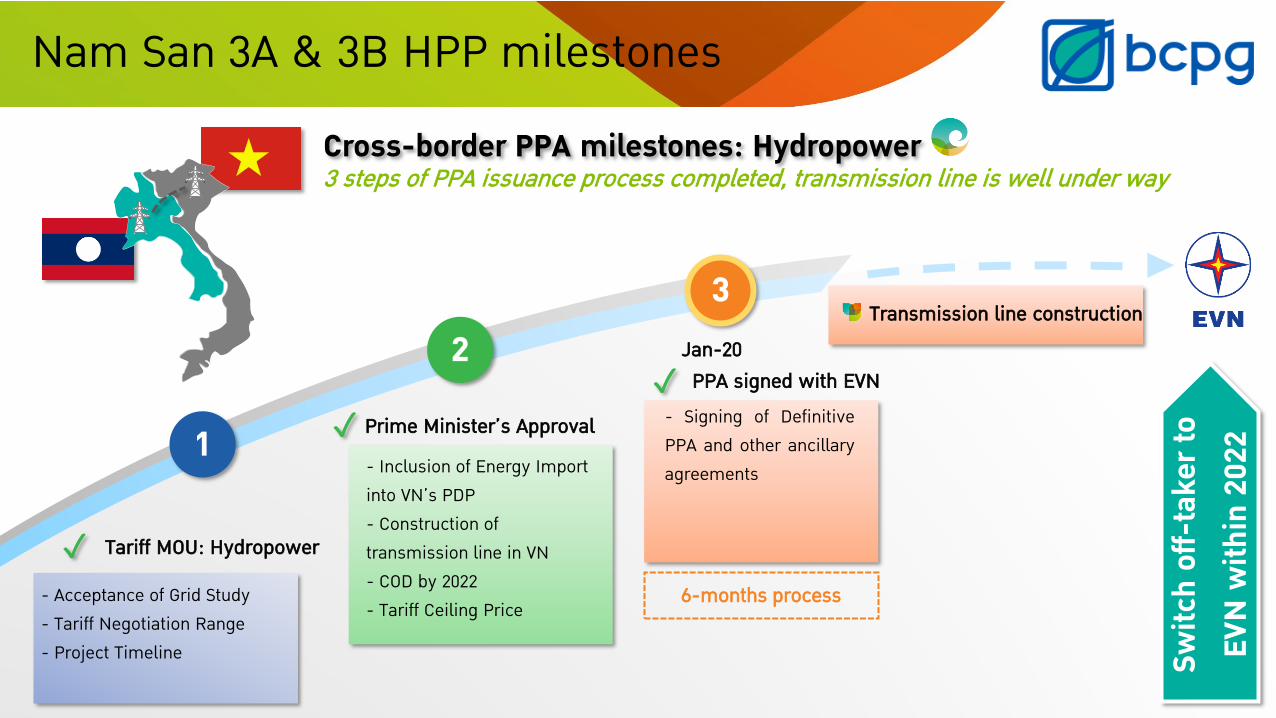
Nam San 3A & 3B HPP milestones
Prime Minister’s Approval
PPA signed with EVN
- Acceptance of Grid Study- Tariff Negotiation Range- Project Timeline
- Inclusion of Energy Import into VN’s PDP - Construction of transmission line in VN- COD by 2022- Tariff Ceiling Price
- Signing of Definitive PPA and other ancillary agreements
3 steps of PPA issuance process completed, transmission line is well under wayCross-border PPA milestones: Hydropower
23
6-months process
Jan-20
14
Tariff MOU: Hydropower✓
✓
✓
1
Switc
h of
f-tak
er to
EV
N wi
thin
2022
Transmission line construction
15
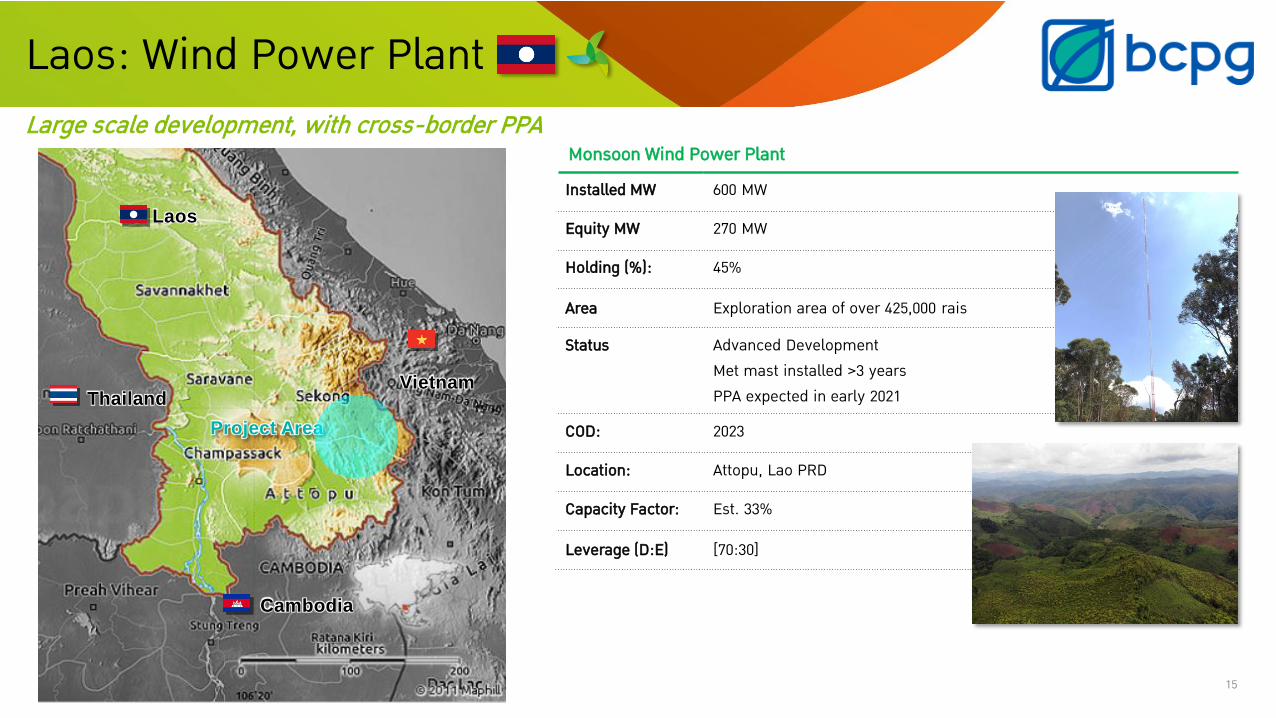
Laos: Wind Power Plant
Monsoon Wind Power Plant Installed MW 600 MW
Equity MW 270 MW
Holding (%): 45%
Area Exploration area of over 425,000 rais
Status Advanced DevelopmentMet mast installed >3 yearsPPA expected in early 2021
COD: 2023
Location: Attopu, Lao PRD
Capacity Factor: Est. 33%
Leverage (D:E) [70:30]
Thailand
Cambodia
Vietnam
Project Area
Laos
Large scale development, with cross-border PPA

16
Lao-VN 600MW Wind Farm milestones
Cross-border milestones: Wind farm
1
2
Project and transmission line construction
Aug-2020
16
34
Financial close
- Financing in place
To b
e CO
D wi
thin
2023
Prime Minister’s Approval
- Acceptance of Grid Study- Tariff Negotiation Range- Project Timeline
- Inclusion of Energy Import into VN’s PDP - Construction of transmission line in VN- COD by 2023- Tariff Ceiling Price
Tariff MOU: Wind Farm✓
✓
PPA to be signed with EVN
EPC Selection
- Final negotiation with EPC bidders
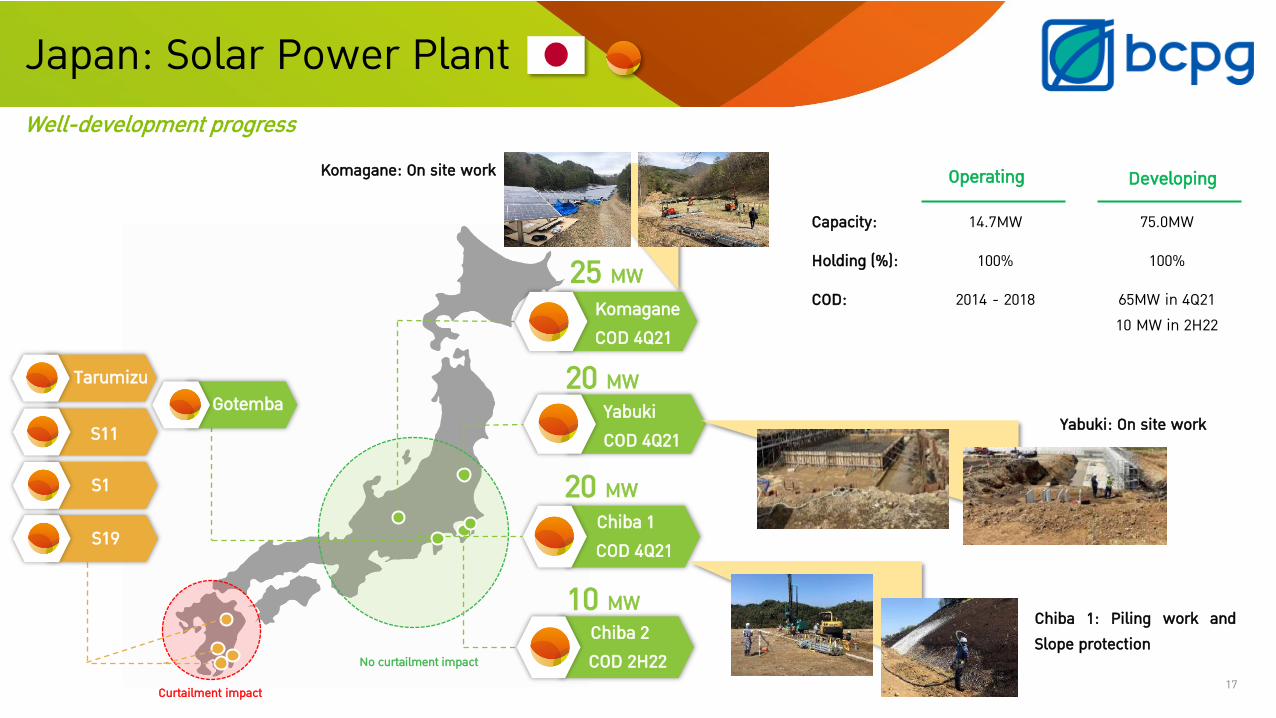
Japan: Solar Power Plant
Operating
Capacity: 14.7MW 75.0MW
Holding (%): 100% 100%
COD: 2014 - 2018 65MW in 4Q21 10 MW in 2H22
Developing
25 MW
20 MWYabukiCOD 4Q21
Chiba 1COD 4Q21
Chiba 2COD 2H22
20 MW
10 MW
S1
S19
S11
TarumizuGotemba
KomaganeCOD 4Q21
Curtailment impact
No curtailment impact
Well-development progress
Chiba 1: Piling work and Slope protection
Yabuki: On site work
17
Komagane: On site work

18
Key developments
Performance & Guidelines
Agenda
Portfolio & Pipelines
19
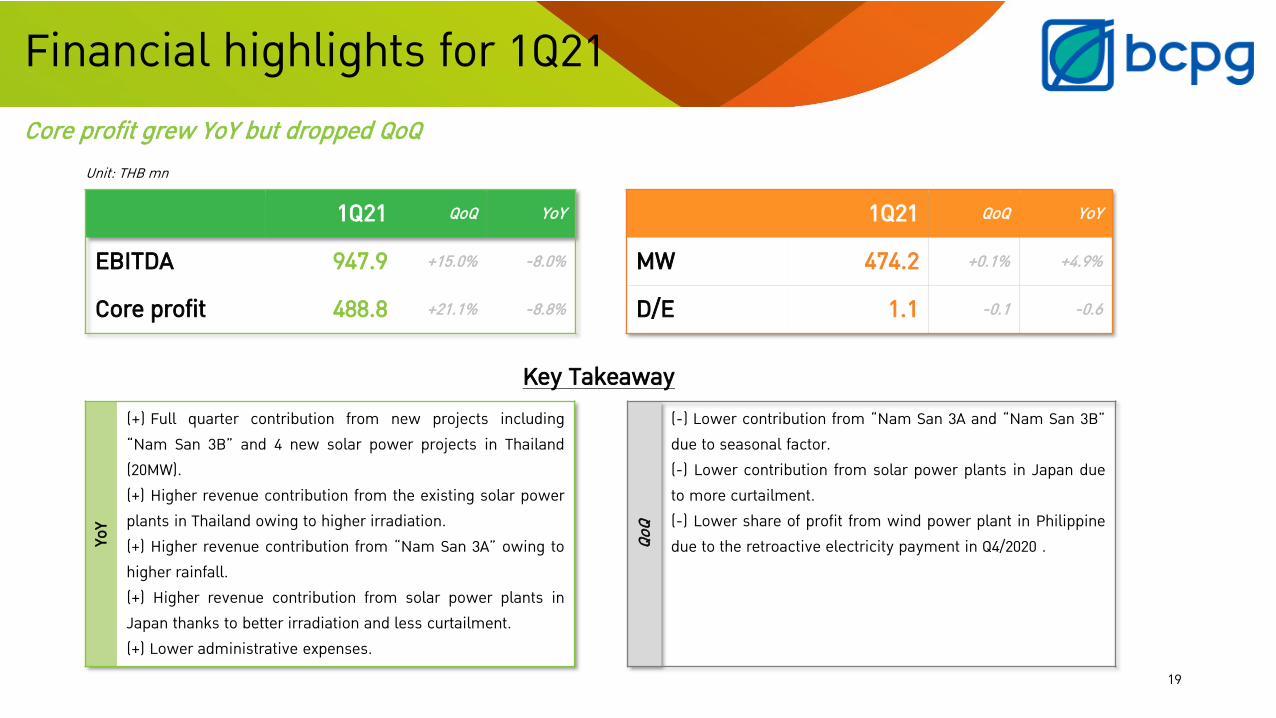
1Q21 QoQ YoY 1Q21 QoQ YoY
EBITDA 947.9 +15.0% -8.0% MW 474.2 +0.1% +4.9%
Core profit 488.8 +21.1% -8.8% D/E 1.1 -0.1 -0.6
Unit: THB mn
YoY
(+) Full quarter contribution from new projects including “Nam San 3B” and 4 new solar power projects in Thailand (20MW). (+) Higher revenue contribution from the existing solar power plants in Thailand owing to higher irradiation.(+) Higher revenue contribution from “Nam San 3A” owing to higher rainfall.(+) Higher revenue contribution from solar power plants in Japan thanks to better irradiation and less curtailment.(+) Lower administrative expenses.
QoQ
(-) Lower contribution from “Nam San 3A and “Nam San 3B” due to seasonal factor.(-) Lower contribution from solar power plants in Japan due to more curtailment. (-) Lower share of profit from wind power plant in Philippine due to the retroactive electricity payment in Q4/2020 .
Key Takeaway
Financial highlights for 1Q21Core profit grew YoY but dropped QoQ
71.3 73.5 81.6
17.1% 15.5%17.4%
1Q20 4Q20 1Q21
Generation Capacity factor (%)
+11.0% QoQ
+14.4% YoY
3.9 3.4 3.7
17.7%15.5%
17.1%
1Q20 4Q20 1Q21
Generation Capacity factor (%)
-4.4% YoY
+8.2% QoQ
771.4 759.1 858.1
1Q20 4Q20 1Q21
TH (Solar) TH (Wind) TH (Other)
+11.2% YoY
+13.0% QoQ
Developing: 0.0 MWOperating: 9.0 MW
Hold: 100.0%
Subsidiaries
Developing: 11.0 MWOperating: 164.2 MW
Hold: 100.0%
Subsidiaries
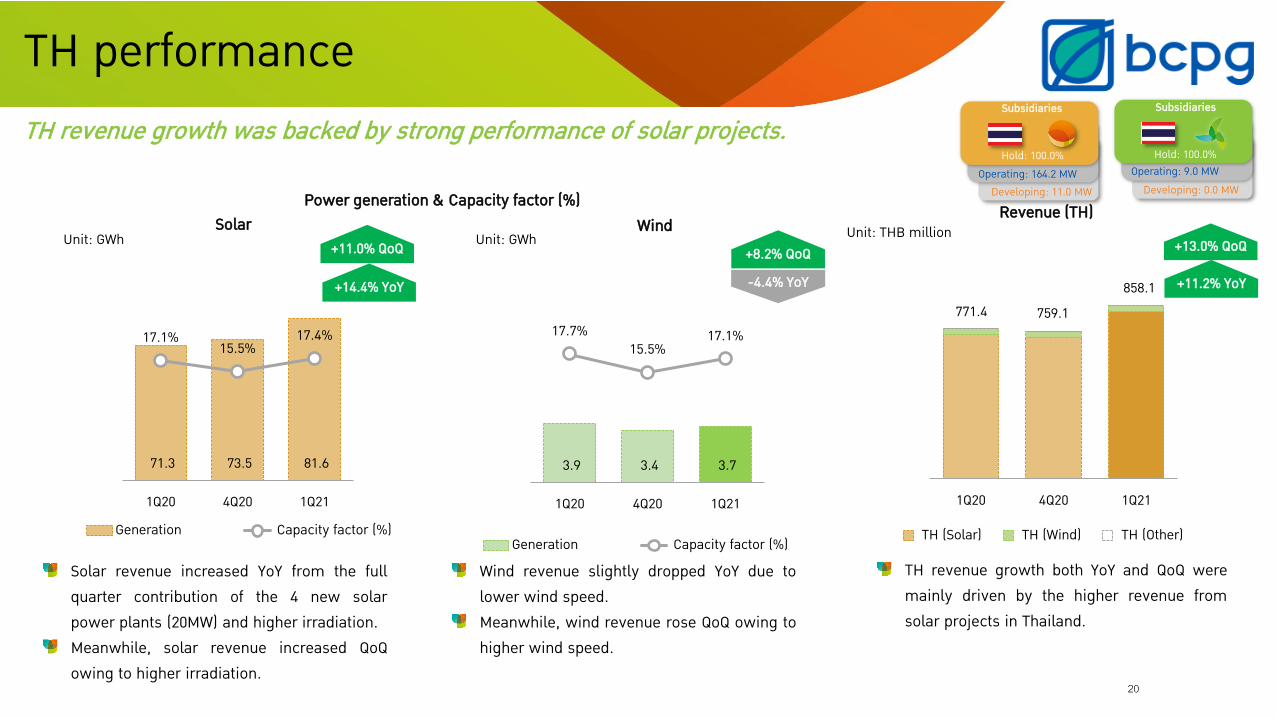
TH performanceTH revenue growth was backed by strong performance of solar projects.
20
Unit: GWh Unit: GWh
Power generation & Capacity factor (%)
Solar revenue increased YoY from the full quarter contribution of the 4 new solar power plants (20MW) and higher irradiation. Meanwhile, solar revenue increased QoQowing to higher irradiation.
Revenue (TH) Unit: THB million
TH revenue growth both YoY and QoQ were mainly driven by the higher revenue from solar projects in Thailand.
Wind revenue slightly dropped YoY due to lower wind speed. Meanwhile, wind revenue rose QoQ owing to higher wind speed.
Solar Wind
34.3 157.1 68.1
18.2%
62.4%
27.7%
1Q20 4Q20 1Q21
Generation Capacity factor (%)
-56.6% QoQ
+98.3% YoY
72.5
322.2
137.4
1Q20 4Q20 1Q21
LA (Hydro)
-57.3% QoQ
+89.5% YoY
LA Performance
21
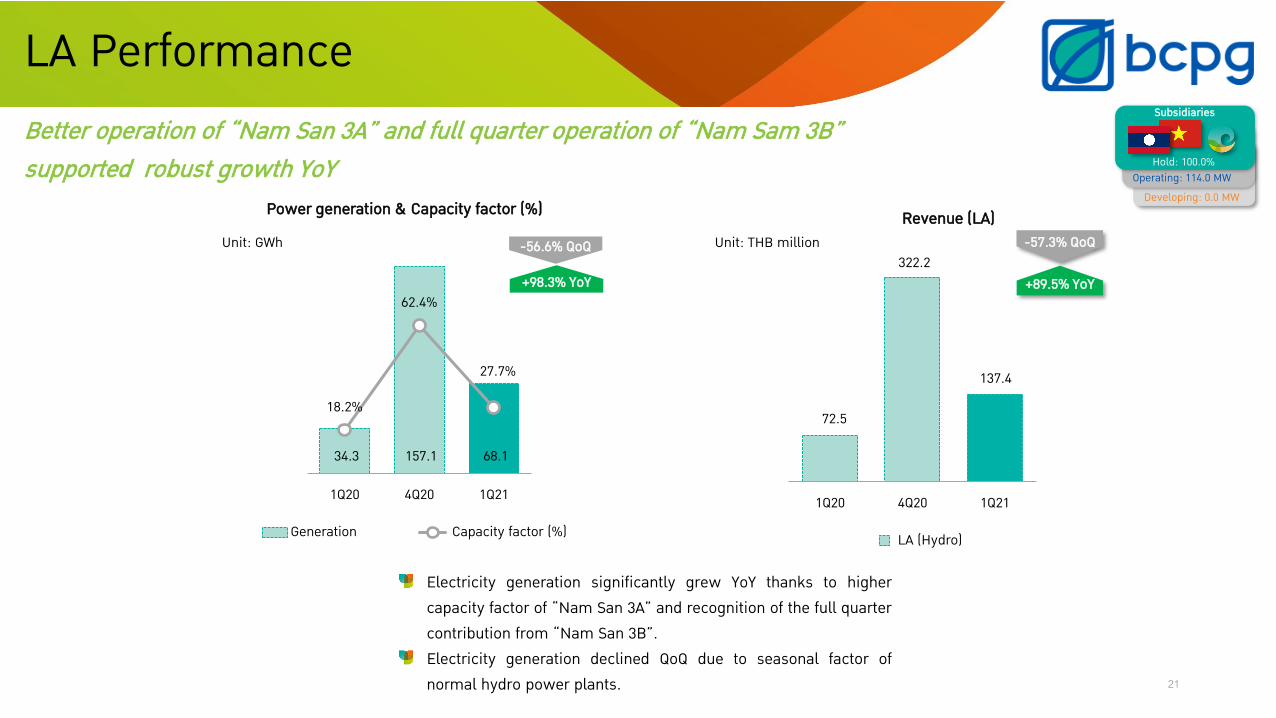
Better operation of “Nam San 3A” and full quarter operation of “Nam Sam 3B” supported robust growth YoY
Unit: GWh
Electricity generation significantly grew YoY thanks to higher capacity factor of “Nam San 3A” and recognition of the full quarter contribution from “Nam San 3B”.Electricity generation declined QoQ due to seasonal factor of normal hydro power plants.
Unit: THB millionRevenue (LA) Power generation & Capacity factor (%)
Developing: 0.0 MWOperating: 114.0 MW
Hold: 100.0%
Subsidiaries
3.1 4.2 4.0
8.6%11.1% 10.7%
1Q20 4Q20 1Q21
Generation Capacity factor (%)
-4.9% QoQ
+28.4% YoY
42.5
55.5 51.1
1Q20 4Q20 1Q21
JP (Solar) JP (Other)
-7.8% QoQ
+20.4% YoY
Developing: 75.0 MWOperating: 14.7 MW
Hold: 100.0%
Subsidiaries
JP performance
22
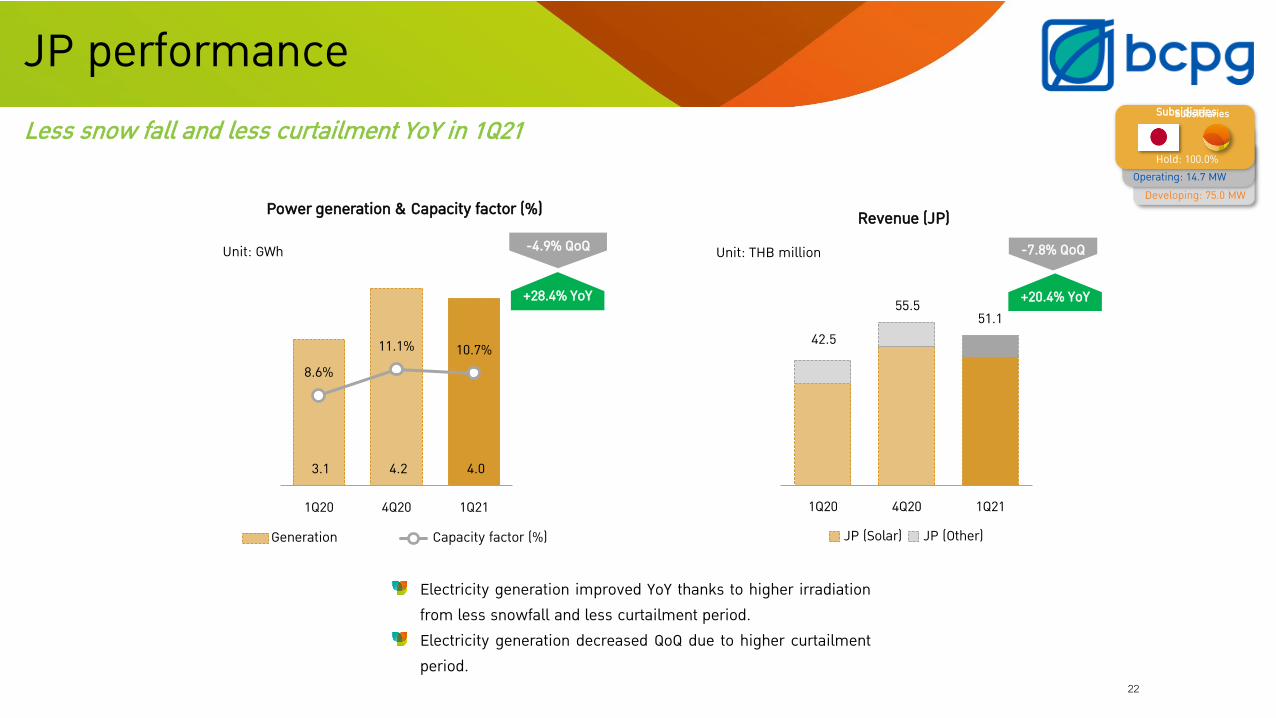
Less snow fall and less curtailment YoY in 1Q21
Unit: THB million
Electricity generation improved YoY thanks to higher irradiation from less snowfall and less curtailment period. Electricity generation decreased QoQ due to higher curtailment period.
Unit: GWh
Subsidiaries
Power generation & Capacity factor (%) Revenue (JP)
318.2 304.6 300.3
96.7% 91.3% 92.1%
1Q20 4Q20 1Q21Generation Capacity factor (%)
-1.4% QoQ
-5.6% YoY
228.4 189.9
212.3
1Q20 4Q20 1Q21
-7.1% YoY+11.8% QoQ
Developing: 24.0 MWOperating: 157.5 MW
Hold: 33.3%
Associates
ID PerformanceGeothermal power plants in Indonesia
23Remark: *Generation based on holding percentage
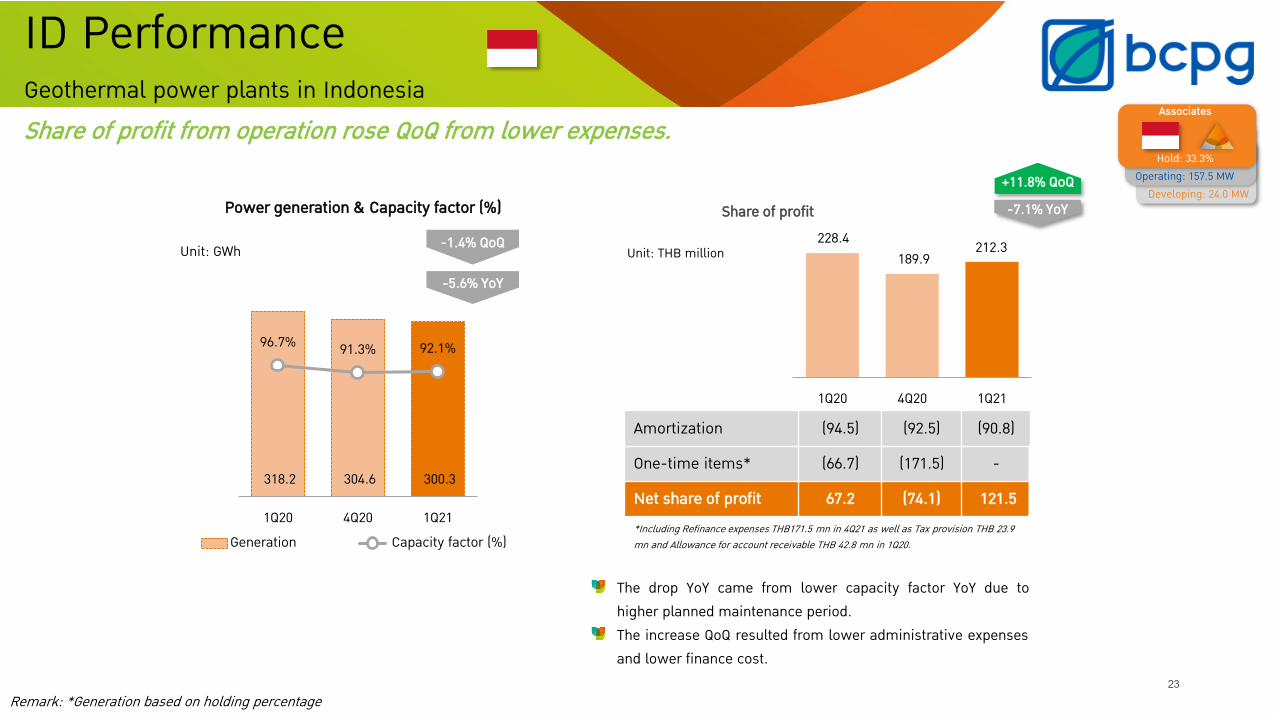
Share of profit from operation rose QoQ from lower expenses.
Unit: GWh
Power generation & Capacity factor (%)
Unit: THB million
The drop YoY came from lower capacity factor YoY due to higher planned maintenance period.The increase QoQ resulted from lower administrative expenses and lower finance cost.
Amortization (94.5) (92.5) (90.8)
One-time items* (66.7) (171.5) -
Net share of profit 67.2 (74.1) 121.5 *Including Refinance expenses THB171.5 mn in 4Q21 as well as Tax provision THB 23.9 mn and Allowance for account receivable THB 42.8 mn in 1Q20.
Share of profit
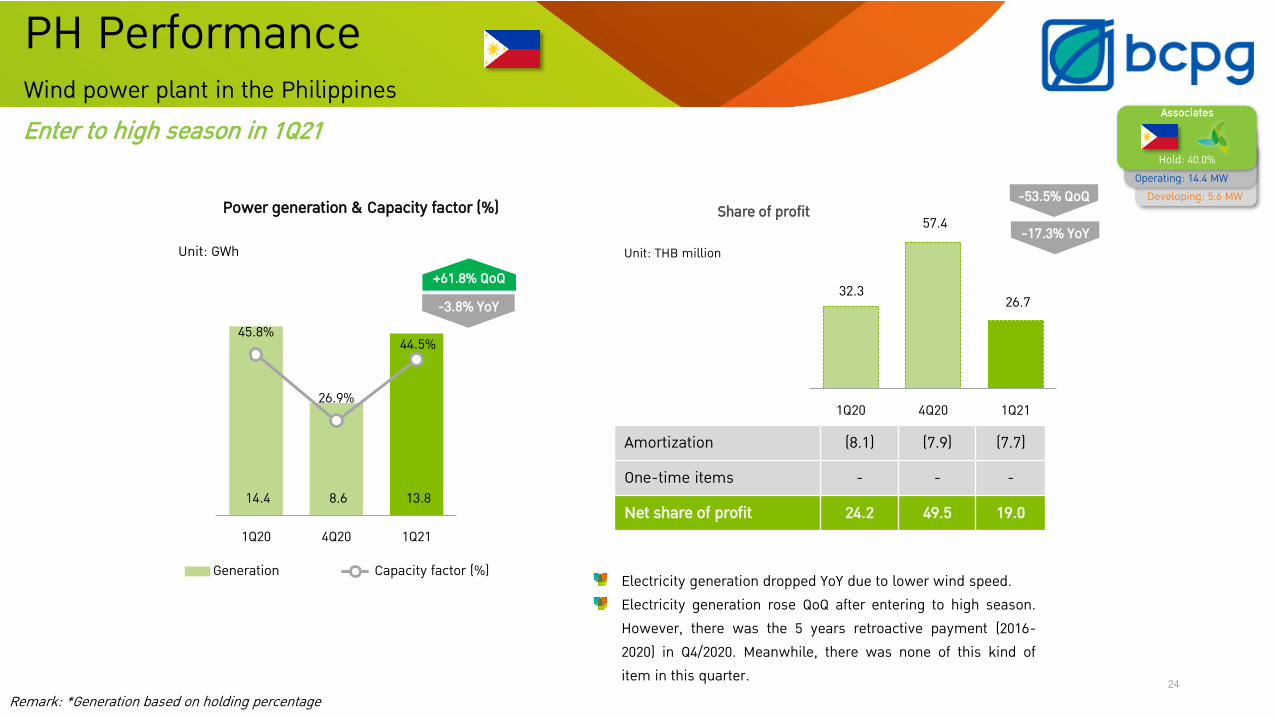
14.4 8.6 13.8
45.8%
26.9%
44.5%
1Q20 4Q20 1Q21
Generation Capacity factor (%)
-3.8% YoY
+61.8% QoQ32.3
57.4
26.7
1Q20 4Q20 1Q21
-17.3% YoY
-53.5% QoQ Developing: 5.6 MWOperating: 14.4 MW
Hold: 40.0%
Associates
PH PerformanceWind power plant in the Philippines
24
Enter to high season in 1Q21
Remark: *Generation based on holding percentage
Unit: GWh
Amortization (8.1) (7.9) (7.7)
One-time items - - -
Net share of profit 24.2 49.5 19.0
Electricity generation dropped YoY due to lower wind speed. Electricity generation rose QoQ after entering to high season. However, there was the 5 years retroactive payment (2016-2020) in Q4/2020. Meanwhile, there was none of this kind of item in this quarter.
Unit: THB million
Power generation & Capacity factor (%) Share of profit
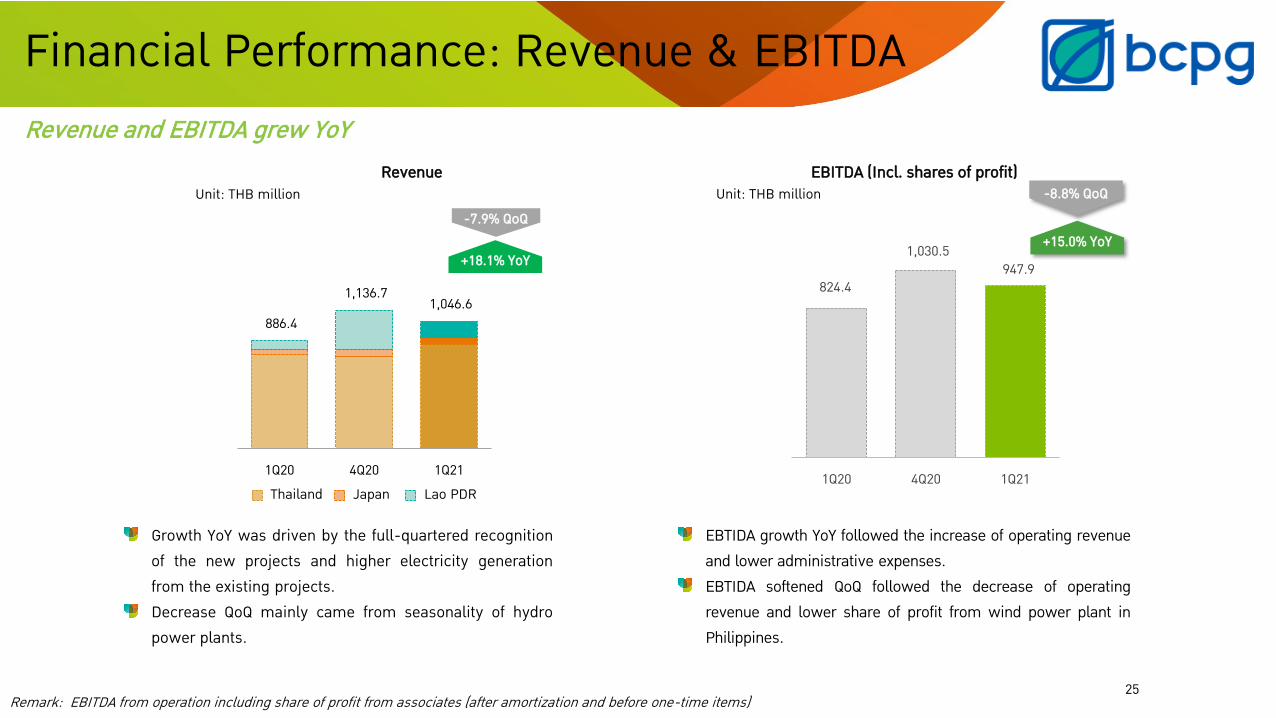
886.4
1,136.7 1,046.6
1Q20 4Q20 1Q21 Thailand Japan Lao PDR
-7.9% QoQ
+18.1% YoY824.4
1,030.5947.9
1Q20 4Q20 1Q21
-8.8% QoQ
+15.0% YoY
Remark: EBITDA from operation including share of profit from associates (after amortization and before one-time items)
Revenue and EBITDA grew YoY
25
EBITDA (Incl. shares of profit)
EBTIDA growth YoY followed the increase of operating revenue and lower administrative expenses. EBTIDA softened QoQ followed the decrease of operating revenue and lower share of profit from wind power plant in Philippines.
Financial Performance: Revenue & EBITDA
Growth YoY was driven by the full-quartered recognition of the new projects and higher electricity generation from the existing projects. Decrease QoQ mainly came from seasonality of hydro power plants.
Unit: THB millionUnit: THB millionRevenue
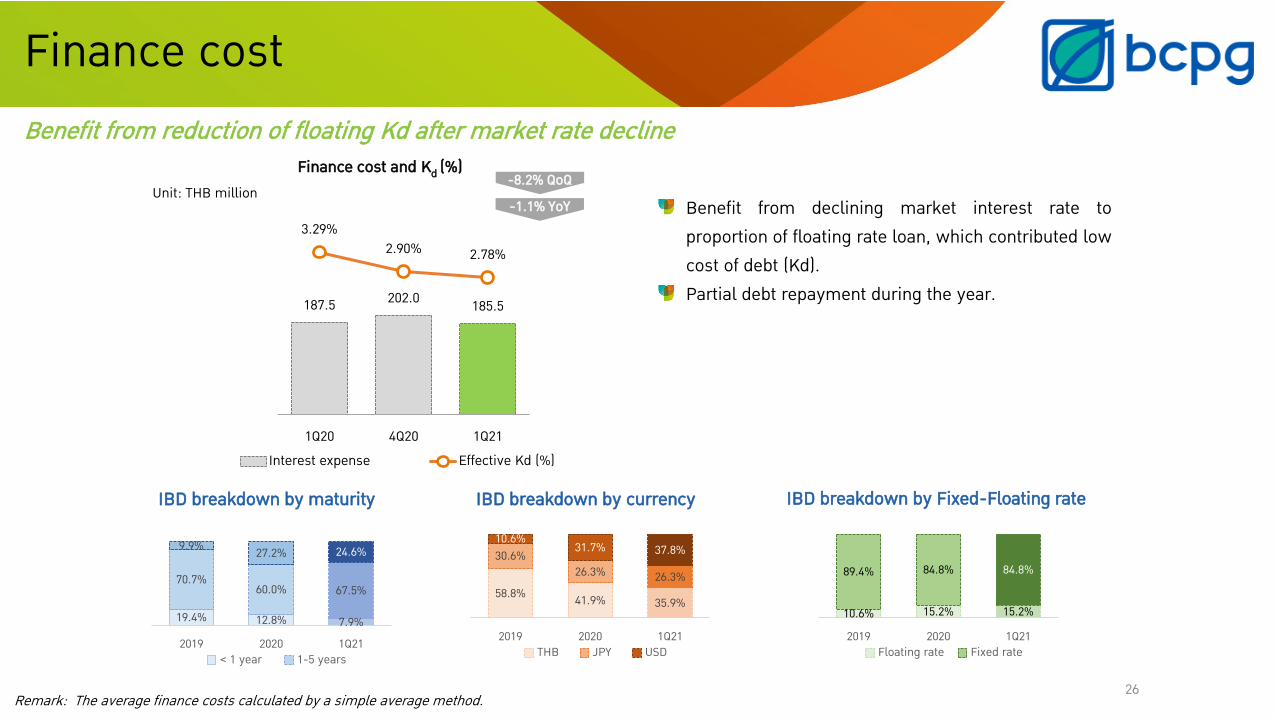
58.8% 41.9% 35.9%
30.6%26.3% 26.3%
10.6% 31.7% 37.8%
2019 2020 1Q21THB JPY USD
10.6% 15.2% 15.2%
89.4% 84.8% 84.8%
2019 2020 1Q21Floating rate Fixed rate
19.4% 12.8% 7.9%
70.7%60.0% 67.5%
9.9% 27.2% 24.6%
2019 2020 1Q21< 1 year 1-5 years
187.5 202.0 185.5
3.29%2.90% 2.78%
1Q20 4Q20 1Q21Interest expense Effective Kd (%)
-1.1% YoY-8.2% QoQ
26
Unit: THB million
IBD breakdown by maturity IBD breakdown by currency IBD breakdown by Fixed-Floating rate
Benefit from declining market interest rate to proportion of floating rate loan, which contributed low cost of debt (Kd).Partial debt repayment during the year.
Finance cost and Kd (%)
Remark: The average finance costs calculated by a simple average method.
Benefit from reduction of floating Kd after market rate decline
Finance cost
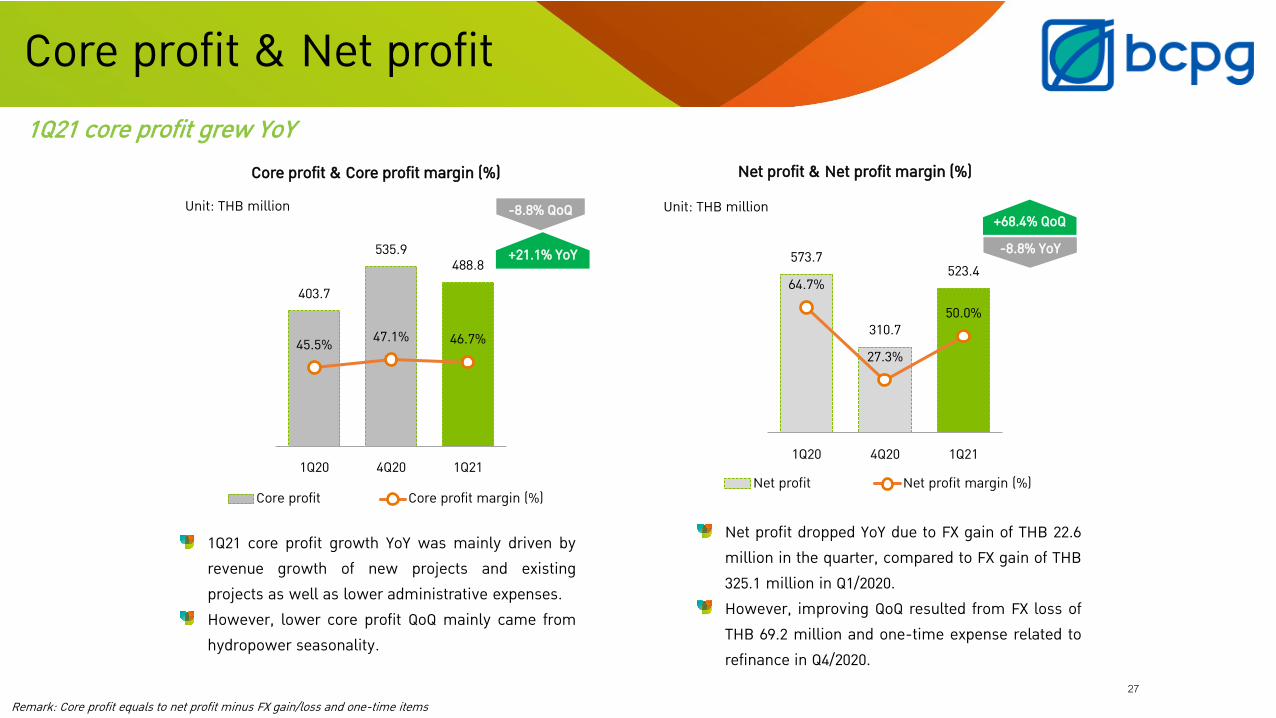
573.7
310.7
523.464.7%
27.3%
50.0%
1Q20 4Q20 1Q21
Net profit Net profit margin (%)
-8.8% YoY+68.4% QoQ
403.7
535.9488.8
45.5% 47.1% 46.7%
1Q20 4Q20 1Q21
Core profit Core profit margin (%)
-8.8% QoQ
+21.1% YoY
27
1Q21 core profit grew YoY Core profit & Core profit margin (%)
Remark: Core profit equals to net profit minus FX gain/loss and one-time items
Unit: THB million
Net profit & Net profit margin (%)
Core profit & Net profit
Unit: THB million
1Q21 core profit growth YoY was mainly driven by revenue growth of new projects and existing projects as well as lower administrative expenses. However, lower core profit QoQ mainly came from hydropower seasonality.
Net profit dropped YoY due to FX gain of THB 22.6 million in the quarter, compared to FX gain of THB 325.1 million in Q1/2020. However, improving QoQ resulted from FX loss of THB 69.2 million and one-time expense related to refinance in Q4/2020.
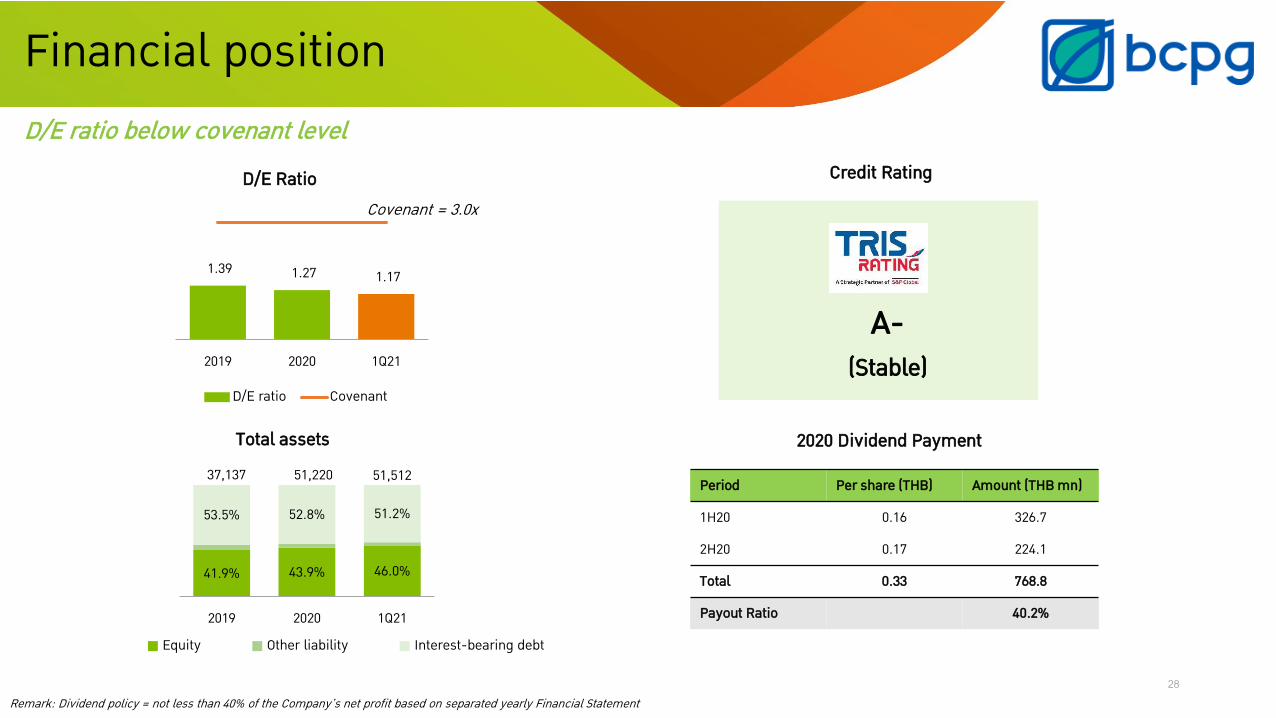
41.9% 43.9% 46.0%
53.5% 52.8% 51.2%
37,137 51,220 51,512
0
50,000
100,000
150,000
200,000
2019 2020 1Q21Equity Other liability Interest-bearing debt
1.39 1.27 1.17
2019 2020 1Q21
D/E ratio Covenant
28
Total assets
D/E ratio below covenant level
Financial position
Remark: Dividend policy = not less than 40% of the Company’s net profit based on separated yearly Financial Statement
Covenant = 3.0x
2020 Dividend Payment
D/E Ratio Credit Rating
A-(Stable)
Period Per share (THB) Amount (THB mn)
1H20 0.16 326.7
2H20 0.17 224.1
Total 0.33 768.8
Payout Ratio 40.2%
29
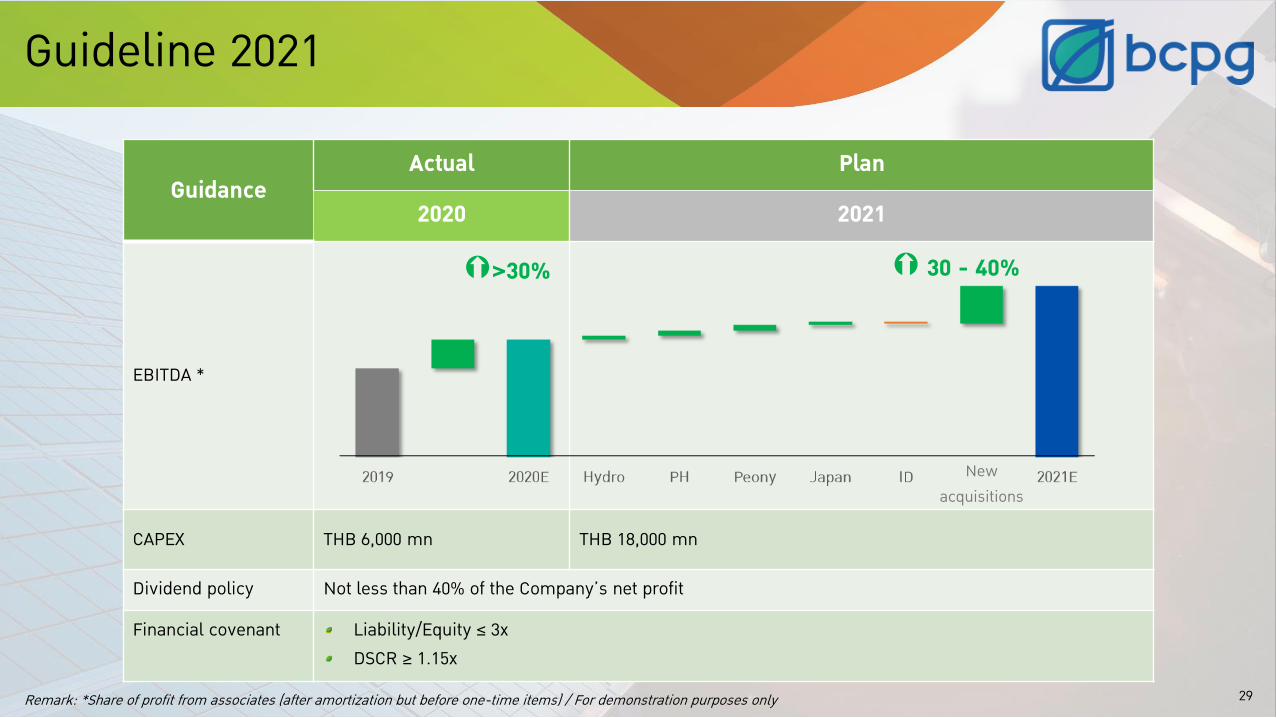
GuidanceActual Plan
2020 2021
EBITDA *
CAPEX THB 6,000 mn THB 18,000 mn
Dividend policy Not less than 40% of the Company’s net profit
Financial covenant Liability/Equity ≤ 3xDSCR ≥ 1.15x
Remark: *Share of profit from associates (after amortization but before one-time items) / For demonstration purposes only
Guideline 2021
>20% 30 - 40%
New acquisitions
>30%

30
Q&A
31
Financial Statement
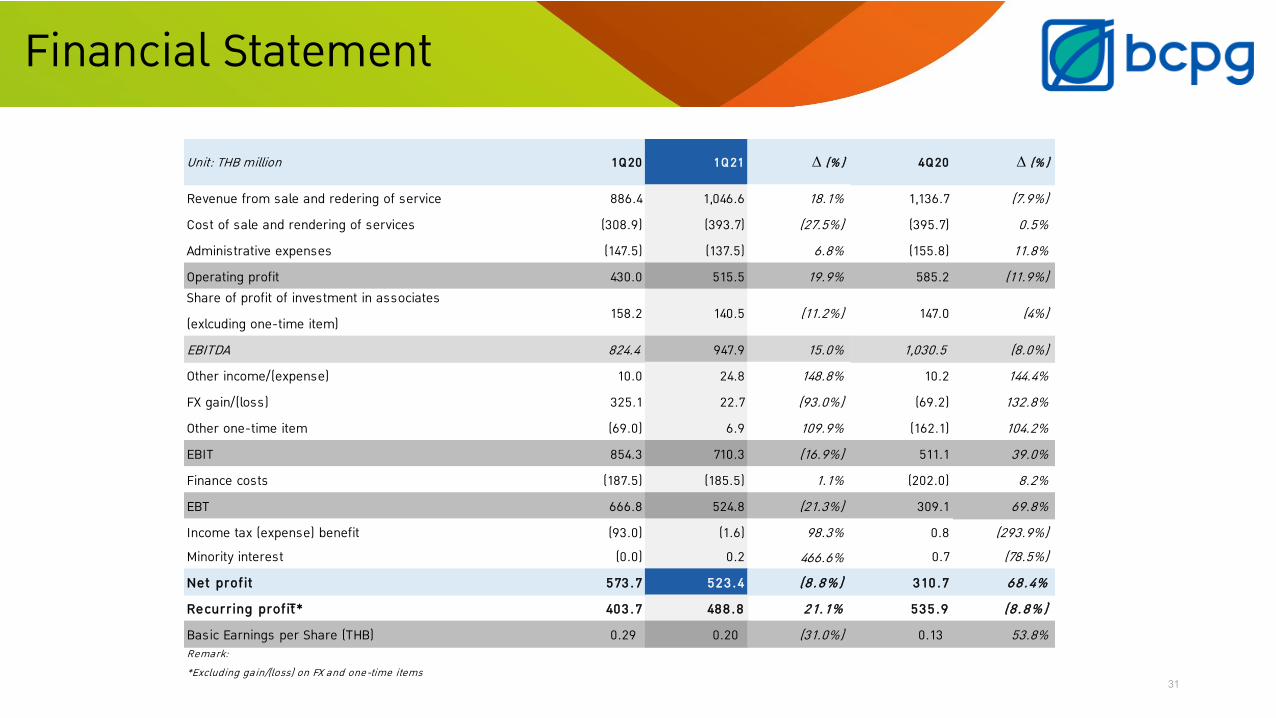
Unit: THB million 1Q20 1Q21 ∆ (% ) 4Q20 ∆ (% )
Revenue from sale and redering of service 886.4 1,046.6 18.1% 1,136.7 (7.9%)Cost of sale and rendering of services (308.9) (393.7) (27.5%) (395.7) 0.5%Administrative expenses (147.5) (137.5) 6.8% (155.8) 11.8%Operating profit 430.0 515.5 19.9% 585.2 (11.9%)Share of profit of investment in associates (exlcuding one-time item) 158.2 140.5 (11.2%) 147.0 (4%)
EBITDA 824.4 947.9 15.0% 1,030.5 (8.0%)Other income/(expense) 10.0 24.8 148.8% 10.2 144.4%FX gain/(loss) 325.1 22.7 (93.0%) (69.2) 132.8%Other one-time item (69.0) 6.9 109.9% (162.1) 104.2%EBIT 854.3 710.3 (16.9%) 511.1 39.0%Finance costs (187.5) (185.5) 1.1% (202.0) 8.2%EBT 666.8 524.8 (21.3%) 309.1 69.8%Income tax (expense) benefit (93.0) (1.6) 98.3% 0.8 (293.9%)Minority interest (0.0) 0.2 466.6% 0.7 (78.5%)Net prof it 573 .7 523 .4 (8 .8% ) 310 .7 68 .4%Recurr ing prof it * 403 .7 488 .8 21.1% 535 .9 (8 .8% )Basic Earnings per Share (THB) 0.29 0.20 (31.0%) 0.13 53.8%Remark:*Excluding gain/(loss) on FX and one-time items
1Q20 1Q21 4Q20FX gain/( loss) and one -t ime ite ms: 170.0 34.5 (225.2)FX gain/(loss) 325.1 22.7 (69.2)
Tax related to Gain/(loss) on foreign exchange (86.1) 5.0 6.1
Refinancing related expense under share of profit from investment in associates
0.0 0.0 (171.5)
Other one-time item (69.0) 6.9 9.4
32
Financial Statement
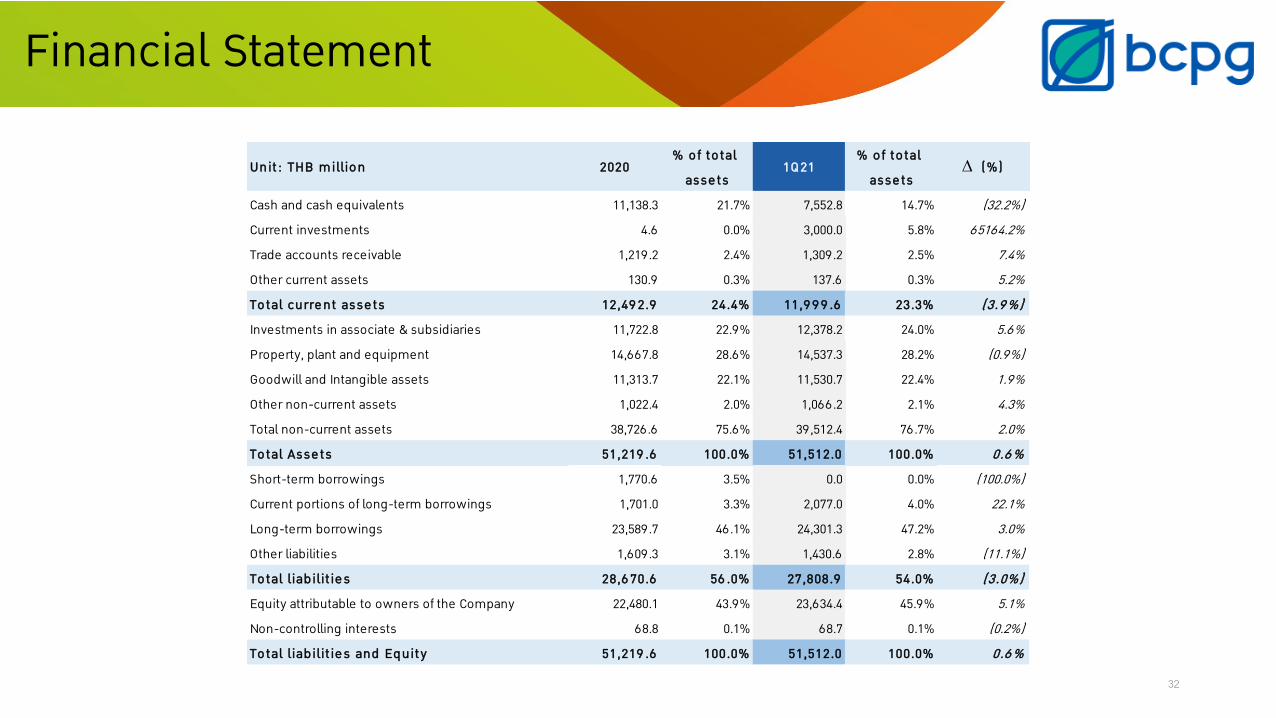
Unit : THB million 2020% o f to tal
asse ts1Q21
% o f to tal asse ts
∆ (%)
Cash and cash equivalents 11,138.3 21.7% 7,552.8 14.7% (32.2%)Current investments 4.6 0.0% 3,000.0 5.8% 65164.2%Trade accounts receivable 1,219.2 2.4% 1,309.2 2.5% 7.4%Other current assets 130.9 0.3% 137.6 0.3% 5.2%Total curre nt asse ts 12,49 2.9 24.4% 11,9 9 9 .6 23.3% (3.9 %)Investments in associate & subsidiaries 11,722.8 22.9% 12,378.2 24.0% 5.6%Property, plant and equipment 14,667.8 28.6% 14,537.3 28.2% (0.9%)Goodwill and Intangible assets 11,313.7 22.1% 11,530.7 22.4% 1.9%Other non-current assets 1,022.4 2.0% 1,066.2 2.1% 4.3%Total non-current assets 38,726.6 75.6% 39,512.4 76.7% 2.0%Total Asse ts 51,219 .6 100.0% 51,512.0 100.0% 0.6 %Short-term borrowings 1,770.6 3.5% 0.0 0.0% (100.0%)Current portions of long-term borrowings 1,701.0 3.3% 2,077.0 4.0% 22.1%Long-term borrowings 23,589.7 46.1% 24,301.3 47.2% 3.0%Other liabilities 1,609.3 3.1% 1,430.6 2.8% (11.1%)To tal liab ilit ie s 28,6 70.6 56 .0% 27,808.9 54.0% (3.0%)Equity attributable to owners of the Company 22,480.1 43.9% 23,634.4 45.9% 5.1%Non-controlling interests 68.8 0.1% 68.7 0.1% (0.2%)To tal liab ilit ie s and Equity 51,219 .6 100.0% 51,512.0 100.0% 0.6 %
33
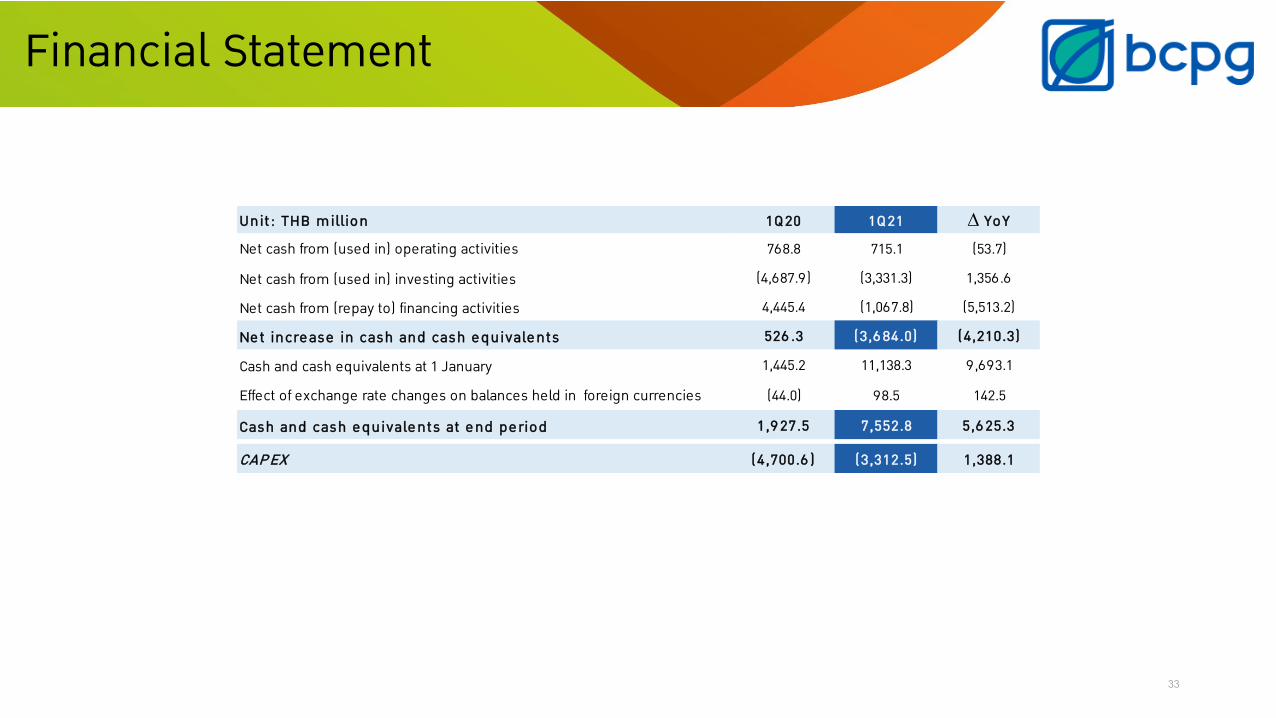
Financial Statement
Unit : THB million 1Q20 1Q21 ∆ YoYNet cash from (used in) operating activities 768.8 715.1 (53.7)
Net cash from (used in) investing activities (4,687.9) (3,331.3) 1,356.6
Net cash from (repay to) financing activities 4,445.4 (1,067.8) (5,513.2)
Ne t incre ase in cash and cash e quivale nts 526 .3 (3,6 84.0) (4,210.3)
Cash and cash equivalents at 1 January 1,445.2 11,138.3 9,693.1
Effect of exchange rate changes on balances held in foreign currencies (44.0) 98.5 142.5
Cash and cash e quivale nts at e nd pe riod 1,9 27.5 7,552.8 5,6 25.3
CAP EX (4,700.6 ) (3,312.5) 1,388.1
34
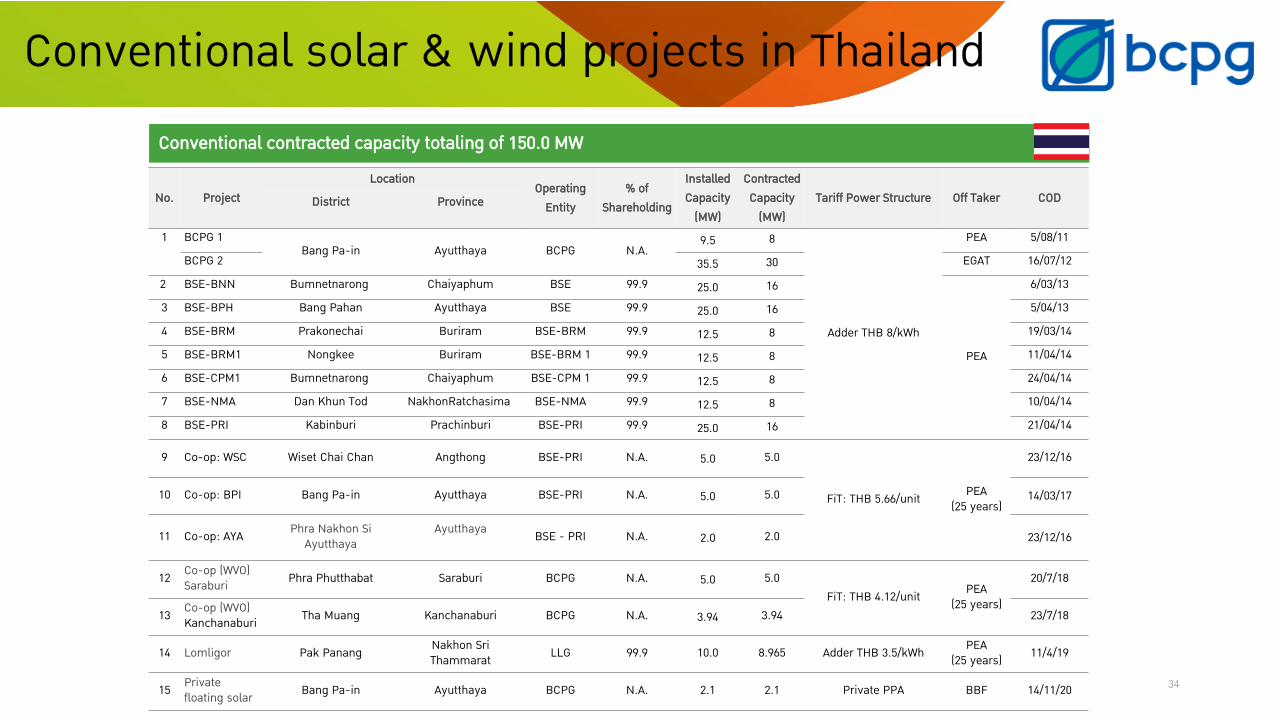
No. ProjectLocation
Operating Entity
% of Shareholding
Installed Capacity
(MW)
Contracted Capacity
(MW)Tariff Power Structure Off Taker CODDistrict Province
1 BCPG 1Bang Pa-in Ayutthaya BCPG N.A.
9.5 8
Adder THB 8/kWh
PEA 5/08/11BCPG 2 35.5 30 EGAT 16/07/12
2 BSE-BNN Bumnetnarong Chaiyaphum BSE 99.9 25.0 16
PEA
6/03/133 BSE-BPH Bang Pahan Ayutthaya BSE 99.9 25.0 16 5/04/134 BSE-BRM Prakonechai Buriram BSE-BRM 99.9 12.5 8 19/03/145 BSE-BRM1 Nongkee Buriram BSE-BRM 1 99.9 12.5 8 11/04/146 BSE-CPM1 Bumnetnarong Chaiyaphum BSE-CPM 1 99.9 12.5 8 24/04/147 BSE-NMA Dan Khun Tod NakhonRatchasima BSE-NMA 99.9 12.5 8 10/04/148 BSE-PRI Kabinburi Prachinburi BSE-PRI 99.9 25.0 16 21/04/14
9 Co-op: WSC Wiset Chai Chan Angthong BSE-PRI N.A. 5.0 5.0
FiT: THB 5.66/unit PEA(25 years)
23/12/16
10 Co-op: BPI Bang Pa-in Ayutthaya BSE-PRI N.A. 5.0 5.0 14/03/17
11 Co-op: AYA Phra Nakhon Si Ayutthaya
Ayutthaya BSE - PRI N.A. 2.0 2.0 23/12/16
12 Co-op (WVO)Saraburi Phra Phutthabat Saraburi BCPG N.A. 5.0 5.0
FiT: THB 4.12/unit PEA(25 years)
20/7/18
13 Co-op (WVO)Kanchanaburi Tha Muang Kanchanaburi BCPG N.A. 3.94 3.94 23/7/18
14 Lomligor Pak Panang Nakhon Sri Thammarat LLG 99.9 10.0 8.965 Adder THB 3.5/kWh PEA
(25 years) 11/4/19
15 Private floating solar Bang Pa-in Ayutthaya BCPG N.A. 2.1 2.1 Private PPA BBF 14/11/20
Conventional contracted capacity totaling of 150.0 MW
Conventional solar & wind projects in Thailand
35
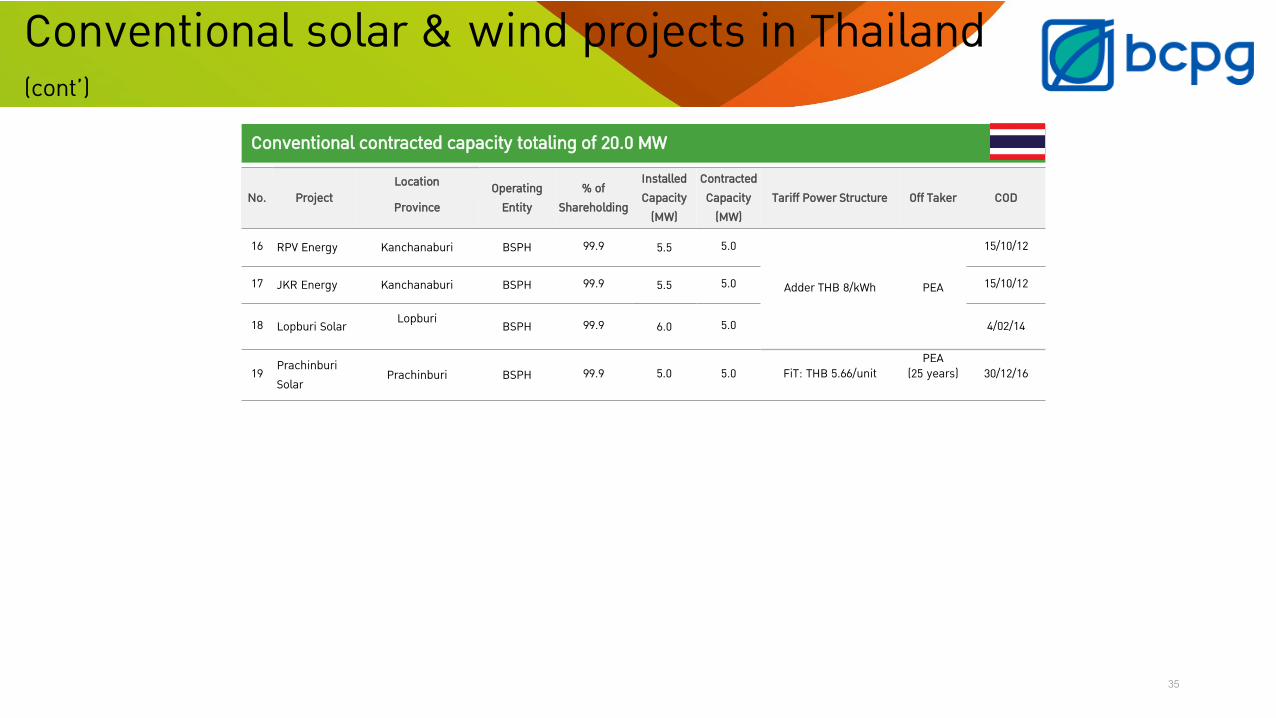
No. ProjectLocation Operating
Entity% of
Shareholding
Installed Capacity
(MW)
Contracted Capacity
(MW)Tariff Power Structure Off Taker COD
Province
16 RPV Energy Kanchanaburi BSPH 99.9 5.5 5.0
Adder THB 8/kWh PEA
15/10/12
17 JKR Energy Kanchanaburi BSPH 99.9 5.5 5.0 15/10/12
18 Lopburi Solar Lopburi BSPH 99.9 6.0 5.0 4/02/14
19 Prachinburi Solar
Prachinburi BSPH 99.9 5.0 5.0 FiT: THB 5.66/unitPEA
(25 years) 30/12/16
Conventional contracted capacity totaling of 20.0 MW
Conventional solar & wind projects in Thailand(cont’)
36
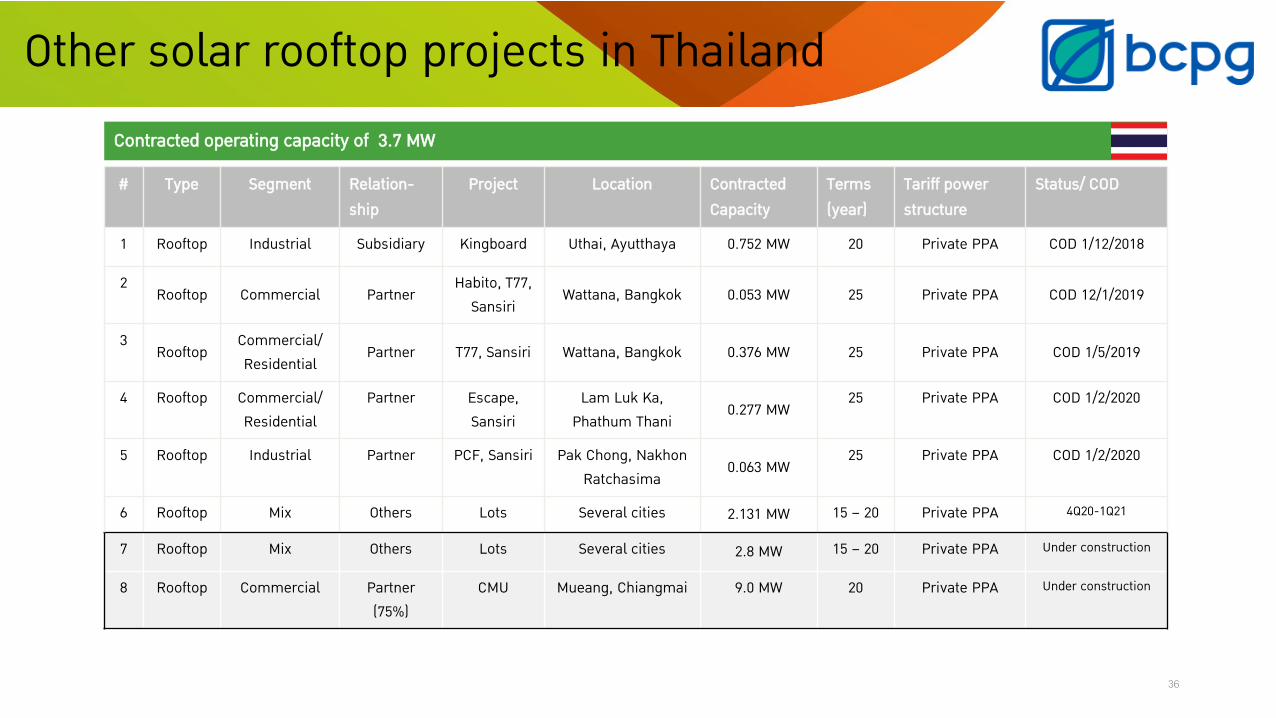
Contracted operating capacity of 3.7 MW
# Type Segment Relation-ship
Project Location Contracted Capacity
Terms (year)
Tariff power structure
Status/ COD
1 Rooftop Industrial Subsidiary Kingboard Uthai, Ayutthaya 0.752 MW 20 Private PPA COD 1/12/2018
2Rooftop Commercial Partner
Habito, T77, Sansiri
Wattana, Bangkok 0.053 MW 25 Private PPA COD 12/1/2019
3Rooftop
Commercial/Residential
Partner T77, Sansiri Wattana, Bangkok 0.376 MW 25 Private PPA COD 1/5/2019
4 Rooftop Commercial/Residential
Partner Escape, Sansiri
Lam Luk Ka, Phathum Thani
0.277 MW25 Private PPA COD 1/2/2020
5 Rooftop Industrial Partner PCF, Sansiri Pak Chong, Nakhon Ratchasima
0.063 MW25 Private PPA COD 1/2/2020
6 Rooftop Mix Others Lots Several cities 2.131 MW 15 – 20 Private PPA 4Q20-1Q21
7 Rooftop Mix Others Lots Several cities 2.8 MW 15 – 20 Private PPA Under construction
8 Rooftop Commercial Partner (75%)
CMU Mueang, Chiangmai 9.0 MW 20 Private PPA Under construction
Other solar rooftop projects in Thailand
37
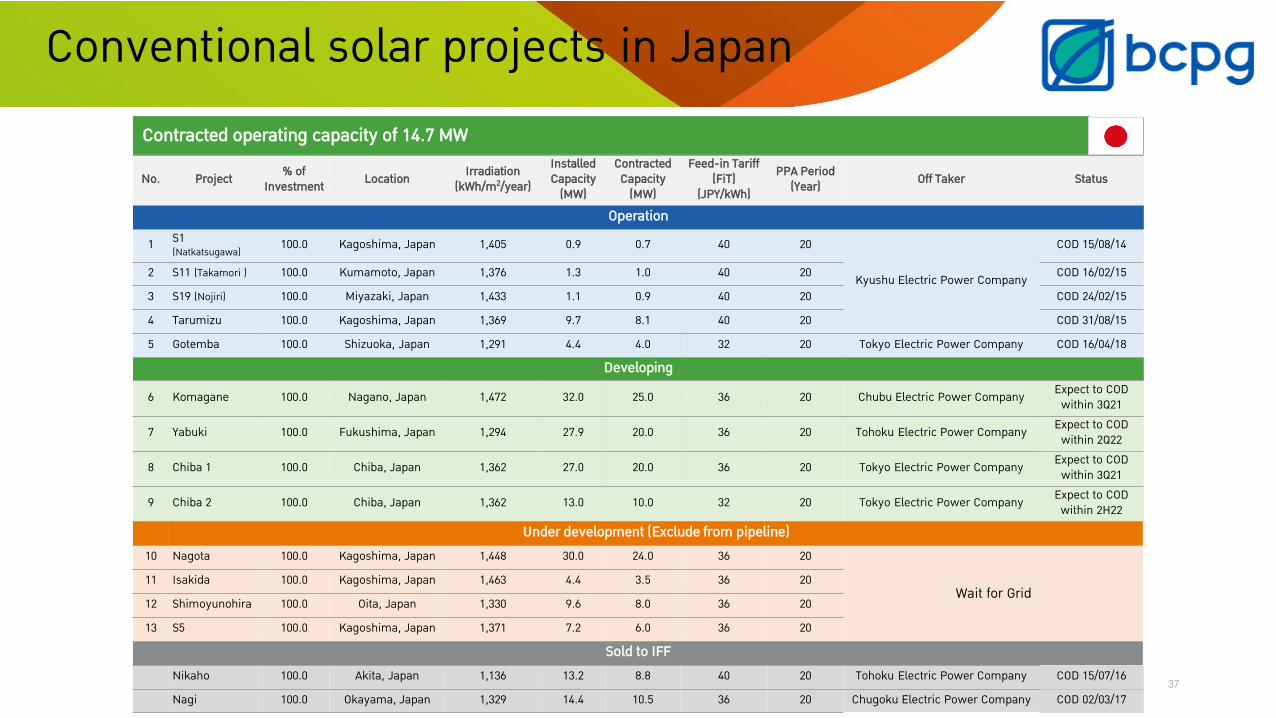
Contracted operating capacity of 14.7 MW
37
No. Project % ofInvestment Location Irradiation
(kWh/m2/year)Installed Capacity
(MW)
Contracted Capacity
(MW)
Feed-in Tariff (FiT)
(JPY/kWh)PPA Period
(Year) Off Taker Status
Operation1 S1
(Natkatsugawa) 100.0 Kagoshima, Japan 1,405 0.9 0.7 40 20
Kyushu Electric Power Company
COD 15/08/14
2 S11 (Takamori ) 100.0 Kumamoto, Japan 1,376 1.3 1.0 40 20 COD 16/02/15
3 S19 (Nojiri) 100.0 Miyazaki, Japan 1,433 1.1 0.9 40 20 COD 24/02/15
4 Tarumizu 100.0 Kagoshima, Japan 1,369 9.7 8.1 40 20 COD 31/08/15
5 Gotemba 100.0 Shizuoka, Japan 1,291 4.4 4.0 32 20 Tokyo Electric Power Company COD 16/04/18
Developing
6 Komagane 100.0 Nagano, Japan 1,472 32.0 25.0 36 20 Chubu Electric Power Company Expect to COD within 3Q21
7 Yabuki 100.0 Fukushima, Japan 1,294 27.9 20.0 36 20 Tohoku Electric Power Company Expect to COD within 2Q22
8 Chiba 1 100.0 Chiba, Japan 1,362 27.0 20.0 36 20 Tokyo Electric Power Company Expect to COD within 3Q21
9 Chiba 2 100.0 Chiba, Japan 1,362 13.0 10.0 32 20 Tokyo Electric Power Company Expect to COD within 2H22
Under development (Exclude from pipeline)10 Nagota 100.0 Kagoshima, Japan 1,448 30.0 24.0 36 20
Wait for Grid11 Isakida 100.0 Kagoshima, Japan 1,463 4.4 3.5 36 20
12 Shimoyunohira 100.0 Oita, Japan 1,330 9.6 8.0 36 20
13 S5 100.0 Kagoshima, Japan 1,371 7.2 6.0 36 20
Sold to IFFNikaho 100.0 Akita, Japan 1,136 13.2 8.8 40 20 Tohoku Electric Power Company COD 15/07/16
Nagi 100.0 Okayama, Japan 1,329 14.4 10.5 36 20 Chugoku Electric Power Company COD 02/03/17
Conventional solar projects in Japan
38
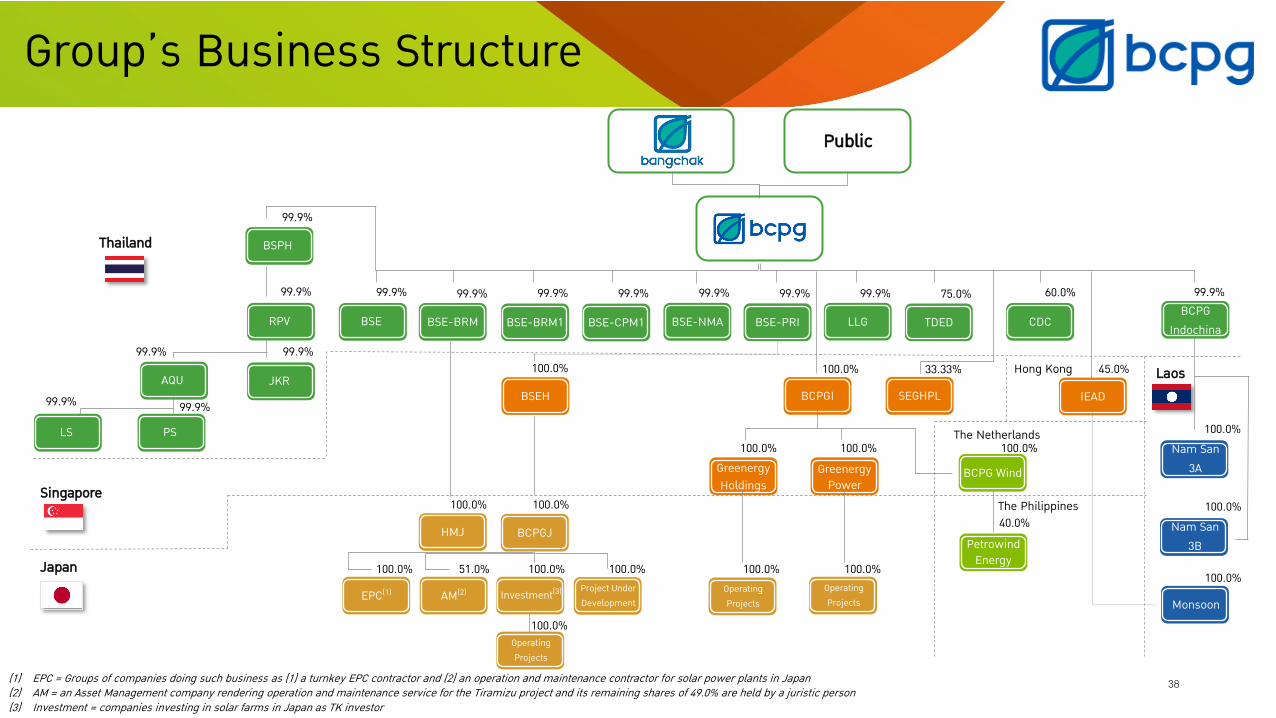
Public
BSE BSE-BRM BSE-BRM1 BSE-CPM1 BSE-NMA BSE-PRI LLG TDED
Thailand
Singapore
99.9% 99.9% 99.9% 99.9% 99.9% 99.9% 99.9% 75.0%
BSEH
100.0%
BCPGI SEGHPL
GreenergyHoldings
GreenergyPower
BCPG Wind
100.0% 100.0% 100.0%The Netherlands
JapanPetrowind
Energy
The Philippines 40.0%HMJ BCPGJ
EPC(1) AM(2) Investment(3) Project Under Development
Operating Projects
Operating Projects
Operating Projects
100.0% 100.0%
100.0% 51.0% 100.0% 100.0% 100.0% 100.0%
100.0%
(1) EPC = Groups of companies doing such business as (1) a turnkey EPC contractor and (2) an operation and maintenance contractor for solar power plants in Japan(2) AM = an Asset Management company rendering operation and maintenance service for the Tiramizu project and its remaining shares of 49.0% are held by a juristic person (3) Investment = companies investing in solar farms in Japan as TK investor
Laos
BCPGIndochina
99.9%
Nam San 3A
100.0%
IEAD
45.0%100.0% 33.33% Hong Kong
Nam San 3B
100.0%
Monsoon
100.0%
Group’s Business Structure
RPV
99.9%
JKRAQU
LS PS
99.9%99.9%
99.9% 99.9%
BSPH
99.9%
CDC
60.0%

39Survey link


![Analyst Presentation (Q1 FY2015-16) [Company Update]](https://static.fdocuments.in/doc/165x107/577cb26f1a28aba7118c046a/analyst-presentation-q1-fy2015-16-company-update.jpg)