PV SYSTEMS FOR ISRAEL'S CITIES: HOW LARGE SHOULD … · temperatures produce lower voltages) and,...
33
STATE OF ISRAEL Ministry of National Infrastructures Research and Development Division PV SYSTEMS FOR ISRAEL'S CITIES: HOW LARGE SHOULD THEY BE? A Design Guide Prof. D. Faiman, Dr. D. Feuermann, Dr. P. Ibbetson, Mr. B. Medwed and Prof. A. Zemel DEPARTMENT OF SOLAR ENERGY AND ENVIRONMENTAL PHYSICS THE JACOB BLAUSTEIN INSTITUTE FOR DESERT RESEARCH BEN-GURION UNIVERSITY OF THE NEGEV SEDE BOQER CAMPUS, 84990 ISRAEL Dr. A. Ianetz, Dr. V. Liubansky and Dr. I. Seter RESEARCH, DEVELOPMENT AND ENGINEERING BRANCH THE METEOROLOGICAL SERVICE BET DAGAN, 50250 ISRAEL Dr. S. Souraqui SOLAR ENERGY DEPARTMENT THE NATIONAL PHYSICAL LABORATORY GIVAT RAM CAMPUS, JERUSALEM 91904 ISRAEL Research funded under contract No. 98-1-101/98-11-015 OCTOBER 2000 RD-24-99
Transcript of PV SYSTEMS FOR ISRAEL'S CITIES: HOW LARGE SHOULD … · temperatures produce lower voltages) and,...

STATE OF ISRAEL Ministry of National Infrastructures Research and Development Division
PV SYSTEMS FOR ISRAEL'S CITIES: HOW LARGE SHOULD THEY BE?
A Design Guide
Prof. D. Faiman, Dr. D. Feuermann, Dr. P. Ibbetson, Mr. B. Medwed and Prof. A. Zemel
DEPARTMENT OF SOLAR ENERGY AND ENVIRONMENTAL PHYSICS
THE JACOB BLAUSTEIN INSTITUTE FOR DESERT RESEARCH BEN-GURION UNIVERSITY OF THE NEGEV
SEDE BOQER CAMPUS, 84990 ISRAEL
Dr. A. Ianetz, Dr. V. Liubansky and Dr. I. Seter
RESEARCH, DEVELOPMENT AND ENGINEERING BRANCH THE METEOROLOGICAL SERVICE
BET DAGAN, 50250 ISRAEL
Dr. S. Souraqui
SOLAR ENERGY DEPARTMENT THE NATIONAL PHYSICAL LABORATORY
GIVAT RAM CAMPUS, JERUSALEM 91904 ISRAEL
Research funded under contract No. 98-1-101/98-11-015
OCTOBER 2000 RD-24-99

PV SYSTEMS FOR ISRAEL'S CITIES: HOW LARGE SHOULD THEY BE?
A DESIGN GUIDE
A Special Report Submitted to the Ministry of National Infrastructures Under contract no. 98-1-101/98-11-015
Professor D. F aiman, Dr. D. F euermann, Dr. P. Ibbetson,
Mr. B. Medwed, Prof A Zemel Department of Solar Energy and Environmental Physics
The Jacob Blaustein Institute for Desert Research Ben-Gurion University of the Negev
Dr. A. Ianetz, Dr. V. Liubansky and Dr. I. Seter
Research, Development and Engineering Branch, The Meteorological Service
Dr. S. Souraqui
Solar Energy Department, National Physical Laboratory
October 2000
EXECUTIVE SUMMARY
Tables are presented showing the predicted hourly amounts of electricity to be expected from photovoltaic systems located on the roofs or walls of buildings in Israel's five principal cities: Haifa, Tel Aviv, Jerusalem, Beersheba and Eilat. For Jerusalem (the median city), a south-facing PV array, tilted at 30 degrees to the horizontal is expected to be capable of generating 1600 kWh of DC energy per year for each 1 kWp of modules. For the case of Tel Aviv, tables are also given for a variety of tilt angles from horizontal through vertical, and for orientations from east- facing, southward, through west-facing. Examples of the use of these tables, for a number of optimization problems, are given in the text. An appendix gives a number of ancillary pieces of information. These include: Meteorological summary sheets for the 5 cities; A comparison of the use of "Typical Meteorological Year" data files with data files from years having extremely low and extremely high solar radiation levels; A comparison of actual system performance with some after-the-fact computer simulations.

TABLE OF CONTENTS CHAPTER Pages 1 Introduction 1 2 Converting Wp to kWh 1 3 PV Module Characteristics 2 4 Meteorological Data 3 5 Results of the Study 3 6 Other Considerations 5 7 Conclusions 7 8 References 8
FIGURES
1 Typical I-V Curve 9 2 Tilt Angle Sensitivity 9 3a,b Azimuthal Angle Sensitivity 10 TABLES 1-16 Simulation predictions for Tel Aviv, for a variety of tilt 11-18 angles and azimuthal orientations 17 Simulation predictions for Haifa, for a south-facing array 19 tilted at 30º to the horizontal 18 Simulation predictions for Jerusalem, for a south-facing 19 array tilted at 30º to the horizontal 19 Simulation predictions for Beersheba, for a south-facing 20 array tilted at 30º to the horizontal 20 Simulation predictions for Eilat, for a south-facing array 20 tilted at 30º to the horizontal APPENDICES Tables A1-A5 Meteorological Summaries for the Five Cities 22-31 Table A6 Comparison of TMY with Extreme Year Predictions 32 Figure Al Experimental Test of some PVISRAEL Predictions 32

PV SYSTEMS FOR ISRAEL'S CITIES: HOW LARGE SHOULD THEY BE?
D. Faiman, D. Feuermann, P.lbbetson, B. Medwed and A. Zemel,
Department of Solar Energy and Environmental Physics,
Jacob Blaustein Institute for Desert Research, Ben-Gurion University of the Negev, Sede Boqer Campus, 84990 Israel.
A. Ianetz, V. Liubansky and I. Seter,
Research, Development and Engineering Branch, The Meteorological Service, Bet Dagan 50250 Israel.
S. Souraqui,
Solar Energy Department, The National Physical Laboratory, Giv'at Ram Campus, 91904 Jerusalem.
1. INTRODUCTION
A photovoltaic system consists of an array of PV modules, which generate dc electric current when sunlight strikes them; and some kind of electronic power conditioning equipment. The function of the latter might be to charge batteries for nighttime use, or to convert the dc to ac current for insertion into the grid, or some combination of the two.
A fundamental problem that faces any designer of a PV system is: How large should the PV array be? The obvious requirement would be to size the system according to the energy needs of the household but two practical problems render this a difficult task. First, as the intensity of the sunlight varies, so too does the amount of power that is produced by the PV array. For example, a PV panel will generate considerably more power when exposed to direct sunshine than it will on an overcast cloudy day. Secondly, PV module manufacturers specify the power capability of their panels in "peak watts" [Wp] - which characterize the output of the panel under special test conditions - and it is no simple matter to correlate this artificial rating with one's actual power requirements.
The purpose of the present design guide is to enable a PV designer to be able to estimate how much actual electrical energy can be expected from each 1 kWp of installed PV modules in any of the 5 principal (from the geographic view point) cities: Haifa, Tel Aviv, Jerusalem, Beersheba and Eilat.
2. CONVERTING Wp TO kWh.
The Wp is an artificial unit of power, that was designed for standardization purposes. The need for such a kind of unit arises because the power output of a PV module depends upon the intensity of light (brighter light generates larger currents), upon the temperature of the module (higher temperatures produce lower voltages) and, to a certain extent, on the spectral content of the light. For this reason, PV modules are characterized under so-called "Standard Test Conditions" (STC). These are: a light intensity of 1000 W/m², a module temperature of 25 °C and certain well-defined spectral conditions designated "AM1.5" [1]. Roughly speaking, 1000 W/m² and AM1.5 are the intensity and spectral conditions one would expect in Israel, on a cloudless day at noon, in the Negev. However, under such conditions, the module temperature would normally be considerably higher than 25 °C; perhaps 50 °C in winter and 70 °C in summer. This means that in Israel a PV module would almost never operate at conditions that approximate STC!

But this does not matter, since it is possible to calculate the actual power that a module would produce under any situation if we know its electrical characteristics and the meteorological conditions.
What we do is to first calculate the amount of solar radiation that strikes the surface of the module at any given moment [2]. This is a geometrical calculation that requires knowledge of two meteorological parameters: the direct beam and the diffuse components of the incoming solar radiation. Next we calculate the module temperature [2]. This requires knowledge of the solar radiation, the ambient temperature and the wind speed. Once we know the amount of radiation falling on the module and the temperature of the latter, then the electrical characteristics of the module enable us to calculate the actual power it delivers at that moment.
In practice, meteorological data are usually available in the form of hourly averages. We thus, in effect, calculate the average power (in W), delivered each hour, or equivalently, the total energy for that hour (in Wh). These hourly totals may be summed on an annual basis. Alternatively, if electricity tariffs vary at different times of the day, different days of the week, different seasons of the year, then the hourly energy values can be converted to monetary units and appropriate sums can be carried out in order to enable the system designer to develop an idea as to how cost-effective the PV system will be. For carrying out the energy calculations, we have made use of the PVISRAEL code [3]. 3. PV MODULE CHARACTERISTICS
Most of the PV modules that were commercially available during the 1990s were fabricated from solar cells of one of two types: monocrystalline or polycrystalline silicon (respectively c-Si and pX-Si). Modules of amorphous silicon (a-Si) cells had also been introduced but the first commercially-available batches of the latter turned out to have poor stability. During the first decade of the 2000s, it is expected that a-Si modules of higher stability will become available and also modules fabricated from other thin-film materials such as CdTe and CuInSe2.
Fig.l shows a typical current vs. voltage characteristic for a PV module [4]. In the case of c- Si and pX-Si, the output current is directly proportional to the intensity of the incident radiation, and highly linear over the range 0 to well beyond 1000 W/m². The output current varies only slightly with temperature, typically increasing approximately 1 mA/°C. By contrast, the voltage is relatively independent of the light intensity but it is very sensitive to temperature, decreasing by typically 2.2 mV/°C per cell. Thus, a 50 Wp module, fabricated from 36 individual PV cells in series, would have a typical voltage temperature coefficient of about -80 mV/°C but a current temperature coefficient of only 1 mA/°C, or thereabouts.
We have performed several simulations using the electrical characteristics of modules fabricated from both c-Si and pX-Si cells. Even though the efficiency of the latter tends to be about 20% lower than that of the former (i.e. unit area of pX-Si modules tends to have a lower power rating than an equivalent area of c-Si modules), the simulations give extremely similar results for the two types of material, provided the simulations are normalized to equal amounts of Wp. This is the reason that the design tables presented in this report are normalized to 1 kWp of PV modules. In this manner we do not have to present tables for each different brand and type of module. The tables are also more convenient to use in this form because module manufacturers usually quote prices in $/Wp. Hence, if one is interested in building a 10 kWp PV system the amount of energy to be expected is simply 10 times the amount indicated in the appropriate 1 kWp table.
As to the expected performance of modules employing a-Si and other thin-film materials, we have not included tables in the present (first) edition of this guide because their electrical characteristics are still the subject of study. However, if they turn out to be stable and substantially different from c-Si and pX-Si modules, appropriate tables will be supplemented in a future edition. In any event, we expect c-Si and pX-Si to remain the dominant PV module types that will be commercially available in the near term.
4. METEOROLOGICAL DATA
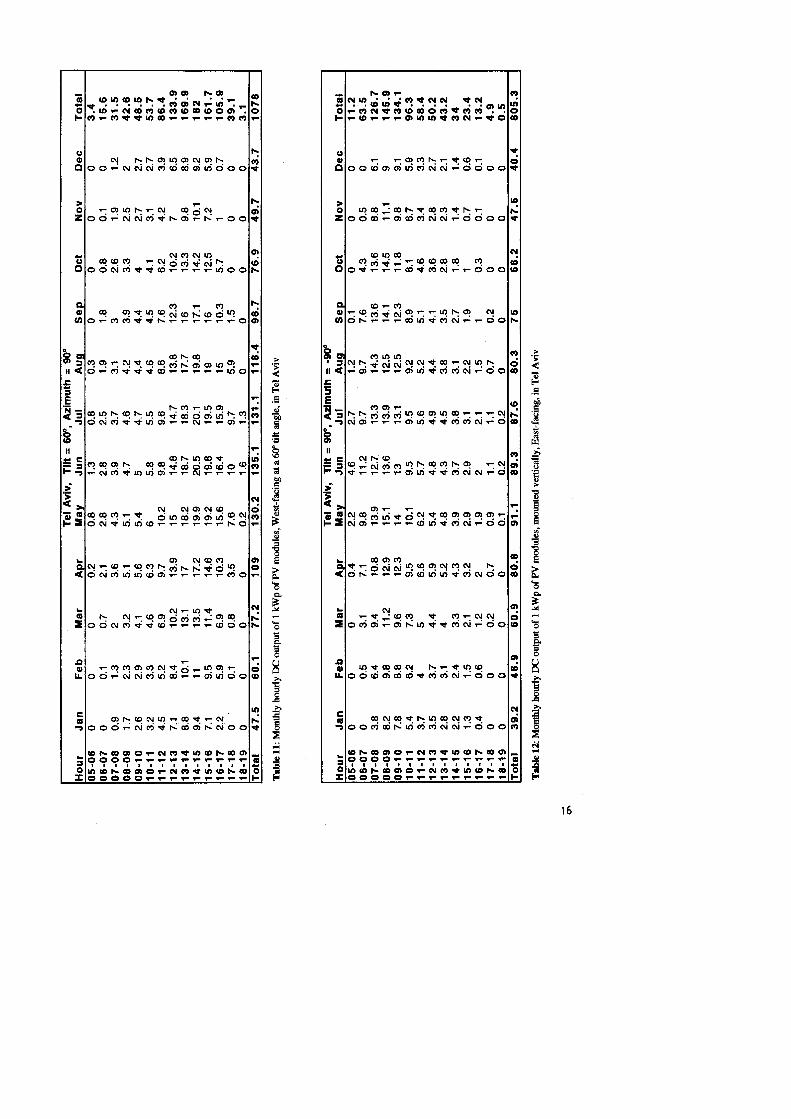
As indicated above, four meteorological parameters are needed for these simulations: direct beam radiation, diffuse radiation, ambient temperature and wind speed. Since these parameters vary from moment to moment, some kind of representative average is needed. For such purposes, solar energy system designers have invented the concept of a Typical Meteorological Year (TMY). This is a data file comprised of 12 actual months of data. However, the months of the "Typical" year are not necessarily selected from the same calendar year. Instead, for each month, that year is selected whose data fall closest to the median of all years for which there are data. In this way, each month of data is typical in the sense of not being either anomalously high or low as regards the parameters of interest. In the past we have constructed TMY files, as part of the Negev Radiation Survey, for several sites in the Negev, including Beersheba and Eilat [5]. However, that survey does not include locations outside the Negev. For the present study, data were made available for Jerusalem, Tel Aviv and Haifa, for the five-year period 1994-1998. For this reason, it was decided to construct new TMY-style files for Beersheba and Eilat but using the same 5-year data set as was available for the non-Negev cities. For this reason, the present data files are here referred to as "Typical Photovoltaic Year" (TPVY) files. Summary tables of the TPVY files, in similar format to our more familiar TMY files are included as an appendix to the present guide (Tables Ala, Alb, A2a, ... A5a, A5b).
5. RESULTS OF THE STUDY
In preparing the tabulated results of our computer calculations, we have decided to deal exclusively with the DC output of such an array. The reason for this is that the PV array might be used for any of several different purposes (e.g. grid-connection via an inverter, battery charging, some industrial process requiring DC power, etc.), each of which would require DC power as its input. If the DC power is subsequently converted to AC, then the efficiency of the inverter must be taken into consideration. This would typically reduce the tabulated numbers by approximately 15%.
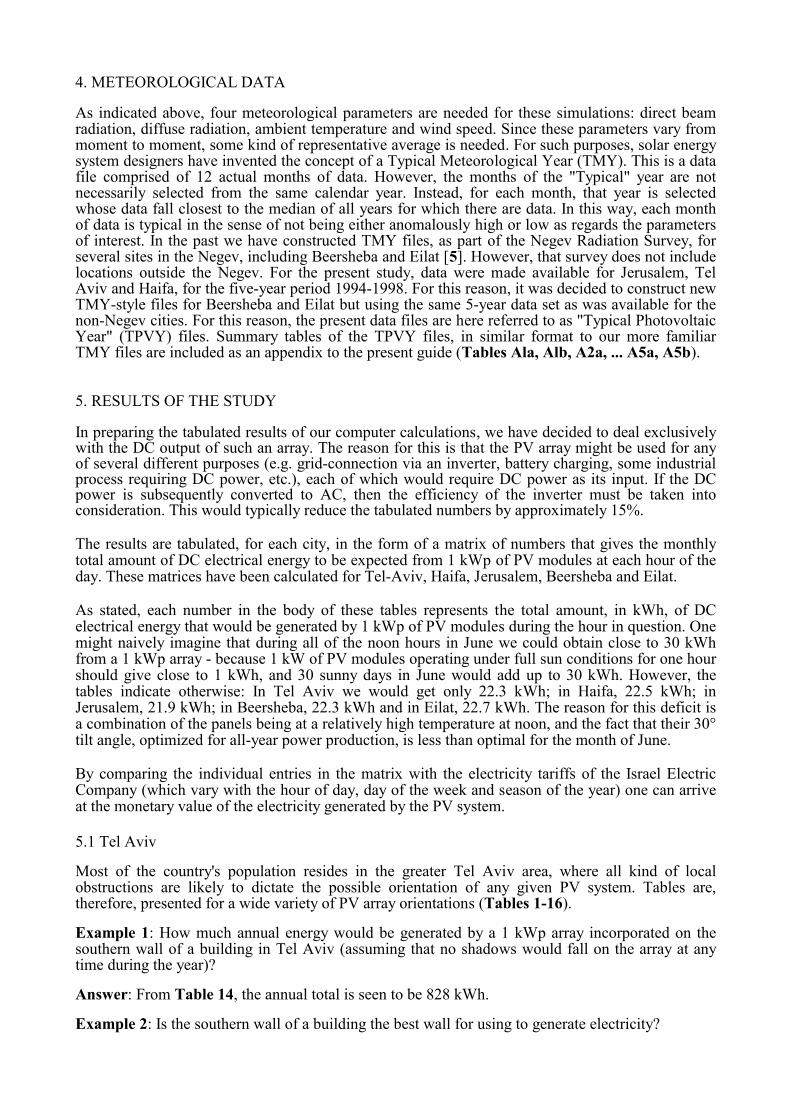
The results are tabulated, for each city, in the form of a matrix of numbers that gives the monthly total amount of DC electrical energy to be expected from 1 kWp of PV modules at each hour of the day. These matrices have been calculated for Tel-Aviv, Haifa, Jerusalem, Beersheba and Eilat.
As stated, each number in the body of these tables represents the total amount, in kWh, of DC electrical energy that would be generated by 1 kWp of PV modules during the hour in question. One might naively imagine that during all of the noon hours in June we could obtain close to 30 kWh from a 1 kWp array - because 1 kW of PV modules operating under full sun conditions for one hour should give close to 1 kWh, and 30 sunny days in June would add up to 30 kWh. However, the tables indicate otherwise: In Tel Aviv we would get only 22.3 kWh; in Haifa, 22.5 kWh; in Jerusalem, 21.9 kWh; in Beersheba, 22.3 kWh and in Eilat, 22.7 kWh. The reason for this deficit is a combination of the panels being at a relatively high temperature at noon, and the fact that their 30° tilt angle, optimized for all-year power production, is less than optimal for the month of June.
By comparing the individual entries in the matrix with the electricity tariffs of the Israel Electric Company (which vary with the hour of day, day of the week and season of the year) one can arrive at the monetary value of the electricity generated by the PV system.
5.1 Tel Aviv
Most of the country's population resides in the greater Tel Aviv area, where all kind of local obstructions are likely to dictate the possible orientation of any given PV system. Tables are, therefore, presented for a wide variety of PV array orientations (Tables 1-16).
Example 1: How much annual energy would be generated by a 1 kWp array incorporated on the southern wall of a building in Tel Aviv (assuming that no shadows would fall on the array at any time during the year)?
Answer: From Table 14, the annual total is seen to be 828 kWh.
Example 2: Is the southern wall of a building the best wall for using to generate electricity?

Answer: Only in winter. Perusal of Tables 12-16 indicates that SE- and SW-facing walls would generate more power on an annual basis than a S-facing wall.
Perusal of these Tel Aviv tables reveals that the orientation which provides maximum energy throughout the year is south-facing at a tilt angle of 30°. This would generally be the optimal orientation except that specific circumstances might dictate otherwise. We have already indicated the possibility that shading by nearby buildings and other obstructions might force the designer to orientate a given PV array in a non-optimal manner. However, there are cases for which 30° is itself non-optimal. For example, a PV system needed for outdoor lighting all year, would best have a considerably steeper tilt than 30°, in order to neutralize the effect of longer winter nights coupled with less available solar radiation.
Example 3: What is the optimal tilt angle for a south-facing PV array on the roof of a school?
Answer: The school is not used during the months of July and August. Therefore, if PV- generated power could not be used during these months, Table 4 indicates that the annual useful energy generated by a 30°-tilted array in Tel Aviv would be 1562.1 - 157.2 – 153.4 ~ 1250 kWh.
On the other hand, a 60°-tilted array would (from Table 9) generate 1318.6 - 102.6 – 112.5 ~1100 kWh of useful energy. Since this is less than the 30° tilt situation, we conclude that 60° is not to be preferred.
In order to find the truly optimal array orientation for any specific situation, it may be necessary to interpolate between the results given in our tables. For example, Fig.2 shows the variation of annual energy with tilt angle for a 1 kWp south-facing array in Tel Aviv. Similar interpolation curves can be constructed for the individual months in Tables 1, 4, 9 and 14, allowing the interested reader to complete the optimization problem posed in Example 3.
Similarly, Fig. 3a and 3b show the variation of annual energy with azimuth angle for a 1 PV array on a vertical wall in Tel Aviv.
5.2 Haifa, Jerusalem, Beersheba and Eilat
In order to minimize an already large number of tables, we present only the 30° S-facing tables for Haifa, Jerusalem, Beersheba and Eilat (Tables 17-20), i.e. those giving the hourly expected energy for a PV array having optimal orientation for all-year operation. For situations, in those cities, for which other orientations are desired, the Tel Aviv tables may be used in conjunction with the 30° S-facing table for the city in question.
Example 4: How much annual energy would be produced by a horizontal PV array in Haifa.
Answer: We turn first to the Tel Aviv Tables 1 and 4, and discover that a horizontal array in Tel Aviv (1422 kWh annual) produces 91% of a 30° S-facing array (1562 kWh annual).
Since (from our various simulations) these ratios turn out to be largely site-independent in Israel, we may turn to the 30° S table for Haifa (Table 17) and take 91 % of its annual total (1517 kWh), yielding the required result of 1380 kWh per year.
Example 5: In Jerusalem your annual electricity requirements amount to 6,000 kWh. What percentage of this could be met by a 3 kWp PV array on your roof? Answer: From Table 18, each 1 kWp of 30°-tilted, south-facing PV modules, would generate 1600 kWh of DC electricity per year. This figure should be reduced by typically 15% to allow for dc->ac inverter losses, giving 1360 kWh AC. A 3 kWp PV system would, therefore, produce 4080 kWh per year = 68% of your needs.

6. OTHER CONSIDERATIONS 6.1 Accuracy of the Simulations There are two aspects of the accuracy question. One is; how accurately can PVISRAEL simulate the performance of a PV system, after the fact. That is to say; if, on the one hand, we were to monitor the actual annual performance of a PV system, and then feed into PVISRAEL the concomitantly measured meteorological conditions and system parameters, how well would the predictions agree with performance? The second question is a statistical one: How reliable are predictions that are based on a TPVY file of meteorological data? That is to say, if we design a system using a TPVY file (i.e. the tables printed here), how bad a surprise might we receive from poor system performance in an actual year? To answer the first question, we present a month-by-month comparison of measured performance for an actual set of south-facing PV systems at Sede Boqer, tilted at 30 deg to the horizontal, during the 1-year period June 1999 through May 2000, with after-the-fact PVISRAEL simulations. Input to the PVISRAEL code consists of actual monitored meteorological data (global horizontal irradiance, normal direct beam irradiance, ambient temperature and wind speed) and actual measured PV module electrical parameters. The system performance data consist of the average over 10 independent "mini" power plants that were monitored on an hourly basis for that same entire year. Each plant consisted of 2 PV panels, of measured 39.3 Wp (average) specifications, connected in series to a 100 W inverter of nominal efficiency 95%. It should be emphasized that all 10 systems gave similar outputs to one another to within an average spread of ±1.5%. The results of this comparison are shown in Fig. A1. From Fig. A1, one sees that the PVISRAEL monthly predictions tend to be low by approximately 10% compared to measured system performance. The annual prediction for each system is 137 kWh whereas the systems generated, on average, 149 kWh during the year. This, of course, is only a single test of PVISRAEL but it is a relatively comprehensive one in that it covers an entire year, and the experimental uncertainties are relatively small. We would therefore tentatively conclude that the predictions of the tables in this report are conservative by approximately 10% on an annual basis.
Regarding year-to-year statistical variations in climatic parameters, we have run PVISRAEL for a number of extreme years for which we have meteorological data. Specifically, we used data from the "radiation-poor" year 1992, which followed the burning oil wells during the 1991 Gulf War and the eruption of Mt. Pinetubo in the Philippines that same year. We also used the highest "radiation rich" year that we have on record, 1999. Table A6 shows a month-by-month comparison between the monthly PVISRAEL predictions based on a Sede Boqer TMY file and the predictions based on the data from these extreme years.
From Table A6, one sees that if the TMY data file had been used for predicting system performance for the years 1992 or 1999, some individual month predictions would have been wrong by up to 27%. However, the predicted annual total would only have been in error by approximately 5%.
6.2 Reliability of PV Module Specifications
Careful tests carried out at the National Solar Energy Center, Sede Boqer, on a large variety of PV modules, fabricated by major manufacturers in various parts of the world, indicate a tendency for manufacturers to over-specify the power rating of their modules. This over- rating probably arises from differences between the tests that manufacturers perform in solar simulators (using artificial light sources) and tests performed with real sunshine. In some cases, differences of up to 20% have

been found [6]. In the case of our PVISRAEL simulations it is assumed that 1 kWp really is 1 kWp. Most manufacturers sell modules by the kWp and will make up any proven deficit by providing additional modules. However, it is up to the customer to prove that his/her PV modules are under-powered and, in the case of a roof-mounted system, it is necessary for the roof to have enough space to accommodate any additional modules that may be needed in order to bring the system up to its specified power.
6.3 System Reliability
The annual predictions presented in the tables assume that the PV system will operate, with no breakdowns, throughout the year. In practice, the PV module components tend to be very reliable these days. More than 20 years of manufacturing experience have led to increasingly improved products and it is probably no idle dream to expect 20 years of continuous high performance from modern PV modules.
Unfortunately, progress in improving the reliability of the auxiliary electronics, e.g. inverters, has been slower. In a recent one-year study of several modern inverters, conducted at the Ben-Gurion National Solar Energy Center, most of them operated in a completely fault-free manner for the entire year. People who are enthusiastic about the future of PV systems will see this as an example of the "half-full cup", but a customer who purchases a system that fails will probably see mainly the "empty half”! The point to emphasize, however, is that system economics depend critically upon system performance. Thus a prospective user of PV would be well advised to insure that the contract he/she negotiates with a PV supplier guarantees the speedy replacement of parts which break down.
6.4 Economic considerations
In the 30, or so, years since PV modules first appeared on the domestic market, their cost has fallen considerably. Furthermore, costs will almost certainly continue to fall. However, at the present time, electric power generated in this manner is considerably more expensive than purchasing electricity from the Israel Electric Corporation. As a concrete example, detailed studies performed for a potential large PV plant at Kibbutz Samar in the Negev indicate that the initial investment would be equivalent to an electricity cost of 30¢/kWh over an assumed 20 year system lifetime [7]. However, a straight cost comparison between PV and grid power can be misleading. First, there are many situations in which grid power is unavailable and there are other situations in which, although available, grid power is more expensive. A simple example of the latter is the case of parking meters in many European cities. Here, it turns out to be less costly to power each parking meter with a small PV panel than to provide each meter with a connection to the grid. Secondly, experience in many European countries has demonstrated that the public is willing to pay more money for environmentally clean electricity. Switzerland is a good example. There, the voluntary excess money added by the public to their monthly electricity bills is used to construct additional PV power plants.
How much does it cost to generate PV power today?
In Europe and the USA one can purchase a 100 Wp PV panel for approximately $300. One can purchase a 100 W "mini" inverter for approximately $150. So, for $450 one has a mini power plant that may literally be plugged into the wall. The panel would be placed in a window or on the roof and the electricity would enter the grid via the regular grid connection of the house.
How would such electricity be accounted for?
There are two basic possibilities, both of which are used in various parts of the world. The first is to allow the electricity meter of the house to run backward when a net flow of electricity is occurring

into the grid. The other method is to use two meters in order to monitor separately, electricity sold to the grid and electricity purchased from the grid.
How much electrical energy would such a system produce?
The answer can be calculated from the tables in the following pages!
7. CONCLUSIONS
If we look at the annual totals in Tables 1-5 we find that the DC output of a 1 kWp PV array increases from a minimum in Haifa (1520 kWh per year), through Tel-Aviv (1560 kWh per year), Jerusalem (1600 kWh per year), Beersheba (1640 kWh per year), to a maximum in Eilat (1700 kWh per year). We notice that Jerusalem is both the median and the average, and that the annual outputs of PV arrays in the other cities would deviate from the output of a similar array in Jerusalem by ±6% at most. This major result reflects the relatively small geographic size of the State of Israel and is a boon to PV system designers in that a given-size PV system will produce more-or-less the same amount of annual energy anywhere in the country, i.e. about 6% less than the average in Haifa and about 6% more than the average in Eilat.
The tables have been printed with one more significant figure than is strictly meaningful. This is to remove the danger of cumulative rounding errors in calculations of the kind given in the above examples. After such calculations are complete it is sufficient to round the end results to 3 significant figures. These results enable a designer to estimate the optimal orientation for any specific requirement, to take into account local constraints that may prevent an optimally oriented system, and to calculate the energy penalty (and hence the economic penalty) of non-optimal system orientation.
It will not have escaped the notice of the observant reader that the Tel-Aviv tables are not perfectly east-west symmetric (as illustrated graphically by Figs. 3a and 3b). This is probably related to the close proximity of Tel-Aviv (actually Bet Dagan) to the sea, and the associated east-west asymmetry of clouds. Different, but comparable differences are to be expected for Jerusalem, where the arid Judean Desert begins immediately to the east of the city. However, quantitatively, these east-west asymmetries are only a few percent of the mean, and well within the overall typical ±10% uncertainty we associate with these monthly predictions.
8. REFERENCES
[1] International Standard CEI/IEC 904-3: Photovoltaic devices, Part 3; Measurement principles for terrestrial photovoltaic (PV) solar devices with reference spectral irradiance data, (1989). [2] A. Rabl, Active Solar Collectors and Their Applications (Oxford University Press, New York, etc., 1985). [3] J.M. Gordon and H.J. Wenger, PVISRAEL: A user-friendly PC software package for predicting utility intertie photovoltaic system performance, in Solar World Congress, Vol .1 eds. M.E. Arden et al (Pergamon Press, Oxford, 1991) pp 111-116. [4] D. Berman, S. Biryukov and D. Faiman, Solar Energy Materials and Solar Cells 36 (1995) 421-432. [5] D. Faiman, D. Feuermann, P. Ibbetson, A. Zemel, A. Ianetz, A. Israeli, V. Liubansky and I. Seter, Data processing for the Negev radiation survey: Fifth year: Part 3 - Typical Meteorological Year v 2.1 Israel Ministry of Energy and Infrastructure publication RD-15-98 (Jerusalem, March 1999). [6] D. Faiman, "Solar simulators vs outdoor module performance in the Negev Desert", in PV Radiometric Workshop Proceedings, July 24-25, 1995, Vail, CO, USA, ed. D. Myers (NREL/CP-411-20008, September 1995) pp 115-120. [7] D. Berman, D. Faiman, P. Ibbetson and H. Wenger, Preliminary studies for a 200 kW photovoltaic power plant at kibbutz Samar. Israel Ministry of Energy and Infrastructure publication RD-21-95 (Jerusalem, January 1995).


SITE: TEL AVIV YEAR: TPVY LATITUDE 32.0 N LONGITUDE 34.8 E SOLAR RADIATION ON VARIOUS TRACKING AND STATIONARY PLANE SURFACES (ASSUMES: ISOTROPIC SKY MODEL, GROUND ALBEDO = 0.30) [KWH/SQ.M/DAY] FULL TRACKING POLAR MOUNT N-S AXIS E-W AXIS TILT=LATITUDE HORIZONTAL MONTH [2 - AXES] [1 - AXIS] [1 - AXIS] [1 - AXIS] NON-TRACKING NON-TRACKING BEAM DIFF TOTAL BEAM DIFF TOTAL BEAM DIFF TOTAL BEAM DIFF TOTAL BEAM DIFF TOTAL BEAM DIFF TOTAL ____________________________________________________________________________________________________________________________________ 1/TPVY 3.18 0.83 4.20 2.97 0.96 4.04 2.23 0.96 3.29 2.68 0.86 3.72 2.43 1.04 3.52 1.46 1.12 2.59 2/TPVY 4.21 1.01 5.45 4.11 1.10 5.36 3.35 1.12 4.60 3.38 1.07 4.62 3.23 1.20 4.51 2.25 1.30 3.55 3/TPVY 4.14 1.32 5.68 4.13 1.34 5.66 3.65 1.40 5.20 3.19 1.46 4.77 3.17 1.49 4.75 2.57 1.61 4.18 4/TPVY 5.39 2.08 7.71 5.32 1.98 7.61 5.15 2.12 7.47 4.10 2.35 6.52 3.97 2.25 6.37 3.82 2.44 6.25 5/TPVY 7.08 1.73 9.04 6.71 1.59 8.68 6.98 1.74 8.94 5.39 1.95 7.38 4.78 1.85 6.80 5.24 2.01 7.24 6/TPVY 7.82 1.57 9.62 7.20 1.42 9.03 7.73 1.57 9.53 6.02 1.76 7.82 4.97 1.68 6.82 5.82 1.82 7.64 7/TPVY 7.42 1.54 9.19 6.91 1.41 8.71 7.33 1.55 9.10 5.70 1.75 7.48 4.85 1.66 6.69 5.53 1.80 7.33 8/TPVY 7.07 1.23 8.53 6.87 1.16 8.36 6.87 1.25 8.32 5.28 1.41 6.73 4.94 1.34 6.43 5.03 1.45 6.49 9/TPVY 6.46 1.26 7.97 6.44 1.24 7.96 5.93 1.31 7.43 4.86 1.43 6.40 4.84 1.41 6.38 4.23 1.53 5.75 10/TPVY 5.74 0.95 6.95 5.66 1.01 6.87 4.79 1.04 5.99 4.44 1.02 5.66 4.33 1.12 5.55 3.20 1.21 4.41 11/TPVY 4.51 0.71 5.45 4.27 0.81 5.22 3.27 0.81 4.21 3.77 0.75 4.71 3.47 0.89 4.43 2.19 0.96 3.15 12/TPVY 3.90 0.63 4.73 3.59 0.74 4.43 2.61 0.74 3.44 3.35 0.65 4.18 2.97 0.80 3.82 1.71 0.87 2.57 TOTAL RADIATION FOR THE YEAR TPVY [KWH/SQ.M/YEAR] 2038 452 2573 1954 449 2494 1824 475 2360 1588 501 2131 1459 509 2011 1311 551 1862 AVG. INPUT COMPONENTS ON A TOTAL RADIATION ON TOTAL RADIATION ON TOTAL RADIATION ON MONTH DATA S-FACING SURFACE VERTICAL SURFACES 60 DEG INCLINED PLANES 30 DEG INCLINED PLANES BEAM GLOB KT BEAM DIFF REFL S W N E S W N E S W N E _________________________________________________________________________________________________________________________________ 1/TPVY 3.18 2.59 0.46 2.23 0.56 0.39 3.18 1.67 0.95 1.67 3.70 2.10 1.03 2.10 3.48 2.43 1.30 2.43 2/TPVY 4.21 3.55 0.51 2.50 0.65 0.53 3.68 2.24 1.18 2.23 4.53 2.85 1.24 2.84 4.48 3.32 2.00 3.33 3/TPVY 4.14 4.18 0.49 1.87 0.80 0.63 3.30 2.52 1.43 2.53 4.42 3.29 1.52 3.25 4.74 3.89 2.88 3.88 4/TPVY 5.39 6.25 0.62 1.41 1.22 0.94 3.57 3.70 2.18 3.47 5.41 4.92 3.00 4.61 6.40 5.90 5.01 5.68 5/TPVY 7.08 7.24 0.65 0.85 1.00 1.09 2.94 4.24 2.31 3.74 5.26 5.67 4.12 5.10 6.87 6.87 6.23 6.44 6/TPVY 7.82 7.64 0.66 0.50 0.91 1.15 2.56 4.46 2.54 3.82 4.98 6.03 4.83 5.24 6.92 7.31 6.88 6.71 7/TPVY 7.42 7.33 0.65 0.64 0.90 1.10 2.64 4.23 2.35 3.73 4.99 5.71 4.41 5.11 6.77 6.95 6.47 6.49 8/TPVY 7.07 6.49 0.62 1.36 0.73 0.97 3.06 3.86 1.80 3.40 5.21 5.17 3.00 4.57 6.48 6.18 5.21 5.75 9/TPVY 6.46 5.75 0.63 2.37 0.76 0.86 4.00 3.53 1.63 3.18 5.74 4.64 1.77 4.20 6.38 5.48 4.01 5.16 10/TPVY 5.74 4.41 0.59 3.05 0.60 0.66 4.32 2.85 1.27 2.68 5.48 3.65 1.24 3.44 5.51 4.20 2.47 4.05 11/TPVY 4.51 3.15 0.53 3.04 0.48 0.47 4.00 2.00 0.95 1.96 4.69 2.55 0.96 2.52 4.38 2.96 1.38 2.92 12/TPVY 3.90 2.57 0.49 2.86 0.43 0.39 3.68 1.66 0.82 1.65 4.18 2.10 0.84 2.09 3.77 2.42 1.01 2.41 TOTAL RADIATION FOR THE YEAR TPVY [KWH/SQ.M/YEAR] 2038 1862 689 275 279 1244 1125 591 1036 1782 1483 853 1372 2015 1764 1367 1682 NUMBER OF MISSING DAYS JAN FEB MAR APR MAY JUN JUL AUG SEP OCT NOV DEC 0 0 0 0 0 0 0 0 0 0 0 0

CLIMATOLOGICAL DATA FOR TEL AVIV TPVY Latitude = 32.0 N Longitude = 34.8 E Elevation = 50m Jan Feb Mar Apr May Jun Jul Aug Sep Oct Nov Dec Ann TEMPERATURE [DegC] mean 12.7 13.9 14.8 20.0 20.8 21.7 26.0 26.1 25.6 21.9 19.3 14.8 19.8 max obs hourly avg 24.3 27.2 28.7 41.1 33.5 34.7 33.2 32.6 33.4 35.9 30.7 26.9 41.1 min obs hourly avg 3.3 5.7 5.9 8.2 9.5 10.8 17.8 18.7 16.4 12.1 9.0 4.9 3.3 DEGREE DAYS HDD [18.3 DegC base] 175 124 115 19 6 0 0 0 0 0 8 108 555 CDD [18.3 DegC base] 0 0 5 70 83 103 239 242 220 110 38 0 1112 HUMIDITY mean 5am DBT [DegC] 8.8 9.5 10.5 14.3 15.5 16.2 27.7 21.5 20.6 16.4 14.5 11.3 15.6 mean 5am WBT [DegC] 8.1 8.6 9.1 12.2 14.7 14.3 22.3 19.9 18.8 14.7 12.8 10.3 13.8 mean 5am RH [%] 92 90 86 81 92 83 63 86 84 85 84 89 85 mean 2pm DBT [DegC] 17.5 18.5 19.0 25.8 25.1 26.5 28.1 29.8 30.1 27.0 24.6 19.6 24.3 mean 2pm WBT [DegC] 13.0 13.6 13.5 17.3 19.1 18.7 23.0 22.8 22.7 19.7 17.9 14.7 18.0 mean 2pm RH [%] 62 59 56 46 57 49 65 55 53 52 54 60 56 WIND mean speed [m/s] 2.4 2.7 3.6 2.4 2.2 2.4 2.9 2.8 2.3 2.1 2.6 3.0 2.6 max hourly speed [m/s] 9.0 9.0 12.0 13.0 6.0 8.0 7.0 7.0 7.0 6.0 9.0 11.0 13.0 prevailing direction E SE SE NW NW W W W NW E E SE prevailing occurence [%] 23 21 22 18 27 20 27 28 18 27 23 23 SOLAR ENERGY [kWh/sq.m] horizontal global total 80 99 130 188 224 229 227 201 173 137 94 80 1862 max obs daily total 3.83 4.85 6.03 7.38 7.82 8.61 8.09 7.03 6.67 5.62 4.04 3.20 8.61 max obs hourly avg 0.62 0.72 0.85 0.99 1.00 1.04 0.99 0.93 0.90 0.80 0.66 0.53 1.04 direct beam total 98 118 128 162 220 235 230 219 194 178 135 121 2038 max obs daily total 7.50 8.60 8.64 10.06 9.52 10.07 10.16 8.47 8.48 8.79 7.26 6.88 10.16 max obs hourly avg 0.93 0.96 0.95 0.99 0.94 0.97 0.93 0.90 0.93 0.95 0.90 0.91 0.99 SUMMARY OF INCLUDED DATA % of temperature data 100 100 100 100 100 100 100 100 100 100 100 100 % of humidity ratio data 100 100 100 100 100 100 100 100 100 100 100 100 % of wind speed data 100 100 100 100 100 100 100 100 100 100 100 100 % of wind direction data 100 100 100 100 100 100 100 100 100 100 100 100 # of days of beam data 31 28 31 30 31 30 31 31 30 31 30 31 # of days of global data 31 28 31 30 31 30 31 31 30 31 30 31

SITE: JERUSALEM YEAR: TPVY LATITUDE 31.8 N LONGITUDE 35.2 E SOLAR RADIATION ON VARIOUS TRACKING AND STATIONARY PLANE SURFACES (ASSUMES: ISOTROPIC SKY MODEL, GROUND ALBEDO = 0.30) [KWH/SQ.M/DAY] FULL TRACKING POLAR MOUNT N-S AXIS E-W AXIS TILT=LATITUDE HORIZONTAL MONTH [2 - AXES] [1 - AXIS] [1 - AXIS] [1 - AXIS] NON-TRACKING NON-TRACKING BEAM DIFF TOTAL BEAM DIFF TOTAL BEAM DIFF TOTAL BEAM DIFF TOTAL BEAM DIFF TOTAL BEAM DIFF TOTAL ____________________________________________________________________________________________________________________________________ 1/TPVY 2.99 0.76 3.94 2.80 0.87 3.77 2.06 0.87 3.02 2.60 0.79 3.56 2.36 0.95 3.37 1.45 1.03 2.48 2/TPVY 4.13 1.04 5.40 4.02 1.14 5.31 3.24 1.16 4.53 3.36 1.11 4.66 3.21 1.25 4.54 2.23 1.35 3.58 3/TPVY 3.84 1.67 5.73 3.83 1.69 5.72 3.39 1.77 5.31 2.96 1.84 4.92 2.94 1.86 4.91 2.40 2.02 4.42 4/TPVY 5.74 1.97 7.95 5.66 1.88 7.85 5.50 2.01 7.70 4.39 2.22 6.67 4.26 2.12 6.53 4.10 2.30 6.40 5/TPVY 7.60 1.51 9.35 7.20 1.39 8.98 7.50 1.52 9.24 5.66 1.70 7.40 4.95 1.62 6.73 5.48 1.75 7.23 6/TPVY 9.19 0.95 10.39 8.46 0.87 9.74 9.09 0.96 10.28 6.91 1.07 8.01 5.63 1.02 6.83 6.67 1.10 7.78 7/TPVY 8.60 1.19 10.03 8.02 1.09 9.51 8.50 1.20 9.93 6.45 1.34 7.82 5.43 1.27 6.88 6.24 1.38 7.62 8/TPVY 8.22 0.96 9.43 7.98 0.91 9.24 8.01 0.98 9.20 6.14 1.11 7.30 5.72 1.06 6.94 5.88 1.15 7.02 9/TPVY 7.17 1.00 8.44 7.16 0.99 8.43 6.60 1.04 7.83 5.43 1.14 6.68 5.40 1.13 6.66 4.73 1.22 5.94 10/TPVY 5.30 1.00 6.56 5.22 1.06 6.47 4.35 1.09 5.58 4.29 1.08 5.56 4.18 1.18 5.46 3.08 1.27 4.35 11/TPVY 4.62 0.77 5.63 4.37 0.88 5.38 3.33 0.89 4.33 3.89 0.81 4.91 3.57 0.96 4.61 2.24 1.04 3.28 12/TPVY 3.71 0.58 4.49 3.41 0.69 4.20 2.44 0.68 3.22 3.26 0.60 4.04 2.90 0.75 3.70 1.70 0.81 2.51 TOTAL RADIATION FOR THE YEAR TPVY [KWH/SQ.M/YEAR] 2166 408 2658 2074 409 2575 1950 431 2442 1685 451 2177 1539 461 2043 1408 499 1907 AVG. INPUT COMPONENTS ON A TOTAL RADIATION ON TOTAL RADIATION ON TOTAL RADIATION ON MONTH DATA S-FACING SURFACE VERTICAL SURFACES 60 DEG INCLINED PLANES 30 DEG INCLINED PLANES BEAM GLOB KT BEAM DIFF REFL S W N E S W N E S W N E _________________________________________________________________________________________________________________________________ 1/TPVY 2.99 2.48 0.44 2.15 0.52 0.37 3.04 1.35 0.89 1.67 3.54 1.75 0.96 2.14 3.34 2.17 1.23 2.44 2/TPVY 4.13 3.58 0.51 2.50 0.67 0.54 3.71 2.11 1.21 2.32 4.56 2.71 1.28 2.95 4.51 3.25 2.02 3.42 3/TPVY 3.84 4.42 0.51 1.71 1.01 0.66 3.38 2.54 1.67 2.81 4.52 3.31 1.86 3.63 4.90 4.00 3.20 4.23 4/TPVY 5.74 6.40 0.63 1.48 1.15 0.96 3.59 3.48 2.12 3.78 5.52 4.67 2.99 4.99 6.56 5.78 5.09 6.02 5/TPVY 7.60 7.23 0.65 0.83 0.87 1.08 2.79 3.98 2.24 4.17 5.13 5.32 4.12 5.57 6.80 6.57 6.25 6.74 6/TPVY 9.19 7.78 0.68 0.53 0.55 1.17 2.24 4.21 2.35 4.34 4.79 5.69 4.83 5.84 6.92 7.07 7.01 7.16 7/TPVY 8.60 7.62 0.67 0.68 0.69 1.14 2.51 4.31 2.29 4.15 5.01 5.79 4.54 5.57 6.96 7.08 6.74 6.89 8/TPVY 8.22 7.02 0.67 1.49 0.57 1.05 3.12 3.86 1.75 3.93 5.54 5.21 3.14 5.25 6.99 6.41 5.62 6.44 9/TPVY 7.17 5.94 0.65 2.63 0.61 0.89 4.13 3.33 1.50 3.51 6.00 4.44 1.59 4.61 6.66 5.42 4.04 5.53 10/TPVY 5.30 4.35 0.58 2.96 0.64 0.65 4.25 2.25 1.29 2.89 5.39 3.00 1.28 3.74 5.42 3.77 2.47 4.30 11/TPVY 4.62 3.28 0.55 3.16 0.52 0.49 4.17 1.88 1.01 2.22 4.88 2.44 1.03 2.82 4.56 2.93 1.45 3.20 12/TPVY 3.71 2.51 0.48 2.77 0.40 0.38 3.55 1.36 0.78 1.68 4.04 1.79 0.79 2.15 3.66 2.20 0.96 2.45 TOTAL RADIATION FOR THE YEAR TPVY [KWH/SQ.M/YEAR] 2166 1907 694 249 286 1229 1055 582 1140 1792 1404 866 1500 2048 1726 1405 1791 NUMBER OF MISSING DAYS JAN FEB MAR APR MAY JUN JUL AUG SEP OCT NOV DEC 0 0 0 0 0 0 0 0 0 0 0 0

CLIMATOLOGICAL DATA FOR JERUSALEM TPVY Latitude = 31.8 N Longitude = 35.2 E Elevation = 760m Jan Feb Mar Apr May Jun Jul Aug Sep Oct Nov Dec Ann TEMPERATURE [DegC] mean 10.4 9.3 11.4 18.8 20.5 21.7 23.1 23.4 22.8 22.6 15.4 8.3 17.3 max obs hourly avg 18.7 19.3 21.8 34.2 36.4 32.5 31.4 34.0 34.5 31.8 23.2 18.4 36.4 min obs hourly avg 4.4 4.1 4.6 6.2 10.5 13.5 16.6 17.7 16.1 15.4 9.8 0.9 0.9 DEGREE DAYS HDD [18.3 DegC base] 246 253 215 67 37 4 0 0 0 2 89 309 1221 CDD [18.3 DegC base] 0 0 0 82 107 105 148 157 136 136 1 0 871 HUMIDITY mean 5am DBT [DegC] 8.8 7.5 9.3 16.2 17.8 17.7 20.0 19.9 19.4 20.7 13.2 6.9 14.8 mean 5am WBT [DegC] 6.9 6.3 7.1 11.6 12.1 13.5 13.6 17.3 15.8 15.8 10.8 5.6 11.4 mean 5am RH [%] 78 85 77 62 58 66 50 80 72 64 76 83 71 mean 2pm DBT [DegC] 12.3 11.6 14.2 22.6 24.5 26.6 26.8 28.4 27.8 25.9 18.4 10.2 20.8 mean 2pm WBT [DegC] 9.3 8.9 10.3 16.8 16.6 17.9 18.6 19.4 18.7 17.4 12.8 7.9 14.6 mean 2pm RH [%] 71 74 66 60 51 45 47 45 44 46 55 76 57 WIND mean speed [m/s] 3.6 3.7 2.9 3.2 2.8 3.3 4.3 3.6 2.8 2.4 2.3 3.1 3.2 max hourly speed [m/s] 11.0 9.0 11.0 9.0 9.0 10.0 9.0 8.0 8.0 7.0 7.0 10.0 11.0 prevailing direction E W NW NW NW NW W NW NW NW E E prevailing occurence [%] 35 42 42 35 62 73 51 67 57 36 35 36 SOLAR ENERGY [kWh/sq.m] horizontal global total 77 100 137 192 224 233 236 218 178 135 99 78 1907 max obs daily total 3.94 5.32 6.17 7.16 8.12 8.21 8.14 7.79 6.55 5.50 4.18 3.57 8.21 max obs hourly avg 0.67 0.85 0.92 1.04 1.00 0.99 1.02 0.98 0.91 0.80 0.68 0.61 1.04 direct beam total 93 116 119 172 236 276 267 255 215 164 139 115 2166 max obs daily total 7.24 9.06 8.65 9.72 10.84 10.97 10.43 10.51 9.15 7.45 7.94 7.59 10.97 max obs hourly avg 1.01 1.04 1.01 0.99 0.99 0.99 0.95 0.96 0.96 0.91 0.96 1.02 1.04 SUMMARY OF INCLUDED DATA % of temperature data 100 100 100 100 100 100 100 100 100 100 100 100 % of humidity ratio data 100 100 100 100 100 100 100 100 100 100 100 100 % of wind speed data 100 100 100 100 100 100 100 100 100 100 100 100 % of wind direction data 100 100 100 100 100 100 100 100 100 100 100 100 # of days of beam data 31 28 31 30 31 30 31 31 30 31 30 31 # of days of global data 31 28 31 30 31 30 31 31 30 31 30 31

SITE: HAIFA YEAR: TPVY LATITUDE 32.8 N LONGITUDE 35.0 E SOLAR RADIATION ON VARIOUS TRACKING AND STATIONARY PLANE SURFACES (ASSUMES: ISOTROPIC SKY MODEL, GROUND ALBEDO = 0.30) [KWH/SQ.M/DAY] FULL TRACKING POLAR MOUNT N-S AXIS E-W AXIS TILT=LATITUDE HORIZONTAL MONTH [2 - AXES] [1 - AXIS] [1 - AXIS] [1 - AXIS] NON-TRACKING NON-TRACKING BEAM DIFF TOTAL BEAM DIFF TOTAL BEAM DIFF TOTAL BEAM DIFF TOTAL BEAM DIFF TOTAL BEAM DIFF TOTAL ____________________________________________________________________________________________________________________________________ 1/TPVY 2.77 0.76 3.71 2.60 0.88 3.57 1.90 0.89 2.88 2.38 0.79 3.33 2.16 0.95 3.17 1.29 1.03 2.32 2/TPVY 3.83 0.93 4.98 3.74 1.02 4.90 3.00 1.04 4.16 3.13 0.99 4.29 3.00 1.11 4.20 2.07 1.21 3.28 3/TPVY 3.88 1.59 5.69 3.87 1.61 5.68 3.41 1.69 5.25 3.03 1.75 4.90 3.01 1.78 4.90 2.44 1.93 4.38 4/TPVY 5.12 2.00 7.34 5.05 1.91 7.25 4.87 2.05 7.11 3.85 2.25 6.16 3.74 2.15 6.03 3.56 2.33 5.89 5/TPVY 7.02 1.76 9.01 6.62 1.62 8.62 6.91 1.77 8.90 5.27 1.98 7.29 4.59 1.87 6.63 5.09 2.03 7.13 6/TPVY 8.42 1.21 9.86 7.75 1.09 9.25 8.32 1.21 9.75 6.43 1.36 7.82 5.27 1.29 6.74 6.20 1.40 7.60 7/TPVY 7.70 1.58 9.51 7.17 1.44 9.01 7.59 1.59 9.40 5.83 1.76 7.63 4.92 1.67 6.77 5.63 1.81 7.44 8/TPVY 7.42 1.17 8.83 7.22 1.09 8.66 7.19 1.19 8.59 5.60 1.34 7.00 5.26 1.27 6.69 5.33 1.38 6.71 9/TPVY 6.29 1.26 7.80 6.27 1.24 7.78 5.74 1.31 7.24 4.74 1.42 6.27 4.71 1.40 6.25 4.08 1.52 5.60 10/TPVY 5.10 0.89 6.22 5.03 0.95 6.16 4.21 0.98 5.33 4.01 0.96 5.14 3.92 1.04 5.06 2.87 1.14 4.01 11/TPVY 4.10 0.69 5.01 3.89 0.79 4.80 2.92 0.80 3.83 3.48 0.72 4.40 3.22 0.86 4.15 2.00 0.94 2.94 12/TPVY 3.33 0.61 4.13 3.06 0.72 3.88 2.16 0.72 2.97 2.93 0.63 3.74 2.62 0.78 3.45 1.49 0.85 2.34 TOTAL RADIATION FOR THE YEAR TPVY [KWH/SQ.M/YEAR] 1979 440 2500 1896 437 2423 1774 464 2297 1543 486 2070 1413 493 1949 1282 535 1817 AVG. INPUT COMPONENTS ON A TOTAL RADIATION ON TOTAL RADIATION ON TOTAL RADIATION ON MONTH DATA S-FACING SURFACE VERTICAL SURFACES 60 DEG INCLINED PLANES 30 DEG INCLINED PLANES BEAM GLOB KT BEAM DIFF REFL S W N E S W N E S W N E _________________________________________________________________________________________________________________________________ 1/TPVY 2.77 2.32 0.42 1.99 0.52 0.35 2.86 1.34 0.86 1.59 3.32 1.72 0.95 2.01 3.12 2.07 1.17 2.28 2/TPVY 3.83 3.28 0.48 2.33 0.61 0.49 3.43 2.11 1.10 1.93 4.21 2.70 1.15 2.49 4.15 3.14 1.83 2.98 3/TPVY 3.88 4.38 0.51 1.76 0.97 0.66 3.39 2.57 1.62 2.67 4.53 3.37 1.79 3.45 4.89 4.04 3.13 4.11 4/TPVY 5.12 5.89 0.58 1.39 1.17 0.88 3.44 3.35 2.07 3.50 5.17 4.43 2.79 4.62 6.07 5.40 4.69 5.54 5/TPVY 7.02 7.13 0.64 0.82 1.02 1.07 2.91 4.00 2.35 4.01 5.15 5.34 4.13 5.38 6.73 6.56 6.17 6.58 6/TPVY 8.42 7.60 0.66 0.59 0.70 1.14 2.43 4.25 2.36 4.00 4.91 5.76 4.66 5.44 6.88 7.09 6.80 6.84 7/TPVY 7.70 7.44 0.66 0.70 0.91 1.12 2.72 4.08 2.41 4.19 5.10 5.49 4.46 5.62 6.89 6.79 6.56 6.88 8/TPVY 7.42 6.71 0.64 1.52 0.69 1.01 3.22 3.74 1.79 3.67 5.47 5.04 2.97 4.94 6.76 6.19 5.33 6.12 9/TPVY 6.29 5.60 0.62 2.37 0.76 0.84 3.97 3.28 1.61 3.27 5.65 4.33 1.72 4.31 6.25 5.20 3.88 5.18 10/TPVY 5.10 4.01 0.54 2.77 0.57 0.60 3.94 2.45 1.17 2.46 4.99 3.19 1.15 3.17 5.01 3.75 2.25 3.73 11/TPVY 4.10 2.94 0.51 2.84 0.47 0.44 3.75 1.75 0.91 1.86 4.38 2.27 0.92 2.39 4.09 2.69 1.29 2.77 12/TPVY 3.33 2.34 0.46 2.52 0.42 0.35 3.29 1.36 0.78 1.51 3.74 1.76 0.81 1.94 3.39 2.11 0.94 2.24 TOTAL RADIATION FOR THE YEAR TPVY [KWH/SQ.M/YEAR] 1979 1817 656 268 273 1196 1044 580 1056 1722 1383 839 1394 1956 1676 1343 1684 NUMBER OF MISSING DAYS JAN FEB MAR APR MAY JUN JUL AUG SEP OCT NOV DEC 0 0 0 0 0 0 0 0 0 0 0 0
CLIMATOLOGICAL DATA FOR HAIFA TPVY Latitude = 32.8 N Longitude = 35.0 E Elevation = 275m Jan Feb Mar Apr May Jun Jul Aug Sep Oct Nov Dec Ann TEMPERATURE [DegC] mean 12.0 12.6 13.5 19.8 21.0 23.0 24.4 26.7 24.0 21.1 19.1 15.4 19.4 max obs hourly avg 18.7 19.6 22.5 37.8 32.4 31.1 30.0 34.4 30.0 32.0 26.4 22.0 37.8 min obs hourly avg 6.4 5.3 8.0 9.5 12.6 17.9 20.9 21.6 19.4 12.7 14.2 10.7 5.3 DEGREE DAYS HDD [18.3 DegC base] 196 160 149 36 11 0 0 0 0 9 5 91 655 CDD [18.3 DegC base] 0 0 0 81 94 140 189 259 171 95 28 1 1058 HUMIDITY mean 5am DBT [DegC] 10.6 11.4 11.9 17.4 18.4 20.7 22.3 24.2 22.0 19.3 17.3 14.2 17.5 mean 5am WBT [DegC] 8.9 8.7 10.8 13.8 15.7 18.9 21.1 23.2 20.1 16.2 13.2 11.4 15.1 mean 5am RH [%] 81 72 88 71 78 85 90 91 86 75 65 73 79 mean 2pm DBT [DegC] 13.8 14.9 15.8 22.5 23.8 25.4 26.8 29.2 26.4 23.9 21.9 17.7 21.8 mean 2pm WBT [DegC] 10.8 10.7 13.1 17.3 18.7 20.5 22.5 24.1 21.6 17.5 16.2 13.6 17.2 mean 2pm RH [%] 71 61 75 63 64 65 70 66 66 55 57 65 65 WIND mean speed [m/s] 2.1 2.1 2.1 2.3 2.4 2.7 4.0 2.4 2.2 2.1 2.1 2.1 2.4 max hourly speed [m/s] 5.0 6.0 7.0 8.0 6.0 7.0 9.0 6.0 6.0 5.0 7.0 6.0 9.0 prevailing direction SE W W W W W W W W W E SW prevailing occurence [%] 20 28 39 33 42 48 58 53 41 31 25 30 SOLAR ENERGY [kWh/sq.m] horizontal global total 72 92 136 177 221 228 231 208 168 124 88 73 1817 max obs daily total 3.72 4.86 6.15 7.25 8.21 8.18 8.22 7.26 6.84 5.38 3.86 3.15 8.22 max obs hourly avg 0.61 0.73 0.88 0.99 1.01 1.00 1.00 0.94 0.92 0.79 0.64 0.54 1.01 direct beam total 86 107 120 154 217 253 239 230 189 158 123 103 1979 max obs daily total 6.79 8.37 7.84 9.43 10.06 10.71 10.39 9.10 9.16 8.43 6.97 6.35 10.71 max obs hourly avg 0.92 0.95 0.92 0.94 0.95 0.96 0.93 0.90 0.92 0.92 0.91 0.94 0.96 SUMMARY OF INCLUDED DATA % of temperature data 100 100 100 100 100 100 100 100 100 100 100 100 % of humidity ratio data 100 100 100 100 100 100 100 100 100 100 100 100 % of wind speed data 100 100 100 100 100 100 100 100 100 100 100 100 % of wind direction data 100 100 100 100 100 100 100 100 100 100 100 100 # of days of beam data 31 28 31 30 31 30 31 31 30 31 30 31 # of days of global data 31 28 31 30 31 30 31 31 30 31 30 31

SITE: ELAT YEAR: TPVY LATITUDE 29.5 N LONGITUDE 34.9 E SOLAR RADIATION ON VARIOUS TRACKING AND STATIONARY PLANE SURFACES (ASSUMES: ISOTROPIC SKY MODEL, GROUND ALBEDO = 0.30) [KWH/SQ.M/DAY] FULL TRACKING POLAR MOUNT N-S AXIS E-W AXIS TILT=LATITUDE HORIZONTAL MONTH [2 - AXES] [1 - AXIS] [1 - AXIS] [1 - AXIS] NON-TRACKING NON-TRACKING BEAM DIFF TOTAL BEAM DIFF TOTAL BEAM DIFF TOTAL BEAM DIFF TOTAL BEAM DIFF TOTAL BEAM DIFF TOTAL ____________________________________________________________________________________________________________________________________ 1/TPVY 4.80 0.63 5.66 4.48 0.73 5.33 3.46 0.73 4.30 4.04 0.66 4.90 3.65 0.79 4.50 2.34 0.84 3.18 2/TPVY 5.26 0.99 6.50 5.12 1.08 6.37 4.27 1.09 5.51 4.23 1.06 5.48 4.05 1.18 5.31 2.96 1.27 4.22 3/TPVY 5.98 1.21 7.44 5.97 1.23 7.43 5.40 1.27 6.85 4.59 1.34 6.06 4.57 1.37 6.05 3.87 1.47 5.34 4/TPVY 6.79 1.21 8.22 6.69 1.16 8.14 6.56 1.23 7.98 5.14 1.38 6.57 4.97 1.33 6.43 4.87 1.42 6.29 5/TPVY 6.60 1.68 8.50 6.25 1.56 8.15 6.54 1.69 8.43 5.15 1.89 7.07 4.62 1.81 6.56 5.05 1.94 6.99 6/TPVY 8.31 1.39 9.93 7.65 1.27 9.32 8.24 1.39 9.86 6.48 1.56 8.07 5.45 1.50 7.11 6.34 1.61 7.95 7/TPVY 8.43 0.86 9.51 7.86 0.79 9.02 8.36 0.87 9.43 6.51 0.98 7.51 5.61 0.95 6.70 6.37 1.01 7.38 8/TPVY 8.09 0.88 9.20 7.87 0.83 9.02 7.92 0.88 9.01 6.11 1.01 7.15 5.74 0.97 6.85 5.90 1.03 6.93 9/TPVY 6.96 0.95 8.16 6.95 0.94 8.15 6.49 0.99 7.66 5.29 1.08 6.47 5.26 1.08 6.46 4.72 1.15 5.88 10/TPVY 5.72 1.04 7.02 5.63 1.10 6.93 4.79 1.12 6.08 4.61 1.14 5.93 4.49 1.23 5.81 3.45 1.31 4.76 11/TPVY 5.10 0.63 5.97 4.83 0.71 5.68 3.81 0.72 4.65 4.26 0.67 5.12 3.91 0.78 4.76 2.60 0.84 3.44 12/TPVY 5.24 0.55 6.03 4.82 0.65 5.58 3.63 0.64 4.38 4.48 0.58 5.27 3.96 0.71 4.73 2.43 0.76 3.19 TOTAL RADIATION FOR THE YEAR TPVY [KWH/SQ.M/YEAR] 2353 366 2804 2256 366 2712 2116 384 2562 1854 405 2301 1713 416 2169 1550 445 1995 AVG. INPUT COMPONENTS ON A TOTAL RADIATION ON TOTAL RADIATION ON TOTAL RADIATION ON MONTH DATA S-FACING SURFACE VERTICAL SURFACES 60 DEG INCLINED PLANES 30 DEG INCLINED PLANES BEAM GLOB KT BEAM DIFF REFL S W N E S W N E S W N E _________________________________________________________________________________________________________________________________ 1/TPVY 4.80 3.18 0.52 3.27 0.42 0.48 4.17 1.97 0.90 2.01 4.87 2.51 0.87 2.55 4.51 2.96 1.30 2.98 2/TPVY 5.26 4.22 0.58 2.99 0.63 0.63 4.26 2.49 1.27 2.64 5.34 3.23 1.27 3.39 5.32 3.86 2.34 3.99 3/TPVY 5.98 5.34 0.60 2.44 0.73 0.80 3.97 3.05 1.54 3.17 5.55 4.05 1.58 4.14 6.05 4.90 3.62 4.97 4/TPVY 6.79 6.29 0.61 1.53 0.71 0.94 3.19 3.37 1.69 3.57 5.28 4.61 2.67 4.75 6.42 5.71 4.92 5.83 5/TPVY 6.60 6.99 0.63 0.63 0.97 1.05 2.65 3.69 2.20 3.77 4.91 5.09 4.12 5.11 6.55 6.38 6.10 6.40 6/TPVY 8.31 7.95 0.69 0.35 0.80 1.19 2.35 3.96 2.49 4.41 4.91 5.51 5.10 5.99 7.09 7.07 7.22 7.41 7/TPVY 8.43 7.38 0.65 0.52 0.51 1.11 2.13 3.66 2.01 4.07 4.66 5.11 4.39 5.52 6.68 6.55 6.54 6.84 8/TPVY 8.09 6.93 0.65 1.33 0.52 1.04 2.89 3.61 1.66 3.91 5.33 4.95 3.18 5.24 6.83 6.22 5.60 6.43 9/TPVY 6.96 5.88 0.63 2.34 0.58 0.88 3.80 3.20 1.46 3.42 5.70 4.31 1.69 4.52 6.46 5.32 4.11 5.47 10/TPVY 5.72 4.76 0.61 3.03 0.66 0.71 4.40 2.74 1.37 2.77 5.69 3.64 1.34 3.66 5.82 4.39 2.79 4.40 11/TPVY 5.10 3.44 0.54 3.34 0.42 0.52 4.27 2.02 0.93 2.17 5.08 2.65 0.89 2.79 4.77 3.15 1.48 3.24 12/TPVY 5.24 3.19 0.56 3.73 0.38 0.48 4.59 1.95 0.86 2.04 5.25 2.51 0.81 2.59 4.74 2.94 1.10 2.99 TOTAL RADIATION FOR THE YEAR TPVY [KWH/SQ.M/YEAR] 2353 1995 775 223 299 1297 1087 559 1155 1903 1466 850 1530 2168 1810 1436 1855 NUMBER OF MISSING DAYS JAN FEB MAR APR MAY JUN JUL AUG SEP OCT NOV DEC 0 0 0 0 0 0 0 0 0 0 0 0

CLIMATOLOGICAL DATA FOR EILAT TPVY Latitude = 29.5N Longitude = 34.9E Elevation = 275m Jan Feb Mar Apr May Jun Jul Aug Sep Oct Nov Dec Ann TEMPERATURE [DegC] mean 16.9 18.9 18.6 22.9 27.7 32.2 32.0 32.7 30.9 27.9 23.2 15.9 25.0 max obs hourly avg 23.3 27.1 26.2 34.6 38.2 44.3 40.6 42.3 41.7 39.3 30.6 25.3 44.3 min obs hourly avg 7.4 11.5 11.2 11.7 17.4 22.4 24.6 25.9 22.3 18.3 17.4 9.6 7.4 DEGREE DAYS HDD [18.3 DegC base] 48 13 15 4 0 0 0 0 0 0 0 76 155 CDD [18.3 DegC base] 4 30 24 143 290 418 424 447 378 299 146 2 2605 HUMIDITY mean 5am DBT [DegC] 14.2 15.9 15.1 18.9 23.0 26.6 27.5 27.5 26.3 24.4 20.6 13.3 21.1 mean 5am WBT [DegC] 10.0 11.3 10.1 13.0 16.5 19.2 19.7 20.3 19.8 17.9 14.9 9.2 15.2 mean 5am RH [%] 59 58 53 51 53 50 49 52 55 55 55 59 54 mean 2pm DBT [DegC] 19.9 22.0 21.9 26.3 30.9 36.1 35.2 35.6 34.7 31.4 26.3 19.4 28.3 mean 2pm WBT [DegC] 13.1 13.7 13.3 16.4 19.5 21.8 22.2 22.8 22.0 21.0 18.1 12.6 18.0 mean 2pm RH [%] 46 39 37 36 35 28 32 33 33 39 45 45 37 WIND mean speed [m/s] 3.0 4.0 3.2 4.2 4.5 4.6 3.0 4.2 4.8 4.1 3.8 3.4 3.9 max hourly speed [m/s] 8.0 12.0 9.0 9.0 10.0 9.0 7.0 9.0 9.0 8.0 9.0 9.0 12.0 prevailing direction N N N N N N N N N N N N prevailing occurence [%] 51 40 42 43 39 45 39 51 46 63 55 55 SOLAR ENERGY [kWh/sq.m] horizontal global total 99 118 166 189 217 238 229 215 176 148 103 99 1995 max obs daily total 3.93 5.24 6.46 7.25 7.96 8.53 7.80 7.23 6.48 5.45 4.38 3.72 8.53 max obs hourly avg 0.68 0.78 0.92 0.97 1.01 1.06 0.99 0.95 0.89 0.80 0.68 0.63 1.06 direct beam total 149 147 185 204 205 249 261 251 209 177 153 162 2353 max obs daily total 7.38 8.79 8.98 9.40 9.33 9.95 9.56 9.07 8.22 7.48 7.62 7.61 9.95 max obs hourly avg 0.96 1.00 0.98 0.97 0.98 0.98 0.94 0.94 0.90 0.86 0.91 0.96 1.00 SUMMARY OF INCLUDED DATA % of temperature data 100 100 100 100 100 100 100 100 100 100 100 100 % of humidity ratio data 100 100 100 100 100 100 100 100 100 100 100 100 % of wind speed data 100 100 100 100 100 100 100 100 100 100 100 100 % of wind direction data 100 100 100 100 100 100 100 100 100 100 100 100 # of days of beam data 31 28 31 30 31 30 31 31 30 31 30 31 # of days of global data 31 28 31 30 31 30 31 31 30 31 30 31

SITE: BEERSHEBA YEAR: TPVY LATITUDE 31.2 N LONGITUDE 34.8 E SOLAR RADIATION ON VARIOUS TRACKING AND STATIONARY PLANE SURFACES (ASSUMES: ISOTROPIC SKY MODEL, GROUND ALBEDO = 0.30) [KWH/SQ.M/DAY] FULL TRACKING POLAR MOUNT N-S AXIS E-W AXIS TILT=LATITUDE HORIZONTAL MONTH [2 - AXES] [1 - AXIS] [1 - AXIS] [1 - AXIS] NON-TRACKING NON-TRACKING BEAM DIFF TOTAL BEAM DIFF TOTAL BEAM DIFF TOTAL BEAM DIFF TOTAL BEAM DIFF TOTAL BEAM DIFF TOTAL ____________________________________________________________________________________________________________________________________ 1/TPVY 3.67 0.93 4.82 3.43 1.07 4.62 2.58 1.08 3.77 3.11 0.97 4.27 2.80 1.16 4.03 1.72 1.26 2.97 2/TPVY 4.46 1.09 5.78 4.34 1.18 5.69 3.56 1.21 4.90 3.59 1.16 4.94 3.44 1.30 4.82 2.44 1.40 3.84 3/TPVY 4.41 1.62 6.27 4.40 1.64 6.26 3.92 1.71 5.79 3.37 1.79 5.29 3.35 1.82 5.27 2.75 1.96 4.71 4/TPVY 5.41 2.26 7.91 5.33 2.16 7.81 5.18 2.31 7.70 4.12 2.56 6.74 4.00 2.45 6.59 3.86 2.64 6.50 5/TPVY 6.96 2.02 9.22 6.58 1.87 8.84 6.88 2.03 9.13 5.33 2.27 7.63 4.71 2.16 7.03 5.19 2.33 7.51 6/TPVY 8.19 1.58 10.01 7.54 1.43 9.39 8.11 1.58 9.92 6.28 1.76 8.07 5.20 1.68 7.05 6.09 1.81 7.91 7/TPVY 7.70 1.73 9.66 7.18 1.58 9.16 7.62 1.73 9.58 5.87 1.93 7.84 5.00 1.84 7.01 5.70 1.99 7.69 8/TPVY 7.41 1.47 9.12 7.20 1.39 8.94 7.22 1.49 8.92 5.55 1.68 7.28 5.20 1.60 6.95 5.32 1.72 7.04 9/TPVY 6.52 1.46 8.25 6.51 1.44 8.23 6.03 1.52 7.74 4.85 1.64 6.61 4.82 1.63 6.58 4.25 1.75 6.00 10/TPVY 5.91 1.02 7.20 5.83 1.08 7.12 4.95 1.11 6.22 4.61 1.11 5.90 4.48 1.20 5.78 3.35 1.29 4.64 11/TPVY 4.90 0.79 5.93 4.65 0.89 5.68 3.58 0.90 4.61 4.11 0.83 5.14 3.78 0.98 4.83 2.43 1.06 3.48 12/TPVY 4.24 0.66 5.13 3.90 0.78 4.80 2.86 0.78 3.74 3.65 0.69 4.54 3.23 0.85 4.15 1.90 0.92 2.82 TOTAL RADIATION FOR THE YEAR TPVY [KWH/SQ.M/YEAR] 2125 506 2719 2037 503 2634 1903 531 2498 1658 560 2261 1522 568 2134 1371 612 1983 AVG. INPUT COMPONENTS ON A TOTAL RADIATION ON TOTAL RADIATION ON TOTAL RADIATION ON MONTH DATA S-FACING SURFACE VERTICAL SURFACES 60 DEG INCLINED PLANES 30 DEG INCLINED PLANES BEAM GLOB KT BEAM DIFF REFL S W N E S W N E S W N E _________________________________________________________________________________________________________________________________ 1/TPVY 3.67 2.97 0.51 2.57 0.63 0.45 3.64 1.82 1.07 1.97 4.25 2.30 1.16 2.50 4.00 2.73 1.49 2.86 2/TPVY 4.46 3.84 0.54 2.61 0.70 0.58 3.89 2.31 1.27 2.41 4.82 2.97 1.34 3.10 4.80 3.54 2.20 3.63 3/TPVY 4.41 4.71 0.54 1.93 0.98 0.71 3.62 2.75 1.69 2.96 4.87 3.58 1.84 3.82 5.27 4.30 3.34 4.49 4/TPVY 5.41 6.50 0.64 1.37 1.32 0.98 3.67 3.64 2.32 3.81 5.57 4.86 3.23 5.05 6.61 5.95 5.27 6.09 5/TPVY 6.96 7.51 0.67 0.74 1.16 1.13 3.03 4.23 2.52 4.07 5.39 5.69 4.46 5.51 7.08 6.98 6.56 6.84 6/TPVY 8.19 7.91 0.69 0.45 0.91 1.19 2.55 4.40 2.60 4.21 5.06 5.92 5.05 5.75 7.11 7.32 7.15 7.16 7/TPVY 7.70 7.69 0.68 0.59 0.99 1.15 2.74 4.47 2.52 4.01 5.19 5.98 4.73 5.45 7.07 7.26 6.84 6.85 8/TPVY 7.41 7.04 0.67 1.37 0.86 1.06 3.28 4.14 2.02 3.73 5.60 5.50 3.39 5.06 6.99 6.65 5.72 6.31 9/TPVY 6.52 6.00 0.65 2.30 0.88 0.90 4.08 3.67 1.78 3.43 5.88 4.79 2.00 4.51 6.58 5.67 4.28 5.46 10/TPVY 5.91 4.64 0.61 3.13 0.65 0.70 4.47 2.81 1.34 2.91 5.70 3.63 1.32 3.76 5.76 4.29 2.64 4.38 11/TPVY 4.90 3.48 0.58 3.29 0.53 0.52 4.34 2.15 1.05 2.15 5.11 2.78 1.05 2.77 4.80 3.26 1.57 3.25 12/TPVY 4.24 2.82 0.53 3.10 0.46 0.42 3.98 1.70 0.88 1.85 4.53 2.19 0.90 2.36 4.11 2.59 1.11 2.70 TOTAL RADIATION FOR THE YEAR TPVY [KWH/SQ.M/YEAR] 2125 1983 712 306 297 1315 1160 642 1142 1885 1529 929 1511 2136 1844 1469 1828 NUMBER OF MISSING DAYS JAN FEB MAR APR MAY JUN JUL AUG SEP OCT NOV DEC 0 0 0 0 0 0 0 0 0 0 0 0

CLIMATOLOGICAL DATA FOR BEERSHEBA TPVY Latitude = 31.2 N Longitude = 34.8 E Elevation = 280m Jan Feb Mar Apr May Jun Jul Aug Sep Oct Nov Dec Ann TEMPERATURE [DegC] mean 12.2 12.8 14.0 21.2 22.4 25.0 25.6 26.4 25.1 21.1 19.2 14.5 20.0 max obs hourly avg 24.6 22.8 28.3 39.9 38.9 40.7 36.7 36.7 38.9 34.8 30.6 30.0 40.7 min obs hourly avg 4.0 6.2 5.7 7.5 11.1 14.2 17.8 17.7 15.6 10.8 9.3 5.2 4.0 DEGREE DAYS HDD [18.3 DegC base] 190 155 137 19 2 0 0 0 0 8 9 126 647 CDD [18.3 DegC base] 0 0 3 106 131 201 228 252 205 95 36 8 1266 HUMIDITY mean 5am DBT [DegC] 8.6 9.5 9.9 15.6 16.5 19.2 20.3 21.2 19.7 16.2 14.6 10.2 15.1 mean 5am WBT [DegC] 7.5 7.6 8.4 11.8 14.2 17.5 18.5 19.9 18.0 14.0 13.0 8.3 13.2 mean 5am RH [%] 86 79 84 68 81 86 85 89 84 80 85 79 82 mean 2pm DBT [DegC] 17.2 17.8 18.8 28.5 30.1 31.7 32.2 33.3 32.2 27.1 25.6 20.1 26.2 mean 2pm WBT [DegC] 11.7 12.8 13.1 17.3 21.0 22.2 21.5 22.8 22.6 18.8 17.5 13.0 17.9 mean 2pm RH [%] 54 58 55 34 47 45 39 41 44 47 45 45 46 WIND mean speed [m/s] 2.5 2.4 3.1 2.8 2.7 2.6 2.7 2.6 2.5 2.6 2.1 2.3 2.6 max hourly speed [m/s] 7.0 8.0 8.0 7.0 8.0 7.0 7.0 7.0 8.0 6.0 6.0 6.0 8.0 prevailing direction E E E NW NW NW NW NW NW E E E prevailing occurence [%] 39 19 29 24 40 39 36 46 43 29 35 42 SOLAR ENERGY [kWh/sq.m] horizontal global total 92 107 146 195 233 237 238 218 180 144 104 87 1983 max obs daily total 4.08 5.40 6.52 7.62 8.22 8.32 8.31 7.45 7.04 5.69 4.24 3.39 8.32 max obs hourly avg 0.66 0.81 0.93 1.04 1.07 1.06 1.03 0.98 0.94 0.82 0.67 0.58 1.07 direct beam total 114 125 137 162 216 246 239 230 196 183 147 132 2125 max obs daily total 7.87 9.04 9.40 8.75 9.27 10.05 9.54 9.53 9.15 8.61 7.39 7.17 10.05 max obs hourly avg 0.95 1.00 0.97 0.96 0.90 0.92 0.92 0.91 0.92 0.94 0.89 0.92 1.00 SUMMARY OF INCLUDED DATA % of temperature data 100 100 100 100 100 100 100 100 100 100 100 100 % of humidity ratio data 100 100 100 100 100 100 100 100 100 100 100 100 % of wind speed data 100 100 100 100 100 100 100 100 100 100 100 100 % of wind direction data 100 100 100 100 100 100 100 100 100 100 100 100 # of days of beam data 31 28 31 30 31 30 31 31 30 31 30 31 # of days of global data 31 28 31 30 31 30 31 31 30 31 30 31