Purpose-Driven Data
33
INNOVATION TRENDS REPORT: PURPOSE-DRIVEN DATA PART THREE IN OUR ONGOING SERIES ON MACRO TRENDS SHAPING GLOBAL SOCIETY social IMPACT
-
Upload
weber-shandwick-korea -
Category
Marketing
-
view
153 -
download
0
Transcript of Purpose-Driven Data
INNOVATION TRENDS REPORT: PURPOSE-DRIVEN DATAPART THREE IN OUR ONGOING SERIES ON MACRO TRENDS SHAPING GLOBAL SOCIETY
socialIMPACT
2
Welcome to the age of Human Data. It’s an era where “Big,” “Fast” and “Smart” data practices converge with human experience and insight to enable us to identify, understand, solve and inspire action for the challenges we face as a global society. In this Purpose-Driven Data report, the third in our Innovation Trends Report series,
we explore how organisations can better leverage purpose-driven analytics to achieve social and environmental goals through strategic communications and storytelling informed by data.The report introduces the concept of “Impact Engineers,” professionals who combine the know-how of data science and communications with a keen understanding of social impact, global development and sustainability practices and trends. It also features several in-depth interviews from experts across Weber Shandwick, including Social Impact specialists, who offer insights on purpose-driven data themes, with a focus on the important role human ingenuity plays to interpret and give meaning to data in the service of social and environmental progress.
3
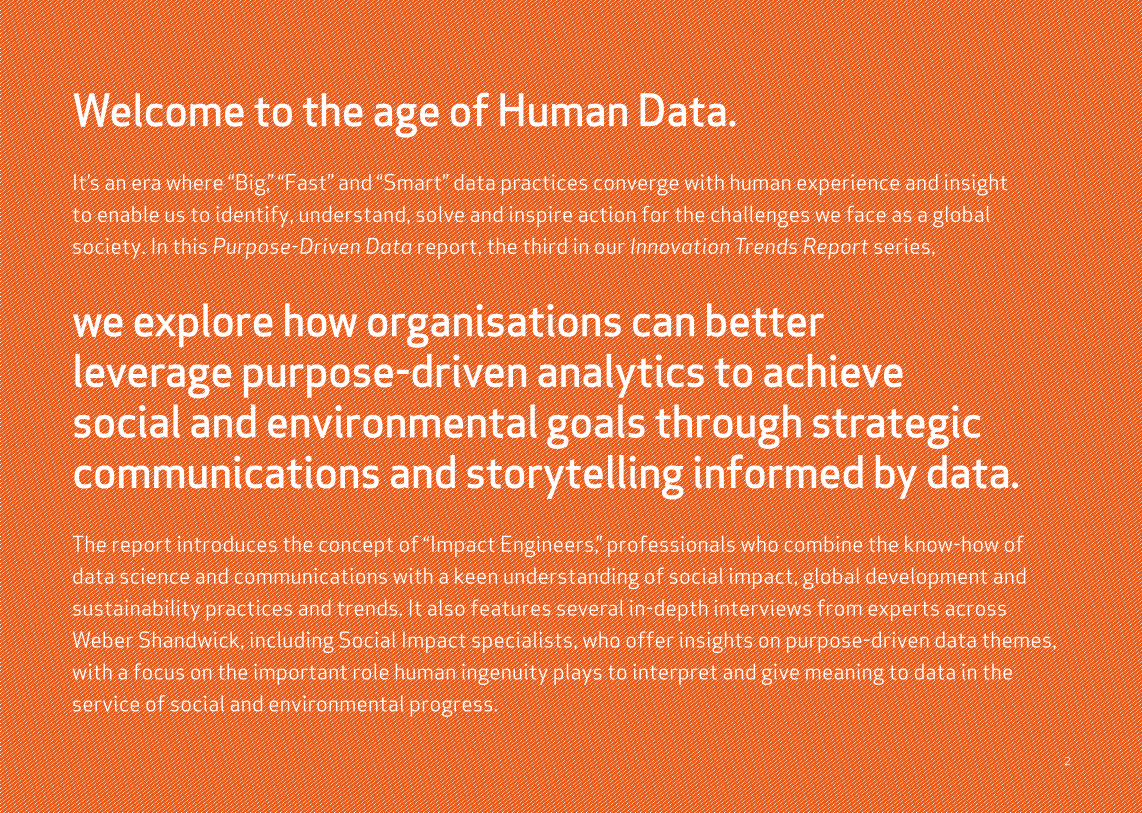
NETWORKED SMART CITIES
How we source and scale innovations to ensure cities (and communities) provide a vibrant, equitable, sustainable, livable environment for inhabitants.
ALWAYS-ON TRANSPARENCY
How forward-thinking organisations continually share failures, lessons and insider perspectives behind impact results.
PURPOSE-DRIVEN DATA
How we realise the potential for better data analysis and insights that inform solutions and advancements for society.
CONSCIOUS CROWDSOURCING
How organisations harness the expertise of those in the virtual network who are best equipped to solve a particular challenge.
INCLUSIVE GLOBAL ECONOMIES
How we can overcome the consequences of the global wealth imbalance to ensure access to health, education and opportunity for all.
3
INNOVATION TRENDSThis Purpose-Driven Data report is the third in a series of investigations into the key macro trends that are shaping the future of social impact work. Stay tuned for insights on additional topics transforming how people, organisations and systems connect to drive positive societal change.
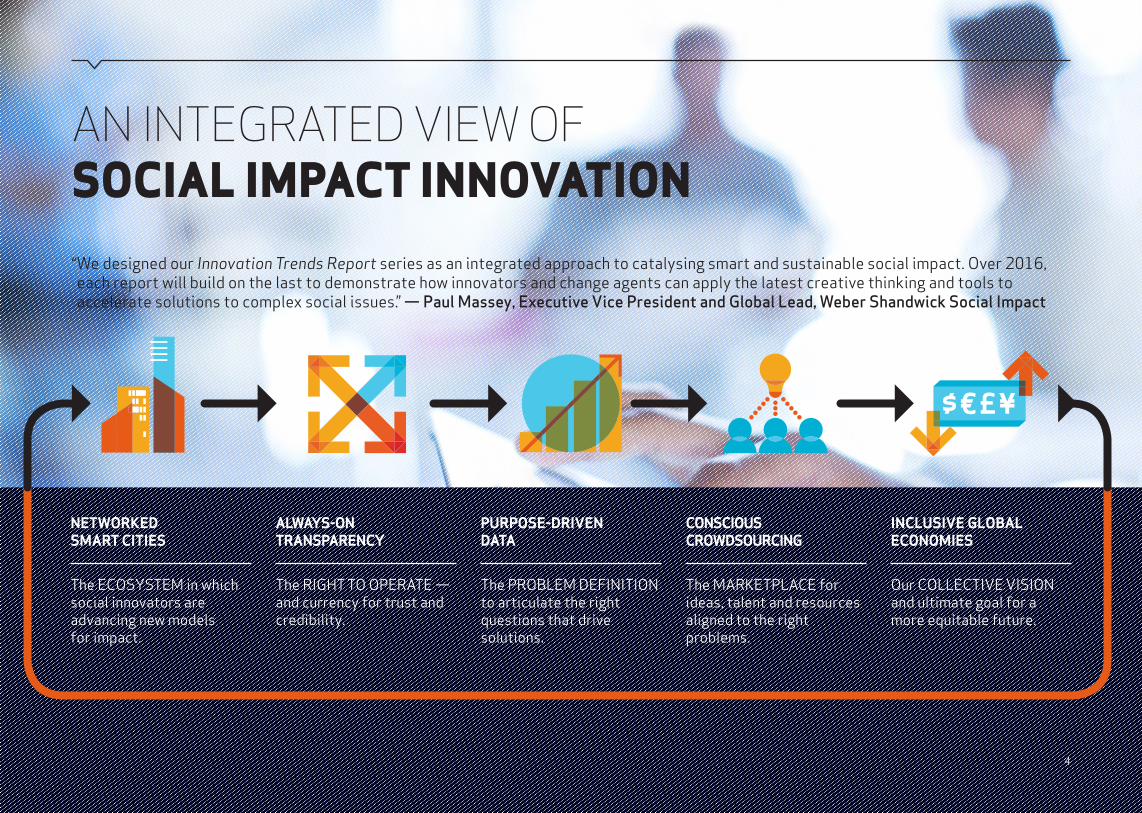
AN INTEGRATED VIEW OF SOCIAL IMPACT INNOVATION“ We designed our Innovation Trends Report series as an integrated approach to catalysing smart and sustainable social impact. Over 2016, each report will build on the last to demonstrate how innovators and change agents can apply the latest creative thinking and tools to accelerate solutions to complex social issues.” — Paul Massey, Executive Vice President and Global Lead, Weber Shandwick Social Impact
4
NETWORKED SMART CITIES
The ECOSYSTEM in which social innovators are advancing new models for impact.
ALWAYS-ON TRANSPARENCY
The RIGHT TO OPERATE — and currency for trust and credibility.
PURPOSE-DRIVEN DATA
The PROBLEM DEFINITION to articulate the right questions that drive solutions.
CONSCIOUS CROWDSOURCING
The MARKETPLACE for ideas, talent and resources aligned to the right problems.
INCLUSIVE GLOBAL ECONOMIES
Our COLLECTIVE VISION and ultimate goal for a more equitable future.
…the march of quantification, made possible by enormous new sources of data, will sweep through academia, business and government. There is no area that is going to be untouched. GARY KING, DIRECTOR, HARVARD UNIVERSITY INSTITUTE FOR QUANTITATIVE SOCIAL SCIENCE
SPOTLIGHT ON PURPOSE-DRIVEN DATA
5
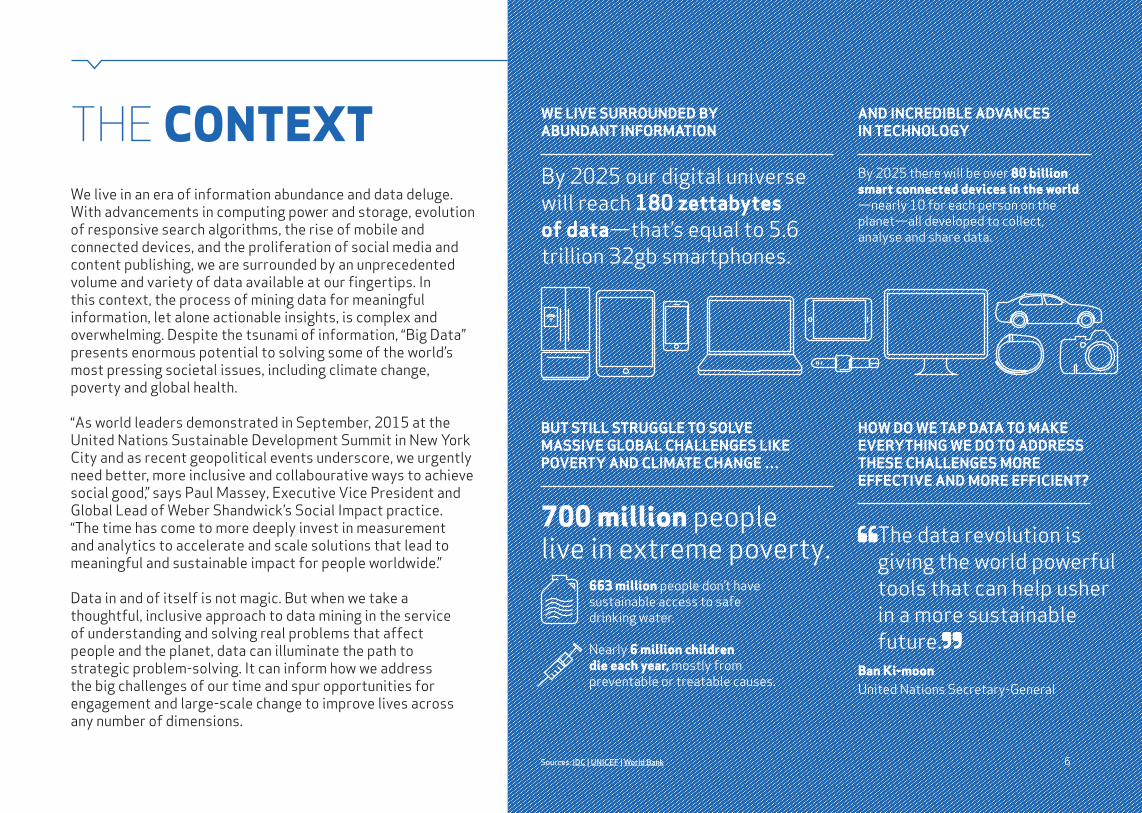
THE CONTEXTWe live in an era of information abundance and data deluge. With advancements in computing power and storage, evolution of responsive search algorithms, the rise of mobile and connected devices, and the proliferation of social media and content publishing, we are surrounded by an unprecedented volume and variety of data available at our fingertips. In this context, the process of mining data for meaningful information, let alone actionable insights, is complex and overwhelming. Despite the tsunami of information, “Big Data” presents enormous potential to solving some of the world’s most pressing societal issues, including climate change, poverty and global health.
“As world leaders demonstrated in September, 2015 at the United Nations Sustainable Development Summit in New York City and as recent geopolitical events underscore, we urgently need better, more inclusive and collabourative ways to achieve social good,” says Paul Massey, Executive Vice President and Global Lead of Weber Shandwick’s Social Impact practice. “The time has come to more deeply invest in measurement and analytics to accelerate and scale solutions that lead to meaningful and sustainable impact for people worldwide.”
Data in and of itself is not magic. But when we take a thoughtful, inclusive approach to data mining in the service of understanding and solving real problems that affect people and the planet, data can illuminate the path to strategic problem-solving. It can inform how we address the big challenges of our time and spur opportunities for engagement and large-scale change to improve lives across any number of dimensions.
WE LIVE SURROUNDED BY ABUNDANT INFORMATION
AND INCREDIBLE ADVANCES IN TECHNOLOGY
BUT STILL STRUGGLE TO SOLVE MASSIVE GLOBAL CHALLENGES LIKE POVERTY AND CLIMATE CHANGE …
HOW DO WE TAP DATA TO MAKE EVERYTHING WE DO TO ADDRESS THESE CHALLENGES MORE EFFECTIVE AND MORE EFFICIENT?
Sources: IDC | UNICEF | World Bank
By 2025 our digital universe will reach 180 zettabytes of data—that’s equal to 5.6 trillion 32gb smartphones.
By 2025 there will be over 80 billion smart connected devices in the world —nearly 10 for each person on the planet—all developed to collect, analyse and share data.
700 million people live in extreme poverty.
663 million people don’t have sustainable access to safe drinking water.
Nearly 6 million children die each year, mostly from preventable or treatable causes.
The data revolution is giving the world powerful tools that can help usher in a more sustainable future.
Ban Ki-moon United Nations Secretary-General
6
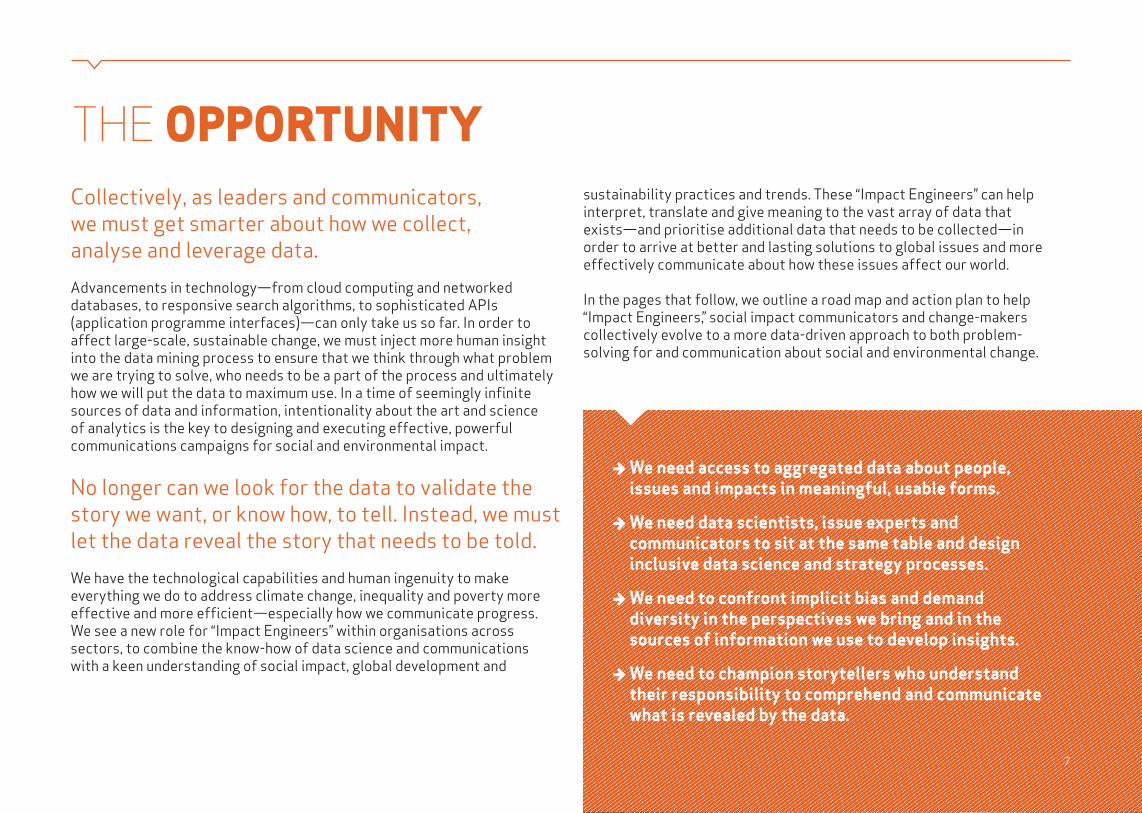
THE OPPORTUNITYCollectively, as leaders and communicators, we must get smarter about how we collect, analyse and leverage data. Advancements in technology—from cloud computing and networked databases, to responsive search algorithms, to sophisticated APIs (application programme interfaces)—can only take us so far. In order to affect large-scale, sustainable change, we must inject more human insight into the data mining process to ensure that we think through what problem we are trying to solve, who needs to be a part of the process and ultimately how we will put the data to maximum use. In a time of seemingly infinite sources of data and information, intentionality about the art and science of analytics is the key to designing and executing effective, powerful communications campaigns for social and environmental impact.
No longer can we look for the data to validate the story we want, or know how, to tell. Instead, we must let the data reveal the story that needs to be told.We have the technological capabilities and human ingenuity to make everything we do to address climate change, inequality and poverty more effective and more efficient—especially how we communicate progress. We see a new role for “Impact Engineers” within organisations across sectors, to combine the know-how of data science and communications with a keen understanding of social impact, global development and
sustainability practices and trends. These “Impact Engineers” can help interpret, translate and give meaning to the vast array of data that exists—and prioritise additional data that needs to be collected—in order to arrive at better and lasting solutions to global issues and more effectively communicate about how these issues affect our world.
In the pages that follow, we outline a road map and action plan to help “Impact Engineers,” social impact communicators and change-makers collectively evolve to a more data-driven approach to both problem-solving for and communication about social and environmental change.
We need access to aggregated data about people, issues and impacts in meaningful, usable forms.
We need data scientists, issue experts and communicators to sit at the same table and design inclusive data science and strategy processes.
We need to confront implicit bias and demand diversity in the perspectives we bring and in the sources of information we use to develop insights.
We need to champion storytellers who understand their responsibility to comprehend and communicate what is revealed by the data.
7
A VISION FOR A PURPOSE -DRIVEN DATA ECOSYSTEM
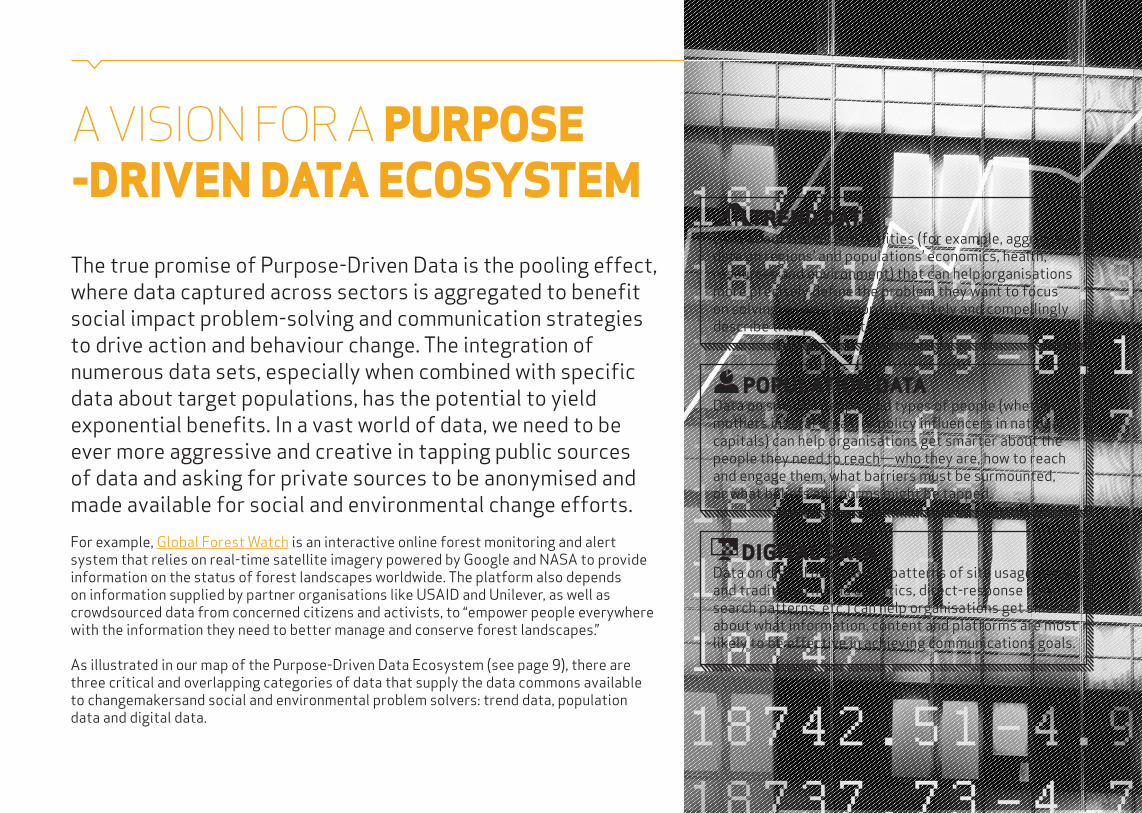
The true promise of Purpose-Driven Data is the pooling effect, where data captured across sectors is aggregated to benefit social impact problem-solving and communication strategies to drive action and behaviour change. The integration of numerous data sets, especially when combined with specific data about target populations, has the potential to yield exponential benefits. In a vast world of data, we need to be ever more aggressive and creative in tapping public sources of data and asking for private sources to be anonymised and made available for social and environmental change efforts.For example, Global Forest Watch is an interactive online forest monitoring and alert system that relies on real-time satellite imagery powered by Google and NASA to provide information on the status of forest landscapes worldwide. The platform also depends on information supplied by partner organisations like USAID and Unilever, as well as crowdsourced data from concerned citizens and activists, to “empower people everywhere with the information they need to better manage and conserve forest landscapes.”
As illustrated in our map of the Purpose-Driven Data Ecosystem (see page 9), there are three critical and overlapping categories of data that supply the data commons available to changemakersand social and environmental problem solvers: trend data, population data and digital data.
8
TREND DATA Data about trends and realities (for example, aggregate data on regions’ and populations’ economics, health, resources and environment) that can help organisations more precisely define the problem they want to focus on solving, as well as more effectively and compellingly describe that problem to others.
POPULATION DATAData on specific people and types of people (whether mothers in rural areas, or policy influencers in national capitals) can help organisations get smarter about the people they need to reach—who they are, how to reach and engage them, what barriers must be surmounted, or what beliefs and norms might be tapped.
DIGITAL DATAData on digital behaviours (patterns of site usage, social and traditional media analytics, direct-response data, search patterns, etc.) can help organisations get smarter about what information, content and platforms are most likely to be effective in achieving communications goals.
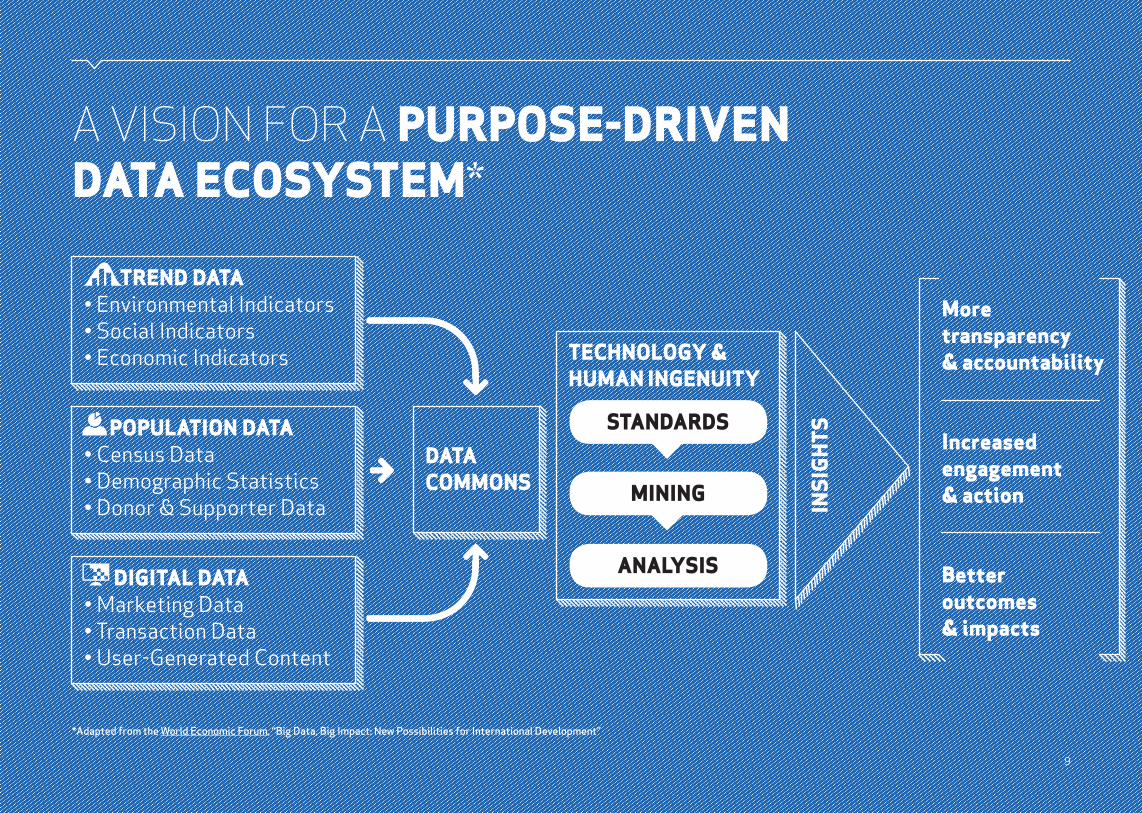
A VISION FOR A PURPOSE-DRIVEN DATA ECOSYSTEM*
*Adapted from the World Economic Forum, “Big Data, Big Impact: New Possibilities for International Development”
TREND DATA• Environmental Indicators • Social Indicators • Economic Indicators TECHNOLOGY &
HUMAN INGENUITY
POPULATION DATA• Census Data• Demographic Statistics• Donor & Supporter Data
DIGITAL DATA• Marketing Data• Transaction Data• User-Generated Content
More transparency & accountability
Increased engagement & action
Better outcomes & impacts
DATA COMMONS
ANALYSIS
STANDARDS
MINING INSI
GH
TS
9
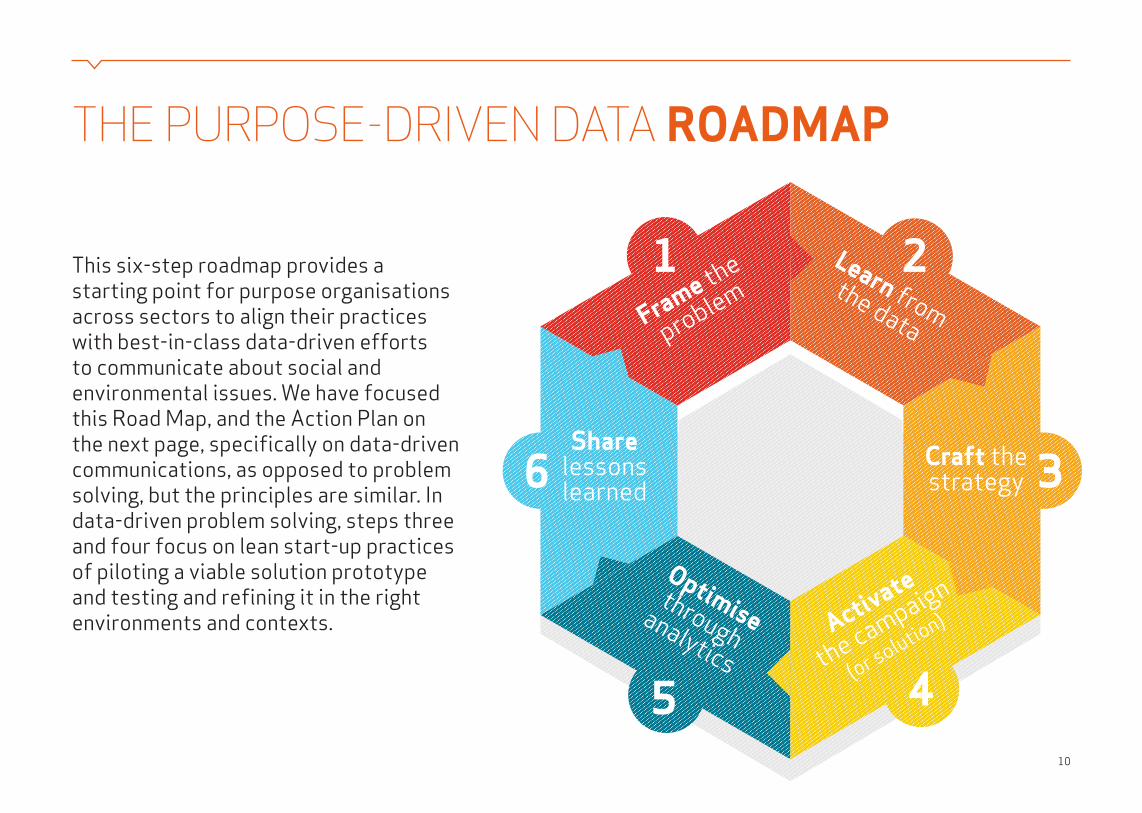
Frame the
problemLearn from the data
Activate
the campaign
(or solution)
Optimise through
analytics
1 2
45
6 3Craft the strategy
Share lessons learned
This six-step roadmap provides a starting point for purpose organisations across sectors to align their practices with best-in-class data-driven efforts to communicate about social and environmental issues. We have focused this Road Map, and the Action Plan on the next page, specifically on data-driven communications, as opposed to problem solving, but the principles are similar. In data-driven problem solving, steps three and four focus on lean start-up practices of piloting a viable solution prototype and testing and refining it in the right environments and contexts.
10
THE PURPOSE-DRIVEN DATA ROADMAP
11
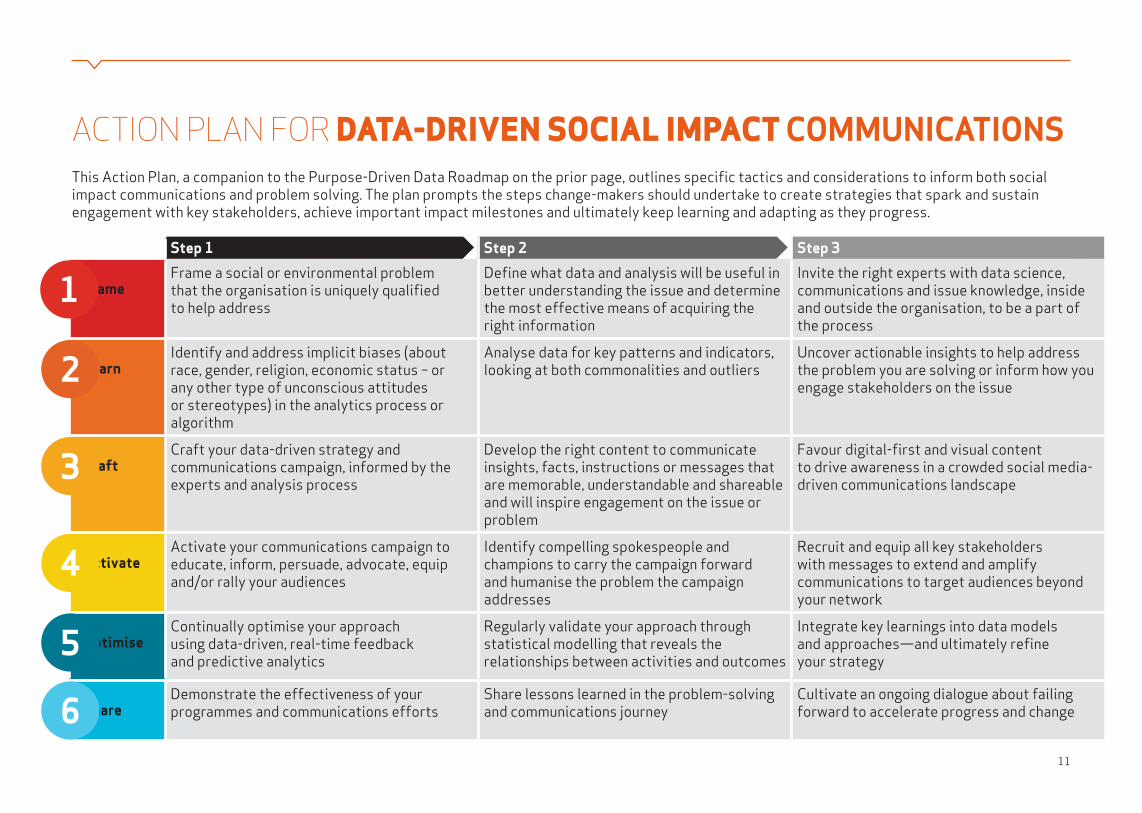
ACTION PLAN FOR DATA-DRIVEN SOCIAL IMPACT COMMUNICATIONS
Step 1 Step 2 Step 3
FrameFrame a social or environmental problem that the organisation is uniquely qualified to help address
Define what data and analysis will be useful in better understanding the issue and determine the most effective means of acquiring the right information
Invite the right experts with data science, communications and issue knowledge, inside and outside the organisation, to be a part of the process
LearnIdentify and address implicit biases (about race, gender, religion, economic status – or any other type of unconscious attitudes or stereotypes) in the analytics process or algorithm
Analyse data for key patterns and indicators, looking at both commonalities and outliers
Uncover actionable insights to help address the problem you are solving or inform how you engage stakeholders on the issue
CraftCraft your data-driven strategy and communications campaign, informed by the experts and analysis process
Develop the right content to communicate insights, facts, instructions or messages that are memorable, understandable and shareable and will inspire engagement on the issue or problem
Favour digital-first and visual content to drive awareness in a crowded social media-driven communications landscape
ActivateActivate your communications campaign to educate, inform, persuade, advocate, equip and/or rally your audiences
Identify compelling spokespeople and champions to carry the campaign forward and humanise the problem the campaign addresses
Recruit and equip all key stakeholders with messages to extend and amplify communications to target audiences beyond your network
OptimiseContinually optimise your approach using data-driven, real-time feedback and predictive analytics
Regularly validate your approach through statistical modelling that reveals the relationships between activities and outcomes
Integrate key learnings into data models and approaches—and ultimately refine your strategy
ShareDemonstrate the effectiveness of your programmes and communications efforts
Share lessons learned in the problem-solving and communications journey
Cultivate an ongoing dialogue about failing forward to accelerate progress and change
This Action Plan, a companion to the Purpose-Driven Data Roadmap on the prior page, outlines specific tactics and considerations to inform both social impact communications and problem solving. The plan prompts the steps change-makers should undertake to create strategies that spark and sustain engagement with key stakeholders, achieve important impact milestones and ultimately keep learning and adapting as they progress.
1
2
3
4
5
6
PURPOSE-DRIVEN DATA IN ACTION
12
In the section that follows, we share perspectives and advice from experts across Weber Shandwick’s global network of strategists, creatives and storytellers. Their commentary explores different aspects of Purpose-Driven Data and highlights key considerations, recommendations and examples for how data can accelerate social impact. Common to all of their contributions is a commitment to intellectual curiosity—going beyond what we can see, asking lots of questions and being open to unexpected insights. Many elegant solutions to some of our world’s toughest challenges (think: Penicillin for disease treatment) were spotted because someone dared to look at the information in a different way.-
Numbers have an important story to tell. They rely on you to give them a voice.STEPHEN FEW, FOUNDER, PERCEPTUAL EDGE
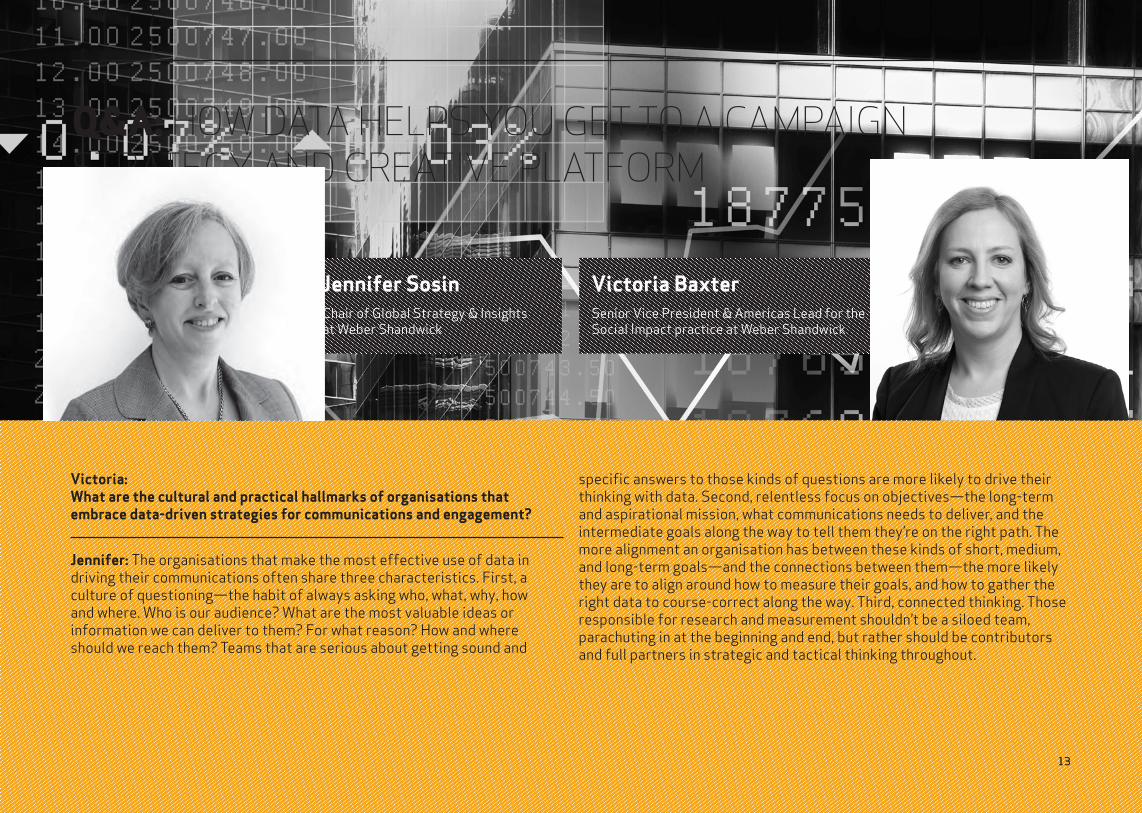
Jennifer SosinChair of Global Strategy & Insights at Weber Shandwick
Victoria BaxterSenior Vice President & Americas Lead for the Social Impact practice at Weber Shandwick
Q&A: HOW DATA HELPS YOU GET TO A CAMPAIGN STRATEGY AND CREATIVE PLATFORM
1313
Victoria: What are the cultural and practical hallmarks of organisations that embrace data-driven strategies for communications and engagement?
Jennifer: The organisations that make the most effective use of data in driving their communications often share three characteristics. First, a culture of questioning—the habit of always asking who, what, why, how and where. Who is our audience? What are the most valuable ideas or information we can deliver to them? For what reason? How and where should we reach them? Teams that are serious about getting sound and
specific answers to those kinds of questions are more likely to drive their thinking with data. Second, relentless focus on objectives—the long-term and aspirational mission, what communications needs to deliver, and the intermediate goals along the way to tell them they’re on the right path. The more alignment an organisation has between these kinds of short, medium, and long-term goals—and the connections between them—the more likely they are to align around how to measure their goals, and how to gather the right data to course-correct along the way. Third, connected thinking. Those responsible for research and measurement shouldn’t be a siloed team, parachuting in at the beginning and end, but rather should be contributors and full partners in strategic and tactical thinking throughout.
14
Q&A: continued
Companies that embrace data-driven communication have1 A culture of questioning2 Relentless focus on objectives3 Connected thinking
Data may be free, the ability to use data is far from it. Most important, using data effectively requires investment in the people and time needed to design the right analytics programmes, execute them, and interpret the results.
Victoria: We often find ourselves drowning in data. What is the best way to streamline research and analysis to distill a problem statement or essential insight that sparks a smarter campaign strategy?
Jennifer: Advertising and public relations agencies use planning models for a good reason: they are effective tools for filtering information in a way that leads to clear conclusions. At Weber Shandwick, our planning model for arriving at core communications strategies—whether a creative platform, a positioning idea, or a straightforward message framework—is called INCITE. When we employ this model, it pushes us to define our objectives, identify and understand our audience, and consider our challenge from several specific directions. Importantly, this is not a fill-in-the-blank exercise. Rather, it is a disciplined approach to thinking and to prioritisation.
Victoria: What do you see as the biggest barrier to using data more effectively as we design engagement programmes to promote social good and inspire positive change?
Jennifer: Data may be free, the ability to use data is far from it. Most important, using data effectively requires investment in the people and time needed to design the right analytics programmes, execute them, and interpret the results. That said, when we make the investment, we are far more likely to arrive at the right strategy and the right execution, as well as to continually move resources into what is working and out of what is not.
Victoria: And the biggest opportunity?
Jennifer: The combination of new growing analytics talent with the proliferation of analytics tools is transforming our industry. A generation ago, media savvy was a must-have, shared and core competency of PR professionals. Increasingly, data acumen is a must-have core competency. And as more and more communications professionals are using data in their daily work, more and more tools are emerging to support them. For many of us, this makes the use of data in communications tremendously exciting, opening doors to better strategies, greater creativity, and, ultimately, more effective problem-solving for our clients and social issues.
DRIVING BEHAVIOUR CHANGE THROUGH STRATEGIC COMMUNICATIONS
15
Frank Orrico, PhD, EVP, Global Director, Element Scientific CommunicationsTM at Weber Shandwick
Every good behaviour change communications programme is driven by good information. Research and data should inform your understanding of the internal and external forces that shape and constrain behaviour in your target audience.
They should guide the development of messages that incorporate feedback from the audience. They should help select the right time, vehicles, and channels through which to reach your audience. They should provide insight into the effectiveness of your programme and help modify your strategy along the way.
Data can also be a critical part of the communication itself. With the proliferation
of wearable devices, the possibilities of incorporating personalised data into behaviour change communications are almost endless.
Take, for example, the goal to help people achieve and maintain a healthy weight—an important factor for accelerating progress against the rise of noncommunicable diseases (NCDs) such as heart disease and diabetes and a global priority under the UN SDG #3: Good Health & Well-Being.
Someone without exposure to well-crafted messages and calls to action informed by a data-driven strategy, may struggle to lose weight on her or his own, not knowing why it is important to maintain a healthy weight, what advice to follow or how to stay motivated for the long-term. But that same person may be much more successful if invited to participate in a company-sponsored programme designed to expose employees to the messages and tools, such as a pedometer or activity tracker, that are proven to work. Some
employees may be motivated to know how many steps they achieve each day—and the sense of competition among colleagues. Others may respond to the validation they receive from posting updates to social networks. Still others may need a reward to work towards to keep them focused on achieving a goal. Data can help you understand which incentives and rewards will work best for the employee audience.
This example illustrates some of the pillars of behaviour change communications informed by smart data—a discipline that’s evolved to help people embrace behaviours that are good for them and society, from shedding pounds to turning off the lights when they leave their offices.
16
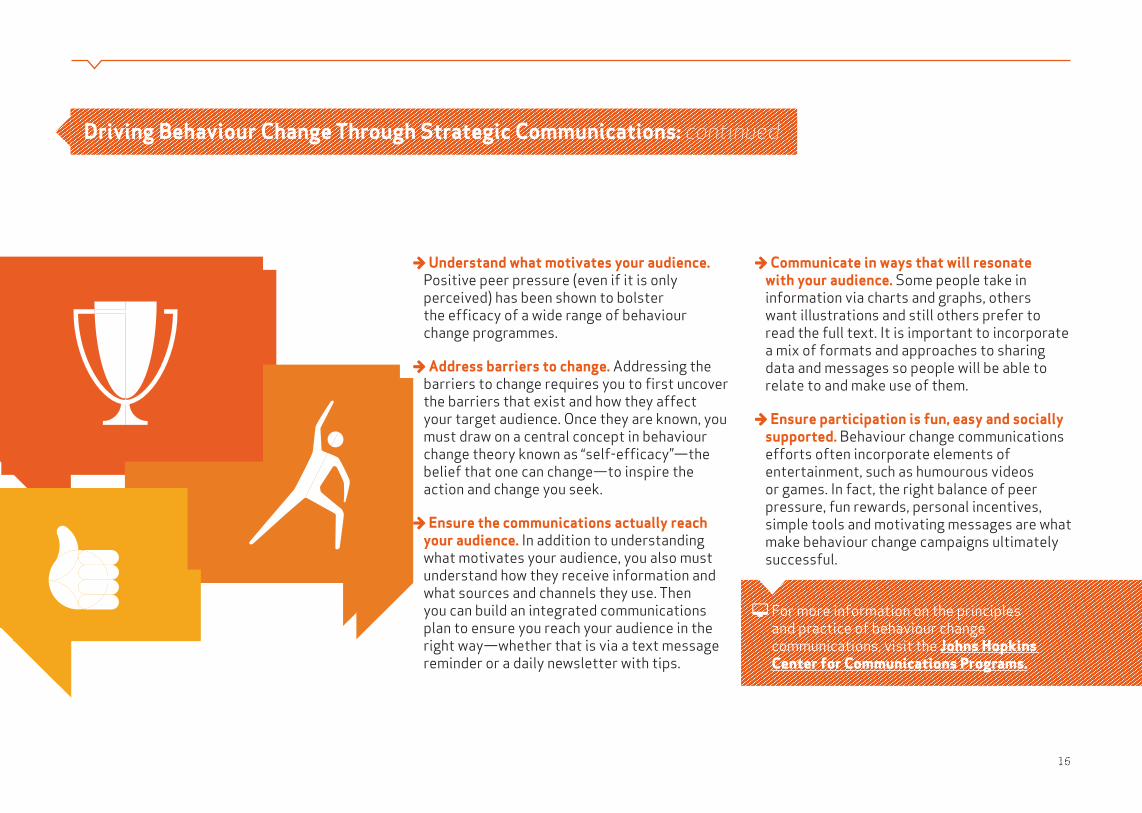
For more information on the principles and practice of behaviour change communications, visit the Johns Hopkins Center for Communications Programs.
Understand what motivates your audience. Positive peer pressure (even if it is only perceived) has been shown to bolster the efficacy of a wide range of behaviour change programmes.
Address barriers to change. Addressing the barriers to change requires you to first uncover the barriers that exist and how they affect your target audience. Once they are known, you must draw on a central concept in behaviour change theory known as “self-efficacy”—the belief that one can change—to inspire the action and change you seek.
Ensure the communications actually reach your audience. In addition to understanding what motivates your audience, you also must understand how they receive information and what sources and channels they use. Then you can build an integrated communications plan to ensure you reach your audience in the right way—whether that is via a text message reminder or a daily newsletter with tips.
Communicate in ways that will resonate with your audience. Some people take in information via charts and graphs, others want illustrations and still others prefer to read the full text. It is important to incorporate a mix of formats and approaches to sharing data and messages so people will be able to relate to and make use of them.
Ensure participation is fun, easy and socially supported. Behaviour change communications efforts often incorporate elements of entertainment, such as humourous videos or games. In fact, the right balance of peer pressure, fun rewards, personal incentives, simple tools and motivating messages are what make behaviour change campaigns ultimately successful.
Driving Behaviour Change Through Strategic Communications: continued
17
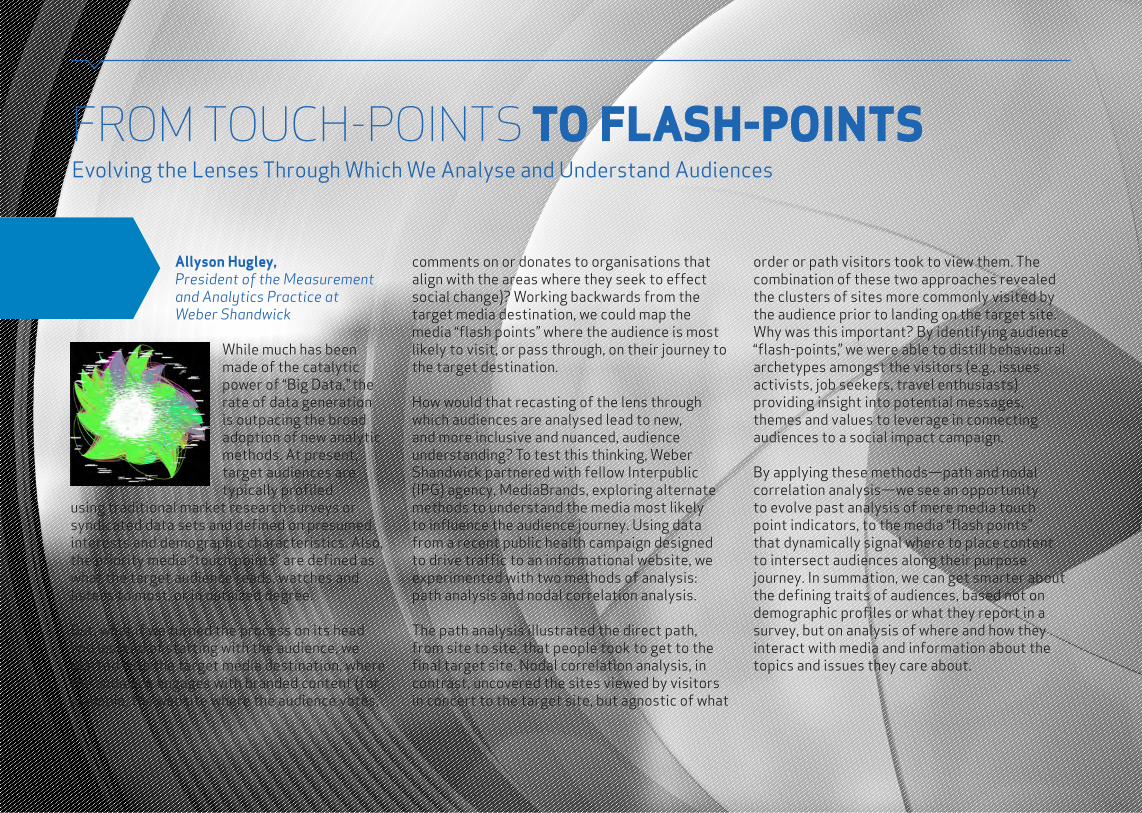
FROM TOUCH-POINTS TO FLASH-POINTS Evolving the Lenses Through Which We Analyse and Understand Audiences
Allyson Hugley, President of the Measurement and Analytics Practice at Weber Shandwick
While much has been made of the catalytic power of “Big Data," the rate of data generation is outpacing the broad adoption of new analytic methods. At present, target audiences are typically profiled
using traditional market research surveys or syndicated data sets and defined on presumed interests and demographic characteristics. Also, the priority media “touch points” are defined as what the target audience reads, watches and listens to most, or in outsized degree.
But, what if we turned the process on its head and instead of starting with the audience, we started with the target media destination, where the audience engages with branded content (for example, the website where the audience votes,
comments on or donates to organisations that align with the areas where they seek to effect social change)? Working backwards from the target media destination, we could map the media “flash points” where the audience is most likely to visit, or pass through, on their journey to the target destination.
How would that recasting of the lens through which audiences are analysed lead to new, and more inclusive and nuanced, audience understanding? To test this thinking, Weber Shandwick partnered with fellow Interpublic (IPG) agency, MediaBrands, exploring alternate methods to understand the media most likely to influence the audience journey. Using data from a recent public health campaign designed to drive traffic to an informational website, we experimented with two methods of analysis: path analysis and nodal correlation analysis.
The path analysis illustrated the direct path, from site to site, that people took to get to the final target site. Nodal correlation analysis, in contrast, uncovered the sites viewed by visitors in concert to the target site, but agnostic of what
order or path visitors took to view them. The combination of these two approaches revealed the clusters of sites more commonly visited by the audience prior to landing on the target site. Why was this important? By identifying audience “flash-points,” we were able to distill behavioural archetypes amongst the visitors (e.g., issues activists, job seekers, travel enthusiasts) providing insight into potential messages, themes and values to leverage in connecting audiences to a social impact campaign.
By applying these methods—path and nodal correlation analysis—we see an opportunity to evolve past analysis of mere media touch point indicators, to the media “flash points” that dynamically signal where to place content to intersect audiences along their purpose journey. In summation, we can get smarter about the defining traits of audiences, based not on demographic profiles or what they report in a survey, but on analysis of where and how they interact with media and information about the topics and issues they care about.
18
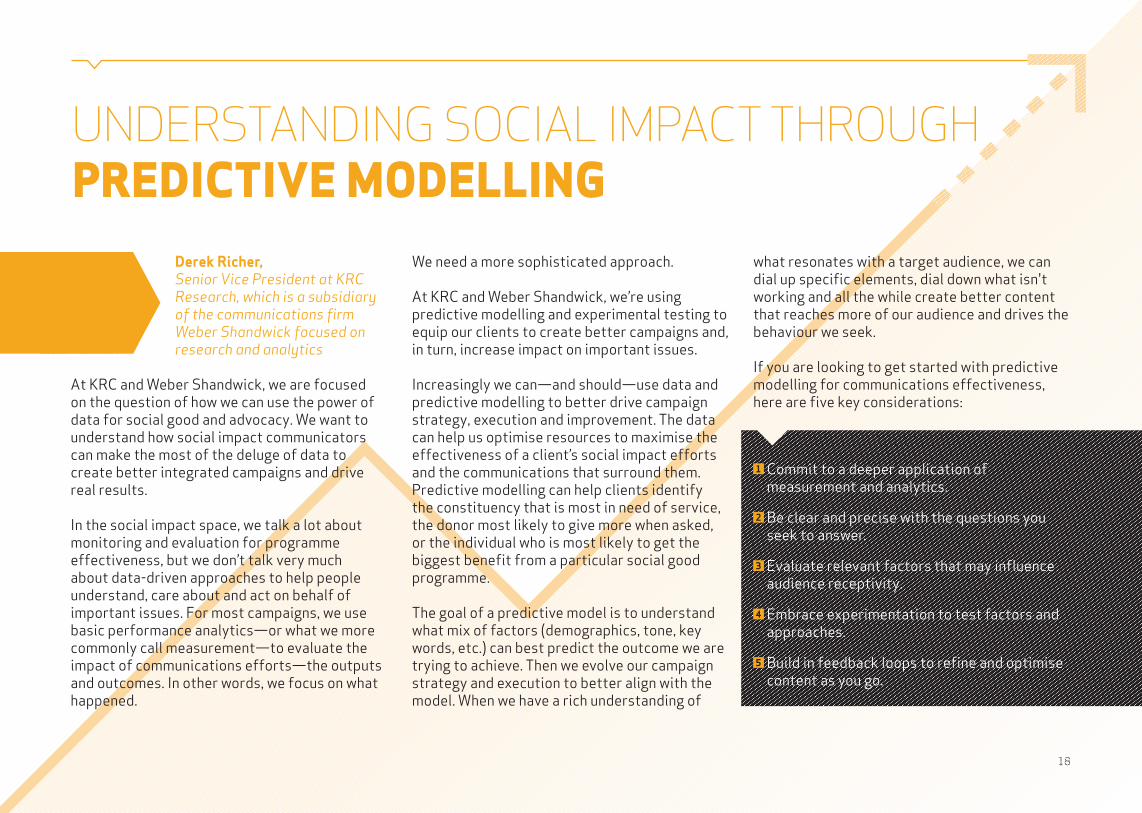
UNDERSTANDING SOCIAL IMPACT THROUGH PREDICTIVE MODELLING
Derek Richer, Senior Vice President at KRC Research, which is a subsidiary of the communications firm Weber Shandwick focused on research and analytics
At KRC and Weber Shandwick, we are focused on the question of how we can use the power of data for social good and advocacy. We want to understand how social impact communicators can make the most of the deluge of data to create better integrated campaigns and drive real results.
In the social impact space, we talk a lot about monitoring and evaluation for programme effectiveness, but we don’t talk very much about data-driven approaches to help people understand, care about and act on behalf of important issues. For most campaigns, we use basic performance analytics—or what we more commonly call measurement—to evaluate the impact of communications efforts—the outputs and outcomes. In other words, we focus on what happened.
We need a more sophisticated approach.
At KRC and Weber Shandwick, we’re using predictive modelling and experimental testing to equip our clients to create better campaigns and, in turn, increase impact on important issues.
Increasingly we can—and should—use data and predictive modelling to better drive campaign strategy, execution and improvement. The data can help us optimise resources to maximise the effectiveness of a client’s social impact efforts and the communications that surround them. Predictive modelling can help clients identify the constituency that is most in need of service, the donor most likely to give more when asked, or the individual who is most likely to get the biggest benefit from a particular social good programme.
The goal of a predictive model is to understand what mix of factors (demographics, tone, key words, etc.) can best predict the outcome we are trying to achieve. Then we evolve our campaign strategy and execution to better align with the model. When we have a rich understanding of
what resonates with a target audience, we can dial up specific elements, dial down what isn't working and all the while create better content that reaches more of our audience and drives the behaviour we seek.
If you are looking to get started with predictive modelling for communications effectiveness, here are five key considerations:
1 Commit to a deeper application of measurement and analytics.
2 Be clear and precise with the questions you seek to answer.
3 Evaluate relevant factors that may influence audience receptivity.
4 Embrace experimentation to test factors and approaches.
5 Build in feedback loops to refine and optimise content as you go.
19
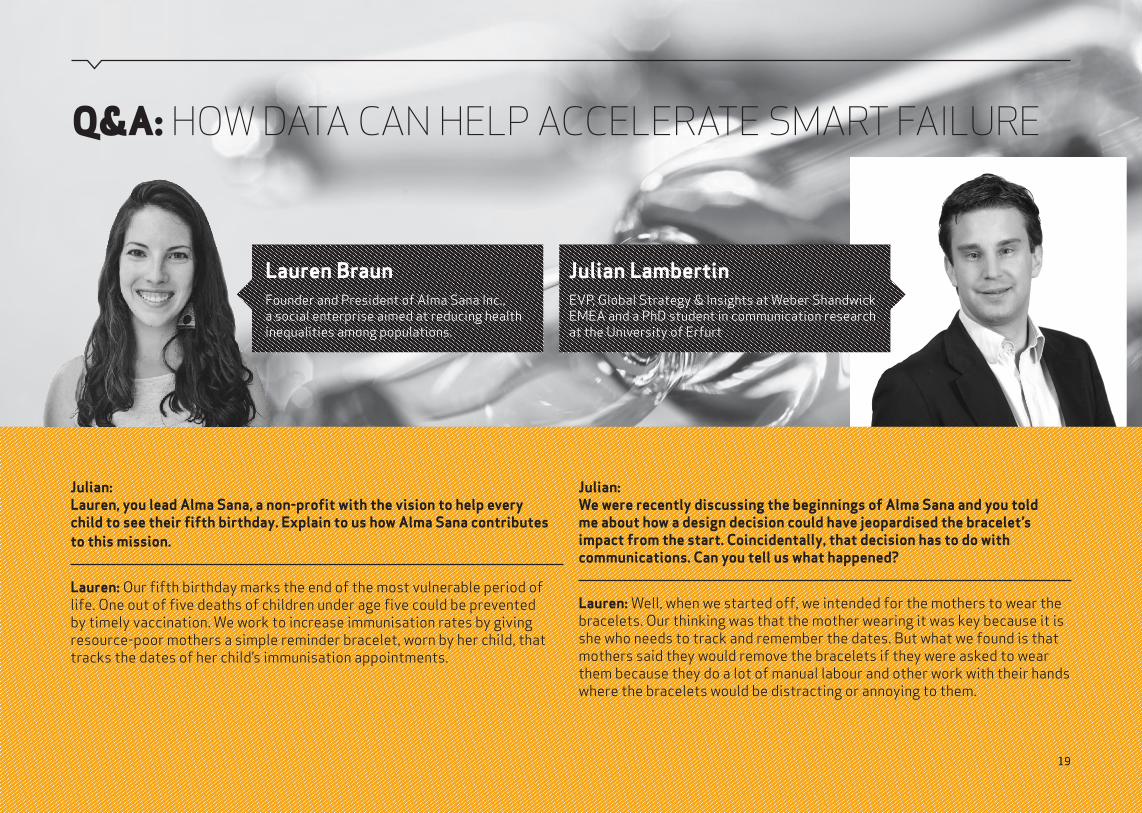
Lauren BraunFounder and President of Alma Sana Inc., a social enterprise aimed at reducing health inequalities among populations.
Julian LambertinEVP, Global Strategy & Insights at Weber Shandwick EMEA and a PhD student in communication research at the University of Erfurt
Julian: Lauren, you lead Alma Sana, a non-profit with the vision to help every child to see their fifth birthday. Explain to us how Alma Sana contributes to this mission.
Lauren: Our fifth birthday marks the end of the most vulnerable period of life. One out of five deaths of children under age five could be prevented by timely vaccination. We work to increase immunisation rates by giving resource-poor mothers a simple reminder bracelet, worn by her child, that tracks the dates of her child’s immunisation appointments.
Julian: We were recently discussing the beginnings of Alma Sana and you told me about how a design decision could have jeopardised the bracelet’s impact from the start. Coincidentally, that decision has to do with communications. Can you tell us what happened?
Lauren: Well, when we started off, we intended for the mothers to wear the bracelets. Our thinking was that the mother wearing it was key because it is she who needs to track and remember the dates. But what we found is that mothers said they would remove the bracelets if they were asked to wear them because they do a lot of manual labour and other work with their hands where the bracelets would be distracting or annoying to them.
19
Q&A: HOW DATA CAN HELP ACCELERATE SMART FAILURE
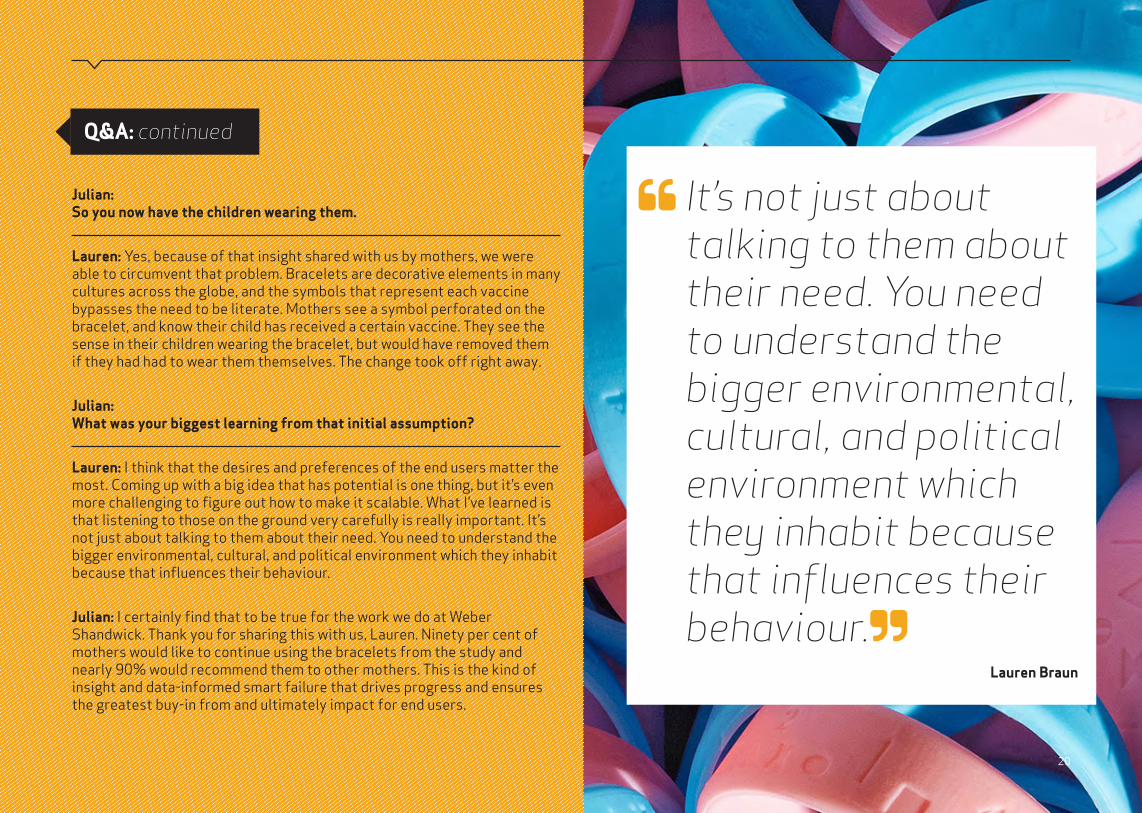
It’s not just about talking to them about their need. You need to understand the bigger environmental, cultural, and political environment which they inhabit because that influences their behaviour.
Lauren Braun
Julian: So you now have the children wearing them.
Lauren: Yes, because of that insight shared with us by mothers, we were able to circumvent that problem. Bracelets are decorative elements in many cultures across the globe, and the symbols that represent each vaccine bypasses the need to be literate. Mothers see a symbol perforated on the bracelet, and know their child has received a certain vaccine. They see the sense in their children wearing the bracelet, but would have removed them if they had had to wear them themselves. The change took off right away.
Julian: What was your biggest learning from that initial assumption?
Lauren: I think that the desires and preferences of the end users matter the most. Coming up with a big idea that has potential is one thing, but it’s even more challenging to figure out how to make it scalable. What I’ve learned is that listening to those on the ground very carefully is really important. It’s not just about talking to them about their need. You need to understand the bigger environmental, cultural, and political environment which they inhabit because that influences their behaviour.
Julian: I certainly find that to be true for the work we do at Weber Shandwick. Thank you for sharing this with us, Lauren. Ninety per cent of mothers would like to continue using the bracelets from the study and nearly 90% would recommend them to other mothers. This is the kind of insight and data-informed smart failure that drives progress and ensures the greatest buy-in from and ultimately impact for end users.
Q&A: continued
20
ADVANCING DATA-DRIVEN GLOBAL DEVELOPMENT
Brian Tjugum, Executive Vice President and EMEA Lead for Weber Shandwick’s Social Impact practice
In the context of the world’s new global development agenda reflected in the UN Sustainable Development Goals (SDGs), there is an imperative to leverage more robust, standardised and transparent data collection and pooling to inform decision-making, accountability and impact for social and environmental progress. Innovators and change-makers need access to more and better data to mine for the insights they need to design, implement and scale sustainable solutions to challenges ranging from climate change, to poverty, to disease. How can we understand the right solution if we can’t even count the causes or the magnitude of the problem? Take, for example, the issue of gender equality. Globally, there is a dearth of data to help us understand the current state of women’s and
girls’ health, childbirth conditions, education, workplace roles, and economic empowerment, let alone track progress towards a higher ambition of gender equality. SDG #5 sets targets to achieve gender equality and empower all women and girls by 2030, but our current data sets don’t provide enough information to set benchmarks. For instance, many lower-income and even some Organisation for Economic Co-operation and Development (OECD) member countries lack reliable, functioning systems to track births, deaths, and marriages. According to the World Bank, an estimated 230 million children under age five have never had their births registered—half of them girls. These girls will grow into women with no formal identity within their country’s social, political and economic systems. Fortunately, many organisations from UN agencies to global NGOs and corporate partners are joining forces to make sure that women and girls are counted and that solutions that affect their equality and empowerment are informed by data-driven strategies. Several of these efforts are highlighted here and on the following page.
Data 2x
Data 2x operates on the notion that one cannot solve issues that disproportionately affect women and girls, such as informal and unpaid work and intimate partner violence, without good data. As a result, Data 2x addresses biased and incomplete data collection vis-à-vis gender equality. Its mission is to improve the quality, availability and use of gender data because without data equality, there can’t be gender equality and vice versa. Data 2x is led by the UN Foundation and supported by the William and Flora Hewlett Foundation and the Bill & Melinda Gates Foundation.
No Ceilings
No Ceilings is a project that looks at the progress of women’s and girl’s rights since 1995 and identifies remaining gaps that demand attention. The project, which sources much of its data from The Clinton Foundation and the Gates Foundation, allows users to explore various issue areas, including hygiene, education and child labour. The Foundations work with partners
21
22
Droga5, FathomInformation Design, Scratch, The Economist Intelligence Unit, and WORLD Policy Analysis Effort to collect data and inform solutions.
OECD Gender Initiative
The OECD Gender Initiative, within The Organisation for Economic Cooperation and Development (OECD), looks into barriers to gender equality in areas including employment, education and entrepreneurship. It houses gender-specific data for indicators including the gender wage gap, reading performance and length of maternity leave, parental leave and paid father-specific leave.
SDG Data Research Partnership for Gender Targets
Announced at the 2016 Women Deliver global conference, this joint initiative led by groups including Plan International, the International Women’s Health Coalition, KPMG, ONE Campaign and Women Deliver, will ensure decision-makers
are held to account on promises to achieve true equality for girls and women during the 15-year implementation of the UN Sustainable Development Goals. Notably, measuring progress for girls under 15 years of age who become pregnant globally is a focus of the project.
Together for Girls
Together for Girls spotlights the global problem of violence against children. It leverages three strategies to carry out its mission: national surveys and data, evidence-based policy actions and programmes, and global advocacy and public awareness campaigns. Together for Girls approaches its work in a bottom-up model; the entire process from initial ideation to implementation and results is driven by local perspectives with all stakeholders in mind.
Purpose-driven data can better equip decision- makers, policymakers and any investor in social impact with knowledge about target populations and evidence about programmes and interventions that work so they can redouble investment in proven models. Similarly, purpose-driven data tracking can help hold public sector leaders, funders and programme managers accountable to stakeholders on the social, health and environmental outcomes they promote.
Better decisions and accountability are the keys to better and sustainable impact and progress. But it all starts with a robust data commons and the resourcing (both technology and people) to mine the data for smarter insights that: (1) lead to recommendations to deepen engagement on the issues that affect us all, and (2) achieve better solutions that improve the wellbeing of people and the planet. Efforts like the initiatives referenced here are a good beginning, but it will take collabouration across organisations and sectors to achieve the large-scale innovation and change we need.
Advancing Data-Driven Global Development: continued
PURPOSE-DRIVEN DATA RESOURCES
23
In the pages that follow, we put the age of “Human Data” in the context of the evolution of “Big Data” and track the progress of data-driven journalism. We also offer some practical advice and considerations to apply against your organisation's social impact data practices and provide example data commons resources. In addition, we highlight organisations and programmes that are leading social and environmental progress through purpose-driven data and analytics. We hope you find these resources informative and inspirational for your social impact communications and programmes.
Not everything that can be counted counts, and not everything that counts can be counted.ALBERT EINSTEIN
24
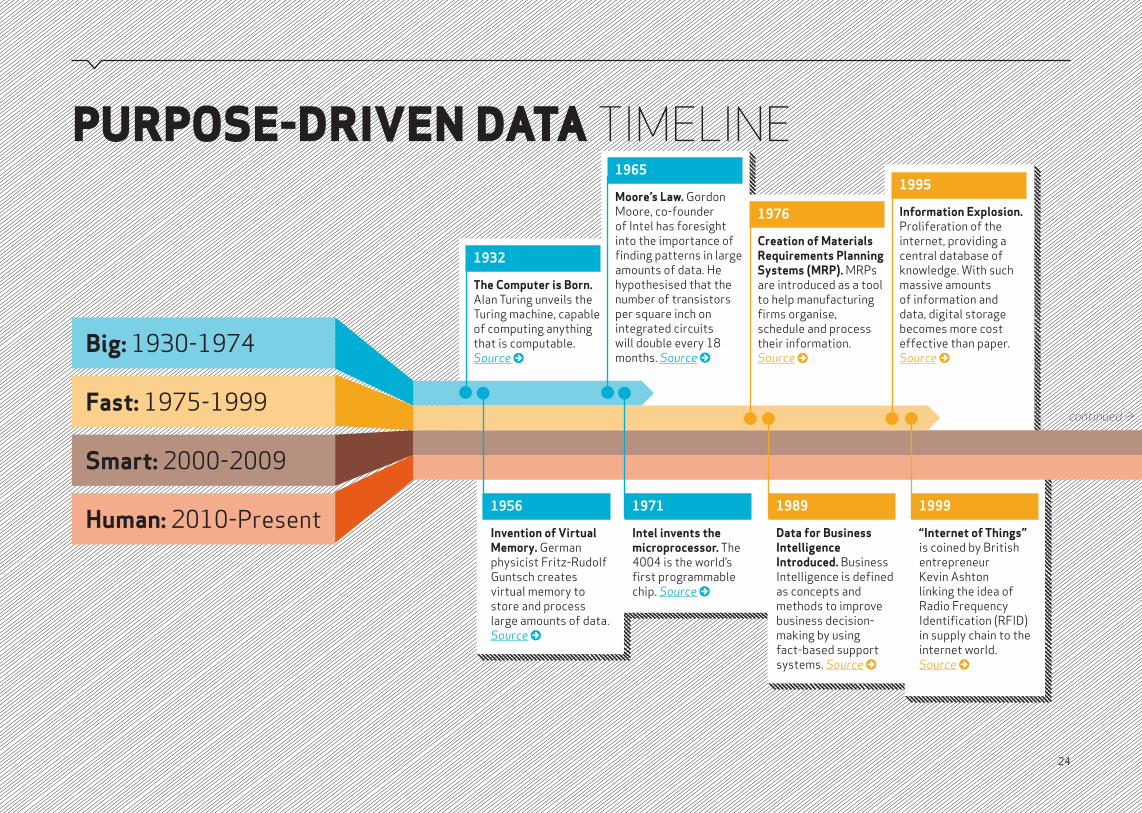
PURPOSE-DRIVEN DATA TIMELINE
1932
The Computer is Born. Alan Turing unveils the Turing machine, capable of computing anything that is computable.Source
1976
Creation of Materials Requirements Planning Systems (MRP). MRPs are introduced as a tool to help manufacturing firms organise, schedule and process their information.Source
1995
Information Explosion. Proliferation of the internet, providing a central database of knowledge. With such massive amounts of information and data, digital storage becomes more cost effective than paper. Source
1965
Moore’s Law. Gordon Moore, co-founder of Intel has foresight into the importance of finding patterns in large amounts of data. He hypothesised that the number of transistors per square inch on integrated circuits will double every 18 months. Source
1956
Invention of Virtual Memory. German physicist Fritz-Rudolf Guntsch creates virtual memory to store and process large amounts of data. Source
1971
Intel invents the microprocessor. The 4004 is the world’s first programmable chip. Source
1989
Data for Business Intelligence Introduced. Business Intelligence is defined as concepts and methods to improve business decision-making by using fact-based support systems. Source
1999
“Internet of Things” is coined by British entrepreneur Kevin Ashton linking the idea of Radio Frequency Identification (RFID) in supply chain to the internet world. Source
continued ≥
Big: 1930-1974
Fast: 1975-1999
Smart: 2000-2009
Human: 2010-Present
25
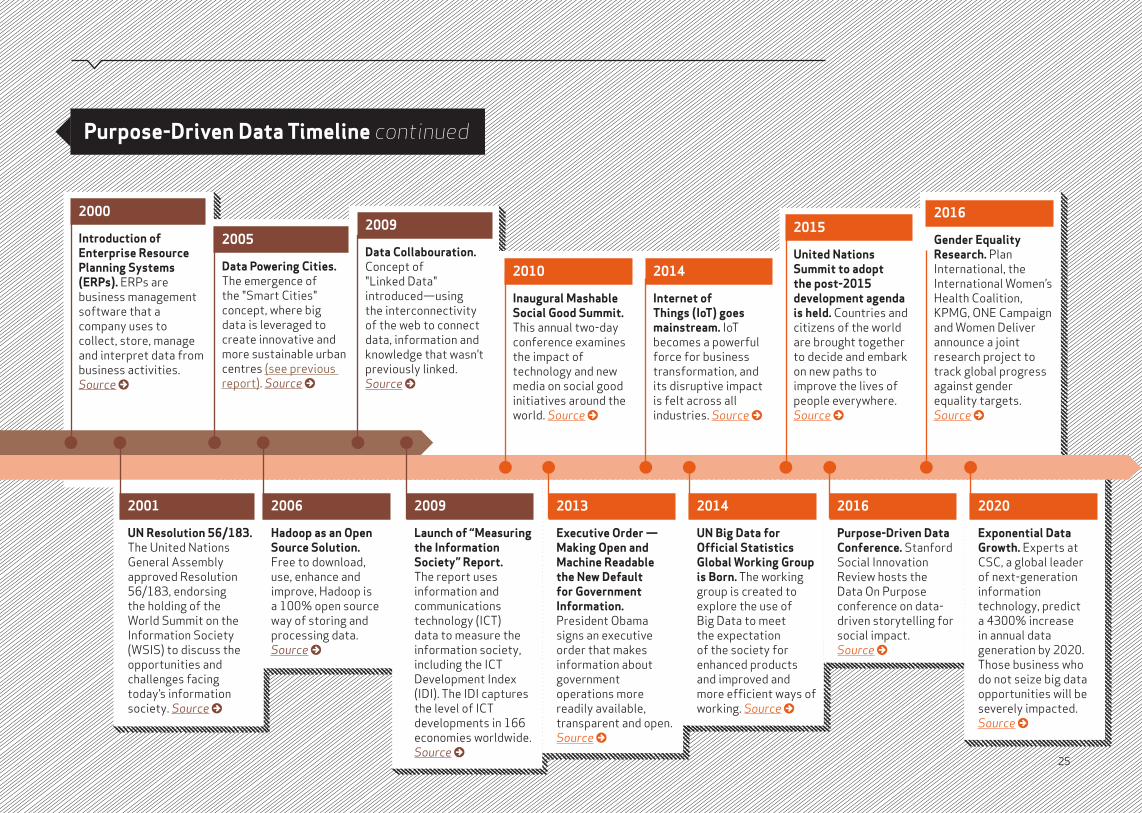
2010
Inaugural Mashable Social Good Summit. This annual two-day conference examines the impact of technology and new media on social good initiatives around the world. Source
2015
United Nations Summit to adopt the post-2015 development agenda is held. Countries and citizens of the world are brought together to decide and embark on new paths to improve the lives of people everywhere. Source
2014
Internet of Things (IoT) goes mainstream. IoT becomes a powerful force for business transformation, and its disruptive impact is felt across all industries. Source
2016
Gender Equality Research. Plan International, the International Women’s Health Coalition, KPMG, ONE Campaign and Women Deliver announce a joint research project to track global progress against gender equality targets. Source
2013
Executive Order — Making Open and Machine Readable the New Default for Government Information. President Obama signs an executive order that makes information about government operations more readily available, transparent and open. Source
2016
Purpose-Driven Data Conference. Stanford Social Innovation Review hosts the Data On Purpose conference on data-driven storytelling for social impact. Source
2014
UN Big Data for Official Statistics Global Working Group is Born. The working group is created to explore the use of Big Data to meet the expectation of the society for enhanced products and improved and more efficient ways of working. Source
2020
Exponential Data Growth. Experts at CSC, a global leader of next-generation information technology, predict a 4300% increase in annual data generation by 2020. Those business who do not seize big data opportunities will be severely impacted.Source
Purpose-Driven Data Timeline continued
2000
Introduction of Enterprise Resource Planning Systems (ERPs). ERPs are business management software that a company uses to collect, store, manage and interpret data from business activities.Source
2005
Data Powering Cities. The emergence of the "Smart Cities" concept, where big data is leveraged to create innovative and more sustainable urban centres (see previous report). Source
2009
Data Collabouration. Concept of "Linked Data" introduced—using the interconnectivity of the web to connect data, information and knowledge that wasn’t previously linked. Source
2001
UN Resolution 56/183. The United Nations General Assembly approved Resolution 56/183, endorsing the holding of the World Summit on the Information Society (WSIS) to discuss the opportunities and challenges facing today’s information society. Source
2006
Hadoop as an Open Source Solution. Free to download, use, enhance and improve, Hadoop is a 100% open source way of storing and processing data. Source
2009
Launch of “Measuring the Information Society” Report.The report uses information and communications technology (ICT) data to measure the information society, including the ICT Development Index (IDI). The IDI captures the level of ICT developments in 166 economies worldwide. Source
JOURNALISM IN THE AGE OF HUMAN DATA
26
Kate Olsen, Senior Vice President in Weber Shandwick’s Social Impact practice
The role of journalism is to inform people on the issues
and happenings of the day. That job becomes exponentially harder in an environment of information and data overload. No longer can reporters only rely on their instincts and interactions with sources to verify the story. Now they have to develop data science expertise and sift through troves of information to even begin to piece together what is really going on—not to mention be able to prove when others are using faulty data for their own means.
In fact, citizens and stakeholders rely more than ever on trusted sources of news to understand what is happening in the world and calibrate the
crowdsourced user-generated content they see in their social network feeds. Media outlets, and emerging platforms such as Medium, have become important filters to validate the glut of data and information people see and share on a daily basis.
In an era of sensational headlines and sound bites, how can we use data journalism to cut through the noise and truly educate each other on the critical issues we face as a global society?
The key, as Nicholas Lemann—professor and dean emeritus at the Columbia Journalism School, and staff writer for The New Yorker —asserts, is a method for journalism that “integrates knowledge and analysis while preserving the art of storytelling.”
27
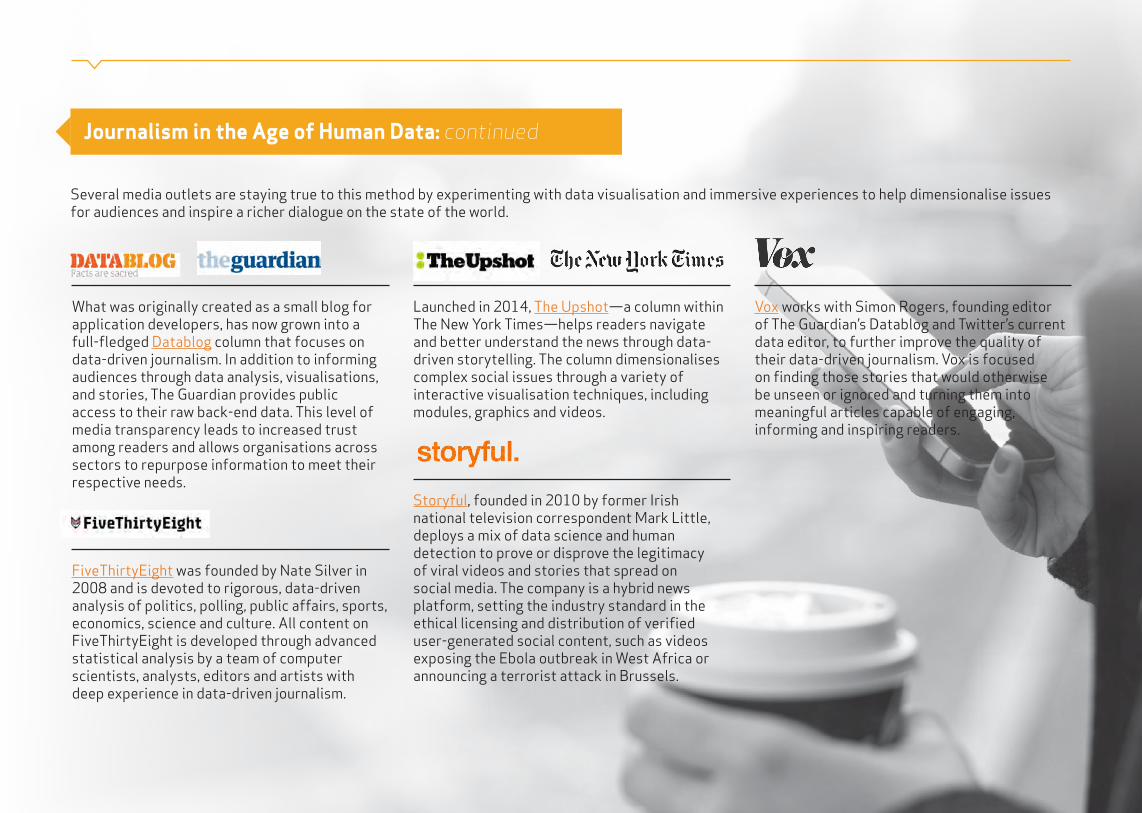
What was originally created as a small blog for application developers, has now grown into a full-fledged Datablog column that focuses on data-driven journalism. In addition to informing audiences through data analysis, visualisations, and stories, The Guardian provides public access to their raw back-end data. This level of media transparency leads to increased trust among readers and allows organisations across sectors to repurpose information to meet their respective needs.
FiveThirtyEight was founded by Nate Silver in 2008 and is devoted to rigorous, data-driven analysis of politics, polling, public affairs, sports, economics, science and culture. All content on FiveThirtyEight is developed through advanced statistical analysis by a team of computer scientists, analysts, editors and artists with deep experience in data-driven journalism.
Launched in 2014, The Upshot—a column within The New York Times—helps readers navigate and better understand the news through data-driven storytelling. The column dimensionalises complex social issues through a variety of interactive visualisation techniques, including modules, graphics and videos.
Storyful, founded in 2010 by former Irish national television correspondent Mark Little, deploys a mix of data science and human detection to prove or disprove the legitimacy of viral videos and stories that spread on social media. The company is a hybrid news platform, setting the industry standard in the ethical licensing and distribution of verified user-generated social content, such as videos exposing the Ebola outbreak in West Africa or announcing a terrorist attack in Brussels.
Vox works with Simon Rogers, founding editor of The Guardian’s Datablog and Twitter’s current data editor, to further improve the quality of their data-driven journalism. Vox is focused on finding those stories that would otherwise be unseen or ignored and turning them into meaningful articles capable of engaging, informing and inspiring readers.
Journalism in the Age of Human Data: continued
Several media outlets are staying true to this method by experimenting with data visualisation and immersive experiences to help dimensionalise issues for audiences and inspire a richer dialogue on the state of the world.
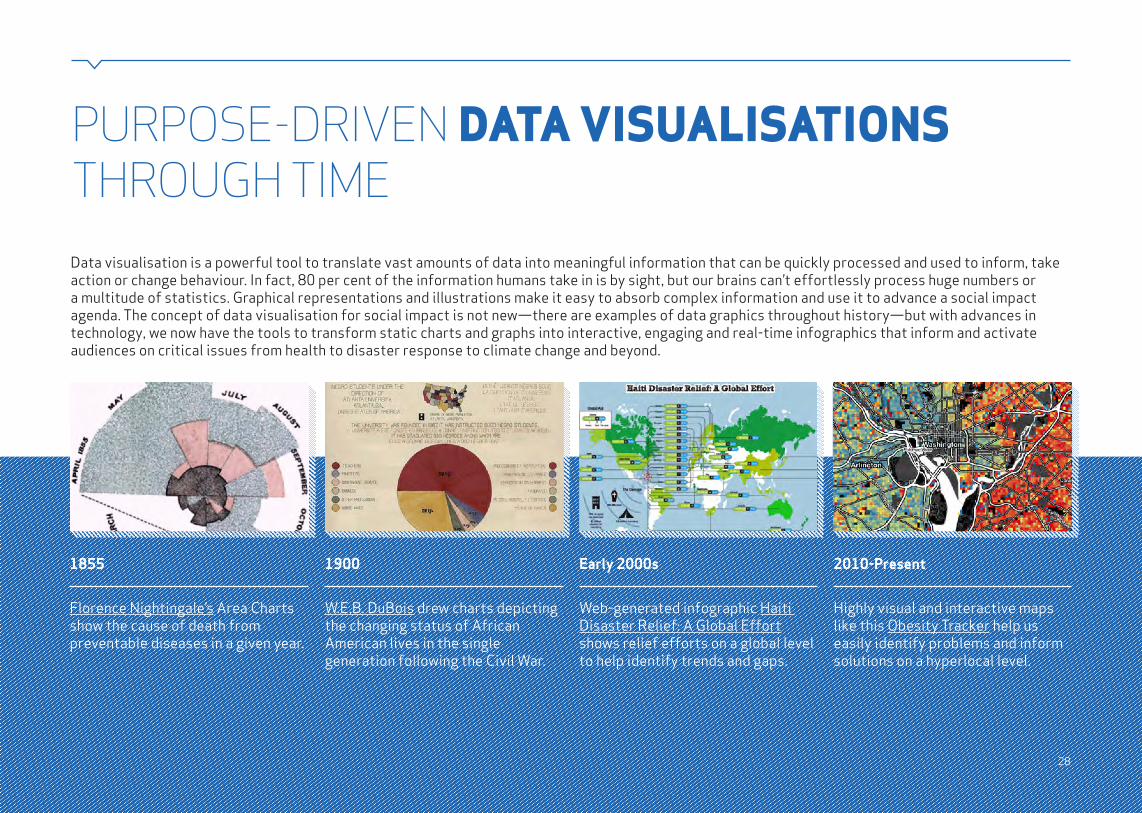
PURPOSE-DRIVEN DATA VISUALISATIONS THROUGH TIMEData visualisation is a powerful tool to translate vast amounts of data into meaningful information that can be quickly processed and used to inform, take action or change behaviour. In fact, 80 per cent of the information humans take in is by sight, but our brains can’t effortlessly process huge numbers or a multitude of statistics. Graphical representations and illustrations make it easy to absorb complex information and use it to advance a social impact agenda. The concept of data visualisation for social impact is not new—there are examples of data graphics throughout history—but with advances in technology, we now have the tools to transform static charts and graphs into interactive, engaging and real-time infographics that inform and activate audiences on critical issues from health to disaster response to climate change and beyond.
1855
Florence Nightingale’s Area Charts show the cause of death from preventable diseases in a given year.
Early 2000s
Web-generated infographic Haiti Disaster Relief: A Global Effort shows relief efforts on a global level to help identify trends and gaps.
2010-Present
Highly visual and interactive maps like this Obesity Tracker help us easily identify problems and inform solutions on a hyperlocal level.
1900
W.E.B. DuBois drew charts depicting the changing status of African American lives in the single generation following the Civil War.
28
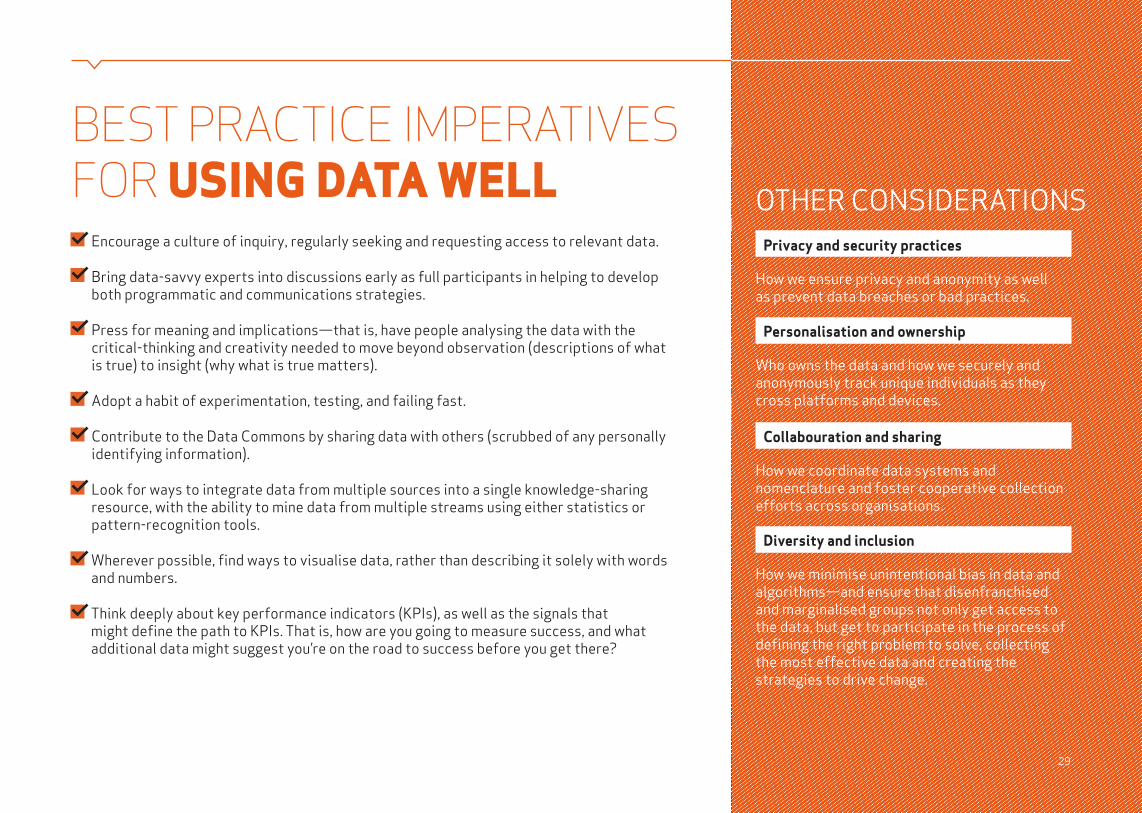
BEST PRACTICE IMPERATIVES FOR USING DATA WELL
Encourage a culture of inquiry, regularly seeking and requesting access to relevant data.
Bring data-savvy experts into discussions early as full participants in helping to develop both programmatic and communications strategies.
Press for meaning and implications—that is, have people analysing the data with the critical-thinking and creativity needed to move beyond observation (descriptions of what is true) to insight (why what is true matters).
Adopt a habit of experimentation, testing, and failing fast.
Contribute to the Data Commons by sharing data with others (scrubbed of any personally identifying information).
Look for ways to integrate data from multiple sources into a single knowledge-sharing resource, with the ability to mine data from multiple streams using either statistics or pattern-recognition tools.
Wherever possible, find ways to visualise data, rather than describing it solely with words and numbers.
Think deeply about key performance indicators (KPIs), as well as the signals that might define the path to KPIs. That is, how are you going to measure success, and what additional data might suggest you’re on the road to success before you get there?
Privacy and security practices
How we ensure privacy and anonymity as well as prevent data breaches or bad practices.
Personalisation and ownership
Who owns the data and how we securely and anonymously track unique individuals as they cross platforms and devices.
Collabouration and sharing
How we coordinate data systems and nomenclature and foster cooperative collection efforts across organisations.
Diversity and inclusion
How we minimise unintentional bias in data and algorithms—and ensure that disenfranchised and marginalised groups not only get access to the data, but get to participate in the process of defining the right problem to solve, collecting the most effective data and creating the strategies to drive change.
OTHER CONSIDERATIONS
29
DATA COMMONS RESOURCESA sampling of places to find open-source social impact and global development data
The Dataverse Project is an open source web application to share, preserve, cite, explore, and analyse research data. It facilitates making data available to others, and allows you to replicate others’ work more easily. Researchers, data authors, publishers, data distributors, and affiliated institutions all receive academic credit and web visibility.
Economist Intelligence Unit provides advisory and financial analyses for every country to help identify both potential risks and opportunities.
Global Open Data Index provides a civil society audit of how governments actually publish data—with input and review from citizens and organisations around the world. Similarly, Google hosts a map of global open data initiatives with links to the available databases.
Global Partnership for Sustainable Development Goals Data is an open, multi-stakeholder network of 150+ partners working to harness the data revolution for sustainable development.
The SDG Philanthropy Platform tracks grant funding for programmes aligned with the SDGs pledged by hundreds of foundations and philanthropists across many countries.
UN Databases provide detailed information and statistics on each UN member nation, including a history of their involvement in the UN.
UN Environment Programme (UNEP) created the Global Environment Goals (GEG) Live Tracker website to provide information on progress towards achieving internationally agreed environmental goals and objectives and the SDGs.
USAID Development Data Library is a thorough database of development projects and information, organised both by topic and location.
The World Bank provides comprehensive, detailed development data for countries around the world.
30
31
LEARN MORE In “Slimming Down Big Data,” Weber Shandwick’s Global Strategy & Insights Executive Vice President for EMEA Julian Lambertin writes that because of the growth in quantity and diversity of data, people and organisations do not effectively use data that they already have. Lambertin mentions that going through a data streamlining process—which he outlines in the article—can help turn unwieldy data into valuable, actionable insights. Lambertin defines those actionable insights as indicators that help organisations make more effective, data-driven decisions.
Columbia University’s Data Science Institute is training the next generation of data scientists and developing innovative technology to serve society. The Institute seeks to foster collabouration in advancing techniques to gather and interpret data, and to address the urgent problems facing society. Weber Shandwick is the first public relations firm to become a member of its Affiliates Program, through which it will co-create research projects across the Institute’s focus areas, including health and patient care, enhancing communication and interaction within communities, and data security.
Brookings Financial & Digital Inclusion Project is an interactive data set that provides scorecard visualisations of affordable financial services for underserved individuals across 21 countries. FDIP uses four metrics to score countries: country commitment, mobile capacity, regulatory environment and adoption. FDIP seeks to illuminate insights to questions including: “Do country commitments make a difference in progress toward financial inclusion”; “To what extent do mobile and other digital technologies advance financial inclusion”; and “What legal, policy, and regulatory approaches promote financial inclusion?”
Data for Good is a collabourative effort between GOOD Magazine and Progressive to address a variety of issues through data visualisation. The initiative focuses on engaging its millennial audience on data-driven approaches to social issues. Some are profound (The Causalities of Gun Deaths and Terrorism Visualised) and some are on the lighter side (Why Do Humans Love Spicy Food?).
DataKind seeks to bring the world together to harness the power of data to address a variety of critical humanitarian issues. It pairs top data scientists with leading social change organisations to find innovative ways to use the power of data for social impact. For example,
in Bengaluru, India, DataKind aimed to create a recommendation platform for international nonprofit Digital Green’s education videos designed to help farmers make more informed decisions.
Project Sunroof is Google’s global clean energy initiative that aims to connect sustainability-minded individuals and organisations to the information and resources necessary to harness the power of solar energy. Interested parties can enter an address to see how much money they could save by installing solar panels, how many hours of usable sunlight they receive per year, and how many square feet are available for solar panels. Project Sunroof uses analysis of weather patterns, 3D modelling of roofs and nearby trees. It also provides financing resources and connects users to local solar providers.
UN Global Pulse aggregates data about how populations cope in times of stress. For example, the ways in which people interact with money on mobile devices can indicate overall economic well-being, and online food prices can signal food shortages before a crisis hits. In short, Global Pulse looks at how digital signals can strengthen international development. Global Pulse operates as a network of innovation labs and partners with experts from the UN as well as governments, academia and the private sector.
32
CONTACT US TO EXPLORE SOCIAL IMPACT OPPORTUNITIESPAUL MASSEY
Global Lead – Washington, D.C.Executive Vice President [email protected] +202 585 2799
VICTORIA BAXTER
Americas Lead – Washington, D.C.Senior Vice President & Management Supervisor [email protected] +202 585 2128
BRIAN TJUGUM
EMEA Lead – LondonGlobal Director, Health Impact [email protected] +44 20 7067 0610
IAN RUMSBY
APAC Lead – SydneyChair, Australia & Chief Strategy Officer [email protected] +61 2 9994 4475
KATE OLSEN
Thought Leadership Lead – Washington D.C.Senior Vice President [email protected] +202 585 2045
The Innovation Trends Report series is brought to you by Weber Shandwick’s Social Impact practice, a global team working at the intersection of corporate social responsibility (CSR), sustainability and social issues. We created this resource to build awareness and fuel dialogue around the fast-growing Solution Economy—multidisciplinary and collabourative efforts by companies, foundations, nonprofits and governments to solve social problems. We create strategies and engagement campaigns that focus attention, spark action and drive tangible outcomes for complex social problems such as poverty, climate change and inequality. Contact us to learn more and explore ways we might work together.
socialIMPACT

Copyright September 2016