PUMP STATIONS20 - cityofpae.sa.gov.au
64
PUMP STATIONS ASSET MANAGEMENT PLAN 20 20
Transcript of PUMP STATIONS20 - cityofpae.sa.gov.au

Asset Management Plan 2020 - Pump Stations 1
PUMP STATIONSASSET MANAGEMENT PLAN
20 20

PUMP STATIONSASSET MANAGEMENT PLAN
20 20
2 Asset Management Plan 2020 - Pump Stations
Document Control
Port Adelaide Enfield Council: Pump Station Asset Management Plan
Rev No Date Revision Details Author Reviewer Approver
1 Aug-2008 Adopted: Dec 2008 RK GB WI
2 May-2013 Adopted: June 2013 JN GB WI
3 Sept-2016 Adopted: November 2016 JN GB / SD WI
4 Sept-2020 Adopted: November 2020 TC Stormwater Custodian Group
AM Steering Group
4.1 June-2021 Addendum: June 2021 JN MB AM Steering Group

TABLE OF CONTENTS1. EXECUTIVE SUMMARY ............................................................................................................................... 4
2. INTRODUCTION ......................................................................................................................................... 6
2.1 Background .............................................................................................................................................. 7
2.2 Core and Advanced Asset Management ............................................................................................ 9
3. LEVELS OF SERVICE ...................................................................................................................................10
3.1 Customer Research and Expectations .............................................................................................11
3.2 Strategic and Corporate Goals .........................................................................................................14
3.3 Legislative Requirements ....................................................................................................................17
3.4 Customer Levels of Service ...............................................................................................................17
3.5 Technical Levels of Service .................................................................................................................18
4. FUTURE DEMAND .....................................................................................................................................20
4.1 Demand – Specifically Climate Change ...........................................................................................21
4.1 Demand Management Plan .................................................................................................................23
4.2 Asset Programs to meet Demand .....................................................................................................23
5. LIFECYCLE MANAGEMENT PLAN .......................................................................................................24
5.1 Background Data ..................................................................................................................................25
5.2 Operations and Maintenance Plan ....................................................................................................27
5.3 Renewal/Replacement Plan .................................................................................................................32
5.4 Creation/Acquisition/Upgrade Plan ..................................................................................................34
5.5 Disposal Plan ..........................................................................................................................................35
6. RISK MANAGEMENT ................................................................................................................................36
6.1 Critical Assets.......................................................................................................................................37
6.2 Risk Assessment ....................................................................................................................................37
7. FINANCIAL SUMMARY .............................................................................................................................40
7.1 Financial Statements and Projections ...............................................................................................41
7.2 Funding Strategy ...................................................................................................................................43
7.3 Forecast Reliability and Confidence .................................................................................................43
8. PLAN IMPROVEMENT AND MONITORING ......................................................................................46
8.1 Status of Asset Management Practices .............................................................................................47
8.2 Improvement Plan .................................................................................................................................48
8.3 Monitoring and Review Procedures .................................................................................................48
8.4 Performance Measures ........................................................................................................................49
9. REFERENCES ................................................................................................................................................50
10. APPENDICES ................................................................................................................................................53
Appendix A Projected 10-year Capital Renewal and Replacement Works Program ............................54
Appendix B Projected Upgrade/Exp/New 10-year Capital Works Program ..........................................56
Appendix C Budgeted Expenditures Accommodated in LTFP ..................................................................58
Addendum .............................................................................................................................................................60
Asset Management Plan 2020 - Pump Stations 3
1EXECUTIVE SUMMARY
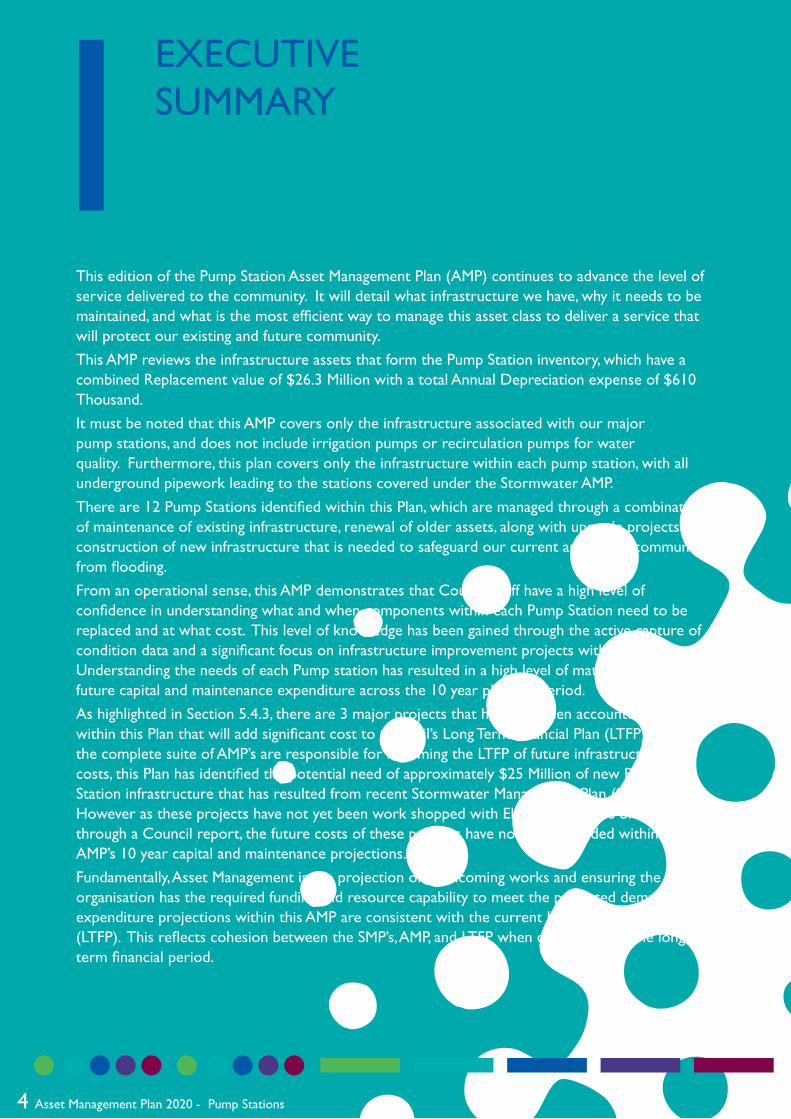
This edition of the Pump Station Asset Management Plan (AMP) continues to advance the level of service delivered to the community. It will detail what infrastructure we have, why it needs to be maintained, and what is the most efficient way to manage this asset class to deliver a service that will protect our existing and future community.
This AMP reviews the infrastructure assets that form the Pump Station inventory, which have a combined Replacement value of $26.3 Million with a total Annual Depreciation expense of $610 Thousand.
It must be noted that this AMP covers only the infrastructure associated with our major pump stations, and does not include irrigation pumps or recirculation pumps for water quality. Furthermore, this plan covers only the infrastructure within each pump station, with all underground pipework leading to the stations covered under the Stormwater AMP.
There are 12 Pump Stations identified within this Plan, which are managed through a combination of maintenance of existing infrastructure, renewal of older assets, along with upgrade projects and construction of new infrastructure that is needed to safeguard our current and future communities from flooding.
From an operational sense, this AMP demonstrates that Council staff have a high level of confidence in understanding what and when components within each Pump Station need to be replaced and at what cost. This level of knowledge has been gained through the active capture of condition data and a significant focus on infrastructure improvement projects within recent years. Understanding the needs of each Pump station has resulted in a high level of maturity in projecting future capital and maintenance expenditure across the 10 year planning period.
As highlighted in Section 5.4.3, there are 3 major projects that have not been accounted for within this Plan that will add significant cost to Council’s Long Term Financial Plan (LTFP). As the complete suite of AMP’s are responsible for informing the LTFP of future infrastructure costs, this Plan has identified the potential need of approximately $25 Million of new Pump Station infrastructure that has resulted from recent Stormwater Management Plan (SMP) studies. However as these projects have not yet been work shopped with Elected Members or formalised through a Council report, the future costs of these projects have not been included within this AMP’s 10 year capital and maintenance projections.
Fundamentally, Asset Management is the projection of forthcoming works and ensuring the organisation has the required funding and resource capability to meet the projected demand. The expenditure projections within this AMP are consistent with the current Long Term Financial Plan (LTFP). This reflects cohesion between the SMP’s, AMP, and LTFP when committing to the long term financial period.
4 Asset Management Plan 2020 - Pump Stations

Asset Management Plan 2020 - Pump Stations 5

2INTRODUCTION
6 Asset Management Plan 2020 - Pump Stations

2.1 Background
This asset management plan is designed to comply with ISO 55000 for Asset Management, and communicates the actions required for the responsive management of assets (and services provided from assets), compliance with regulatory requirements, and funding needed to provide the required levels of service over a 20-year planning period.
It follows the format for AM Plans recommended in Section 4 of the International Infrastructure Management Manual1 .
The plan is to be read with the Asset Management Policy and Asset Management Strategy where these have been developed along with the following associated planning documents:
• Lefrevre Peninsula Stormwater Management Plan
• Port River East Stormwater Management Plan
• Stormwater Drainage Asset Management Plan
The infrastructure assets covered by this asset management plan are shown in Table 2.1. These assets are used to provide drainage services to the community where this cannot be achieved by
Asset Management Plan 2020 - Pump Stations 7
Table 2.1: Assets covered by this Plan
1 IPWEA, 2015, Sec 4.2, Example of an Asset Management Plan Structure, pp 4|37 – 39.

8 Asset Management Plan 2020 - Pump Stations
Figure 2.1.1 Examples of the wide variety of assets found at Stormwater pump stations
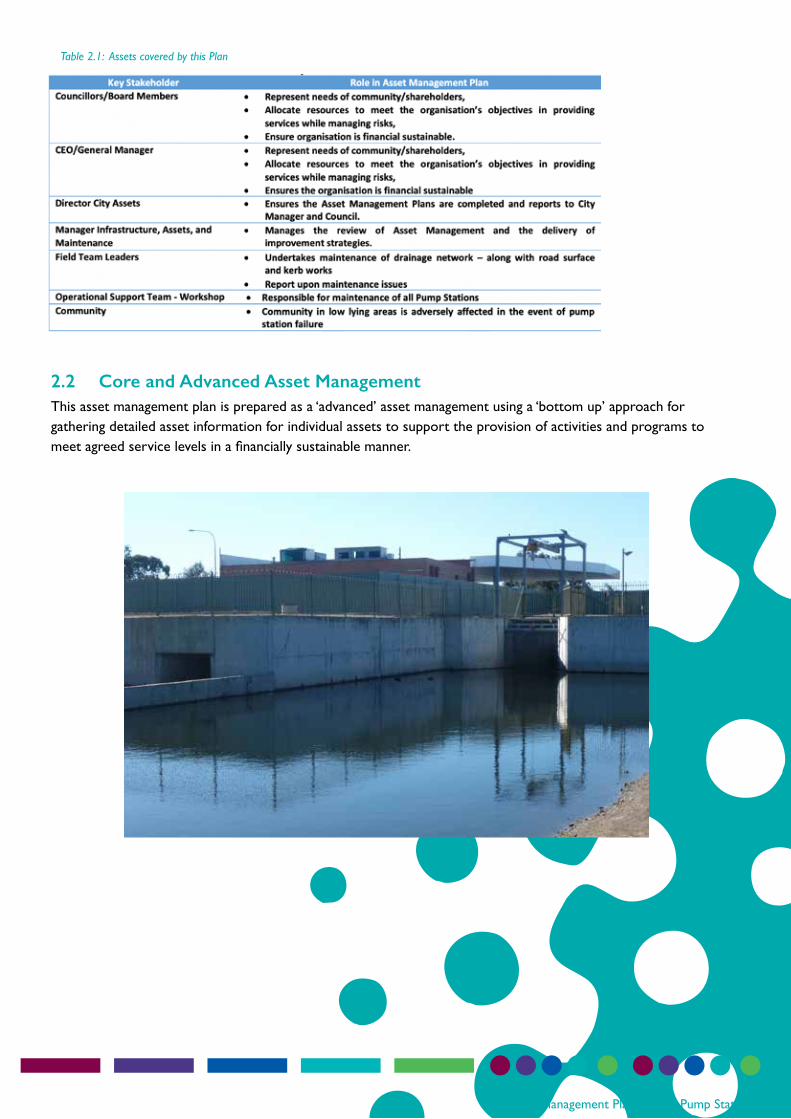
2.2 Core and Advanced Asset ManagementThis asset management plan is prepared as a ‘advanced’ asset management using a ‘bottom up’ approach for gathering detailed asset information for individual assets to support the provision of activities and programs to meet agreed service levels in a financially sustainable manner.
Asset Management Plan 2020 - Pump Stations 9
Table 2.1: Assets covered by this Plan

10 Asset Management Plan 2020 - Pump Stations
3LEVELS OF SERVICE

Asset Management Plan 2020 - Pump Stations 11
3.1 Customer Research and ExpectationsA survey was undertaken in both 2016 and 2019 to measure the community perception of the assets that provide services to the community. The overall objectives of the survey was to capture the community’s consideration of Council’s infrastructure assets. It was conducted across 400 households (statistically relevant survey sample) that were invited to partake. The data collection method was used was online surveys, CATI (computer assisted telephone interviews) and face to face interviews. The aim of the survey was to measure:
• Community perceptions of the importance of these services
• Current levels of satisfaction with these services, and
• Future priorities in terms of information on what Council potentially over or under service
The survey targeted an equal number of households equivalent to previous 2016 survey in each of the five Statistical Local Areas (Coast, Port, Inner, Park and East) in the Council area. These areas are detailed below:
Females51%
Males49%
15%17%
19% 19%16%
14%
18-29 30-39 40-49 50-59 60-69 70+
Age
Data Collection Method
CATI 22%
Intercept 6%
Online 72%
Figure 3.1.1 Basic Customer survey for the City of Port Adelaide Enfield

12 Asset Management Plan 2020 - Pump Stations
Figure 3.1.2 – Satisfaction in stormwater drainage has increased in the coast and port regions where pump stations are part of the network.
The following shows a series of services provided and details the satisfaction with Stormwater based on Statistical Local Areas across the Council area
Figure 3.1.3 showing stormwater pump stations is considered by the public to be the least important stormwater priority, except in the low lying coast area which relies upon them.
Figure 3.1.4 Stormwater pump stations are considered important by the public

Asset Management Plan 2020 - Pump Stations 13
Figure 3.1d – The public is largely indifferent to stormwater pump stations, but concerned with drainage overall, likely because they only effect part of council, most are unaware these pump stations exist, and cannot assess their performance.

14 Asset Management Plan 2020 - Pump Stations
The most common specific comments from the public regarding stormwater pump stations:1. Am unaware of their existence, or know nothing of their operation (8 responses)2. I still see flooding, so they must not be working (2 responses)In conclusion only in the coastal region do people have any awareness of stormwater pump stations and pump stations performance cannot be easily observed or assessed by the general public
3.2 Strategic and Corporate GoalsThe City of Port Adelaide Enfield is guided by the City Plan 2030. The vision of the City Plan is for:
A city that values its diverse community and embraces change through innovation, resilience and community leadership’
ECONOMYWe are a thriving economy and a business-friendly City• That the infrastructure provided under this Asset Management Plan is successfully connecting business
and industry to opportunity and prosperity.
• Sourcing goods and services locally is considered when undertaking procurement.
Prosperous • Connected • Growing
COMMUNITYWe are a safe, vibrant, inclusive and welcoming city for our residents, businesses and visitors alike• To ensure that the infrastructure provided under this Asset Management Plans achieving a Level of
Service that is expected by the community and its Elected Members.
Healthy • Inclusive • Cohesive
ENVIRONMENT and HERITAGEWe are a low carbon, water sensitive and climate resilient City and our built heritage is protected, embraced and celebrated• Sustainability, water and energy efficiency are considered when upgrading assets
Distinctive • Adaptable • Sustainable
PLACEMAKINGWe are a unique and distinctive collection of active places, created and cared for through strong partnerships
• To ensure that the infrastructure provided under this Asset Management Plan is delivering a safe environment for the community – ensuring access and linkage for people to conduct their life and business activities
Belonging • Accessible • Creative
LEADERSHIPWe are an innovative, collaborative and high performing leader within local government• To measure the organisation’s performance through key financial indicators and accuracy of data and to advance
Council’s Asset Management Plan with a strategic improvement plan.
• To outline current levels of expenditure, and to identify projected funding requirements for future projects that
will deliver sustainable infrastructure for the community.
• To connect this Asset Management Plan with the people, relevant organisations and businesses that make up the
Port Adelaide Enfield community through Public Consultation and Community Survey.
Strategic • Accountable • Engaged
Table 3.2.1: Organisational Goals and how these are addressed in this Plan

Asset Management Plan 2020 - Pump Stations 15
Strategic Alignment
This Pump Stations Asset Management Plan primarily fits within the Leadership theme of the City Plan, contributing to decisions being made in a more strategic and accountable manner.
This Asset Management Plan also relates to a number of other Council documents including (but not limited to):
• City Plan
• Asset Management Policy
• Asset Management Strategy
• AdaptWest Region Climate Change Adaptation Plan
• Lefevre Peninsula Stormwater Management Plan
• Port River East Stormwater Management Plan
• Long Term Financial Plan
• Annual Business Plan and Budget
Implementation and adoption of the Pump Stations Asset Management Plan will support the City of Port Adelaide Enfield to achieve the directions of the City Plan 2030.
Figure 3.2 The City of Port Adelaide Enfield Storm Water Pump Station Network Map

16 Asset Management Plan 2020 - Pump Stations
CITY PLAN 2030
Asset Management Policy
Asset Management Strategy
Strategic Plans
ExamplesOpen Space Strategy Environment Strategy
ExamplesStormwater Management Plans Local Area Traffic Management Plan
ExamplesElected Memeber Motions Administration Reports
Council Endorsed Plans
Council Reports
Asset Management Plans
Annual 10 Year Capital Review
Endorsed Renew/Replacement
Annual Business Plan & Budget
Endorsed New/Upgrade
Asset Register (Age/Condition)
Asset Risk Management
Demand/ Levels of Service
Long Term Financial Plan
ECONOMY • COMMUNITY • ENVIRONMENT • PLACEMAKING • LEADERSHIP& HERITAGE
New Initiative Approval
The organisation will exercise its duty of care to ensure public safety is in accordance with the infrastructure risk management plan prepared in conjunction with this AM Plan. Management of infrastructure risks is covered in Section 5.

Asset Management Plan 2020 - Pump Stations 17
Table 3.3: Legislative Requirements
Table 3.4: Customer Level of Service
3.3 Legislative RequirementsThere are many legislative requirements relating to the management of assets. These include:
3.4 Customer Levels of ServiceService levels are defined service levels in two terms, customer levels of service and technical levels of service.
Customer Levels of Service measure how the community receives the service and whether the organisation is providing community value. They are determined via the public consultation process and customer satisfaction surveys.

18 Asset Management Plan 2020 - Pump Stations
3.5 Technical Levels of ServiceSupporting the customer service levels are operational or technical measures of performance. These technical measures relate to the allocation of resources to service activities to best achieve the desired customer outcomes and demonstrate effective performance.
Technical service measures are linked to the activities and annual budgets covering:
• Operations – the regular activities to provide services (e.g. opening hours, cleansing, mowing grass, energy, inspections, etc.
• Maintenance – the activities necessary to retain an asset as near as practicable to an appropriate service condition. Maintenance activities enable an asset to provide service for its planned life (e.g. road patching, unsealed road grading, building and structure repairs),
• Renewal – the activities that return the service capability of an asset up to that which it had originally (e.g. road resurfacing and pavement reconstruction, pipeline replacement and building component replacement),
• Upgrade/New – the activities to provide a higher level of service (e.g. widening a road, sealing an unsealed road, replacing a pipeline with a larger size) or a new service that did not exist previously (e.g. a new library).
• Service and asset managers plan, implement and control technical service levels to influence the customer service levels2.
Table 3.5 shows the technical levels of service expected to be provided under this AM Plan. The “Desired” position in the table documents the position being recommended in this AM Plan.
2IPWEA, 2015, IIMM, p 2|28.
Table 3.5: Technical Levels of Service
It is important to monitor the service levels provided regularly as these will change. The current performance is influences by work efficiencies and technology, and customer priorities will change over time. Review and establishment of the agreed position which achieves the best balance between service, risk and cost is essential.

Asset Management Plan 2020 - Pump Stations 19

4FUTURE DEMAND
20 Asset Management Plan 2020 - Pump Stations

Asset Management Plan 2020 - Pump Stations 21
Drivers affecting demand include things such as population change, regulations, changes in demographics, seasonal factors, environmental awareness, etc.
The impact of demand drivers that may affect future service delivery and use of assets are shown in Table 4.
Table 4.: Demand Drivers, Projections and Impact on Services
4.1 Demand–SpecificallyClimateChangeThe cities of Port Adelaide-Enfield, Charles Sturt, and West Torrens [comprising the Western Adelaide Planning Region], are in collaboration and have designed the AdaptWest Climate Change Adaptation Plan – which is supported and funded by State, Commonwealth and local government departments and agencies. The plan addresses key priorities for local council operations and decision-making, and informs our community and key stakeholders about opportunities for practical action to adapt to our changing climate.
The AdaptWest Climate Change Adaptation Plan looks 50 years into the future and shows how our Western Region weather patterns will develop over the next few decades. In short:
• Average annual temperatures are likely to rise by up to 2°C;
• Average rainfall will decrease by up to 20%, while rainfall intensity will increase: for each degree of global warming, extreme daily rainfall may increase by 7%.
• Heatwaves – sequences of three or more consecutive days with average temperatures of at least 32°C, are projected to increase from 1 in 20 years under the baseline period to one in every 3-5 years.
• The global mean sea level rise could be as much as 0.26 m, as warming of the ocean results in a 1.4°C rise in global sea surface temperatures.
The combined effects of sea level rise, storm surge and high volumes of stormwater runoff following high intensity rainfall events leads to significant inundation of land, transport routes and commercial and industrial buildings. This has implications for the ongoing operation and viability of current business and industrial areas as well as those planned for potential future industrial development, particularly areas surrounding the Port River Estuary.
A number of investigations have been undertaken to better understand the impact of increases in rainfall intensity and sea level rise on the Port River Estuary.
The Port Adelaide/LeFevre Peninsula Port Adelaide River Seawall Study estimated the potential damages from the combined impacts of sea level rise and land subsidence and recommended seawall infrastructure upgrades. Image 6.4 details such recommendations.

22 Asset Management Plan 2020 - Pump Stations
While many buildings in the Port River Estuary may be at risk of inundation in the future, some facilities such as the Australian Submarine Corporation have been constructed considering future sea levels.
An important adaptation option for further exploration by the Region is to limit further development or relocating development in hazard prone areas. The physical relocation of some assets and infrastructure away from high risk areas is expected to be necessary within a 20-year time frame – not long, given what’s involved.
Source: www.adaptwest.com.au/
Figure 4.1: Adapt West identified opportunities for Infrastructure, Planning, and Policy

Asset Management Plan 2020 - Pump Stations 23
4.1 Demand Management PlanDemand for new services will be managed through a combination of managing existing assets, upgrading of existing assets and providing new assets to meet demand and demand management. Demand management practices include non-asset solutions, insuring against risks and managing failures.
Non-asset solutions focus on providing the required service without the need for asset ownership and management actions including reducing demand for the service, reducing the level of service (allowing some assets to deteriorate beyond current service levels) or educating customers to accept appropriate asset failures3. Examples of non-asset solutions include having new developments raised out of the flood zone, and rainwater tanks installed in properties.
Opportunities identified to date for demand management are shown in Table 4.1. Further opportunities will be developed in future revisions of this asset management plan.
3IPWEA, 2015, IIMM, Table 3.4.1, p 3|89.
Table 4.1: Demand Management Plan Summary
4.2 Asset Programs to meet DemandThe new assets required to meet population growth will be acquired free of cost from land developments and constructed/acquired. New assets constructed/acquired are discussed in Section 5.5.
It is planned over the next 10 years to perform numerous pumping capability upgrades, including:,
• Increase pumping capacity at Hamilton, Hack and Midlunga Pump stations and;
• build new pump stations at Birkenhead and at Largs North.
The plans to build these are better known and hence ‘constructed’ assets are shown with a decent degree of certainty in the graph above. Contributed assets are based upon forecast population growth.
Acquiring these new assets will require a commitment to ongoing operations, maintenance and renewal costs for the period that the service provided from the assets is required. These future costs are identified and considered in developing forecasts of future operations, maintenance and renewal costs in Section 5.

24 Asset Management Plan 2020 - Pump Stations
5LIFECYCLE MANAGEMENT PLAN

Asset Management Plan 2020 - Pump Stations 25
The lifecycle management plan details how the The City of Port Adelaide Enfield plans to manage and operate the assets at the agreed levels of service (defined in Section 3) while managing life cycle costs.
5.1 Background Data5.1.1 Physicalparameters
The assets covered by this asset management plan are shown in Table 2.1.
The majority of our pump stations were constructed as the Lefevre Peninsula area was developed in the 1960 to 1980s. In many cases the infrastructure has been maintained but not overhauled or updated since. The Hargrave pump station was constructed in 2014, and a major expansion at Hart St pump station was built in 2012, thus explaining the large spikes in recent history. This also highlights the under-valuation of the existing pump stations which account for materials and do not account for demolition, excavation, dewatering and modern day construction costs.
The age profile of the assets included in this AM Plan are shown in Figure 5.1.1.f
5.1.2 Assetcapacityandperformance
Assets are generally provided to meet design standards where these are available. Locations where deficiencies in service performance are known are detailed in Table 5.1.2.
Table 5.1.1: Asset age profile

26 Asset Management Plan 2020 - Pump Stations
Table 5.1.2.1: Known Service Performance Deficiencies
*The above service deficiencies were identified from the Lefevre Peninsula and Port River East Stormwater Management Plans created in 2016 and 2019 respectively.
5.1.3 Asset conditionCondition is monitored by inspection and analysis of the assets. The conditions of the assets tend to be skewed by the fact that the newer pump stations are more accurately valued, and all of the new assets can be classed as in very good condition. Because the pump stations are such critical assets any poorly rated assets must be made a priority.
The condition profile of our assets is shown in Figure 5.1.3.1.
Fig 5.1.3.1: Asset Condition Profile
Assets have been inspected within the last 2 years where possible. Some assets such as rising mains present significant challenges to inspect, and as such have not been completed to inspect
Condition is measured using a 1 – 5 grading system as detailed in Table 5.1.3.2.

Asset Management Plan 2020 - Pump Stations 27
Table 5.1.3.2: Simple Condition Grading Model
5.1.4 Asset valuationsThe value of assets recorded in the asset register as at 30 June 2019 is shown below. Assets are valued at:
Gross Replacement Cost $26,228,000
Depreciable Amount $8,528,000
Depreciated Replacement Cost6 $17,670,000
Annual Depreciation $610,500
Useful lives were reviewed in 2019 by comparison with standard lives across council for similar assets, and adjustment to observed rates of deterioration. Key assumptions made in preparing the valuations were:
• Deterioration of assets will occur at a consistent rate regardless of build quality, which is variable
• Land value has not been incorporated
• Valuations by consultant for existing pump stations are assumed to be the present day construction costs and as such does not include excavation, dewatering and many other construction related costs.
Major changes from previous valuations are due to inflation, and a different accounting firm being used for the valuations.
Various ratios of asset consumption and expenditure have been prepared to help guide and gauge asset management performance and trends over time.
Rate of Annual Asset Consumption 2.3%(Depreciation/Depreciable Amount)
Rate of Annual Asset Renewal 4%(Capital renewal expenditure/Depreciable amount)
In 2021 the City of Port Adelaide Enfield will renew assets at 178.5% of the rate they are being consumed and will be increasing its asset stock by 7.2% in the year.
5.2 Operations and Maintenance PlanOperations include regular activities to provide services, e.g. Pit cleaning, generator maintenance, pump oiling and trash rack cleaning.
Routine maintenance is the regular on-going work that is necessary to keep assets operating, including instances where portions of the asset fail and need immediate repair to make the asset operational again, e.g. clearing blockages.
6Also reported as Written Down Value, Carrying or Net Book Value.

28 Asset Management Plan 2020 - Pump Stations
5.2.1 Operations and Maintenance PlanMaintenance includes all actions necessary for retaining an asset as near as practicable to an appropriate service condition including regular ongoing day-to-day work necessary to keep assets operating, but excluding rehabilitation or renewal. Maintenance may be classified into reactive, planned and specific maintenance work activities.
Reactive maintenance is unplanned repair work carried out in response to service requests and management/supervisory directions.
Planned maintenance is repair work that is identified and managed through a maintenance management system ‘Infor Pubic Sector’ (IPS). Activities include inspection, assessing the condition against failure/breakdown experience, priority of works, scheduling, actioning the work and reporting what was done to develop a maintenance history and improve maintenance and service delivery performance.
Actual past maintenance expenditure is shown in Table 5.2.1.
Table 5.2.1: Maintenance Expenditure Trends
From 2016 to 2019 planned maintenance work has been 81% of total maintenance expenditure.
Maintenance expenditure levels are considered to be adequate to meet projected service levels. Where maintenance expenditure levels are such that will result in a lesser level of service, the service consequences and service risks have been identified and service consequences highlighted in this AM Plan and service risks considered in the Infrastructure Risk Management Plan.
Assessment and priority of reactive maintenance is undertaken by staff using experience and judgement.

Asset Management Plan 2020 - Pump Stations 29
5.2.2 Operations and Maintenance StrategiesThe City of Port Adelaide Enfield will operate and maintain assets to provide service to approved budgets in the most cost-efficient manner. The operation and maintenance activities include:
• Scheduling operations activities to deliver the service in the most efficient manner,
• Undertaking maintenance activities through a planned maintenance system to reduce maintenance costs and improve maintenance outcomes. Undertake cost-benefit analysis to determine the most cost-effective split between planned and unplanned maintenance activities (50 – 70% planned desirable as measured by cost),
• Maintain a current infrastructure risk register for assets and present service risks associated with providing services from infrastructure assets and reporting Very High and High risks and residual risks after treatment to management,
• Review current and required skills base and implement workforce training and development to meet required operations and maintenance needs,
• Review asset use to identify under used assets and appropriate remedies, and over used assets and customer demand management options,
• Maintain a current hierarchy of critical assets and required operations and maintenance activities,
• Develop and regularly review appropriate emergency response capability,
• Review management of operations and maintenance activities to ensure best value for the resources used.
Asset hierarchyAn asset hierarchy provides a framework for structuring data in an information system to assist in collection of data, reporting information and making decisions. The hierarchy includes the asset class and component used for asset planning and financial reporting and service level hierarchy used for service planning and delivery. The service hierarchy is shown is Table 5.2.2.1.
Table 5.2.2: Asset Service Hierarchy

30 Asset Management Plan 2020 - Pump Stations

Asset Management Plan 2020 - Pump Stations 31
Critical AssetsCritical assets are those assets which have a high consequence of failure but not necessarily a high likelihood of failure. By identifying critical assets and critical failure modes, investigative activities, maintenance plans and capital expenditure plans can be targeted at the appropriate time.
Operations and maintenances activities may be targeted to mitigate critical assets failure and maintain service levels. These activities may include increased inspection frequency, higher maintenance intervention levels, etc. Critical assets failure modes and required operations and maintenance activities are detailed in Table 5.2.2.2.
StandardsandspecificationsMaintenance work is carried out in accordance with the following Standards and Specifications.
• Pump Stations Weekly Inspection Checklist in IPS
• Newhaven Village weekly maintenance and report
5.2.3 SummaryoffutureoperationsandmaintenanceexpendituresFuture operations and maintenance expenditure is forecast to trend in line with the value of the asset stock as shown in Figure 4. Note that all costs are shown in current 2019/ 2020 dollar values (i.e. real values).
The Operations and Maintenance expenditure will be required to increase as additional pumping capacity in the form of new pump stations and expansions to existing pump stations are added to the network.
Deferred maintenance, i.e. works that are identified for maintenance and unable to be funded are to be included in the risk assessment and analysis in the infrastructure risk management plan.
Maintenance is funded from the operating budget. This is further discussed in Section 7.
Figure 5.2.3: Projected Operations and Maintenance Expenditure

32 Asset Management Plan 2020 - Pump Stations
5.3 Renewal/Replacement PlanRenewal and replacement expenditure is major work which does not increase the asset’s design capacity but restores, rehabilitates, replaces or renews an existing asset to its original service potential. Work over and above restoring an asset to original service potential is upgrade/expansion or new works expenditure resulting in additional future operations and maintenance costs.
5.3.1 Renewal planAssets requiring renewal/replacement are identified from one of three methods provided in the ‘Expenditure Template’.
• Method 1 uses Asset Register data to project the renewal costs using acquisition year and useful life to determine the renewal year, or
• Method 2 uses capital renewal expenditure projections from external condition modelling systems (such as Pavement Management Systems), or
• Method 3 uses a combination of average network renewals plus defect repairs in the Renewal Plan and Defect Repair Plan worksheets on the ‘Expenditure template’.
Method 2 was used for this asset management plan.
The useful lives of assets used to develop projected asset renewal expenditures are shown in Table 5.3.1. Asset useful lives were last reviewed in 2020.
Table 5.3.1: Useful Lives of Assets
The useful lives for steel assets at Mersey Rd pump station tends to be reduced due to the effects of corrosive gasses unique to that site.
5.3.2 Renewal and Replacement StrategiesWe will plan capital renewal and replacement projects to meet level of service objectives and minimize infrastructure service risks by:
• Planning and scheduling renewal projects to deliver the defined level of service in the most efficient manner,
• Undertaking project scoping for all capital renewal and replacement projects to identify:
• the service delivery ‘deficiency’, present risk and optimum time for renewal/replacement,
• the project objectives to rectify the deficiency,
• the range of options, estimated capital and life cycle costs for each options that could address the service deficiency,
• and evaluate the options against adopted evaluation criteria, and
• select the best option to be included in capital renewal programs,

Asset Management Plan 2020 - Pump Stations 33
• Using ‘low cost’ renewal methods (cost of renewal is less than replacement) wherever possible,
• Maintain a current infrastructure risk register for assets and service risks associated with providing services from infrastructure assets and reporting Very High and High risks and residual risks after treatment to management,
• Review current and required skills base and implement workforce training and development to meet required construction and renewal needs,
• Maintain a current hierarchy of critical assets and capital renewal treatments and timings required ,
• Review management of capital renewal and replacement activities to ensure the best value for resources used is obtained.
Renewal ranking criteriaAsset renewal and replacement is typically undertaken to either:
• Ensure the reliability of the existing infrastructure to deliver the service it was constructed to facilitate (e.g. replacing a bridge that has a 5 t load limit), or
• To ensure the infrastructure is of sufficient quality to meet the service requirements (e.g. roughness of a road)8.
It is possible to get some indication of capital renewal and replacement priorities by identifying assets or asset groups that:
• Have a high consequence of failure,
• Have high use and subsequent impact on users would be greatest,
• Have a total value represents the greatest net value,
• Have the highest average age relative to their expected lives,
• Are identified in the AM Plan as key cost factors,
• Have high operational or maintenance costs, and
• Have replacement with a modern equivalent asset that would provide the equivalent service at a savingst9.
Renewal and replacement standardsRenewal work is carried out in accordance with the following Standards and Specifications.
• CoPAE–Stormwaterpumpstationtelemetryancontrolsspecification• AS4418.1-1996SupervisoryControlandDataAcquisition• CoPAE-StormwaterPumpReplacementSpecification
5.3.3 SummaryoffuturerenewalandreplacementexpenditureProjected future renewal and replacement expenditures are forecast to increase over time when the asset stock increases. The expenditure is required is shown in Fig 5. Note that all amounts are shown in real values.
The projected capital renewal and replacement program is shown in Appendix B.
Figure 5.3.3 Assets are being renewed at an equivalent rate to depletion overall, though not necessarily year on year.
8IPWEA, 2015, IIMM, Sec 3.4.4, p 3|91.
9Based on IPWEA, 2015, IIMM, Sec 3.4.5, p 3|97.

34 Asset Management Plan 2020 - Pump Stations
Figure 5.3.3 Assets are being renewed at an equivalent rate to depletion overall, though not necessarily year on year.
There is increased renewal expenditure due to switchboard and generator replacements scheduled for Hack North Pump Station in 2020/20 and Carlisle Pump Stfation in 2026/27.
Deferred renewal and replacement, i.e. those assets identified for renewal and/or replacement and not scheduled in capital works programs are to be included in the risk analysis process in the risk management plan.
The level of our planned investment is based upon inspection and review of component age. This controls risk better than age based accounting.
Renewals and replacement expenditure in the capital works program will be accommodated in the long term financial plan. This is further discussed in Section 7.
5.4 Creation/Acquisition/Upgrade PlanNew works create a new asset that did not previously exist, or works which upgrade or improve an existing asset beyond its existing capacity. They may result from growth, social or environmental needs. Assets may also be acquired at no cost. These additional assets are considered in Section 4.4.
5.4.1 Selection criteriaNew assets and upgrade/expansion of existing assets are identified from storm water management plans, which computer model existing capability against expected rainfall to identify shortfalls. Where applicable to the problem and no other gravity based solutions are appropriate, Candidate proposals are inspected to verify need and to develop a preliminary renewal estimate. Verified proposals are ranked by priority and available funds and scheduled in future works programmes.
5.4.3 Summaryoffutureupgrade/newassetsexpenditureMajor projects planned over the next 10 years which will result in new assets, and significant capital upgrades include:
• 2020/21 –
• Increase pumping capability at Hack North Pump Station, and
• Dispose of the Newhaven Village Recycled Water Scheme
• 2023/24 – Upgrade Midlunga Pump Station and Rising Main (pending council decision)
• 2024/25 & 2025/26 – Build new Pump Station at Jetty Rd Largs Bay (pending council decision)
• 2028/2029 & 2029/2030 – Capacity upgrade to Wellington St Pump Station Port Adelaide (pending council decision)

Asset Management Plan 2020 - Pump Stations 35
Expenditure on new assets and services in the capital works program will be accommodated in the long term financial plan. This is further discussed in Section 7.2.
5.5 Disposal PlanDisposal includes any activity associated with disposal of a decommissioned asset including sale, demolition or relocation. Assets identified for possible decommissioning and disposal are shown in Table 5.5, together with estimated annual savings from not having to fund operations and maintenance of the assets. These assets will be further reinvestigated to determine the required levels of service and see what options are available for alternate service delivery, if any. Any costs or revenue gained from asset disposals is accommodated in the long term financial plan.
Where cash flow projections from asset disposals are not available, these will be developed in future revisions of this asset management plan.
The Newhaven Village Wastewater Recycling scheme was gifted to the City of Port Adelaide in 1994 by The SA Housing Trust. Although the overall design is typically considered to be sound a poor economy of scale led to a treatment facility which was high maintenance, unreliable and has proven unable to reliably meet ‘Class A’ recycled water quality standards. For this reason since 2003 the recycled water has been disconnected from the reticulated scheme, and council is now forced to supply the residents with SA Waters product via the reticulated mains. The water can only be used for the underground irrigation of the adjacent reserve.
There are 65 properties feeding the Wastewater Treatment Plant which pay us a sewer fee totalling around $35,000 p.a. The plant also saves around $10k in potable water which would be used to water the adjacent park. The plant costs $85,000 p.a to operate and maintain, not accounting for depreciation.
This is the only water or sewer system for which the City of Port Adelaide Enfield is responsible. Because of this city is not practical to have staff to deal with emergency responses to wastewater overflows or water main burst emergencies particularly after hours.
It is planned to dispose of this scheme by passing this facility on to a specialist operator of wastewater schemes under an owner operator arrangement. As part of such a handover several asset renewals and upgrades will be required.

6RISK MANAGEMENT
36 Asset Management Plan 2020 - Pump Stations

Asset Management Plan 2020 - Pump Stations 37
The purpose of infrastructure risk management is to document the results and recommendations resulting from the periodic identification, assessment and treatment of risks associated with providing services from infrastructure, using the fundamentals of International Standard ISO 31000:2009 Risk management – Principles and guidelines.
Risk Management is defined in ISO 31000:2009 as: “coordinated activities to direct and control with regard to risk”10 .
An assessment of risks11 associated with service delivery from infrastructure assets has identified critical risks that will result in loss or reduction in service from infrastructure assets or a ‘financial shock’. The risk assessment process identifies credible risks, the likelihood of the risk event occurring, the consequences should the event occur, develops a risk rating, evaluates the risk and develops a risk treatment plan for non-acceptable risks.
6.1 Critical AssetsCritical assets are defined as those which have a high consequence of failure causing complete disablement of a stormwater pump station. Similarly, critical failure modes are those which have the highest consequences.
Critical assets have been identified, their typical failure mode and the impact on service delivery are as follows:
Table 6.1 Critical Assets
By identifying critical assets and failure modes investigative activities, condition inspection programs, maintenance and capital expenditure plans can be targeted at the critical areas.
6.2 Risk AssessmentThe risk management process used in this project is shown in Figure 6.2 below.
It is an analysis and problem solving technique designed to provide a logical process for the selection of treatment plans and management actions to protect the community against unacceptable risks.
The process is based on the fundamentals of ISO risk assessment standard ISO 31000:2009.
10ISO 31000:2009, p 2
Fig 6.2 Risk Management Process – Abridged

38 Asset Management Plan 2020 - Pump Stations
The risk assessment process identifies credible risks, the likelihood of the risk event occurring, the consequences should the event occur, develops a risk rating, evaluates the risk and develops a risk treatment plan for non-acceptable risks.
An assessment of risks associated with service delivery from infrastructure assets has identified the critical risks that will result in significant loss, ‘financial shock’ or a reduction in service.
Critical risks are those assessed with ‘Very High’ (requiring immediate corrective action) and ‘High’ (requiring corrective action) rating identified in the Infrastructure Risk Management Plan. The residual risk and treatment cost after the selected treatment plan is operational is shown in Table 6.2. These risks and costs are reported to management and council.
Table 6.2: Critical Risks and Treatment Plans
Note * The residual risk is the risk remaining after the selected risk treatment plan is operational.
The risk assessment process compares the likelihood of a risk event occurring against the consequences of the event
occurring. In the risk rating table below, a risk event with a likelihood of ‘Possible’ and a consequence of ‘Major’ has a
risk rating of ‘High’ as shown in Table 6.3

Asset Management Plan 2020 - Pump Stations 39
Table 6.3: Risk Rating Matrix

40 Asset Management Plan 2020 - Pump Stations
7FINANCIAL SUMMARY

Asset Management Plan 2020 - Pump Stations 41
This section contains the financial requirements resulting from all the information presented in the previous sections of this asset management plan. The financial projections will be improved as further information becomes available on desired levels of service and current and projected future asset performance.
7.1 Financial Statements and ProjectionsThe financial projections are shown in Fig 7.1 for projected operating (operations and maintenance) and capital expenditure (renewal and upgrade/expansion/new assets). Note that all costs are shown in real values.
Fig 7.1: Projected Operating and Capital Expenditure
Operations and maintenance expenditures is reasonably consistent, however the major projects mentioned in section 5.4.3 lead to large variations in upgrade expenditure.
7.1.1 SustainabilityofservicedeliveryCouncil uses asset renewal funding ratio as its main indicator for sustainability that have been considered in the analysis of the services provided by this asset category, these being the asset renewal funding ratio, long term life cycle costs/expenditures and medium term projected/budgeted expenditures over 5 and 10 years of the planning period.

42 Asset Management Plan 2020 - Pump Stations
Asset Renewal Funding Ratio
Asset Renewal Funding Ratio14 109%
The Asset Renewal Funding Ratio is the most important indicator and reveals that over the next 10 years of the forecasting that we will have 109% of the funds required for the optimal renewal and replacement of assets. This is occurring as we are increasing pumping capacity and pump stations as well as maintaining those which are existing.
This Council uses the Asset Renewal Funding Ratio as it’s indicator for Asset Management performance. The Asset Renewal Funding Ratio is defined as:
Asset renewatl funding ratioThe ratio of the net present value of asset renewal funding accommodated over a 10 year period in a Long Term Financial Plan (LTFP) relative to the net present value of projected capital renewal expenditures identified in an asset management plan for the same period [AIFMG Financial Sustainability Indicator No 8].
Over the next 10 years the life cycle expenditure is fully funded. The reason for this discrepancy is that unlike other assets the pump stations began to be built from 1972 and the concrete and steel structures have a 60 year life, so no major pump stations are due to be completely rebuilt in the next 10 years, however the depreciation is being reported during this period.
Figure 7.1.1 Graph showing years at which assets are predicted to be due for renewal showing increase in average from 2030 onwards as pump stations come due for full replacement
Based upon expected lives, large scale replacement of pump stations will begin to be necessary from 2032. Hence there are no replacements covered by this 10 year plan, even though the depreciation which leads to this is counted now.
14AIFMM, 2015, Version 1.0, Financial Sustainability Indicator 3, Sec 2.6, p 9.

Asset Management Plan 2020 - Pump Stations 43
7.1.2 ProjectedexpendituresforlongtermfinancialplanTable 7.1.2 shows the projected expenditures for the 10 year long term financial plan.
Expenditure projections are in 2020 real values. Only projects endorsed by council have been included in these projections.
Table 7.1.2: Projected Expenditures for Long Term Financial Plan ($000)
7.2 FundingStrategyAfter reviewing service levels, as appropriate to ensure ongoing financial sustainability projected expenditures identified in Section 7.1.2 will be accommodated in the 10 year long term financial plan.
7.3 ForecastReliabilityandConfidenceThe expenditure and valuations projections in this AM Plan are based on best available data. Currency and accuracy of data is critical to effective asset and financial management. Data confidence is classified on a 5 level scale15 in accordance with Table 7.5.1.
15 IPWEA, 2015, IIMM, Table 2.4.6, p 2|71.
Table 7.5.1: Data Confidence Grading System

44 Asset Management Plan 2020 - Pump Stations
Table 7.5.2: Data Confidence Assessment for Data used in AM Plan
The estimated confidence level for and reliability of data used in this AM Plan is shown in Table 7.5.2.
Over all data sources the data confidence is assessed as medium confidence level for data used in the preparation of this AM Plan.

Asset Management Plan 2020 - Pump Stations 45

8PLAN IMPROVEMENT AND MONITORING
46 Asset Management Plan 2020 - Pump Stations

Asset Management Plan 2020 - Pump Stations 47
8.1 Status of Asset Management Practices
8.1.1 AccountingandfinancialdatasourcesAssets are recorded at fair value in Council’s financial management system (Technology 1 - Finance One) in the following classifications:
• Land
• Buildings
• Infrastructure
• Plant & Equipment
• Furniture & Fittings
• Waste Bins
• Software
8.1.2 Asset management data sources
AssetManagementSystem
Infor IPS (Hansen).
Asset Registers
• Buildings
• Roads (Seal, Base, Kerb, Footpath)
• Parks and Gardens
• Stormwater
• Public Art
• Fleet
LinkagefromAssetManagementtoFinancialSystem
The Asset System Infor Public Sector (IPS) is integrated with the finance system (Technology One - Finance One), the payroll system (Technology One - People One), the GIS and the Council’s electronic document Management System (Technology One - ECM). The linkages are shown graphically below.

48 Asset Management Plan 2020 - Pump Stations
Integration
AccountabilitiesforAssetManagementSystemandDataMaintenance• Team Leader Asset Planning
• Asset Planning
• Asset Support Officer
• Asset Accountant
• Asset Planning Engineer
• Manager Infrastructure and Asset Maintenance
RequiredChangestoAssetManagementSystemarisingfromthisAssetManagement PlanAdditional component data will be collected, including overall condition ratings for components within all building classes. This data will be uploaded into IPS (Asset Management System).
8.2 Improvement PlanThe asset management improvement plan generated from this asset management plan is shown in Table 8.2.
Table 8.2: Improvement Plan
8.3 Monitoring and Review ProceduresThis asset management plan will be reviewed during annual budget planning processes and amended to show any material changes in service levels and/or resources available to provide those services as a result of budget decisions.
The AM Plan will be updated annually to ensure it represents the current service level, asset values, projected operations, maintenance, capital renewal and replacement, capital upgrade/new and asset disposal expenditures and projected expenditure values incorporated into the long term financial plan.
The AM Plan has a life of 4 years (Council/Board election cycle) and is due for complete revision and updating every 2 years of each Council/Board election

8.4 Performance MeasuresThe effectiveness of the asset management plan can be measured in the following ways:
• The degree to which the required projected expenditures identified in this asset management plan are incorporated into the long term financial plan,
• The degree to which 1-5 year detailed works programs, budgets, business plans and corporate structures take into account the ‘global’ works program trends provided by the asset management plan,
• The degree to which the existing and projected service levels and service consequences (what we cannot do), risks and residual risks are incorporated into the Strategic Plan and associated plans,
• The Asset Renewal Funding Ratio achieving the target of 1.0.
Asset Management Plan 2020 - Pump Stations 49

50 Asset Management Plan 2020 - Pump Stations
9REFERENCES
50 Asset Management Plan 2020 - Pump Stations

• IPWEA, 2006, ‘International Infrastructure Management Manual’, Institute of Public Works Engineering Australasia, Sydney, www.ipwea.org/IIMM
• IPWEA, 2008, ‘NAMS.PLUS Asset Management’, Institute of Public Works Engineering Australasia, Sydney, www.ipwea.org/namsplus.
• IPWEA, 2015, 2nd edn., ‘Australian Infrastructure Financial Management Manual’, Institute of Public Works Engineering Australasia, Sydney, www.ipwea.org/AIFMM.
• IPWEA, 2015, 3rd edn., ‘International Infrastructure Management Manual’, Institute of Public Works Engineering Australasia, Sydney, www.ipwea.org/IIMM
• City of Port Adelaide Enfield, Annual Business Plan and Budget 2018-2019
• City of Port Adelaide Enfield 2016, Lefevre Peninsula Stormwater Management Plan, http://www.sma.sa.gov.au/wp-content/uploads/LefevrePeninsulaSMP2018_WEB.pdf
• City of Port Adelaide Enfield Port River East 2019, Stormwater Management Plan, ECM No 12104047
Asset Management Plan 2020 - Pump Stations 51

52 Asset Management Plan 2020 - Pump Stations
10APPENDICES

Appendix A Projected 10 year Capital Renewal and Replacement Works Program
Appendix B Projected 10 year Capital Upgrade/New Works Program
Appendix C LTFP Budgeted Expenditures Accommodated in AM Plan
Asset Management Plan 2020 - Pump Stations 53

54 Asset Management Plan 2020 - Pump Stations
AppendixAProjected10-yearCapitalRenewalandReplacementWorksProgram Projected Capital Renewal Works Program - Stormwater Pumps

Asset Management Plan 2020 - Pump Stations 55

56 Asset Management Plan 2020 - Pump Stations
AppendixBProjectedUpgrade/Exp/New10-yearCapitalWorksProgramProjected Capital Upgrade/New Works Program - Stormwater Pumps

Asset Management Plan 2020 - Pump Stations 57

58 Asset Management Plan 2020 - Pump Stations
Appendix C Budgeted Expenditures Accommodated in LTFPProjected Capital Upgrade/New Works Program - Stormwater Pumps

Asset Management Plan 2020 - Pump Stations 59

60 Asset Management Plan 2020 - Pump Stations
2021-2022 ADDENDUMASSET MANAGEMENT PLAN
PUMP STATIONS

Asset Management Plan 2020 - Pump Stations 61
Ten Year ProgramYe
ar 1
2021
/22
Year
220
22/2
3Ye
ar 3
2023
/24
Year
420
24/2
5Ye
ar 5
2025
/26
Year
620
26/2
7Ye
ar 7
2027
/28
Year
820
28/2
9Ye
ar 9
2029
/30
Year
10
2030
/31
Stor
mw
ater
AM
PU
pgra
de/N
ew$1
0,55
0,00
0$7
,300
,000
$6,2
00,0
00$5
,470
,000
$6,1
45,0
00$7
,120
,000
$7,1
25,0
00$8
,605
,000
$8,8
05,0
00R
epla
cem
ent
$980
,000
$2,1
50,0
00$2
,950
,000
$3,5
50,0
00$3
,850
,000
$2,4
95,0
00$1
,990
,000
$550
,000
$730
,000
Tota
l$1
1,53
0,00
0$9
,450
,000
$9,1
50,0
00$9
,020
,000
$9,9
95,0
00$9
,615
,000
$9,1
15,0
00$9
,155
,000
$9,5
35,0
00Pu
mp
Stat
ion
AM
PU
pgra
de/N
ew
Rep
lace
men
t$2
90,0
00$2
30,0
00$1
55,0
00$1
70,0
00$1
75,0
00$5
00,0
00$1
55,0
00$1
60,0
00$8
2,00
0To
tal
$290
,000
$230
,000
$155
,000
$170
,000
$175
,000
$500
,000
$155
,000
$160
,000
$82,
000
Tota
l Com
bine
d A
MP
Upg
rade
/New
$10,
550,
000
$7,3
00,0
00$6
,200
,000
$5,4
70,0
00$6
,145
,000
$7,1
20,0
00$7
,125
,000
$8,6
05,0
00$8
,805
,000
Rep
lace
men
t$1
,270
,000
$2,3
80,0
00$3
,105
,000
$3,7
20,0
00$4
,025
,000
$2,9
95,0
00$2
,145
,000
$710
,000
$812
,000
Tota
l$1
1,82
0,00
0$9
,680
,000
$9,3
05,0
00$9
,190
,000
$10,
170,
000
$10,
115,
000
$9,2
70,0
00$9
,315
,000
$9,6
17,0
00R
evis
ed B
udge
t
Stor
mw
ater
Upg
rade
/New
$12,
480,
000
$6,0
00,0
00$6
,210
,000
$5,7
70,0
00$6
,145
,000
$7,1
20,0
00$7
,125
,000
$8,6
05,0
00$8
,805
,000
$9,0
00,0
00R
epla
cem
ent
$3,0
91,8
00$3
,550
,000
$4,2
00,0
00$3
,550
,000
$3,8
50,0
00$2
,495
,000
$1,9
90,0
00$5
50,0
00$7
30,0
00To
tal
$15,
571,
800
$9,5
50,0
00$1
0,41
0,00
0$9
,320
,000
$9,9
95,0
00$9
,615
,000
$9,1
15,0
00$9
,155
,000
$9,5
35,0
00$9
,000
,000
Pum
p St
atio
ns
Upg
rade
/New
$1,5
00,0
00$7
,117
,000
$7,1
15,0
00$5
,460
,000
$5,4
60,0
00R
epla
cem
ent
$710
,000
$240
,000
$155
,000
$275
,000
$215
,000
$179
,000
$200
,000
$200
,000
$200
,000
$200
,000
Tota
l$2
,210
,000
$240
,000
$155
,000
$7,3
92,0
00$7
,330
,000
$179
,000
$200
,000
$5,6
60,0
00$5
,660
,000
$200
,000
Rev
ised
Bud
get
Upg
rade
/New
$13,
980,
000
$6,0
00,0
00$6
,210
,000
$12,
887,
000
$13,
260,
000
$7,1
20,0
00$7
,125
,000
$14,
065,
000
$14,
265,
000
$9,0
00,0
00R
epla
cem
ent
$3,8
01,8
00$3
,790
,000
$4,3
55,0
00$3
,825
,000
$4,0
65,0
00$2
,674
,000
$2,1
90,0
00$7
50,0
00$9
30,0
00$2
00,0
00To
tal
$17,
781,
800
$9,7
90,0
00$1
0,56
5,00
0$1
6,71
2,00
0$1
7,32
5,00
0$9
,794
,000
$9,3
15,0
00$1
4,81
5,00
0$1
5,19
5,00
0$9
,200
,000
Vari
atio
n$5
,961
,800
$110
,000
$1,2
60,0
00$7
,522
,000
$7,1
55,0
00-$
321,
000
$45,
000
$5,5
00,0
00$5
,578
,000
$9,2
00,0
00
50%
1%14
%82
%70
%-3
%0%
59%
58%
Rev
ised
Bud
get
with
CPI
adj
ustm
ent
Stor
mw
ater
Upg
rade
/New
$12,
480,
000
$6,0
90,0
00$6
,413
,688
$6,0
63,1
16$6
,570
,234
$7,7
45,8
48$7
,623
,750
$9,6
91,8
12$1
0,09
1,41
1$1
0,49
4,90
0R
epla
cem
ent
$3,0
91,8
00$3
,603
,250
$4,3
37,7
60$3
,730
,340
$4,1
16,4
20$2
,714
,311
$2,1
29,3
00$6
19,4
65$8
36,6
53$0
Tota
l$1
5,57
1,80
0$9
,693
,250
$10,
751,
448
$9,7
93,4
56$1
0,68
6,65
4$1
0,46
0,15
9$9
,753
,050
$10,
311,
277
$10,
928,
064
$10,
494,
900
Pum
p St
atio
ns
Upg
rade
/New
$1,5
00,0
00$0
$0$7
,478
,544
$7,6
07,3
58$0
$0$6
,149
,598
$6,2
57,7
06$0
Rep
lace
men
t$7
10,0
00$2
43,6
00$1
60,0
84$2
88,9
70$2
29,8
78$1
94,7
34$2
14,0
00$2
25,2
60$2
29,2
20$2
33,2
20To
tal
$2,2
10,0
00$2
43,6
00$1
60,0
84$7
,767
,514
$7,8
37,2
36$1
94,7
34$2
14,0
00$6
,374
,858
$6,4
86,9
26$2
33,2
20R
evis
ed B
udge
tU
pgra
de/N
ew$1
3,98
0,00
0$6
,090
,000
$6,4
13,6
88$1
3,54
1,66
0$1
4,17
7,59
2$7
,745
,848
$7,6
23,7
50$1
5,84
1,41
0$1
6,34
9,11
7$1
0,49
4,90
0R
epla
cem
ent
$3,8
01,8
00$3
,846
,850
$4,4
97,8
44$4
,019
,310
$4,3
46,2
98$2
,909
,045
$2,3
43,3
00$8
44,7
25$1
,065
,873
$233
,220
Tota
l $1
7,78
1,80
0$9
,936
,850
$10,
911,
532
$17,
560,
970
$18,
523,
890
$10,
654,
893
$9,9
67,0
50$1
6,68
6,13
5$1
7,41
4,99
0$1
0,72
8,12
0
CPI
Inde
x %
1.50
%1.
75%
1.75
%1.
75%
1.75
%1.
75%
1.75
%1.
75%
1.75
%C
PI In
dex
fact
or1.
015
1.03
281.
0508
1.06
921.
0879
1.07
1.12
631.
1461
1.16
61

62 Asset Management Plan 2020 - Pump Stations
2021/2022 NEW REPLACED TOTAL
Various Pump Station Inspect Rising Mains $30,000 $30,000
PRE Wellington St Pump Station - Refurbish Pump 3 $55,000 $55,000
Lefevre Hart St Pump Station - Upgrade $600,000 $600,000
Lefevre Carlisle and Mersey Pump Station - Conductivity and Level Sensors $15,000 $15,000
Lefevre Carlisle Pump Station - Replace Submersible Pump $10,000 $10,000
Lefevre Midlunga Pump Station and Rising Main Construction $1,500,000 $1,500,000
Sub Total Cost of Proposed Construction $1,500,000 $710,000 $2,210,000
2022/2023 NEW REPLACED TOTAL
Hargrave St - Pump station alterations $10,000 $10,000
Hart St - Reliability Upgrade $25,000 $25,000
Hart St - Programming Upgrades $20,000 $20,000
Mersey Rd - Replace Pumps & Valves #4 & #5 $155,000 $155,000
Various - Rising main inspections $30,000 $30,000
Sub Total Cost of Proposed Construction $0 $240,000 $240,000
2023/2024 NEW REPLACED TOTAL
Lulu St - Replace pump and valves #2 & #6 155,000 155,000
Sub Total Cost of Proposed Construction 0 155,000 155,000
2024/2025 NEW REPLACED TOTAL
Lefevre - Lulu/Jetty Rd pump station $7,117,000 $7,117,000
Overhaul 2 Pumps $40,000 $40,000
PRE - Wellington – Paving renewal $80,000 $80,000
PRE - Wellington Lighting $20,000 $20,000
Lefevre - Carlisle Replace Generator $135,000 $135,000
TOTAL $7,117,000 $275,000 $7,392,000
2025/2026 NEW REPLACED TOTAL
Lulu/Jetty Rd pump station $7,115,000 $7,115,000
Overhaul 2 Pumps $40,000 $40,000
Newhaven WWPS Pits polyuria coating $50,000 $50,000
Replace Switchboard Carlisle Pump Station $100,000 $100,000
Replace Level sensors & Flammable Gas detection units Hargrave $15,000 $15,000
Replace level sensors Hart $10,000 $10,000
Total $7,115,000 $215,000 $7,330,000

Asset Management Plan 2020 - Pump Stations 63
2026/2027 NEW REPLACED TOTAL
Overhaul 2 Pumps $40,000 $40,000
Replace trash screens Carlisle $10,000 $10,000
Replace crane Pendant Lulu, Hack Wellington $25,000 $25,000
Replace switchboard Wellington Pump Station $100,000 $100,000
Replace pumps Newhaven WWPS* $4,000 $4,000
Total $0 $179,000 $179,000
2027/2028 NEW REPLACED TOTAL
Various Pump Station upgrades $200,000 $200,000
Total $0 $200,000 $200,000
2028/2029 NEW REPLACED TOTAL
Various Pump Station upgrades $200,000 $200,000
Wellington St Pump Station Upgrade $5,460,000 $5,460,000
Total $5,460,000 $200,000 $5,660,000
2029/2030 NEW REPLACED TOTAL
Various Pump Station upgrades $200,000 $200,000
Wellington St Pump Station Upgrade $5,460,000 $5,460,000
Total $5,460,000 $200,000 $5,660,000
2030/2031 NEW REPLACED TOTAL
Pump Station Major Replacements $200,000 $200,000
Total $0 $200,000 $200,000

60 Asset Management Plan 2020 - Pump Stations