Tom Peters’ Re-Imagine! Business Excellence in a Disruptive Age Metavante/Milwaukee/11May2005
April 2013
1 of 8 © 2013 First Annapolis Consulting, Inc.April 2013 Navigator
Published by First Annapolis Consulting, Inc.
Navigator
Recently, social media giant Facebook launched the Facebook Card – its branded, reusable gift card that is able to store value for multiple retailers. The four launch partners were Target, Sephora, Olive Garden, and Jamba Juice. Subsequently, Staples, Outback Steak House, Burger King and Walgreens... More
Point of sale software development is a large and notoriously fragmented market characterized by a large number of very small developers. First Annapolis has identified over 4,000 discrete developers in the U.S. market, and we are sure we are undercounting. (To be clear, these developers do not always... More
Top European Airlines Face Some Headwinds, But Mostly Opportunities, in Co-Branding
First Annapolis Survey Provides Insight into Community Bank Processor Relationships
Payments Industry Stock Price Tracker
In Europe, as well as globally, airline co-brand cards are one of the most successful credit card products. In order to understand the challenges and opportunities for European issuers and their airline partners, First Annapolis Consulting examined the co-brand offerings of the top 25 European carriers, ranked by... More
Analysis of the outsourced processing market has generally focused on the processing vendors of the largest financial institutions given their share of total card volume. This segment of the market is primarily served by the largest providers, including First Data, TSYS and Visa DPS. Processing... More
Figure 1 is the Payments Industry Stock Price Tracker for the month of April. The chart measures current stock prices and market caps (as of April 30, 2013) and tracks movement over the last month, and year-to-date. The companies we monitor across the payments value chain experienced mixed... More
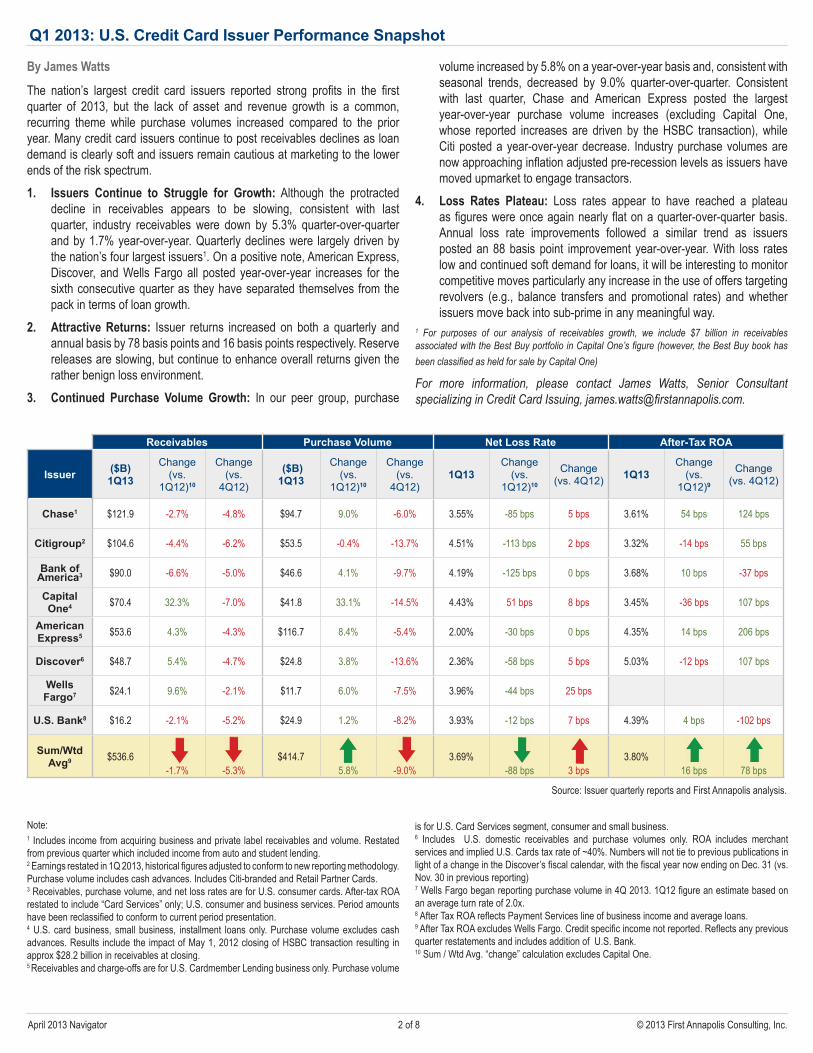
Q1 2013: U.S. Credit Card Issuer Performance SnapshotThe nation’s largest credit card issuers reported strong profits in the first quarter of 2013, but the lack of asset and revenue growth is a common, recurring theme while purchase volumes increased compared to the prior year. Many credit card issuers continue to post receivables declines as loan demand is clearly soft and issuers remain cautious at marketing to the lower ends of the risk spectrum.1. IssuersContinuetoStruggleforGrowth: Although the protracted decline in receivables appears
to be slowing, consistent with last quarter, industry receivables were down by 5.3% quarter-over-quarter and by 1.7% year-over-year. Quarterly declines were... More
European Issuing M&A Update
A Quick Look at POS Software Developers and Acquirers in the U.S.
The last half-decade has been a challenging time to be a European card issuer. The global financial crisis, the Euro crisis, economic uncertainty, and regulatory intervention (especially concerning interchange) have reduced issuers’ profitability and placed capital constraints on banks... More
®First AnnapolisConsulting M&A Advisory Services
The undersigned served asfinancial advisor to Best Buy Co., Inc.
announced the intent to sell its
$7 billion card portfolio to and form a
partnership with
February 2013
Facebook Continues Investment in Gifting Strategy
Fleet Card M&A – A Supercharged MarketReflecting back on 2012, fleet card M&A activity in the U.S. market reached a crescendo with no less than three significant fleet card program acquisitions – all of which involved activity in the OTR (over-the-road, long haul) segment. Along with a noteworthy number of fleet card business acquisitions... More
2 of 8 © 2013 First Annapolis Consulting, Inc.April 2013 Navigator
Q1 2013: U.S. Credit Card Issuer Performance Snapshot
ByJamesWatts
The nation’s largest credit card issuers reported strong profi ts in the fi rst quarter of 2013, but the lack of asset and revenue growth is a common, recurring theme while purchase volumes increased compared to the prior year. Many credit card issuers continue to post receivables declines as loan demand is clearly soft and issuers remain cautious at marketing to the lower ends of the risk spectrum.1. Issuers Continue to Struggle for Growth: Although the protracted
decline in receivables appears to be slowing, consistent with last quarter, industry receivables were down by 5.3% quarter-over-quarter and by 1.7% year-over-year. Quarterly declines were largely driven by the nation’s four largest issuers1. On a positive note, American Express, Discover, and Wells Fargo all posted year-over-year increases for the sixth consecutive quarter as they have separated themselves from the pack in terms of loan growth.
2. AttractiveReturns: Issuer returns increased on both a quarterly and annual basis by 78 basis points and 16 basis points respectively. Reserve releases are slowing, but continue to enhance overall returns given the rather benign loss environment.
3. Continued Purchase Volume Growth: In our peer group, purchase
volume increased by 5.8% on a year-over-year basis and, consistent with seasonal trends, decreased by 9.0% quarter-over-quarter. Consistent with last quarter, Chase and American Express posted the largest year-over-year purchase volume increases (excluding Capital One, whose reported increases are driven by the HSBC transaction), while Citi posted a year-over-year decrease. Industry purchase volumes are now approaching infl ation adjusted pre-recession levels as issuers have moved upmarket to engage transactors.
4. Loss Rates Plateau: Loss rates appear to have reached a plateau as fi gures were once again nearly fl at on a quarter-over-quarter basis. Annual loss rate improvements followed a similar trend as issuers posted an 88 basis point improvement year-over-year. With loss rates low and continued soft demand for loans, it will be interesting to monitor competitive moves particularly any increase in the use of offers targeting revolvers (e.g., balance transfers and promotional rates) and whether issuers move back into sub-prime in any meaningful way.
1 For purposes of our analysis of receivables growth, we include $7 billion in receivables associated with the Best Buy portfolio in Capital One’s fi gure (however, the Best Buy book has been classifi ed as held for sale by Capital One)
For more information, please contact James Watts, Senior Consultant specializing in Credit Card Issuing, james.watts@fi rstannapolis.com.
Note: 1 Includes income from acquiring business and private label receivables and volume. Restated from previous quarter which included income from auto and student lending.2 Earnings restated in 1Q 2013, historical fi gures adjusted to conform to new reporting methodology. Purchase volume includes cash advances. Includes Citi-branded and Retail Partner Cards.3 Receivables, purchase volume, and net loss rates are for U.S. consumer cards. After-tax ROA restated to include “Card Services” only; U.S. consumer and business services. Period amounts have been reclassifi ed to conform to current period presentation.4 U.S. card business, small business, installment loans only. Purchase volume excludes cash advances. Results include the impact of May 1, 2012 closing of HSBC transaction resulting in approx $28.2 billion in receivables at closing.5 Receivables and charge-offs are for U.S. Cardmember Lending business only. Purchase volume
is for U.S. Card Services segment, consumer and small business. 6 Includes U.S. domestic receivables and purchase volumes only. ROA includes merchant services and implied U.S. Cards tax rate of ~40%. Numbers will not tie to previous publications in light of a change in the Discover’s fi scal calendar, with the fi scal year now ending on Dec. 31 (vs. Nov. 30 in previous reporting)7 Wells Fargo began reporting purchase volume in 4Q 2013. 1Q12 fi gure an estimate based on an average turn rate of 2.0x.8 After Tax ROA refl ects Payment Services line of business income and average loans.9 After Tax ROA excludes Wells Fargo. Credit specifi c income not reported. Refl ects any previous quarter restatements and includes addition of U.S. Bank.10 Sum / Wtd Avg. “change” calculation excludes Capital One.
Source: Issuer quarterly reports and First Annapolis analysis.
Receivables Purchase Volume Net Loss Rate After-Tax ROA
Issuer ($B) 1Q13
Change(vs.
1Q12)10
Change(vs.
4Q12)
($B) 1Q13
Change(vs.
1Q12)10
Change(vs.
4Q12)1Q13
Change(vs.
1Q12)10
Change(vs. 4Q12) 1Q13
Change(vs.
1Q12)9
Change(vs. 4Q12)
Chase1 $121.9 -2.7% -4.8% $94.7 9.0% -6.0% 3.55% -85 bps 5 bps 3.61% 54 bps 124 bps
Citigroup2 $104.6 -4.4% -6.2% $53.5 -0.4% -13.7% 4.51% -113 bps 2 bps 3.32% -14 bps 55 bps
Bank of America3 $90.0 -6.6% -5.0% $46.6 4.1% -9.7% 4.19% -125 bps 0 bps 3.68% 10 bps -37 bps
Capital One4 $70.4 32.3% -7.0% $41.8 33.1% -14.5% 4.43% 51 bps 8 bps 3.45% -36 bps 107 bps
American Express5 $53.6 4.3% -4.3% $116.7 8.4% -5.4% 2.00% -30 bps 0 bps 4.35% 14 bps 206 bps
Discover6 $48.7 5.4% -4.7% $24.8 3.8% -13.6% 2.36% -58 bps 5 bps 5.03% -12 bps 107 bps
Wells Fargo7 $24.1 9.6% -2.1% $11.7 6.0% -7.5% 3.96% -44 bps 25 bps
U.S. Bank8 $16.2 -2.1% -5.2% $24.9 1.2% -8.2% 3.93% -12 bps 7 bps 4.39% 4 bps -102 bps
Sum/Wtd Avg9 $536.6
-1.7% -5.3%$414.7
5.8% -9.0%3.69%
-88 bps 3 bps 3.80%
16 bps 78 bps
3 of 8 © 2013 First Annapolis Consulting, Inc.March 2013 Navigator
First Annapolis Survey Provides Insight into Community Bank Processor Relationships
ByCaseyMerollaandDavidAbraham
Analysis of the outsourced processing market has generally focused on the processing vendors of the largest financial institutions given their share of total card volume. This segment of the market is primarily served by the largest providers, including First Data, TSYS and Visa DPS. Processing relationships at community banks1; however, are more difficult to track. While these institutions represent more than 90% of banks in the U.S., they account for approximately 20% of debit volume and only 1% credit card purchase volume2.
First Annapolis recently conducted a primary research survey of debit, credit, and core banking processor relationships among the community bank segment in 2012. The telephone survey, which included 50 community banks with assets between $250 million and $3 billion, examined debit, credit, and core banking processing relationships.
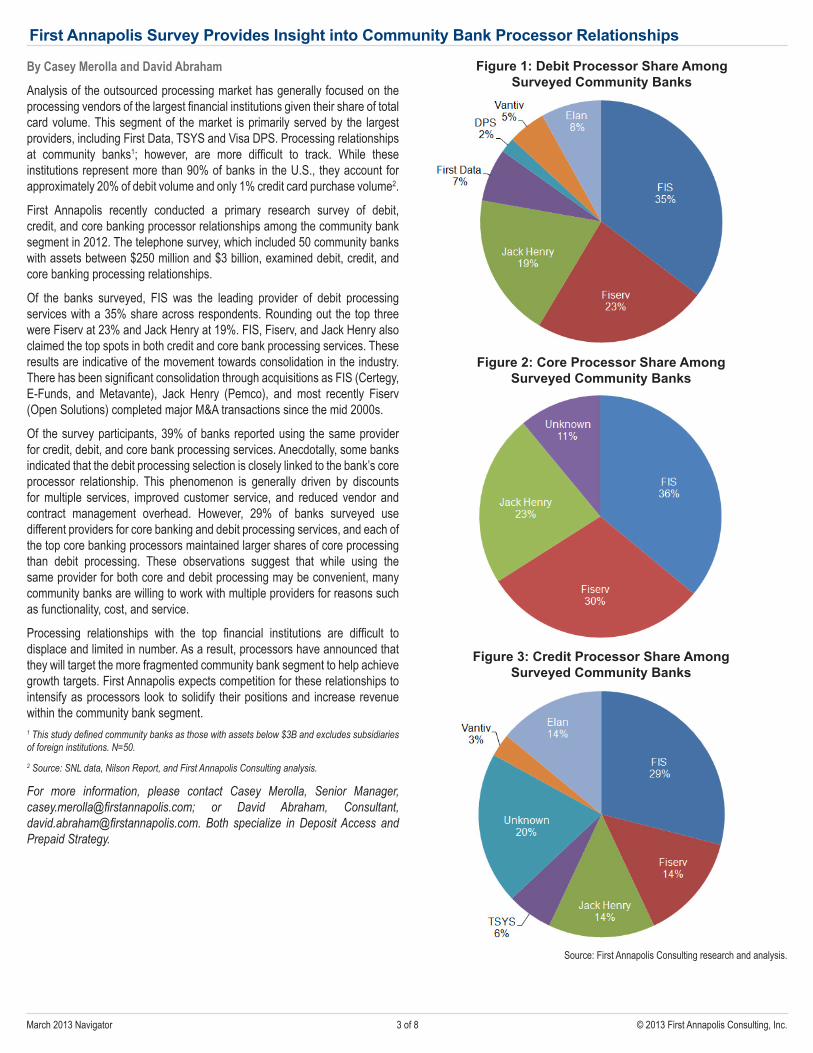
Of the banks surveyed, FIS was the leading provider of debit processing services with a 35% share across respondents. Rounding out the top three were Fiserv at 23% and Jack Henry at 19%. FIS, Fiserv, and Jack Henry also claimed the top spots in both credit and core bank processing services. These results are indicative of the movement towards consolidation in the industry. There has been significant consolidation through acquisitions as FIS (Certegy, E-Funds, and Metavante), Jack Henry (Pemco), and most recently Fiserv (Open Solutions) completed major M&A transactions since the mid 2000s.
Of the survey participants, 39% of banks reported using the same provider for credit, debit, and core bank processing services. Anecdotally, some banks indicated that the debit processing selection is closely linked to the bank’s core processor relationship. This phenomenon is generally driven by discounts for multiple services, improved customer service, and reduced vendor and contract management overhead. However, 29% of banks surveyed use different providers for core banking and debit processing services, and each of the top core banking processors maintained larger shares of core processing than debit processing. These observations suggest that while using the same provider for both core and debit processing may be convenient, many community banks are willing to work with multiple providers for reasons such as functionality, cost, and service.
Processing relationships with the top financial institutions are difficult to displace and limited in number. As a result, processors have announced that they will target the more fragmented community bank segment to help achieve growth targets. First Annapolis expects competition for these relationships to intensify as processors look to solidify their positions and increase revenue within the community bank segment. 1 This study defined community banks as those with assets below $3B and excludes subsidiaries of foreign institutions. N=50.2 Source: SNL data, Nilson Report, and First Annapolis Consulting analysis.
For more information, please contact Casey Merolla, Senior Manager, [email protected]; or David Abraham, Consultant, [email protected]. Both specialize in Deposit Access and Prepaid Strategy.
Source: First Annapolis Consulting research and analysis.
Figure 1: Debit Processor Share Among Surveyed Community Banks
Figure 2: Core Processor Share Among Surveyed Community Banks
Figure 3: Credit Processor Share Among Surveyed Community Banks
4 of 8 © 2013 First Annapolis Consulting, Inc.April 2013 Navigator
Facebook Continues Investment in Gifting Strategy
ByJohnGrundandAllisonBrenner
Recently, social media giant Facebook launched the Facebook Card – its branded, reusable gift card that is able to store value for multiple retailers. The four launch partners were Target, Sephora, Olive Garden, and Jamba Juice. Subsequently, Staples, Outback Steak House, Burger King and Walgreens have also become Facebook Card partners. The gift card launch is one of
several moves where Facebook is attempting to commercialize its vast social media network and gifting is clearly on their radar screen. Given the communal and interactive nature of the network coupled with its rich information, it is easy to see how gifting in its many forms (e.g., holidays, weddings, incentives, etc) would be a priority.
Facebook has pursued the gifting market for some time as one of its first
ByFrankMartien
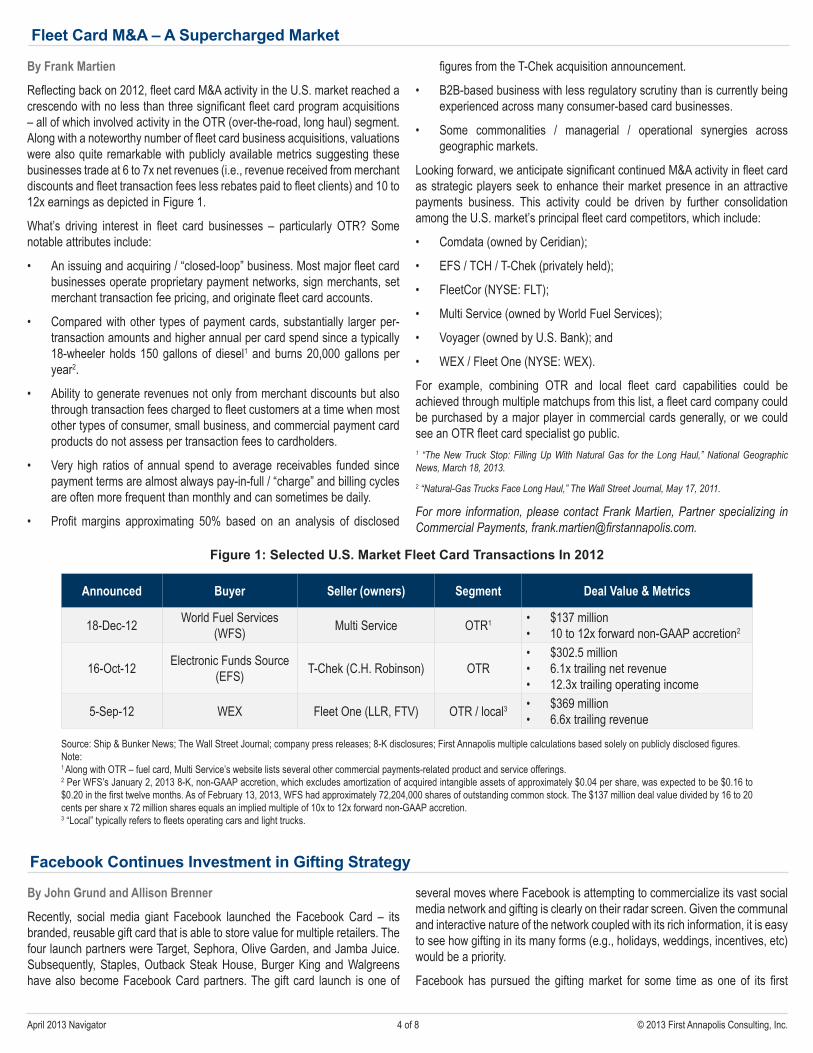
Reflecting back on 2012, fleet card M&A activity in the U.S. market reached a crescendo with no less than three significant fleet card program acquisitions – all of which involved activity in the OTR (over-the-road, long haul) segment. Along with a noteworthy number of fleet card business acquisitions, valuations were also quite remarkable with publicly available metrics suggesting these businesses trade at 6 to 7x net revenues (i.e., revenue received from merchant discounts and fleet transaction fees less rebates paid to fleet clients) and 10 to 12x earnings as depicted in Figure 1.
What’s driving interest in fleet card businesses – particularly OTR? Some notable attributes include:
• An issuing and acquiring / “closed-loop” business. Most major fleet card businesses operate proprietary payment networks, sign merchants, set merchant transaction fee pricing, and originate fleet card accounts.
• Compared with other types of payment cards, substantially larger per-transaction amounts and higher annual per card spend since a typically 18-wheeler holds 150 gallons of diesel1 and burns 20,000 gallons per year2.
• Ability to generate revenues not only from merchant discounts but also through transaction fees charged to fleet customers at a time when most other types of consumer, small business, and commercial payment card products do not assess per transaction fees to cardholders.
• Very high ratios of annual spend to average receivables funded since payment terms are almost always pay-in-full / “charge” and billing cycles are often more frequent than monthly and can sometimes be daily.
• Profit margins approximating 50% based on an analysis of disclosed
Fleet Card M&A – A Supercharged Market
figures from the T-Chek acquisition announcement.
• B2B-based business with less regulatory scrutiny than is currently being experienced across many consumer-based card businesses.
• Some commonalities / managerial / operational synergies across geographic markets.
Looking forward, we anticipate significant continued M&A activity in fleet card as strategic players seek to enhance their market presence in an attractive payments business. This activity could be driven by further consolidation among the U.S. market’s principal fleet card competitors, which include:
• Comdata (owned by Ceridian);
• EFS / TCH / T-Chek (privately held);
• FleetCor (NYSE: FLT);
• Multi Service (owned by World Fuel Services);
• Voyager (owned by U.S. Bank); and
• WEX / Fleet One (NYSE: WEX).
For example, combining OTR and local fleet card capabilities could be achieved through multiple matchups from this list, a fleet card company could be purchased by a major player in commercial cards generally, or we could see an OTR fleet card specialist go public.1 “The New Truck Stop: Filling Up With Natural Gas for the Long Haul,” National Geographic News, March 18, 2013.2 “Natural-Gas Trucks Face Long Haul,” The Wall Street Journal, May 17, 2011.
For more information, please contact Frank Martien, Partner specializing in Commercial Payments, [email protected].
Figure 1: Selected U.S. Market Fleet Card Transactions In 2012
Source: Ship & Bunker News; The Wall Street Journal; company press releases; 8-K disclosures; First Annapolis multiple calculations based solely on publicly disclosed figures.Note: 1 Along with OTR – fuel card, Multi Service’s website lists several other commercial payments-related product and service offerings.2 Per WFS’s January 2, 2013 8-K, non-GAAP accretion, which excludes amortization of acquired intangible assets of approximately $0.04 per share, was expected to be $0.16 to $0.20 in the first twelve months. As of February 13, 2013, WFS had approximately 72,204,000 shares of outstanding common stock. The $137 million deal value divided by 16 to 20 cents per share x 72 million shares equals an implied multiple of 10x to 12x forward non-GAAP accretion.3 “Local” typically refers to fleets operating cars and light trucks.
Announced Buyer Seller(owners) Segment DealValue&Metrics
18-Dec-12 World Fuel Services (WFS) Multi Service OTR1 • $137 million
• 10 to 12x forward non-GAAP accretion2
16-Oct-12 Electronic Funds Source (EFS) T-Chek (C.H. Robinson) OTR
• $302.5 million• 6.1x trailing net revenue• 12.3x trailing operating income
5-Sep-12 WEX Fleet One (LLR, FTV) OTR / local3 • $369 million• 6.6x trailing revenue
5 of 8 © 2013 First Annapolis Consulting, Inc.April 2013 Navigator
Top European Airlines Face Some Headwinds, But Mostly Opportunities, in Co-Branding
ByErikHowellandMariaPopova
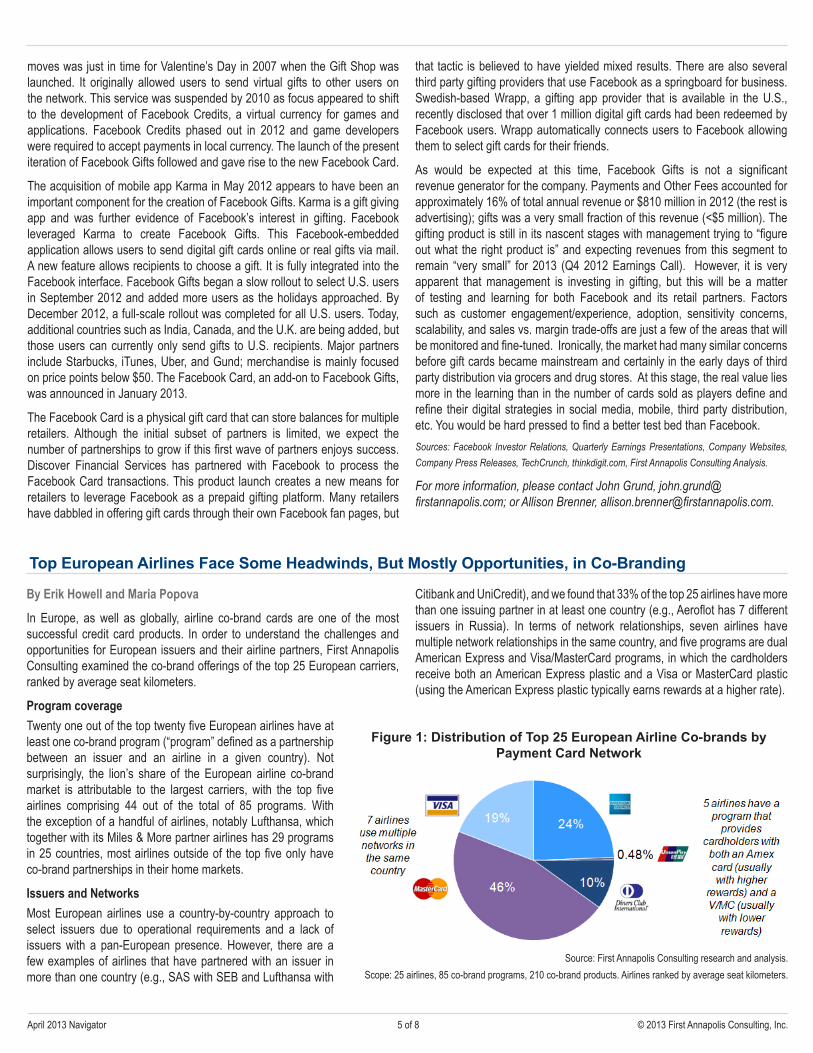
In Europe, as well as globally, airline co-brand cards are one of the most successful credit card products. In order to understand the challenges and opportunities for European issuers and their airline partners, First Annapolis Consulting examined the co-brand offerings of the top 25 European carriers, ranked by average seat kilometers.
ProgramcoverageTwenty one out of the top twenty five European airlines have at least one co-brand program (“program” defined as a partnership between an issuer and an airline in a given country). Not surprisingly, the lion’s share of the European airline co-brand market is attributable to the largest carriers, with the top five airlines comprising 44 out of the total of 85 programs. With the exception of a handful of airlines, notably Lufthansa, which together with its Miles & More partner airlines has 29 programs in 25 countries, most airlines outside of the top five only have co-brand partnerships in their home markets.
IssuersandNetworksMost European airlines use a country-by-country approach to select issuers due to operational requirements and a lack of issuers with a pan-European presence. However, there are a few examples of airlines that have partnered with an issuer in more than one country (e.g., SAS with SEB and Lufthansa with
Citibank and UniCredit), and we found that 33% of the top 25 airlines have more than one issuing partner in at least one country (e.g., Aeroflot has 7 different issuers in Russia). In terms of network relationships, seven airlines have multiple network relationships in the same country, and five programs are dual American Express and Visa/MasterCard programs, in which the cardholders receive both an American Express plastic and a Visa or MasterCard plastic (using the American Express plastic typically earns rewards at a higher rate).
Figure 1: Distribution of Top 25 European Airline Co-brands by Payment Card Network
Source: First Annapolis Consulting research and analysis.Scope: 25 airlines, 85 co-brand programs, 210 co-brand products. Airlines ranked by average seat kilometers.
moves was just in time for Valentine’s Day in 2007 when the Gift Shop was launched. It originally allowed users to send virtual gifts to other users on the network. This service was suspended by 2010 as focus appeared to shift to the development of Facebook Credits, a virtual currency for games and applications. Facebook Credits phased out in 2012 and game developers were required to accept payments in local currency. The launch of the present iteration of Facebook Gifts followed and gave rise to the new Facebook Card.
The acquisition of mobile app Karma in May 2012 appears to have been an important component for the creation of Facebook Gifts. Karma is a gift giving app and was further evidence of Facebook’s interest in gifting. Facebook leveraged Karma to create Facebook Gifts. This Facebook-embedded application allows users to send digital gift cards online or real gifts via mail. A new feature allows recipients to choose a gift. It is fully integrated into the Facebook interface. Facebook Gifts began a slow rollout to select U.S. users in September 2012 and added more users as the holidays approached. By December 2012, a full-scale rollout was completed for all U.S. users. Today, additional countries such as India, Canada, and the U.K. are being added, but those users can currently only send gifts to U.S. recipients. Major partners include Starbucks, iTunes, Uber, and Gund; merchandise is mainly focused on price points below $50. The Facebook Card, an add-on to Facebook Gifts, was announced in January 2013.
The Facebook Card is a physical gift card that can store balances for multiple retailers. Although the initial subset of partners is limited, we expect the number of partnerships to grow if this first wave of partners enjoys success. Discover Financial Services has partnered with Facebook to process the Facebook Card transactions. This product launch creates a new means for retailers to leverage Facebook as a prepaid gifting platform. Many retailers have dabbled in offering gift cards through their own Facebook fan pages, but
that tactic is believed to have yielded mixed results. There are also several third party gifting providers that use Facebook as a springboard for business. Swedish-based Wrapp, a gifting app provider that is available in the U.S., recently disclosed that over 1 million digital gift cards had been redeemed by Facebook users. Wrapp automatically connects users to Facebook allowing them to select gift cards for their friends.
As would be expected at this time, Facebook Gifts is not a significant revenue generator for the company. Payments and Other Fees accounted for approximately 16% of total annual revenue or $810 million in 2012 (the rest is advertising); gifts was a very small fraction of this revenue (<$5 million). The gifting product is still in its nascent stages with management trying to “figure out what the right product is” and expecting revenues from this segment to remain “very small” for 2013 (Q4 2012 Earnings Call). However, it is very apparent that management is investing in gifting, but this will be a matter of testing and learning for both Facebook and its retail partners. Factors such as customer engagement/experience, adoption, sensitivity concerns, scalability, and sales vs. margin trade-offs are just a few of the areas that will be monitored and fine-tuned. Ironically, the market had many similar concerns before gift cards became mainstream and certainly in the early days of third party distribution via grocers and drug stores. At this stage, the real value lies more in the learning than in the number of cards sold as players define and refine their digital strategies in social media, mobile, third party distribution, etc. You would be hard pressed to find a better test bed than Facebook.Sources: Facebook Investor Relations, Quarterly Earnings Presentations, Company Websites, Company Press Releases, TechCrunch, thinkdigit.com, First Annapolis Consulting Analysis.
For more information, please contact John Grund, [email protected]; or Allison Brenner, [email protected].
6 of 8 © 2013 First Annapolis Consulting, Inc.April 2013 Navigator
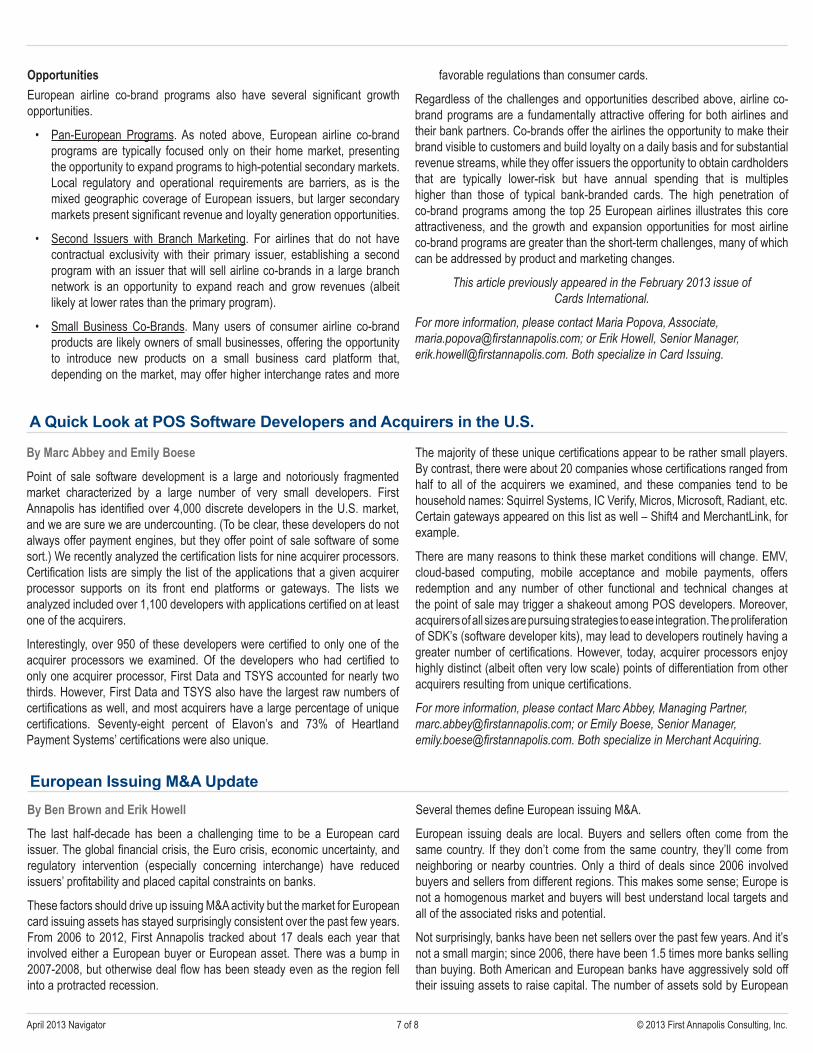
Figure 3: Comparison of European Airline Co-Brand Card Mileage Earning Rates
Source: First Annapolis Consulting research and analysis.* Reward ticket is defined as a free (before tax) ticket with the same region (i.e., the
cheapest ticket in terms of miles. It is assumed that 10% of the spending is at the airline, and 90% is at other merchants.
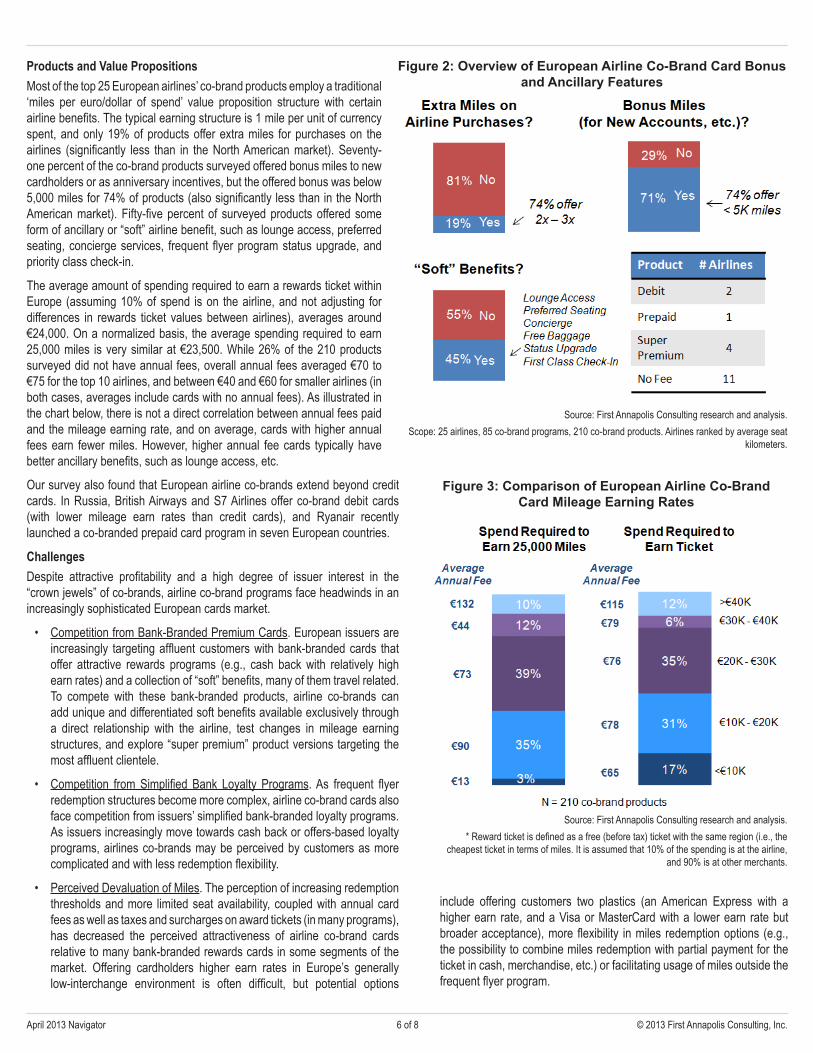
Figure 2: Overview of European Airline Co-Brand Card Bonus and Ancillary Features
Source: First Annapolis Consulting research and analysis.Scope: 25 airlines, 85 co-brand programs, 210 co-brand products. Airlines ranked by average seat
kilometers.
include offering customers two plastics (an American Express with a higher earn rate, and a Visa or MasterCard with a lower earn rate but broader acceptance), more flexibility in miles redemption options (e.g., the possibility to combine miles redemption with partial payment for the ticket in cash, merchandise, etc.) or facilitating usage of miles outside the frequent flyer program.
Our survey also found that European airline co-brands extend beyond credit cards. In Russia, British Airways and S7 Airlines offer co-brand debit cards (with lower mileage earn rates than credit cards), and Ryanair recently launched a co-branded prepaid card program in seven European countries.
ChallengesDespite attractive profitability and a high degree of issuer interest in the “crown jewels” of co-brands, airline co-brand programs face headwinds in an increasingly sophisticated European cards market.
• Competition from Bank-Branded Premium Cards. European issuers are increasingly targeting affluent customers with bank-branded cards that offer attractive rewards programs (e.g., cash back with relatively high earn rates) and a collection of “soft” benefits, many of them travel related. To compete with these bank-branded products, airline co-brands can add unique and differentiated soft benefits available exclusively through a direct relationship with the airline, test changes in mileage earning structures, and explore “super premium” product versions targeting the most affluent clientele.
• Competition from Simplified Bank Loyalty Programs. As frequent flyer redemption structures become more complex, airline co-brand cards also face competition from issuers’ simplified bank-branded loyalty programs. As issuers increasingly move towards cash back or offers-based loyalty programs, airlines co-brands may be perceived by customers as more complicated and with less redemption flexibility.
• Perceived Devaluation of Miles. The perception of increasing redemption thresholds and more limited seat availability, coupled with annual card fees as well as taxes and surcharges on award tickets (in many programs), has decreased the perceived attractiveness of airline co-brand cards relative to many bank-branded rewards cards in some segments of the market. Offering cardholders higher earn rates in Europe’s generally low-interchange environment is often difficult, but potential options
ProductsandValuePropositionsMost of the top 25 European airlines’ co-brand products employ a traditional ‘miles per euro/dollar of spend’ value proposition structure with certain airline benefits. The typical earning structure is 1 mile per unit of currency spent, and only 19% of products offer extra miles for purchases on the airlines (significantly less than in the North American market). Seventy-one percent of the co-brand products surveyed offered bonus miles to new cardholders or as anniversary incentives, but the offered bonus was below 5,000 miles for 74% of products (also significantly less than in the North American market). Fifty-five percent of surveyed products offered some form of ancillary or “soft” airline benefit, such as lounge access, preferred seating, concierge services, frequent flyer program status upgrade, and priority class check-in.
The average amount of spending required to earn a rewards ticket within Europe (assuming 10% of spend is on the airline, and not adjusting for differences in rewards ticket values between airlines), averages around €24,000. On a normalized basis, the average spending required to earn 25,000 miles is very similar at €23,500. While 26% of the 210 products surveyed did not have annual fees, overall annual fees averaged €70 to €75 for the top 10 airlines, and between €40 and €60 for smaller airlines (in both cases, averages include cards with no annual fees). As illustrated in the chart below, there is not a direct correlation between annual fees paid and the mileage earning rate, and on average, cards with higher annual fees earn fewer miles. However, higher annual fee cards typically have better ancillary benefits, such as lounge access, etc.
7 of 8 © 2013 First Annapolis Consulting, Inc.April 2013 Navigator
A Quick Look at POS Software Developers and Acquirers in the U.S.
ByMarcAbbeyandEmilyBoese
Point of sale software development is a large and notoriously fragmented market characterized by a large number of very small developers. First Annapolis has identified over 4,000 discrete developers in the U.S. market, and we are sure we are undercounting. (To be clear, these developers do not always offer payment engines, but they offer point of sale software of some sort.) We recently analyzed the certification lists for nine acquirer processors. Certification lists are simply the list of the applications that a given acquirer processor supports on its front end platforms or gateways. The lists we analyzed included over 1,100 developers with applications certified on at least one of the acquirers.
Interestingly, over 950 of these developers were certified to only one of the acquirer processors we examined. Of the developers who had certified to only one acquirer processor, First Data and TSYS accounted for nearly two thirds. However, First Data and TSYS also have the largest raw numbers of certifications as well, and most acquirers have a large percentage of unique certifications. Seventy-eight percent of Elavon’s and 73% of Heartland Payment Systems’ certifications were also unique.
The majority of these unique certifications appear to be rather small players. By contrast, there were about 20 companies whose certifications ranged from half to all of the acquirers we examined, and these companies tend to be household names: Squirrel Systems, IC Verify, Micros, Microsoft, Radiant, etc. Certain gateways appeared on this list as well – Shift4 and MerchantLink, for example.
There are many reasons to think these market conditions will change. EMV, cloud-based computing, mobile acceptance and mobile payments, offers redemption and any number of other functional and technical changes at the point of sale may trigger a shakeout among POS developers. Moreover, acquirers of all sizes are pursuing strategies to ease integration. The proliferation of SDK’s (software developer kits), may lead to developers routinely having a greater number of certifications. However, today, acquirer processors enjoy highly distinct (albeit often very low scale) points of differentiation from other acquirers resulting from unique certifications.
For more information, please contact Marc Abbey, Managing Partner, [email protected]; or Emily Boese, Senior Manager, [email protected]. Both specialize in Merchant Acquiring.
European Issuing M&A UpdateByBenBrownandErikHowell
The last half-decade has been a challenging time to be a European card issuer. The global financial crisis, the Euro crisis, economic uncertainty, and regulatory intervention (especially concerning interchange) have reduced issuers’ profitability and placed capital constraints on banks.
These factors should drive up issuing M&A activity but the market for European card issuing assets has stayed surprisingly consistent over the past few years. From 2006 to 2012, First Annapolis tracked about 17 deals each year that involved either a European buyer or European asset. There was a bump in 2007-2008, but otherwise deal flow has been steady even as the region fell into a protracted recession.
Several themes define European issuing M&A.
European issuing deals are local. Buyers and sellers often come from the same country. If they don’t come from the same country, they’ll come from neighboring or nearby countries. Only a third of deals since 2006 involved buyers and sellers from different regions. This makes some sense; Europe is not a homogenous market and buyers will best understand local targets and all of the associated risks and potential.
Not surprisingly, banks have been net sellers over the past few years. And it’s not a small margin; since 2006, there have been 1.5 times more banks selling than buying. Both American and European banks have aggressively sold off their issuing assets to raise capital. The number of assets sold by European
OpportunitiesEuropean airline co-brand programs also have several significant growth opportunities.
• Pan-European Programs. As noted above, European airline co-brand programs are typically focused only on their home market, presenting the opportunity to expand programs to high-potential secondary markets. Local regulatory and operational requirements are barriers, as is the mixed geographic coverage of European issuers, but larger secondary markets present significant revenue and loyalty generation opportunities.
• Second Issuers with Branch Marketing. For airlines that do not have contractual exclusivity with their primary issuer, establishing a second program with an issuer that will sell airline co-brands in a large branch network is an opportunity to expand reach and grow revenues (albeit likely at lower rates than the primary program).
• Small Business Co-Brands. Many users of consumer airline co-brand products are likely owners of small businesses, offering the opportunity to introduce new products on a small business card platform that, depending on the market, may offer higher interchange rates and more
favorable regulations than consumer cards.
Regardless of the challenges and opportunities described above, airline co-brand programs are a fundamentally attractive offering for both airlines and their bank partners. Co-brands offer the airlines the opportunity to make their brand visible to customers and build loyalty on a daily basis and for substantial revenue streams, while they offer issuers the opportunity to obtain cardholders that are typically lower-risk but have annual spending that is multiples higher than those of typical bank-branded cards. The high penetration of co-brand programs among the top 25 European airlines illustrates this core attractiveness, and the growth and expansion opportunities for most airline co-brand programs are greater than the short-term challenges, many of which can be addressed by product and marketing changes.
This article previously appeared in the February 2013 issue of Cards International.
For more information, please contact Maria Popova, Associate, [email protected]; or Erik Howell, Senior Manager, [email protected]. Both specialize in Card Issuing.
8 of 8 © 2013 First Annapolis Consulting, Inc.April 2013 Navigator
ByCollinBauer
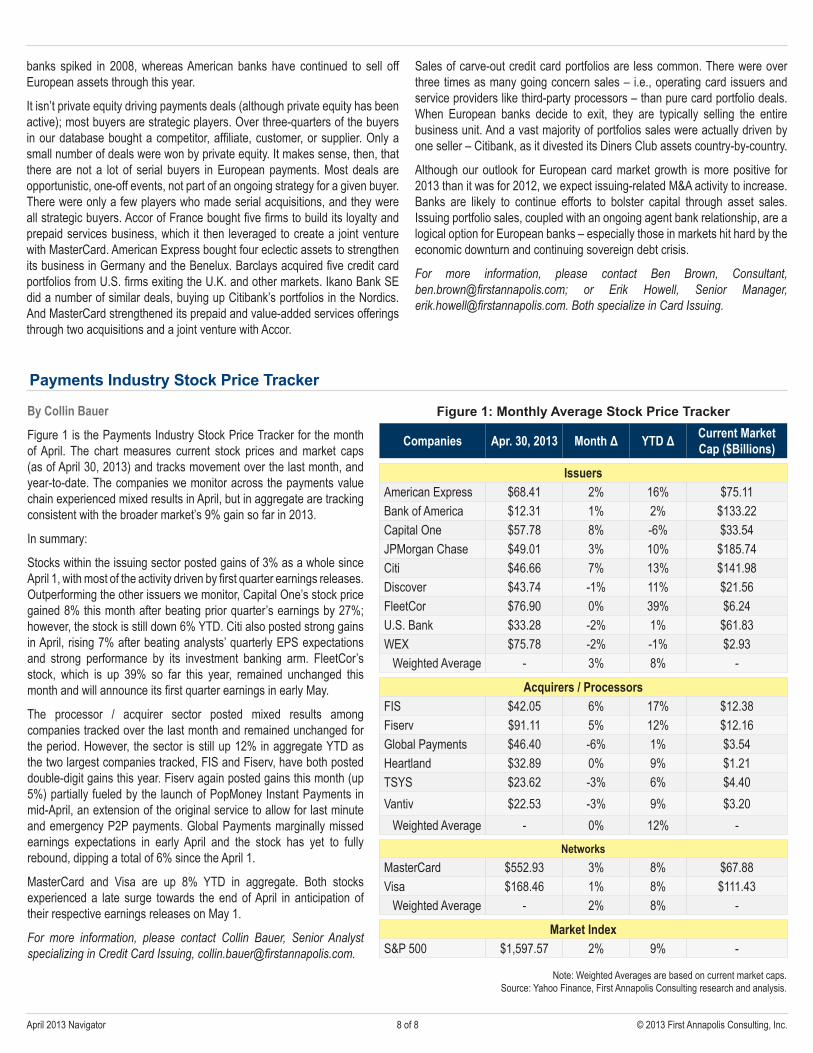
Figure 1 is the Payments Industry Stock Price Tracker for the month of April. The chart measures current stock prices and market caps (as of April 30, 2013) and tracks movement over the last month, and year-to-date. The companies we monitor across the payments value chain experienced mixed results in April, but in aggregate are tracking consistent with the broader market’s 9% gain so far in 2013.
In summary:
Stocks within the issuing sector posted gains of 3% as a whole since April 1, with most of the activity driven by first quarter earnings releases. Outperforming the other issuers we monitor, Capital One’s stock price gained 8% this month after beating prior quarter’s earnings by 27%; however, the stock is still down 6% YTD. Citi also posted strong gains in April, rising 7% after beating analysts’ quarterly EPS expectations and strong performance by its investment banking arm. FleetCor’s stock, which is up 39% so far this year, remained unchanged this month and will announce its first quarter earnings in early May.
The processor / acquirer sector posted mixed results among companies tracked over the last month and remained unchanged for the period. However, the sector is still up 12% in aggregate YTD as the two largest companies tracked, FIS and Fiserv, have both posted double-digit gains this year. Fiserv again posted gains this month (up 5%) partially fueled by the launch of PopMoney Instant Payments in mid-April, an extension of the original service to allow for last minute and emergency P2P payments. Global Payments marginally missed earnings expectations in early April and the stock has yet to fully rebound, dipping a total of 6% since the April 1.
MasterCard and Visa are up 8% YTD in aggregate. Both stocks experienced a late surge towards the end of April in anticipation of their respective earnings releases on May 1.
For more information, please contact Collin Bauer, Senior Analyst specializing in Credit Card Issuing, [email protected].
Payments Industry Stock Price Tracker
Figure 1: Monthly Average Stock Price Tracker
Companies Apr.30,2013 MonthΔ YTDΔ CurrentMarketCap($Billions)
IssuersAmerican Express $68.41 2% 16% $75.11Bank of America $12.31 1% 2% $133.22Capital One $57.78 8% -6% $33.54JPMorgan Chase $49.01 3% 10% $185.74Citi $46.66 7% 13% $141.98Discover $43.74 -1% 11% $21.56FleetCor $76.90 0% 39% $6.24U.S. Bank $33.28 -2% 1% $61.83WEX $75.78 -2% -1% $2.93 Weighted Average - 3% 8% -
Acquirers/ProcessorsFIS $42.05 6% 17% $12.38Fiserv $91.11 5% 12% $12.16Global Payments $46.40 -6% 1% $3.54Heartland $32.89 0% 9% $1.21TSYS $23.62 -3% 6% $4.40Vantiv $22.53 -3% 9% $3.20
Weighted Average - 0% 12% -Networks
MasterCard $552.93 3% 8% $67.88Visa $168.46 1% 8% $111.43
Weighted Average - 2% 8% -
MarketIndexS&P 500 $1,597.57 2% 9% -
Note: Weighted Averages are based on current market caps.Source: Yahoo Finance, First Annapolis Consulting research and analysis.
banks spiked in 2008, whereas American banks have continued to sell off European assets through this year.
It isn’t private equity driving payments deals (although private equity has been active); most buyers are strategic players. Over three-quarters of the buyers in our database bought a competitor, affiliate, customer, or supplier. Only a small number of deals were won by private equity. It makes sense, then, that there are not a lot of serial buyers in European payments. Most deals are opportunistic, one-off events, not part of an ongoing strategy for a given buyer. There were only a few players who made serial acquisitions, and they were all strategic buyers. Accor of France bought five firms to build its loyalty and prepaid services business, which it then leveraged to create a joint venture with MasterCard. American Express bought four eclectic assets to strengthen its business in Germany and the Benelux. Barclays acquired five credit card portfolios from U.S. firms exiting the U.K. and other markets. Ikano Bank SE did a number of similar deals, buying up Citibank’s portfolios in the Nordics. And MasterCard strengthened its prepaid and value-added services offerings through two acquisitions and a joint venture with Accor.
Sales of carve-out credit card portfolios are less common. There were over three times as many going concern sales – i.e., operating card issuers and service providers like third-party processors – than pure card portfolio deals. When European banks decide to exit, they are typically selling the entire business unit. And a vast majority of portfolios sales were actually driven by one seller – Citibank, as it divested its Diners Club assets country-by-country.
Although our outlook for European card market growth is more positive for 2013 than it was for 2012, we expect issuing-related M&A activity to increase. Banks are likely to continue efforts to bolster capital through asset sales. Issuing portfolio sales, coupled with an ongoing agent bank relationship, are a logical option for European banks – especially those in markets hit hard by the economic downturn and continuing sovereign debt crisis.
For more information, please contact Ben Brown, Consultant, [email protected]; or Erik Howell, Senior Manager, [email protected]. Both specialize in Card Issuing.