Public Finance and Developmentburch/Besley-Persson-handbook-2011.pdf · Public Finance and...
70
Public Finance and Development ∗ Tim Besley LSE Torsten Persson IIES PRELIMINARY AND INCOMPLETE Contents 1 Introduction 2 2 Background 4 3 Framework 12 4 Applications 24 4.1 Economic Development ...................... 24 4.2 The Role of Politics ........................ 31 4.3 Social Structure and Politics ................... 39 4.4 The Value of Public Spending .................. 43 4.5 Non-Tax Revenues ........................ 49 4.6 Compliance ............................ 52 5 Conclusion 59 ∗ Draft Chapter for the Handbook of Public Economics, edited by Alan Auerbach, Raj Chetty, Martin Feldstein, and Emmanuel Saez. We are grateful to Mohammad Vesal for superb research assistance. 1
Transcript of Public Finance and Developmentburch/Besley-Persson-handbook-2011.pdf · Public Finance and...
Public Finance and Development∗
Tim Besley
LSE
Torsten Persson
IIES
PRELIMINARY AND INCOMPLETE
Contents
1 Introduction 2
2 Background 4
3 Framework 12
4 Applications 24
4.1 Economic Development . . . . . . . . . . . . . . . . . . . . . . 24
4.2 The Role of Politics . . . . . . . . . . . . . . . . . . . . . . . . 31
4.3 Social Structure and Politics . . . . . . . . . . . . . . . . . . . 39
4.4 The Value of Public Spending . . . . . . . . . . . . . . . . . . 43
4.5 Non-Tax Revenues . . . . . . . . . . . . . . . . . . . . . . . . 49
4.6 Compliance . . . . . . . . . . . . . . . . . . . . . . . . . . . . 52
5 Conclusion 59
∗Draft Chapter for the Handbook of Public Economics, edited by Alan Auerbach, RajChetty, Martin Feldstein, and Emmanuel Saez. We are grateful to Mohammad Vesal for
superb research assistance.
1

“It is shortage of resources, and not inadequate incentives,
which limits the pace of economic development. Indeed the im-
portance of public revenue from the point of view of accelerated
economic development could hardly be exaggerated.” Nicholas
Kaldor, ‘Taxation for Economic Development,” Journal of Mod-
ern African Studies, 1963, page 7
1 Introduction
Perhaps more than any other economist active in the post-war generation,
Nicolas Kaldor appreciated the centrality of public finance to development.
As Kaldor, we believe that the power to tax lies at the heart of state devel-
opment. A moment’s reflection on the history of today’s developed countries
and on the current situation of today’s developing nations suggests that the
acquisition of that power cannot be taken for granted. To be concrete, the
central question in public finance and development is: “how does a govern-
ment go from raising around 10% of GDP in taxes to raising around 40%”?
In the process of development, states not only increase the levels of tax-
ation, but also undergo pronounced changes in patterns of taxation, with
increasing emphasis on broader tax bases. Thus, some taxes — notably on
trade — gradually diminish their importance. In the developed world, it is
taxes on income and value added that do the heavy lifting in raising the
revenue needed to support the productive and redistributive functions of the
state.
Despite these facts, powers to tax are explicitly or implicitly taken for
granted in most of mainstream public finance. What limits the ability to tax
are incentive constraints tied to asymmetric information, or perhaps political
motives, rather than the mere administrative capabilities of the state. Thus,
public finance and development remains a relatively unexplored area in the
field. Neither is it a major industry among scholars of development.
This chapter is about the powers to tax and how these change in the
process of development. Some changes are natural corollaries of broader
changes in economic activity as development proceeds. Others depend on
political factors, such as the structure of political institutions and the de-
gree of political instability. Changes in the power to tax may also reflect
circumstances, e.g., threats of foreign conflicts that forge common interests
in building a strong state. But there are also feedbacks from taxation to
2

development: to service the needs of the state, tax motives may encourage
other aspects of state development in complementary ways.
Generally, we take the view that governments in poor countries can rea-
sonably be thought of as doing their best in raising taxes, given the ad-
ministrative structures in place and the political incentives to raise taxes.
The real question is why these structures remain so weak in many places.
This requires an analysis of endogenous fiscal capacity — the main topic of
this chapter. Sometimes the literature refers to fiscal capacity just as state
capacity. Crudely, the concept captures how much tax a government could
potentially raise given the structure of the tax system and the powers of en-
forcement. Governments need not always operate at or near the level of fiscal
capacity, however, so fiscal capacity may not be directly observable.
We approach these issues by viewing the creation of fiscal capacity as the
product of investments in state structures — including monitoring, adminis-
tration and compliance through such things as training tax inspectors and
running the revenue service efficiently. Our approach gets us away from the
false juxtaposition of positive or normative analyses of optimal taxes versus
studies of tax administration and political economy where administration
reflect the same degree of rationality or irrationality as the choice of taxes.
A key argument is that new tax bases like income taxes and value added
can only become effective though extensive government investments in tax
compliance. Low levels of revenue and disproportionate reliance on narrow
tax bases reflect primarily constraints on achieving tolerable levels of compli-
ance. This view dovetails with historical accounts of how tax systems have
evolved, such as Brewer (1989) and Dincecco (2011). Looking at more the
recent experience through the lens of effective administration, Bird (2004)
observes that “the best tax policy in the world is worth little if it cannot
be implemented effectively”, underlining the need to put fiscal capacity at
centre stage when studying public finance and development.
However, compliance is not only a technical issue. It also reflects the
incentives that policy makers have to improve the tax system. Our starting
point is that governments of the past, or in the developing world today, are
about as rational and farsighted as those in the developed world today. But
they may face incentives and constraints shaped by weakly institutionalized
political environments. The key challenge for the study of public finance and
development is to appreciate how these incentives and constraints work, and
how — if at all — the situation could be improved for the benefit of citizens in
those nations.
3

Section 2 of the chapter gives a background by laying out a number of
facts regarding the levels and patterns of taxes in rich and poor countries. In
Section 3, we present our analytical framework to study equilibrium choices
of taxation and investment in fiscal capacity. Then, in Section 4, we apply
this framework to identify different determinants of taxation and fiscal ca-
pacity: economic development, political institutions, social structures, values
of public spending, non-tax revenues like aid and resocurce rents, and the
administration of taxation. Section 5 concludes.
2 Background
The growth of the state and its capacity to extract significant revenues from
its citizens is one of the most striking features of the economic history over
the last two centuries. For example, Maddison (2001) documents that, on
average, France, Germany, the Netherlands and the UK raised around 12% of
GDP in tax revenue around 1910 and around 46% by the turn of the Millen-
nium. The corresponding U.S. figures are 8% and 30%. Underpinning these
hikes in revenue are a number of tax innovations, including the extension of
the income tax to a wide population. To improve compliance, this required
not only building a tax administration but also implementing withholding
at source. Such investments in the fiscal capacity of the state have enabled
the kind of mass taxation now considered normal throughout the developed
world.
Figure 1 gives a very partial picture of how fiscal capacity has evolved over
time. It plots the distribution of two kinds of upgrading of tax systems for
a sample of 73 countries since 1800.1 Red lines demarcate the introduction
of the income tax and green lines whether or not a country has a VAT.
Although the sample is limited, it illustrates clearly how such investments in
tax collection have evolved over time. Income taxes began appearing in the
mid nineteenth century and are fully prevalent in the sample in the interwar
period. VAT was lagging further behind, with adoption still incomplete by
the end of the twentieth century.
The model developed in this chapter is trying to explain the forces that
shape such changes in the tax system. The changes illustrated in Figure
1 are all associated with investments in administrative structures that sup-
1The sample is limited by the set of countries for which we have confirmed data on
when the income tax was introduced.
4

0.2
.4.6
.81
Pro
port
ion
of C
ount
ries
1800 1850 1900 1950 2000Year
Income Tax VAT
Fiscal capacity in a sample of 73 countries
Figure 1: Historical evolution of fiscal capacity
0.2
.4.6
Ave
rage
sha
re o
f In
com
e T
ax
0.1
.2.3
Ave
rage
sha
re o
f ta
x in
agg
rega
te in
com
e
1900 1920 1940 1960 1980 2000Year
Tax revenue in aggregate income (left scale)Share of income tax in revenue (right scale)
Evolution of tax revenue and income tax for a sample of 18 Countries
Figure 2: Taxes and share of income tax over time
5
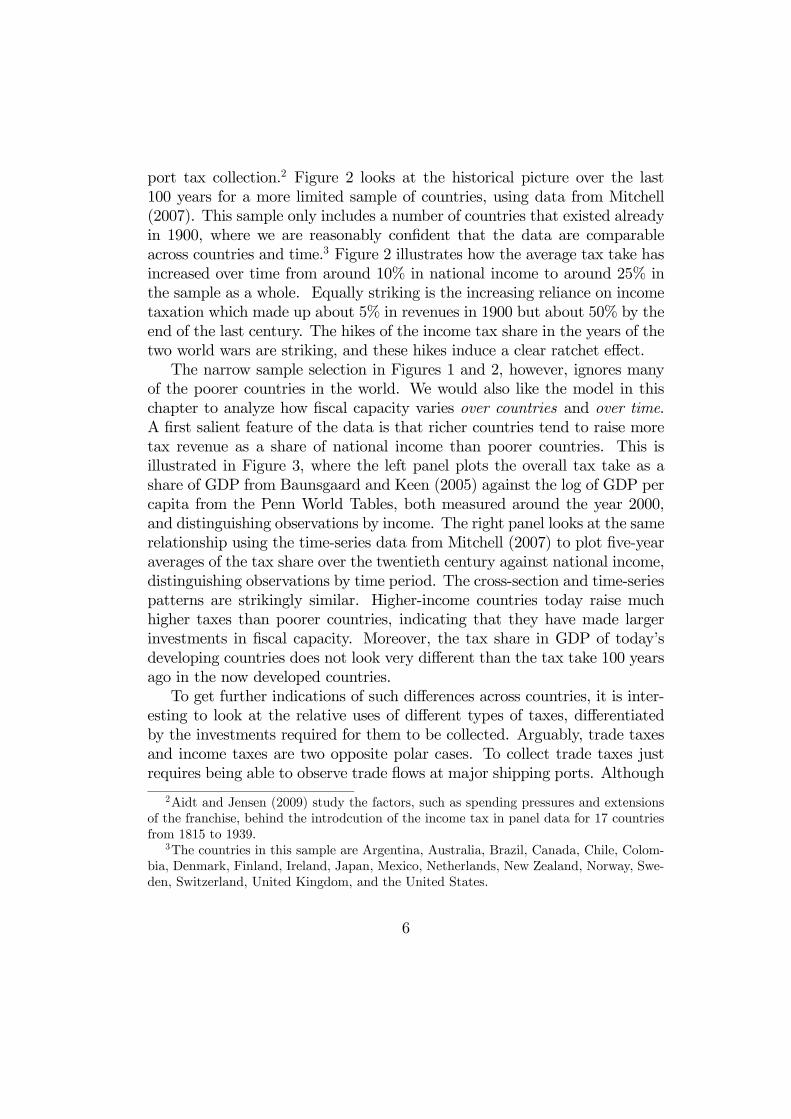
port tax collection.2 Figure 2 looks at the historical picture over the last
100 years for a more limited sample of countries, using data from Mitchell
(2007). This sample only includes a number of countries that existed already
in 1900, where we are reasonably confident that the data are comparable
across countries and time.3 Figure 2 illustrates how the average tax take has
increased over time from around 10% in national income to around 25% in
the sample as a whole. Equally striking is the increasing reliance on income
taxation which made up about 5% in revenues in 1900 but about 50% by the
end of the last century. The hikes of the income tax share in the years of the
two world wars are striking, and these hikes induce a clear ratchet effect.
The narrow sample selection in Figures 1 and 2, however, ignores many
of the poorer countries in the world. We would also like the model in this
chapter to analyze how fiscal capacity varies over countries and over time.
A first salient feature of the data is that richer countries tend to raise more
tax revenue as a share of national income than poorer countries. This is
illustrated in Figure 3, where the left panel plots the overall tax take as a
share of GDP from Baunsgaard and Keen (2005) against the log of GDP per
capita from the Penn World Tables, both measured around the year 2000,
and distinguishing observations by income. The right panel looks at the same
relationship using the time-series data from Mitchell (2007) to plot five-year
averages of the tax share over the twentieth century against national income,
distinguishing observations by time period. The cross-section and time-series
patterns are strikingly similar. Higher-income countries today raise much
higher taxes than poorer countries, indicating that they have made larger
investments in fiscal capacity. Moreover, the tax share in GDP of today’s
developing countries does not look very different than the tax take 100 years
ago in the now developed countries.
To get further indications of such differences across countries, it is inter-
esting to look at the relative uses of different types of taxes, differentiated
by the investments required for them to be collected. Arguably, trade taxes
and income taxes are two opposite polar cases. To collect trade taxes just
requires being able to observe trade flows at major shipping ports. Although
2Aidt and Jensen (2009) study the factors, such as spending pressures and extensions
of the franchise, behind the introdcution of the income tax in panel data for 17 countries
from 1815 to 1939.3The countries in this sample are Argentina, Australia, Brazil, Canada, Chile, Colom-
bia, Denmark, Finland, Ireland, Japan, Mexico, Netherlands, New Zealand, Norway, Swe-
den, Switzerland, United Kingdom, and the United States.
6

0.1
.2.3
.4.5
Sha
re o
f tax
es in
GD
P (
1999
)
6 7 8 9 10 11Log GDP per capita in 2000
High income in 2000 Mid income in 2000
Low income in 2000 Fitted values
A. Country-level taxes and income
0.1
.2.3
.4.5
5 ye
ar a
vera
ges
of s
hare
of t
axes
in G
DP
6 7 8 9 10 115 year averages of log GDP per capita
1900-39 1940-49 1950-69
1970-99 Fitted values
B. Global-level taxes and income
Figure 3: Tax revenue and GDP per capita
such tax allocations may encourage smuggling, this is a much easier propo-
sition than collecting income taxes. The latter requires major investments
in enforcement and compliance structures throughout the entire economy.
We can thus obtain an interesting indication of fiscal-capacity investments
by holding constant total tax revenue, and ask how large a share of it is
collected from trade taxes and income taxes, respectively.
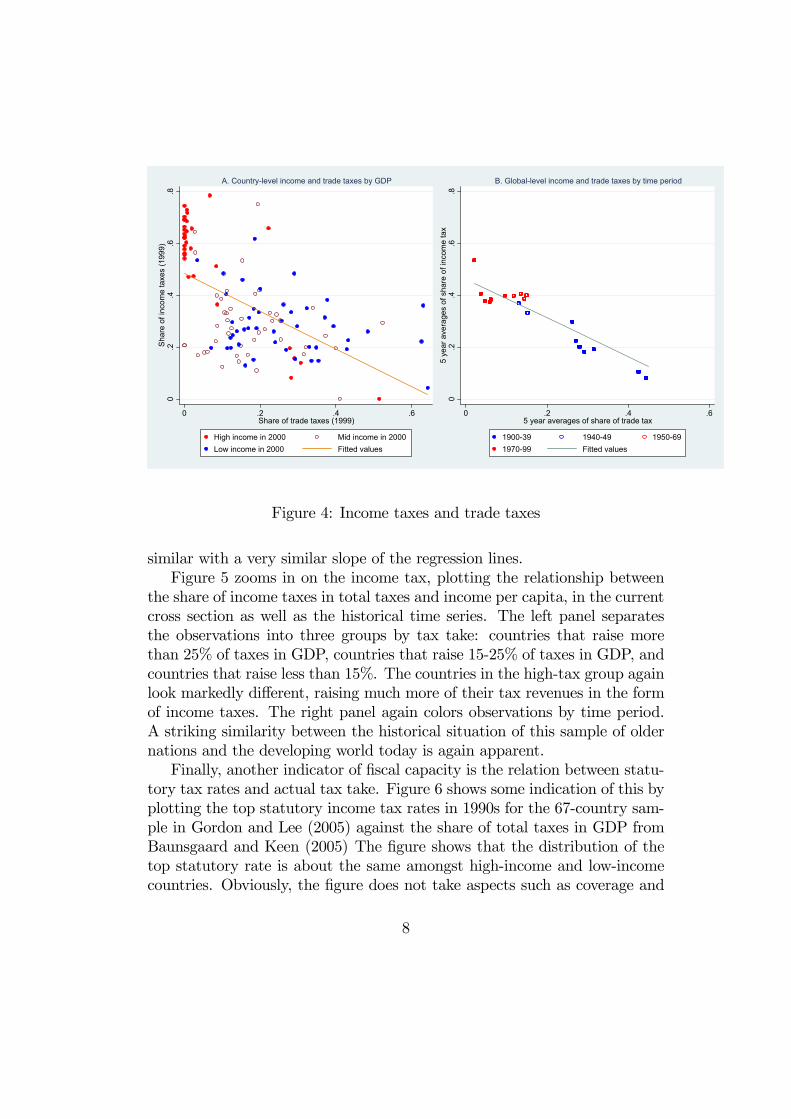
These shares are plotted against each other in Figure 4.4 Again, we report
the cross-sectional pattern for the year 2000, based on data from Baunsgaard
and Keen (2005), and the time-series pattern over the last 100 years based on
historical data from Mitchell (2007). The income-tax share is displayed on
the vertical axis, and the trade-tax share on the horizontal axis. We observe
a clear negative correlation: countries with a higher reliance on income taxes
tend to have less reliance on trade taxes. The left panel also shows a striking
pattern by income: high-income countries depend more on income taxes,
while middle- and — in particular — low-income countries depend more on
trade taxes. The right panel of Figure 4 shows that the move from trade
to income taxes has also been a feature of the historical development of tax
systems. Again, the cross-sectional and time-series patterns look strikingly
4Other taxes not included in either trade or income taxes include indirect taxes such
as VAT, property and corporate taxes.
7
0.2
.4.6
.8S
hare
of i
ncom
e ta
xes
(199
9)
0 .2 .4 .6Share of trade taxes (1999)
High income in 2000 Mid income in 2000
Low income in 2000 Fitted values
A. Country-level income and trade taxes by GDP
0.2
.4.6
.85
year
ave
rage
s of
sha
re o
f inc
ome
tax
0 .2 .4 .65 year averages of share of trade tax
1900-39 1940-49 1950-69
1970-99 Fitted values
B. Global-level income and trade taxes by time period
Figure 4: Income taxes and trade taxes
similar with a very similar slope of the regression lines.
Figure 5 zooms in on the income tax, plotting the relationship between
the share of income taxes in total taxes and income per capita, in the current
cross section as well as the historical time series. The left panel separates
the observations into three groups by tax take: countries that raise more
than 25% of taxes in GDP, countries that raise 15-25% of taxes in GDP, and
countries that raise less than 15%. The countries in the high-tax group again
look markedly different, raising much more of their tax revenues in the form
of income taxes. The right panel again colors observations by time period.
A striking similarity between the historical situation of this sample of older
nations and the developing world today is again apparent.
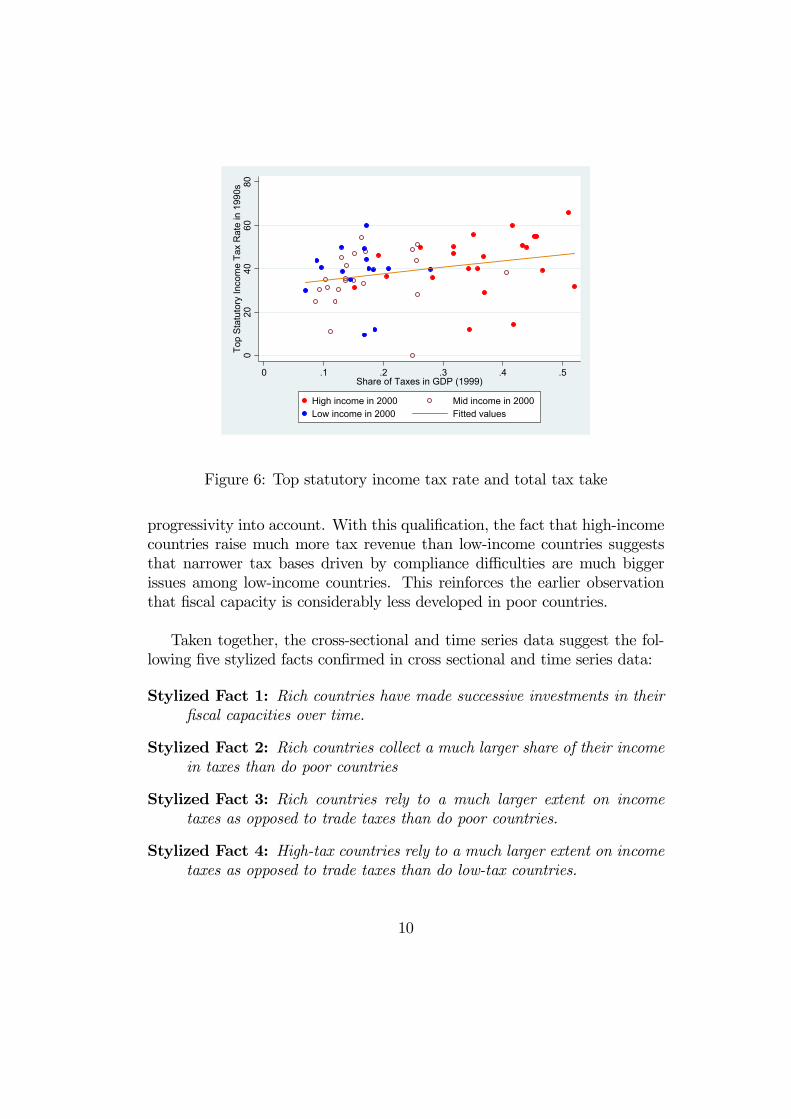
Finally, another indicator of fiscal capacity is the relation between statu-
tory tax rates and actual tax take. Figure 6 shows some indication of this by
plotting the top statutory income tax rates in 1990s for the 67-country sam-
ple in Gordon and Lee (2005) against the share of total taxes in GDP from
Baunsgaard and Keen (2005) The figure shows that the distribution of the
top statutory rate is about the same amongst high-income and low-income
countries. Obviously, the figure does not take aspects such as coverage and
8

0.2
.4.6
.8S
hare
of
inco
me
taxe
s (1
999)
0 .1 .2 .3 .4 .5Share of taxes in GDP(1999)
High income in 2000 Mid income in 2000
Low income in 2000 Fitted values
A. Country-level income taxes and total taxes by GDP
0.2
.4.6
.85
year
ave
rage
s of
sha
re o
f in
com
e ta
x
0 .1 .2 .3 .4 .55 year averages of share of taxes in GDP
1900-39 1940-49 1950-69
1970-99 Fitted values
B. Global-level income taxes and total taxes by time period
Figure 5: Income taxes and total taxes
9
020
4060
80T
op S
tatu
tory
Inc
ome
Tax
Rat
e in
199
0s
0 .1 .2 .3 .4 .5Share of Taxes in GDP (1999)
High income in 2000 Mid income in 2000Low income in 2000 Fitted values
Figure 6: Top statutory income tax rate and total tax take
progressivity into account. With this qualification, the fact that high-income
countries raise much more tax revenue than low-income countries suggests
that narrower tax bases driven by compliance difficulties are much bigger
issues among low-income countries. This reinforces the earlier observation
that fiscal capacity is considerably less developed in poor countries.
Taken together, the cross-sectional and time series data suggest the fol-
lowing five stylized facts confirmed in cross sectional and time series data:
Stylized Fact 1: Rich countries have made successive investments in their
fiscal capacities over time.
Stylized Fact 2: Rich countries collect a much larger share of their income
in taxes than do poor countries
Stylized Fact 3: Rich countries rely to a much larger extent on income
taxes as opposed to trade taxes than do poor countries.
Stylized Fact 4: High-tax countries rely to a much larger extent on income
taxes as opposed to trade taxes than do low-tax countries.
10
Stylized Fact 5: Rich countries collect much higher tax revenue than poor
countries despite comparable statutory rates.
Together, these facts strongly suggest that rich and high-tax countries
have made considerably larger investments in fiscal capacity than have their
poorer and low-tax counterparts.
Despite such clear patterns in the data, economists have not devoted
a great deal of attention to the analysis of fiscal capacity. Indeed, most
normative and positive theories of taxation hardly ever touch upon lack-
ing administrative infrastructure as important constraints on the taxes that
governments can raise.
Public-finance economists have certainly paid attention to the compli-
ance and enforcement structures that facilitate efficient tax collection and
deter tax avoidance — see e.g., Slemrod and Yitzhaki (2002) for an overview.
But this body of research has a normative orientation, and does not study
the building of such structures as a purposive, forward-looking activity by
politically motivated incumbents. In this sense, our approach is related to
the seminal theoretical and empirical work by Cukierman, Edwards, and
Tabellini (1992) on how the use of seigniorage depends on the efficiency of
the tax system, and how the strategic choice of the latter depends on factors
like political stability and polarization.
The greater reliance on trade taxes (and seigniorage) than income taxes
in developing countries has, of course, been noted and discussed by many
authors — see Hinrichs (1966), Tanzi (1992) and Burgess and Stern (1993)
for early contributions. More recently, Gordon and Li (2009) describe the
tilted tax structures as a puzzle to understand. Their proposed explanation
relies on an interplay between informality and undeveloped financial systems,
but these features are basically taken as given and not seen as equilibrium
outcomes of a dynamic process.
There is, however, extensive work by political and economic historians
on the state’s fiscal capacity, the crucial role of wars in stimulating the de-
mand for such capacity, and the importance of this aspect of state building
for the successful development of nation states. This research has yielded
many interesting historical case studies such as Brewer (1989). But there
are also attempts at broader generalizations, as in the work by Schumpeter
(1918), Tilly (1985) and Levi (1988). Tilly, in particular, aims at explaining
European exceptionalism. His work appears to have been greatly inspired by
the encyclopedic scholarship of the German historian Hintze (1906). Some
11
authors, such as Centeno (1997) have claimed that Latin America may be an
exception to the Tilly hypothesis that war was a major motive for building
fiscal capacity.
Development scholars such as Migdal (1988) have emphasized the problem
weak states in developing countries. Such states often lack the capacity to
raise revenue and to govern effectively. Others, such as Herbst (2000), have
ventured the hypothesis that some countries in Africa might have been able
to strengthen their weak states if external wars had been more frequent on
the continent.
3 Framework
The framework we develop in this section is a generalization of the models
studied by Besley and Persson (2009, 2011). Our approach also builds on the
recent literature on how taxable income responds to taxes allowing for a wider
range of responses than the traditional view based on labor supply elasticities;
see Feldstein (1995, 1999) for the original contributions and Slemrod (2001)
for a setting close to the one we adopt.5 This makes particular sense for a
developing country context where non-compliance is such a significant issue
and decisions to earn or spend in the informal (untaxed) sector is an issue.
We build a framework to help us understand the forces behind the decisions
to build a more effective tax system, where such decisions are made by a
forward-looking government. In keeping with the stylized facts, we model
greater effectiveness or fiscal capacity as increasing the yield on statutory
taxes by reducing non-compliance.
The focus in this section is on taxation of labor income and of goods and
services which fall directly on households. This neglects the important issue
of taxation of firms. Neither does the framework deal with taxation of capital
income.
Basic Set-Up Consider a population with J distinct groups, denoted by
= 1 J , and where group is homogenous and comprises a fraction ofthe population. There are two time periods = 1 2. The economy has are
+1 consumption goods, indexed by ∈ {0 1 } Consumption of thesegoods by group in period are denoted by There is also a public good
5See Saez, Slemrod and Giertz (2009) for a review.
12

. Individuals in group supply labor, , and choose how to allocate their
income across consumption goods. This is a small open economy with pre-
tax prices of . Wage rates are potentially group-specific and variable
over time.
Taxation and tax evasion The government may levy taxes on all goods
except the non-taxed numeraire good 0 and on labor. The post-tax price of
each good is:
(1 + ) = 1 2 ,
while the net wage is:
(1− )
where {1 } is the vector of tax rates.As in the standard model, statutory tax policy is a vector of tax rates
for commodities and labor supply. However, to allow for the role of non-
compliance, we suppose that tax payments can reduced by actions tax by
those who are obliged to remit taxes to authorities. If the costs of non-
compliance were large enough, this would not happen and we would be back
in the standard model. But we suppose this may not be the case. More-
over, we allow the cost of non-compliance to depend on investments in fiscal
capacity.
To capture these ideas simply, we assume that the tax payments to the
government from group in period associated with the commodity tax
imposed on good is
£
−
¤,
which we assume to be non-negative. Thus, by spending (units of the
numeraire good) the tax payment can be brought down — we can think of
this as carrying out part of the consumption in the informal sector. The
cost function for such tax evasion or avoidance is the same for all groups
( ) where is increasing and convex in There is a parallel
expression for labor taxes
£ −
¤with cost ( ). One way to interpret and is as the amounts
of consumption and work that are undertaken in the informal sector.
13

The vector τ = { 1 } represents investments in fiscal ca-pacity. For each tax base, = 1 , we assume:
( )
0 and
2 ( )
≥ 0 ,
such that greater fiscal capacity makes avoiding taxes more difficult. More-
over, we postulate that ( 0) = 0 i.e., for a tax base where the govern-
ment has made no investments in fiscal capacity the cost of evading taxes are
negligible. If citizens evade taxes fully when it is costless of doing so, there
will be no income from a tax base that the government has no fiscal capacity
to tax.
For simplicity, we have assumed that fiscal capacity has a common effect
on all individuals’ abilities to avoid paying statutory taxes. As a consequence,
every consumer in the model adjusts their tax-evading behavior on the in-
tensive margin. An alternative way of modelling tax evasion would be to
introduce heterogeneity in the cost of evasion (or in the stigma of being
caught evading). This alternative formulation would introduce an extensive
margin in tax evasion — to use the informal sector or not — but would other-
wise lead to similar results. The most general approach would fashion both
margins and heterogeneous effects according to economic circumstance, for
example greater difficulties of measuring the value of labor earnings by owner-
cultivators, or greater difficulty in measuring own production or bartered
exchange in some sectors of the economy.
Costs of fiscal-capacity investments To some extent, sectorial differ-
ences like these can be represented by the costs of investing in fiscal capacity
across the + 1 tax bases = 1 . Thus, we posit a cost,
F(2 − 1) + (2 1) for = 1
for investing in dimension of fiscal capacity. We assume that the first part
of the investment cost function F is convex in 2, withF(0)
2= 0 i.e.,
the marginal cost at zero is negligible. Moreover, there may or may not
be a fixed-cost component, depending on whether the period-1 government
inherits a fiscal capacity of zero for tax base
(2 1) =
½ ≥ 0 if 1 = 0 and 2 0
0 if 1 0 .
14

Let
F (τ 2 τ 1) =X
=1
F(2 − 1) + (2 1)
be the total costs of investing in fiscal capacity. The separability of the cost
function across tax bases is made for analytical convenience. Another feature
of this technology is that does not depend on the wage rate, even though it
could be that investing in fiscal capacity costs more in a more productive
economy.
In practical terms, the costs of fiscal capacity investment is more obvious
for some tax bases than others. For example, levying an income tax requires
building a monitoring and compliance system with trained inspectors and
some kind of record keeping and the ability to cross check. We would thus
expect a relatively large fixed-cost component, i.e., 0 for = Equally,
a VAT system requires being able to monitor and verify the use of inputs
and the value of sales for all goods simultaneously (but the VAT does not
directly fit the framework above). Levying border taxes usually takes place
by monitoring ports and airports to measure trade flows. For such taxes,
we would expect the fixed-cost component to be small or absent. Moreover,
inspecting trade flows is easier for volumes than values, which might explain
why so many border taxes are specific rather than ad valorem.
However, in all these cases, public resources need to be devoted to mon-
itoring and compliance. Below, we will discuss in greater detail different
options in introducing new technologies to improve compliance.
Household decisions Preferences are quasi-linear and given by:
0 + ¡1
¢− ¡
¢+
()
where is a concave utility function and the convex disutility of labor.
The utility of public goods is partly described by concave function We
use to parametrize the value of public goods, which we allow to be group
and time specific. The individual budget constraint is:
0+
X=1
(1 + ) ≤
(1− )+
+
X=1
[ − ( )]
In this expression, is a group-specific cash-transfer. The only non-standard
feature is the last term, namely the total “profit” from reducing tax pay-
ments. What makes this formulation of the household problem simple is the
15
fact that tax incidence and behavior are still governed by the statutory tax
rates as long as .
Maximizing the consumers’ utility yields a vector of commodity demands
and labor supply which are quite conventional. In particular, since there are
no income effects on the potentially taxed commodities and each consumer
faces the same prices and statutory tax rates, we have that the commodity
demands are equal across groups =
For the tax bases where the government has some fiscal capacity, 0
the decisions to reduce the tax burden, which we assume have an interior
solution, 6 are also equal across groups, and implicitly defined by
= ¡∗
¢for = 1 if 0 (1)
It is straightforward to see that the convexity of the cost function makes
equilibrium evasion ∗ ( ) decreasing in the fiscal capacity investment,tax base by tax base. The household profits from such activities are:
( ) = − ( )
which are increasing in and decreasing in .7
When there is no fiscal capacity, = 0 any positive tax rate would
give us a corner solution with ∗ = or ∗ =
. This is a case
where all consumption could be sheltered from taxation in the informal sector
where the individual has no tax liability. Thus, no tax income is raised at
whatever level the statutory rate is set. To break this tie, we assume that in
such cases the government just sets the statutory tax rate at zero.
6One special case of the model is where
( ) = () .
In this case ≤ () otherwise evasion is complete and we essentially back to the formu-
lation of fiscal capacity Besley and Persson (2009) as an upper bound on the feasible tax
rate.7While we have formulated the model in terms of household decisions not to comply
with taxes, it should now be clear that we could have formulated this as a series of firm-
level decisions where consumers pay their taxes faithfully and firms decide whether to
remit taxes to tax authorities. Profits of non-compliance would still appear as individual
income for owners of firms. Our key assumption is that these non-compliance profits are
distributed equally across the population with each individual getting his own per capita
share. But it would be straightforward to generalize the model to allow for any sharing
rule for these profits.
16

Indirect utility Let
(t τ ) =
X=1
( )
be the aggregate per-capita profit from efforts devoted to tax-reducing activ-
ities where t = {1 } is the vector of tax rates.The indirect utility function for group becomes:
¡t τ
¢=
¡1 (1 + 1) (1 + )) + (
(1− )¢
+ (t τ ) + () + (2)
The first term on the right-hand side is the private surplus from the consump-
tion of goods = 1 . The separable, quasi-linear preferences makes the
private surplus additively separable in goods and labor — hence the second
term. A convenient, but special, feature of the setup is that the gains from
tax reduction are not group specific — hence the third, non-indexed term.
These features help make the analysis much simpler but do not compromise
the economic insights.
The policy problem Governments choose tax rates on all goods and labor
and an expenditure policy, dividing the tax proceeds between public goods,
transfers and investments in fiscal capacity.
Let
(t τ ) =
X=1
( − ) +
JX=1
(
− )
be the tax revenue from goods and labor, where the expression in the first
sum relies on the fact that all groups choose the same consumption vector
for non-numeraire goods. This is not true for labor supply, however, to
the extent that different groups have different wage rates. The government
budget constraint is then
(t τ ) + ≥ +
JX=1
+ , (3)
where
=
½ F (τ 2 τ 1) if = 1
0 if = 2
17
is the amount invested in fiscal capacity (relevant only in period 1) and is
any (net) revenue from borrowing, aid or natural resources.
We now go on to consider first how a government will set taxes and
spending, and then how it will choose to invest in fiscal capacity. We begin
by studying the static (within-period) problem taking fiscal capacity as given.
The social objective of the government has fixed weights , one for each
group, which are normalized so thatPJ
=1 = 1. Then the government
maximizes:JX=1
¡t τ
¢subject to (3). This is a more or less standard optimal tax cum public goods
problem, along the lines first studied in Diamond and Mirrlees (1971). It
is special only in that we have assumed quasi-linear utility and added the
possibility of tax evasion.
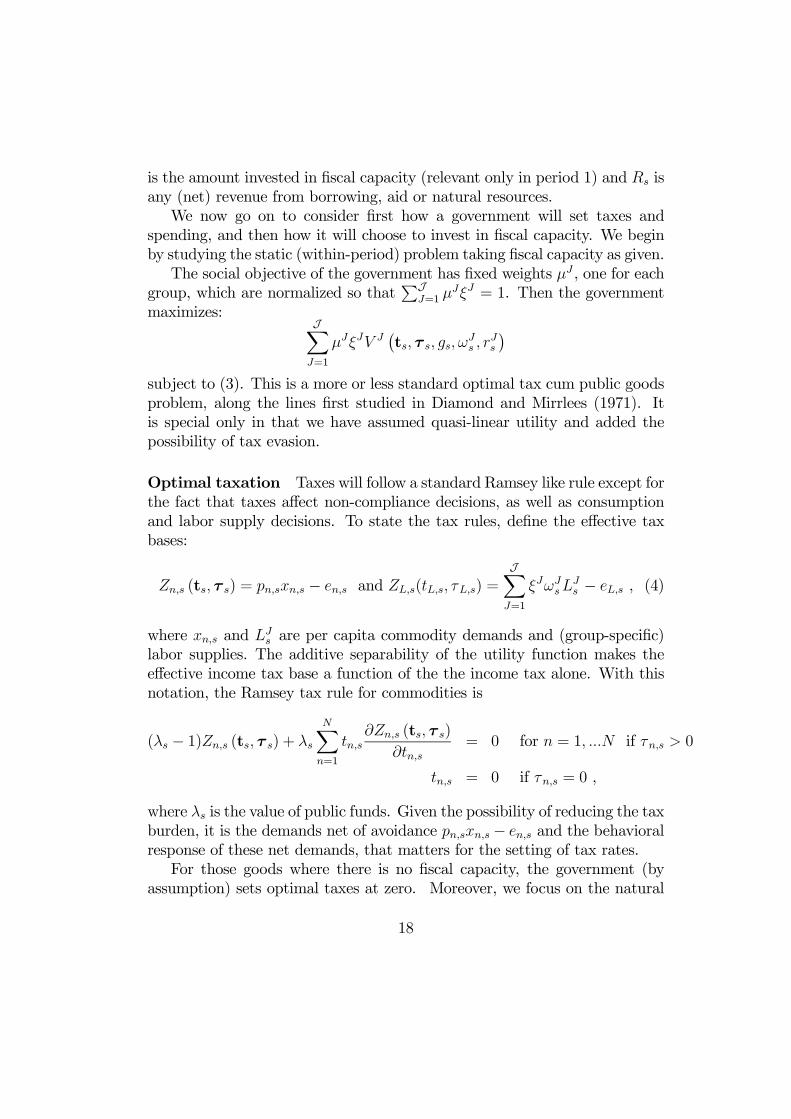
Optimal taxation Taxes will follow a standard Ramsey like rule except for
the fact that taxes affect non-compliance decisions, as well as consumption
and labor supply decisions. To state the tax rules, define the effective tax
bases:
(t τ ) = − and ( ) =
JX=1
− , (4)
where and are per capita commodity demands and (group-specific)
labor supplies. The additive separability of the utility function makes the
effective income tax base a function of the the income tax alone. With this
notation, the Ramsey tax rule for commodities is
( − 1) (t τ ) +
X=1
(t τ )
= 0 for = 1 if 0
= 0 if = 0 ,
where is the value of public funds. Given the possibility of reducing the tax
burden, it is the demands net of avoidance − and the behavioral
response of these net demands, that matters for the setting of tax rates.
For those goods where there is no fiscal capacity, the government (by
assumption) sets optimal taxes at zero. Moreover, we focus on the natural
18
case where ∗ whenever 0. This says that if the government
has any fiscal capacity in some tax base then there is a non-trivial level of
compliance. And in this case, we also expect that the optimal tax rate will
be positive for any tax base where 0.
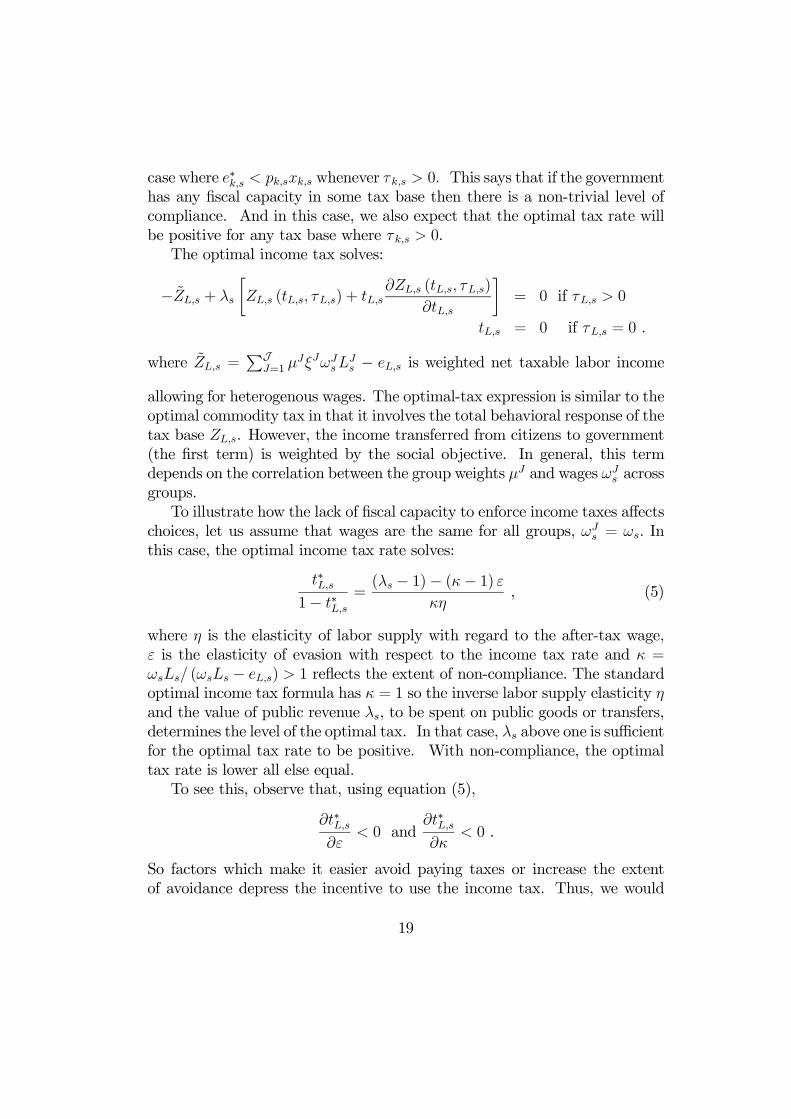
The optimal income tax solves:
− +
∙ ( ) +
( )
¸= 0 if 0
= 0 if = 0 .
where =PJ
=1
− is weighted net taxable labor income
allowing for heterogenous wages. The optimal-tax expression is similar to the
optimal commodity tax in that it involves the total behavioral response of the
tax base . However, the income transferred from citizens to government
(the first term) is weighted by the social objective. In general, this term
depends on the correlation between the group weights and wages across
groups.
To illustrate how the lack of fiscal capacity to enforce income taxes affects
choices, let us assume that wages are the same for all groups, = . In
this case, the optimal income tax rate solves:
∗1− ∗
=( − 1)− (− 1)
, (5)
where is the elasticity of labor supply with regard to the after-tax wage,
is the elasticity of evasion with respect to the income tax rate and =
( − ) 1 reflects the extent of non-compliance. The standard
optimal income tax formula has = 1 so the inverse labor supply elasticity
and the value of public revenue , to be spent on public goods or transfers,
determines the level of the optimal tax. In that case, above one is sufficient
for the optimal tax rate to be positive. With non-compliance, the optimal
tax rate is lower all else equal.
To see this, observe that, using equation (5),
∗
0 and∗
0 .
So factors which make it easier avoid paying taxes or increase the extent
of avoidance depress the incentive to use the income tax. Thus, we would
19

expect lower rates of taxation as well as lower collection of taxes, for a given
rate, in countries with little investment in fiscal capacity for tax collection
(in so far as fiscal capacity increases and ).
The optimal-tax formulas above reflect the fact that, when citizens can
reduce their tax liability, taxes raise less revenue than otherwise. The total
behavioral response to taxation can, in principle, be larger or smaller than in
the absence of tax avoidance, depending on the sensitivity of such activity to
a higher tax. And these responses will be influenced by investments in fiscal
capacity.
There is a direct link here to the literature on taxable income elasticities.
However, these considerations should be applied to all tax bases, not just
labor income. In many developing countries compliance with the VAT is big
issue and the taxable demand elasticity would be relevant to understanding
tax policy. As things stand, the evidence base regarding the total response
of tax revenues to tax rates, and the sources of these effects, is only in its
infancy for developing countries. This is true even for income taxes, the area
where most progress has been made in the developed country literature. For
an exception to this, however, see Kleven and Mazhar (2011) who present ev-
idence on taxable income elasticities for Pakistan using administrative data.
These elasticities turn out to be quite small, at least among those who are
already registered to pay income taxes.
The analysis in this section suggests that to understand the fiscal facts
about developing countries laid out in Section 2, we may be able to appeal
to the fiscal-capacity investments that shape total behavioral responses to
taxation through standard consumption and labor supply distortions but
also through compliance decisions. The structure of taxes is influence by the
fact that fiscal capacity is low or non-existent for some tax bases making
it difficult to collect statutory taxes. This is particularly true for income
taxes versus trade taxes, with the latter demanding much less in terms of
fiscal-capacity investments. The low level of tax take may thus not reflect
larger distortions in consumption and labor supply, for any given tax system,
but larger opportunities for non-compliance. Hence, our emphasis on fiscal-
capacity investments below.
Optimal public spending Before turning to fiscal capacity, we briefly
deal with public spending. In this dimension, the government decides how
much revenue to allocate to transfers and public goods, respectively. With
20

quasi-linear utility, an unconstrained government will direct all transfer spend-
ing, if any, to the group with the highest This is very stark and unrealistic
prediction (but in Section 4.2 we will introduce political constraints that po-
tentially bring about more equal sharing). In the special Utilitarian case,
where = 1 for all , we can assume without loss of generality that any
transfer spending is spent equally. Let max = max© ; = 1 J ª.
To define the optimal level of public spending, let (t∗ () τ ) be total
tax revenue when taxes are set optimally and the marginal value of public
funds is . There are two cases. If
JX=1
( (t
∗ (
max) τ ) + −) max
then all spending will be allocated to public goods, i.e.,
=
JX=1
( (t
∗ () τ ) + −)
This is the case where public goods are very valuable and/or tax revenue is
scarce.
In the other case, the marginal value of public funds is = max tax
revenues are (t∗ (max) τ ) public goods have an interior solution, and
the remaining revenue is spent on transfers to the group defining max
Investments in fiscal capacity The main novelty in our approach to
public finance and development is to study purposeful and forward-looking
decisions by government to invest in alternative forms of fiscal capacity, i.e.,
in vector τ 2. We study this investment decision by making τ 2 endogenous
and chosen by the government in period 1. Having done so, we will use
the resulting conditions to consider which forces drive the creation of fiscal
capacity and how these relate to economic, political and social development.
Let
¡τ +; {}
¢= max
1 J
( JX=1
¡t∗ τ
¢s t (3)
)(6)
be the maximized value of the government’s payoff. Implicit in here are
optimal taxes and spending chosen subject to the fiscal-capacity constraints.
21

Now we can formulate the fiscal-capacity investment decision, as choosing
τ 2 to maximize:
¡τ 1 1 −F (τ 2 τ 1) ; {}
¢+
¡τ 2 2; {}
¢ (7)
This yields a series of conditions for creating fiscal capacity and investing in
it once it has been created.
For fiscal capacity that is already in existence, i.e. 1 0 we have
standard first-order conditions which have a very convenient and readily in-
terpretable form. Using the envelope theorem to eliminate terms in optimal
government (and private) choices, these first-order conditions can be written
as:
2 (t∗2 τ 2)
2+
(t∗2 τ 2)2
− 1F (τ 1 τ 2)
20 0 for = 1 2 (8)
c.s. 2 > 1 0
Three terms govern the investment decisions. The first is the added revenue
from better fiscal capacity weighted by the period-2 marginal value of public
funds. The second term in (8) is the marginal cost imposed on citizens by
higher fiscal capacity — essentially due to higher tax payments, as the profits
from tax evasion fall when fiscal capacity is higher. The third term is the
marginal cost of investing, weighted by the marginal cost of public funds in
period 1.
The three terms in equation (8) nicely encapsulate the forces that shape
fiscal capacity decisions. First, there are factors that make future revenue
more valuable (cost of public funds 2 and the revenue function ) — these
will have a disproportionate effect on investment in tax bases which are
not very elastic. Second, there are circumstances shaping the utility cost
of taxation, which depend on the lengths that governments have to go to
increase compliance (the profit function ). Third, there are features of
the economy which make it more less expensive to invest — including a high
current marginal cost of public funds (the cost function F and cost of publicfunds 1). The investment cost could be quite specific to some kinds of tax
bases.
For the case where the government is thinking about introducing a new
tax base, the reasoning is inherently non-marginal. Discrete gains or losses
which have to be weighed against the fixed cost of the investment. So consider
a decision by a government to add a tax base where 1 = 0. This will
22

give a non-marginal change in indirect utility, which comes from changes in
the use of existing tax bases as well as increased spending on public goods.
It will also imply non-marginal changes in the profits from non-compliance
with new tax base as the optimal taxes change. Together, these yield a
discrete change in ¡τ 2 2; {}
¢ which must be evaluated at the level
2 which solves (8). This must be weighed against the cost of the investment
1£F (2) +
¤. In general, this kind of non-marginal analysis will be
quite complicated. That said, the main economic forces identified in our
discussion of (8) remain the salient forces to shape the decision to invest in
genuinely new tax bases. We will discuss this in detail in the next section
for the specific case of the introduction of an income tax.
Next steps Having built a framework for studying investments in fiscal
capacity, we will now develop insights offered by the approach and what we
learn about differences between different societies at a point in time and the
same society at different points in time.
In the next section, we introduce and discuss six sets of factors pinpointed
by our modeling approach. First, we study the effect of economic factors on
the incentive to build a tax system. Second, we turn to the role of politics,
where we consider how the structure of political institutions and political
instability affect the choice of fiscal capacity. Third, we look at social struc-
ture, including inequality, heterogeneity and polarization. Fourth, we study
the demand side of state action and the factors that go into determining the
value of public spending. Fifth, observing that many poor countries rely on
aid to support state activities while others have access to natural resource
rents, we explore how these non-tax income flows affect the incentives to
build other kinds of fiscal capacity. Finally, we go into more detail on the
technology for increasing tax compliance.
In all cases, we take a starting point in our general model. However, in
each case it will prove convenient to specialize some features to home in on
the particular issues at hand.
23

4 Applications
4.1 Economic Development
In this section, we discuss how changes in the economy might affect choices of
fiscal capacity and the implications for observed taxation. Against the back-
ground of the stark time-series and cross-sectional facts discussed in Section
2, we focus on the role of economic development for the introduction and
expansion of the income tax. We begin by discussing exogenous differences
in the economy across countries or time, turning then to changes that are
endogenous to the government’s investment in state capacity.
Exogenous economic differences We noted in Section 2 (recall Figure
1) that today’s rich economies all have taken the discrete steps of introducing
the income tax and upgrading its efficiency via direct withholding during the
last 150 years. In a contemporary cross section, we also saw (in Figures 2,
3 and 4) that rich and high-taxing countries rely much more on the income
tax than their poor and low-taxing counterparts. Through which channels
could our framework help explain such patterns in the data?
For that purpose, we specialize the model as follows. First, there is only
one consumption good in addition to the numeraire good and labor — i.e.,
we set = 1 Moreover, there are no fixed costs associated with building
fiscal capacity for the taxable consumption good, whereas there may exist
such fixed costs for the income tax — i.e., we have 1 = 0 and ≥ 0 Ofcourse, this stark difference is for illustrative purposes only. To keep things
simple and to pin down the value of public funds, we specialize the utility
function of public goods to be linear, i.e., () = and the value of
public goods to be equal across groups, i.e., = = max These
specialized assumptions will be relaxed in later sections on politics and the
value of public spending. However, they allow us to focus on the case where
the government spends only on public goods with a constant marginal value
of funds.
We start by assuming that wages are be given by the simple expression
= Λ ,
i.e., every group has the same wage. Different values of Λ could represent
natural exogenous income differences between countries or over time due to,
say, geography or productivity.
24

In this specialized framework, the marginal first-order conditions (8) as-
sociated with the two tax bases are
222(2 2)
2+
(2 2)
2− 1
F (2 − 1)
20 0 for = 1 (9)
c.s. 2 > 1
If there were no fixed costs, this expression would tells us that the government
invests more in the tax base that raises more revenue on the margin at the
future value of public funds (the first term), induces a lower utility cost
for consumers via the cost of tax evasion (the second term), or has a lower
marginal cost of investing at the current value of public funds (the third
term). Provided the positive first term outweighs the negative second term,
for = 1 we see positive investments in both types of fiscal capacity sinceF(0)
2= 0
We now revisit the questions when an income tax is worth levying at
all and why economic growth should be associated with implementing an in-
come tax, as we have seen historically. Suppose then that there is a fixed cost
associated with fiscal-capacity building for the income tax and the period-1
level of this capacity is zero, 1 = 0 Recall that the government raises no
revenue at zero fiscal capacity. In order for the income tax to be introduced,
the perceived welfare gains from doing so, by bringing fiscal capacity up to
locally optimal level 2 0 given by (9), have to be large enough to out-
weigh the effective fixed cost F (2)+ 0 associated with setting up a
compliance and monitoring system. Using the definitions and additive sepa-
rability of the government payoff (6), the net tax bases (4), and the indirect
utility function (2), and recalling that when 2 = 0 we have (· 2) =∗2 = 0 (private evasion cost and taxes are zero), we can write the formalcondition as follows:
Λ
Z ∗2
0
£2
∗ ¡Λ2(1− ∗2)¢− ∗ (Λ2(1− )
¤ (10)
+[¡∗2
∗2
¢− (2 − 1)∗2∗ ¡∗2 ∗2¢] ≥ 1[F¡ ∗2
¢+ ]
where ∗2 solves (9).There are basically three considerations. The term on the first line re-
flects the value of transferring funds from private incomes to public spending,
recognizing that there there is deadweight loss associated with lower labor
25
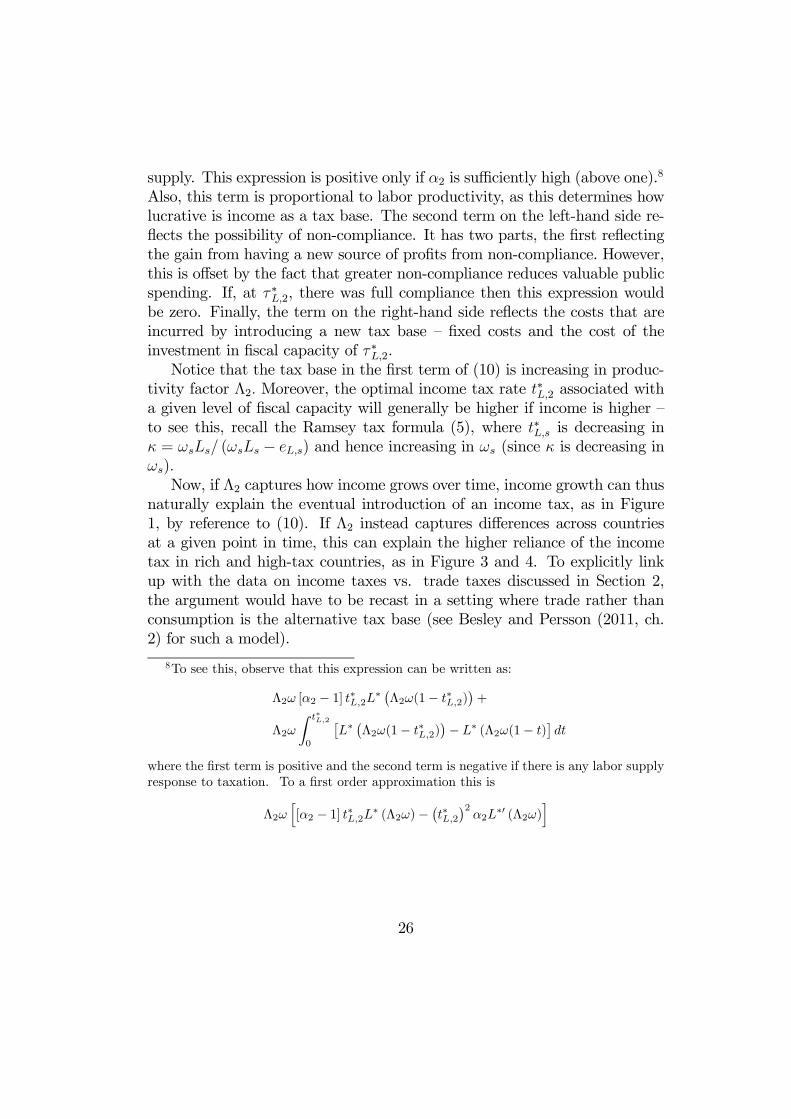
supply. This expression is positive only if 2 is sufficiently high (above one).8
Also, this term is proportional to labor productivity, as this determines how
lucrative is income as a tax base. The second term on the left-hand side re-
flects the possibility of non-compliance. It has two parts, the first reflecting
the gain from having a new source of profits from non-compliance. However,
this is offset by the fact that greater non-compliance reduces valuable public
spending. If, at ∗2, there was full compliance then this expression wouldbe zero. Finally, the term on the right-hand side reflects the costs that are
incurred by introducing a new tax base — fixed costs and the cost of the
investment in fiscal capacity of ∗2.Notice that the tax base in the first term of (10) is increasing in produc-
tivity factor Λ2 Moreover, the optimal income tax rate ∗2 associated with
a given level of fiscal capacity will generally be higher if income is higher —
to see this, recall the Ramsey tax formula (5), where ∗ is decreasing in = ( − ) and hence increasing in (since is decreasing in
)
Now, if Λ2 captures how income grows over time, income growth can thus
naturally explain the eventual introduction of an income tax, as in Figure
1, by reference to (10). If Λ2 instead captures differences across countries
at a given point in time, this can explain the higher reliance of the income
tax in rich and high-tax countries, as in Figure 3 and 4. To explicitly link
up with the data on income taxes vs. trade taxes discussed in Section 2,
the argument would have to be recast in a setting where trade rather than
consumption is the alternative tax base (see Besley and Persson (2011, ch.
2) for such a model).
8To see this, observe that this expression can be written as:
Λ2 [2 − 1] ∗2∗¡Λ2(1− ∗2)
¢+
Λ2
Z ∗2
0
£∗¡Λ2(1− ∗2)
¢− ∗ (Λ2(1− )¤
where the first term is positive and the second term is negative if there is any labor supply
response to taxation. To a first order approximation this is
Λ2h[2 − 1] ∗2∗ (Λ2)−
¡∗2
¢22
∗0 (Λ2)i
26

Endogenous economic differences In this section, we make the level
of fiscal capacity endogenous to other aspects of government state building.
The general modeling follows the analysis in Besley and Persson (2011).
Let wages be given by = Λ() where scalar represents endoge-
nous government investment in the productive side of the state and where
() is an increasing function. Besley and Persson (2011, ch. 3) show that
one can microfound such a formulation in settings where represents the ca-
pacity to carry out legal support to the private sector in the form of contract
enforcement or, alternatively, protection of property rights. In this interpre-
tation, which we will maintain in the present subsection, thus captures the
legal capacity of the government: its courts, its supply of educated judges,
or its registers for credit or property. An alternative interpretation would be
to think of as government infrastructure that raised the productivity in
the private sector. We could also let be a vector of productive capacities,
rather than a scalar.
In analogy with fiscal capacity, we assume that legal capacity in period
2 can be augmented by investment in period 1. That investment has cost
L(2 1) = L(2 − 1) We assume that legal-capacity investments have no
fixed costs, for simplicity, and that L is a convex function with L(0)
= 0 As
a consequence, the total investment costs for the period-1 government are
now given by
=
½ F (τ 2 τ 1) + L(2 1) if = 1
0 if = 2 .
What happens to the investment in fiscal capacity in the specialized model
that we just studied, when we replace exogenous wages = Λ with
endogenous wages = Λ()? The marginal investment conditions in (9)
are not affected, because neither22
= − 22
0 nor22
= − 2
0
depend on legal-capacity investments 2However, the condition for incurring
the fixed costs of introduction of the income tax now becomes:
Λ(2)
Z ∗2
0
£2
∗ ¡Λ2(2)(1− ∗2)¢− ∗ (Λ2(2)(1− )
¤ (11)
+¡∗2
∗2
¢− [2 − 1] ∗2∗ ¡∗2 ∗2¢ ≥ 1[F¡ ∗2
¢+ ]
Only the first term from (10) is affected with higher legal capacity increasing
wages. There are good reasons to expect that this key expression will be
27
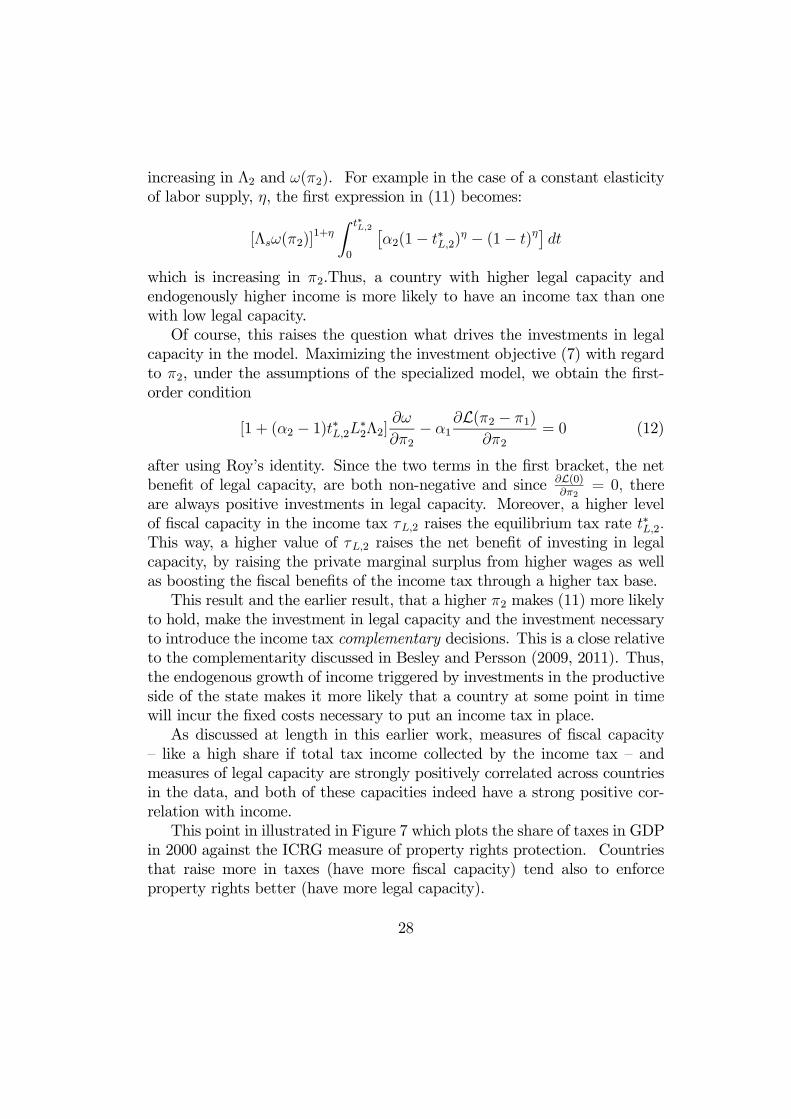
increasing in Λ2 and (2). For example in the case of a constant elasticity
of labor supply, , the first expression in (11) becomes:
[Λ(2)]1+
Z ∗2
0
£2(1− ∗2)
− (1− )¤
which is increasing in 2.Thus, a country with higher legal capacity and
endogenously higher income is more likely to have an income tax than one
with low legal capacity.
Of course, this raises the question what drives the investments in legal
capacity in the model. Maximizing the investment objective (7) with regard
to 2, under the assumptions of the specialized model, we obtain the first-
order condition
[1 + (2 − 1)∗2∗2Λ2]
2− 1
L(2 − 1)
2= 0 (12)
after using Roy’s identity. Since the two terms in the first bracket, the net
benefit of legal capacity, are both non-negative and sinceL(0)2
= 0 there
are always positive investments in legal capacity. Moreover, a higher level
of fiscal capacity in the income tax 2 raises the equilibrium tax rate ∗2This way, a higher value of 2 raises the net benefit of investing in legal
capacity, by raising the private marginal surplus from higher wages as well
as boosting the fiscal benefits of the income tax through a higher tax base.
This result and the earlier result, that a higher 2 makes (11) more likely
to hold, make the investment in legal capacity and the investment necessary
to introduce the income tax complementary decisions. This is a close relative
to the complementarity discussed in Besley and Persson (2009, 2011). Thus,
the endogenous growth of income triggered by investments in the productive
side of the state makes it more likely that a country at some point in time
will incur the fixed costs necessary to put an income tax in place.
As discussed at length in this earlier work, measures of fiscal capacity
— like a high share if total tax income collected by the income tax — and
measures of legal capacity are strongly positively correlated across countries
in the data, and both of these capacities indeed have a strong positive cor-
relation with income.
This point in illustrated in Figure 7 which plots the share of taxes in GDP
in 2000 against the ICRG measure of property rights protection. Countries
that raise more in taxes (have more fiscal capacity) tend also to enforce
property rights better (have more legal capacity).
28

0.2
.4.6
.8S
hare
of
inco
me
tax
in r
even
ue (
1999
)
.4 .6 .8 1Property Rights Protection Index
High income in 2000 Mid income in 2000Low income in 2000 Fitted values
Fiscal and Legal Capacity
Figure 7: Share of income tax in revenue and protection of property rights
Structural Change Development is about a lot more than raising in-
come per capita. The process of rising incomes is typically associated with
deep structural change towards a more urban and non-agriculturally based
economy . Part of that change will be conducive to extracting taxation, in-
cluding greater use of formal sector employment in firms as opposed to self-
employment, as stressed by Kleven, Kreiner and Saez (2009), and greater
use of formal financial transactions, as emphasized by Gordon and Li (2009).
Both types of change make transactions more visible to tax authorities and
enable them to obtain corroborating evidence from cross-reported transac-
tions. Moreover, they form part of transformation of economic activity, where
larger economic units take advantage of scale economies in production. To
the extent that this id reflected in higher wages, the arguments presented
above apply and we would expect fiscal capacity to increase.
The typical discussion of development and taxation couches structural
change as an exogenous feature of economic development with causality run-
ning from economic development to fiscal capacity. This can be captured
in our model either by allowing the function ( ) to depend on the
sector of the economy in which an individual is operating. Suppose we ex-
29
0.2
.4.6
.8S
hare
of
inco
me
taxe
s in
rev
enue
(19
99)
0 20 40 60 80Size of Informal Economy % GNP (1999/2000)
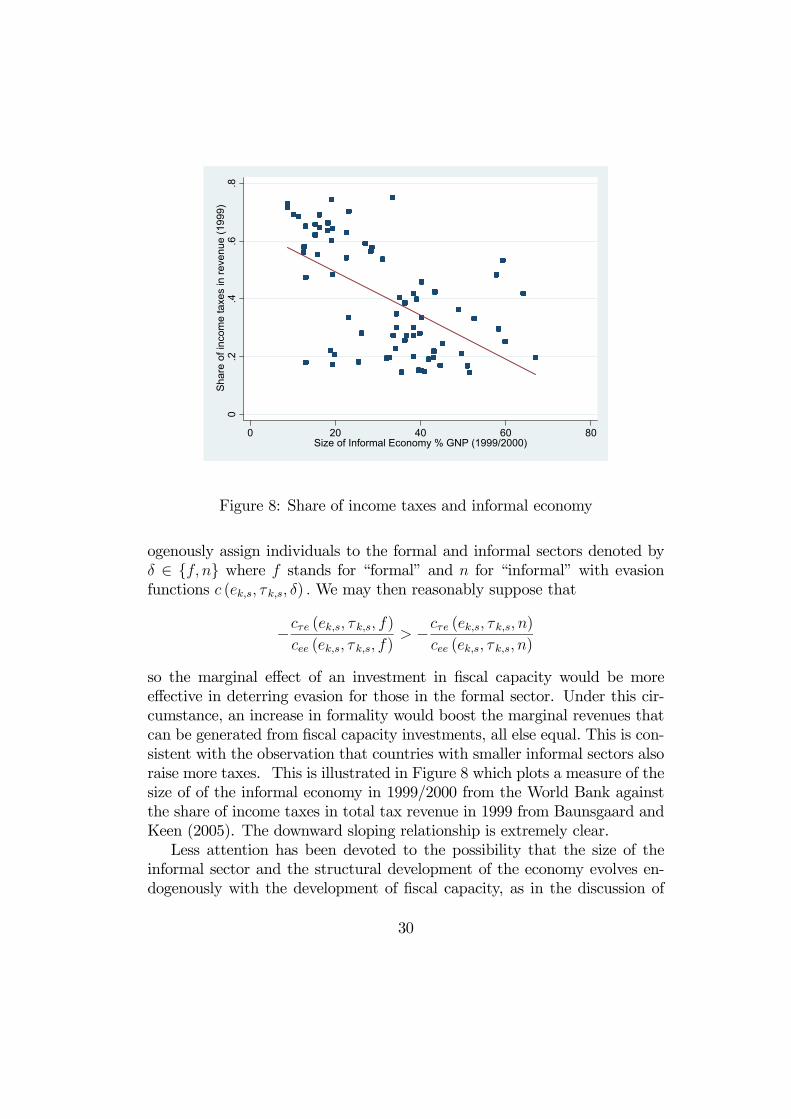
Figure 8: Share of income taxes and informal economy
ogenously assign individuals to the formal and informal sectors denoted by
∈ { } where stands for “formal” and for “informal” with evasion
functions ( ) We may then reasonably suppose that
− ( ) ( )
− ( ) ( )
so the marginal effect of an investment in fiscal capacity would be more
effective in deterring evasion for those in the formal sector. Under this cir-
cumstance, an increase in formality would boost the marginal revenues that
can be generated from fiscal capacity investments, all else equal. This is con-
sistent with the observation that countries with smaller informal sectors also
raise more taxes. This is illustrated in Figure 8 which plots a measure of the
size of of the informal economy in 1999/2000 from the World Bank against
the share of income taxes in total tax revenue in 1999 from Baunsgaard and
Keen (2005). The downward sloping relationship is extremely clear.
Less attention has been devoted to the possibility that the size of the
informal sector and the structural development of the economy evolves en-
dogenously with the development of fiscal capacity, as in the discussion of
30
legal capacity above. However, we may also take one further step and think
of legal capacity as affecting the returns to being formal. It is very hard for
an individual to simultaneously be largely invisible to the tax system while
taking full advantage from the benefits in the legal system. This creates a
further complementarity between legal and fiscal capacity of the state. A
state which invests in the infrastructure to support formal financial inter-
mediation will overcome some of the barriers to formality and enhance the
ability to raise more taxes. A good example of this has been the efforts to
build credit and land registries in the process of development to increase
property rights and contract enforcement. Such registries clearly bring the
patterns of ownership and credit contracts into the daylight for tax authori-
ties. To study these issues explicitly, we would have to extend the model with
an endogenous decision to choose the sector based on costs and benefits.
While a higher cost of tax evasion is a cost of choosing the formal sector,
there may be benefits in the form of a better trading environment.9
4.2 The Role of Politics
No account of the development process is complete without bringing in the
political forces that shape policy selection. A widely held view is that the
failure of states to build strong institution might reflect weak motives to do
so, given the nature of the political institutions. In this section, we explore
the implications of bringing into the analysis a government which operates
under institutional constraints and faces the possibility of political turnover.
The framework that we use is based on Besley and Persson (2010, 2011). As
we shall see, this adds new issues to the analysis of fiscal capacity building
and allows us to uncover important additional forces which can explain high
or low investments.
Cohesive institutions Suppose that the government in power acts on
behalf of a specific group in the spirit of a citizen-candidate approach to
politics — see Besley and Coate (1997) and Osborne and Slivinski (1996).
We assume no agency problem within the incumbent group; whoever in the
group holds power, she cares about the average welfare of its members.
9Also germane to this discussion are the increasing efforts by may governments to link
certain transfer benefits, such as social security, to paying taxes and working in the formal
sector.
31

We model how political institutions constrain the incumbent’s allocation
of transfers in a very simple way. Specifically, this constraint requires the
incumbent group in period , called to give (at least) a fixed share to all
non-incumbent groups for any unit of transfers awarded to its own group.
That is to say, we impose the restriction
≥ for 6= .
We let ∈ [0 1] represent the “cohesiveness” of institutions; the closer isto 1, the more cohesive are political institutions.
This is an extremely simple, tractable but reduced-form way of looking at
politics. We will interpret a higher value of in one of two broad ways. One
real-world counterpart might be minority protection by constitutional checks
and balances on the executive due to some separation of powers. In prac-
tice, we expect democracies to impose greater constraints on the executive
than autocracies. An alternative real-world counterpart might be stronger
political representation of the interests of losers in policy decisions through
proportional representation elections or parliamentary democracy. The liter-
ature on the policy effects of constitutional rules suggests that both of these
institutional arrangements make policymakers to internalize the preferences
of a larger share of the population — see, e.g., Persson and Tabellini (2000),
Persson, Roland and Tabellini (2000), or Aghion, Alesina, and Trebbi (2004).
Using this way of representing political institutions, we can solve for trans-
fers allocated to the incumbent group and all the groups in opposition = .
In the model of Section 3, these are
= ¡
¢[ (t τ ) + − −] and
= ¡
¢[ (t τ ) + − −]
respectively, where
¡
¢=
1
+ (1− )and
¡
¢=
+ (1− )(13)
For = 1, there is equal division of any residual tax revenue as transfers.
Otherwise, the incumbent group receives a higher share of transfer spending.
We maintain the simplifying assumption that the utility function for pub-
lic goods is linear, but allow the valuation of public goods to differ across
groups. The shadow value of public revenue now compares the incumbent’s
32

value of transfers ¡
¢to spending on public goods
. As in the gen-
eral model, we have two cases. If
¡
¢then all spending will be
allocated to public goods, i.e., = .In the other case, the marginal value
of public funds is = ¡
¢
Suppose now that a single group is in power in period 1 as well as period 2,
i.e. there is a natural elite and no political turnover for sure. In this case, the
preferences of the elite determines policy and investment in fiscal capacity.
For simplicity, we assume away any fixed costs in investment (or alternatively
1 0 for all so that the fixed costs have already been incurred). Then,
we get the following first-order conditions for investment in fiscal capacity:
2 (t∗2 τ 2)
2+
(t∗2 τ 2)2
− 1F (τ 1 τ 2)
20 0 (14)
c.s.2 > 1
The analysis requires only a modest modification of the benchmark model,
where we recognize that the driving force behind the decision to build fiscal
capacity is now the preference of the elite, rather than society as a whole,
for tax revenue. Clearly, an elite that values public goods a lot is more likely
to spend on public goods than one that does not. Spending on public goods
rather than transfers is more likely as institutions become more cohesive, →1 and the ability of an incumbent to extract transfers diminishes. However,
an elite can also be motivated to build capacity to collect tax revenue as a
means of increasing transfers for itself, when = ¡
¢because the elite
faces few checks and balances on its power to pursue group interests (i.e.,
is low which makes ¡
¢high).
Political turnover The model becomes more interesting when there is
political turnover, i.e., the identity of the incumbent group may shift over
time. To zoom in on this issues, we specialize the model to the case of only
two groups where each of those comprise half the population, = 12 Let
∈ [0 1] be the probability that the incumbent group is replaced betweenthe two time periods. Clearly, is a natural measure of political instability.
This new feature adds new and important dimensions to the analysis of policy
and fiscal capacity.
Let the period- payoff of being either the incumbent or the opposition,
= be:
(τ −) =
¡t∗¡ τ
¢ τ
∗
¡ τ
¢
()
¡ τ
¢¢,
33

where
¡ τ
¢=£¡t∗¡ τ
¢ τ
¢+ − − ∗
¡ τ
¢¤is the total budget available for transfers, and () =
¡12 ¢and () =
¡12 ¢are the shares of transfers going to the incumbent and opposition
groups. Now the level of fiscal capacity will be chosen to maximize
(τ 1 1 −F (τ 1 τ 2)) + (1− ) (τ 2 2) + (τ 2 2) (15)
The effect of political turnover follows from the fact that enters this ex-
pected payoff.
The optimization of the incumbent over the vector of fiscal capacity
yields:
(1− ) (τ 2 2)
2+
(τ 2 2)
2− 11
F (τ 1 τ 2)2
0 0 (16)
c.s.2 > 1
which, of course, just says that marginal costs and benefits are equated (at an
interior solution). The third marginal cost term in (16) is by now familiar.
However, some additional considerations go into computing the marginal
benefit represented by the first and second term.
After some algebra, one can rewrite (16) as:
[2 + (2 − 2)] (t∗2 τ 2)
2+∆
2 + (t∗2 τ 2)
2− 1
F (τ 1 τ 2)2
0 0(17)
c.s.2 > 1
where
∆2 ≡
2
¡t∗2¡22 τ 2
¢ τ 2
∗2
¡22 τ 2
¢
2 ()
¡ τ
¢¢t∗2 (τ 2)
·t∗2
¡22 τ 2
¢2(18)
and
2 =
½12 if 1
2 ≥ ()
() otherwise .
The third and fourth terms in (17) are the same as in earlier cases , capturing
the utility costs of greater compliance and the marginal costs of investment in
34

fiscal capacity. As before, the first term represents the value of extra revenue.
However, the weight on this is now more complicated since the value of public
revenue to the current incumbent is different when a marginal future dollar
is spent by the incumbent than by herself, especially when the spending is on
transfers rather than public goods. Unless there is agreement in the valuation
of public goods 12 = 1
2 and/or institutions are fully cohesive = 1 we
would expect 2 2 so this effect will tend to diminish the incentive to
invest in fiscal capacity, and more so the higher is the probability of turnover
.
The second term ∆2 is entirely new. It represents an effect familiar
from analyses of strategic policy making in dynamic models, which began
with Alesina and Tabellini (1990) and Persson and Svensson (1989). The
fact that the current incumbent and opposition may differ in their views
about optimal period-2 taxes, means that the period-1 incumbent should
structure investments in fiscal capacity to influence those decisions. For
example, she may overinvest (underinvest) in the income tax if she likes the
income tax more (less) than the opposition, so as to encourage (discourage)
the opposition in using the income tax in the future, and the more so the
higher the likelihood that the opposition takes over.
The size of this effect and whether it is positive or negative cannot be
determined without going into details. A specific example that may lead to
underinvestments is the case of a period-1 high-wage incumbent, who might
be unlikely to invest heavily in income-tax compliance if she anticipates being
replaced by a period-2 low-wage incumbent (see Subsection 4.3 for more
details).
On balance, we may therefore expect higher political turnover to diminish
investments in fiscal capacity, especially if there are few checks and balances
so that is high ( low) so that transfers are shared quite unequally.
Three types of state Following Besley and Persson (2011), the political
model of the previous section allows us to think about three types of fiscal
state that can emerge depending on the combination of political institutions
and political turnover. For simplicity, and to focus on a specific set of issues,
we will work through the case where 1 = 1
= and =
, so
the valuations of public goods as well as earnings opportunities are identical
across the two groups.
35
A common-interest state As long as 2 is high enough relative to
the value of transfers, we have:
2 = 2 = 2 = 2 () . (19)
In this case, all incremental tax revenue is spent on public goods and there
is agreement about the future value of public funds. We will refer to this
as a case of common interests, as both groups agree that the state should
be for a common purpose, either because public goods are valuable (so that
2 is high), or political institutions are very cohesive (so that () is low).
In this case, we have a common-interest state, where the level of investment
is driven entirely by the motive to invest in tax revenue to provide public
goods. Moreover, both groups agree on the level and structure of taxation.
The Euler equations for investing in fiscal capacity become identical to the
benchmark model in Section 3, namely:
2 (t∗2 τ 2)
2+
(t∗2 τ 2)2
− 1F (τ 1 τ 2)
20 0
c.s. 2 > 1
Political institutions do not affect these decisions since the two groups agree
on policy, and the state is run with a common purpose, no matter who
is in charge. Although somewhat fanciful, the nearest real-world example
might be what happens in a state of war, or a common external threat where
common interests are paramount. We return to this point in Subsection 4.4
on the value of public spending below.
A redistributive state Now consider what happens when
2 () (20)
In this case, the marginal dollar is spent on transfers, i.e. 2 = ().
Moreover, the value of public funds to the opposition is (). Now each
group values public revenues differently and the period one incumbent cares
about whether his group will remain in power to reap the rewards from
investing in fiscal capacity which will accrue to the incumbent. The expected
value of public revenues in period 2 to the period-1 incumbent is now:
12 = (1− ) () + ()
36

which is decreasing in for all 1. Indeed, this value is maximized at
2when = = 0 This is the case, where an incumbent faces no threat
of removal and no checks and balances. The desire to build a revenue base
is then based on the desire to redistribute resources towards the incumbent
group.
Besley and Persson (2011) refer to the case when a strong sectional motive
to redistributive is the driving force for state building as a redistributive state.
Such states thrive on low turnover and low cohesion. In the limiting case of
2 = 2, the Euler equations are:
2 (t∗2 τ 2)
2+
(t∗2 τ 2)2
− 2F (τ 1 τ 2)2
0 0
c.s. 2 > 1
Since the incumbent is guaranteed to remain in power, there is no strategic
effect in this case.
A weak state A weak state combines non-cohesive institutions so that
(20) holds with high political instability. To illustrate this, consider what
happens if an incumbent expects to lose power for sure and his successor
faces no meaningful executive constraints, i.e. = 1 and = 0. Then, the
expected value of public revenues created by investments in fiscal capacity
is zero! The future incumbent, i.e., the current opposition is the residual
claimant on all revenue created by fiscal-capacity investments. In this special
case, the fiscal-capacity Euler equations are:
∆2 +
(t∗2 τ 2)2
− 1F (τ 1 τ 2)
20 0
c.s. 2 > 1
Since the second and the third terms are both negative, the only potential
argument for building fiscal capacity would be to influence strategically the
decisions over taxation of a future incumbent, according to the first term.
However, this term is negative too: because 2 2 = 0, the future incum-
bent (the current opposition) wants (much) higher taxation than the current
incumbent. Hence, the strategic motive makes the current incumbent not
want to invest at all, perhaps even destroy fiscal capacity if that is feasible
option.
37

-.2
-.1
0.1
.2.3
Sha
re o
f ta
xes
in G
DP
(19
99)
-.5 0 .5Average executive constraints until 2000
Partial correlation of executive constraints and fiscal capacity
Figure 9: Share of tax revenue and executive constraints
While we have illustrated this mechanism for an extreme case, the logic
is much more general. Political instability and little political cohesion (few
checks and balances) generally mean that the incentives to invest in fiscal
capacity are very slim, so we expect tax compliance and hence tax revenues
to stay weak under these conditions.
One bottom line of the discussion in this section is that we should ex-
pect countries that have operated on more cohesive institutions in the past
to have a higher stock of fiscal capacity today. Besley and Persson (2011,
chs. 2 and 3) show that this is indeed the case, when fiscal capacity is mea-
sured in different ways and cohesive political institutions are measured by
executive constraints in the Polity IV data set. Political instability is harder
to measure in a convincing way, but there seems to be some evidence that
more stability is correlated with higher fiscal capacity.Figure 9 illustrates
the relationship between current fiscal capacity and past cohesive political
institutions using a partial correlation plot. As a measure of cohesiveness,
we use the history of the strength of a country’s executive constraints from
1800, or its year of creation, up to 2000. The data come from the Polity IV
38

data base, specifically the variable executive constraints measuring various
checks and balances on the executive. Following the theory outlined above,
the underlying regression controls for the value of public spending, through
measures of ethnic homogeneity and (past) external wars, and the degree of
political instability, through measures of openness and competition in the
selection of the executive. We see a very clear upward slope in the regression
line, consistent with the argument in this section — countries with a history
of more cohesive institutions appear to have built more fiscal capacity.
4.3 Social Structure and Politics
The two-group model with common valuations of public goods and identical
wages has served well to illustrate some key points. But clearly, it misses
a lot in terms of social structure, which may affect the struggle for power.
Often, the political struggle has different values or an unequal distribution
of resources at its heart.
Group size heterogeneity and elite rule Consider now the possibility
that the two groups in the specialized model have different size but face the
same institutions, as represented by when in office. Observe that ¡
¢
as defined in (13), is larger for the majority group than the minority group,
meaning that transfer behavior becomes more cohesive when larger groups
are in office, as their value of extracting a dollar in transfers is much lower
than for a small group. A lower value of ¡
¢means that the condition
¡
¢for all spending to be on public goods is more easily to fulfil. Thus, there
is a greater chance the state pursues a policy in the common interest when
large groups hold power. On this account, majority rule is more likely to
stimulate buildup of fiscal capacity than minority rule. Indeed, if a country
is governed by a small elite, it seems rather unlikely that a common-interest
state will emerge — instead the state will become redistributive or weak.
The same basic effect will emerge when a group leader rules on behalf
of a small elite rather than on behalf of the group as a whole. When such
narrow elites alternate in power, it will be difficult to create common interests
in the use of public resources. Therefore, the value of political reform that
raises towards 1 can be particularly strong in such a country. Similarly,
39
measures which reduce the agency problem between elites and rank and file
group members could also push a country towards a common-interest state.
Income inequality The discussion in Subsection 4.2, abstracted from het-
erogeneity in earnings. To home in on this, we now focus exclusively on in-
come taxation and assume away all other forms of heterogeneity, e.g., in
group size or the preferences for public spending. Using standard logic from
Romer (1975), Roberts (1977), and Meltzer and Richards (1981), we would
expect a low-income group to prefer a higher rate of income taxation than
the high-income group, due to the redistributive effect of income taxation
whether it is spent on public goods or transfers. We might also expect these
policy preferences to translate into different incentives to invest in fiscal ca-
pacity to increase income taxation.10
These mechanisms are most simply illustrated in the case of a common-
interest state where (19) holds. Suppose we specialize the model to two
groups, = where stands for “poor” and for “rich” with
We have dropped the time subscripts, i.e., we assume that the rich and the
poor each have the same wage rates periods 1 and 2. In the case with constant
elasticity of labor supply, the income tax preferred by group (assuming an
interior solution) becomes:
∗1− ∗
=
¡ −
¢+ (1− )
(21)
where = P
is the ratio of group ’s labor income to
average labor income. For the rich to want a positive income tax, the value
of public spending as represented by has to be great enough. Clearly, we
have
∗ ∗
in general. We can now say something concrete about the strategic effect in
equation (18) provided we assume, as the discussion following equation (5)
10Cárdenas and Tuzemen (2010) use a similar model, allowing for income inequality
between two groups, called Elites and Citizens. When the (richer) Elites are in power,
in the presence of political instability, both income and political inequality lead to lower
investment in state capacity. Conversely, if the (poorer) Citizens rule, high political and
income inequality results in higher state capacity.
40
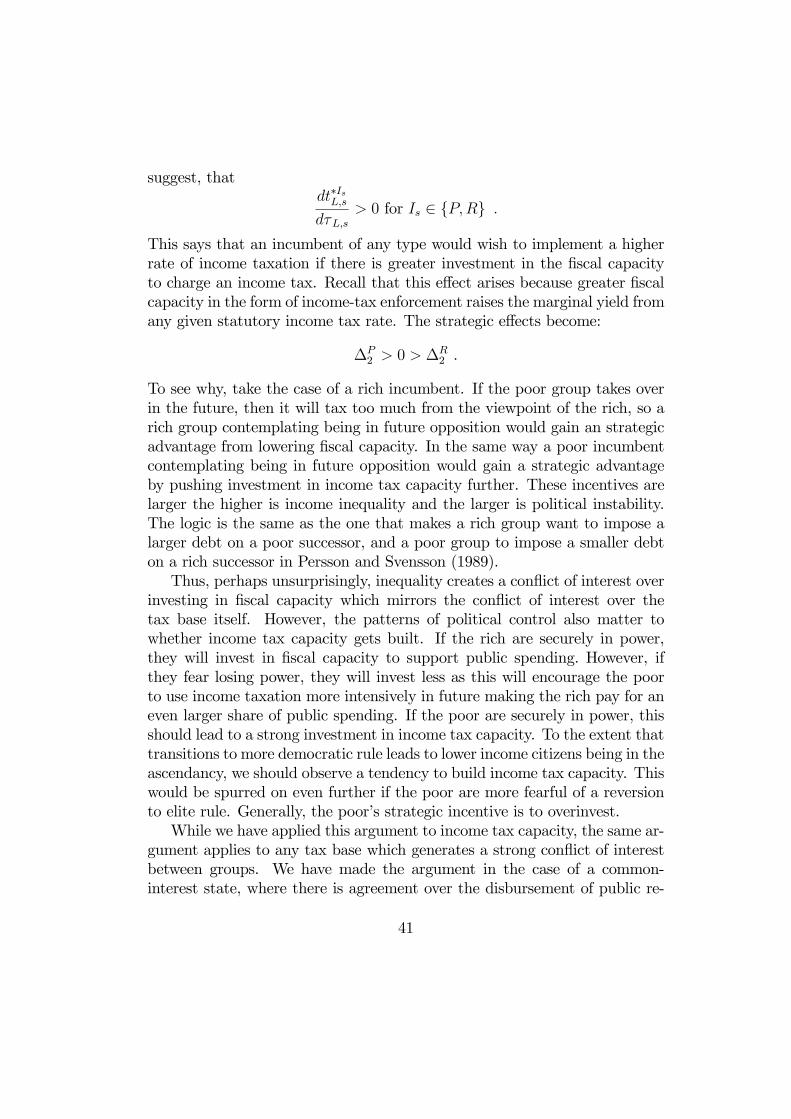
suggest, that∗
0 for ∈ {}
This says that an incumbent of any type would wish to implement a higher
rate of income taxation if there is greater investment in the fiscal capacity
to charge an income tax. Recall that this effect arises because greater fiscal
capacity in the form of income-tax enforcement raises the marginal yield from
any given statutory income tax rate. The strategic effects become:
∆2 0 ∆
2 .
To see why, take the case of a rich incumbent. If the poor group takes over
in the future, then it will tax too much from the viewpoint of the rich, so a
rich group contemplating being in future opposition would gain an strategic
advantage from lowering fiscal capacity. In the same way a poor incumbent
contemplating being in future opposition would gain a strategic advantage
by pushing investment in income tax capacity further. These incentives are
larger the higher is income inequality and the larger is political instability.
The logic is the same as the one that makes a rich group want to impose a
larger debt on a poor successor, and a poor group to impose a smaller debt
on a rich successor in Persson and Svensson (1989).
Thus, perhaps unsurprisingly, inequality creates a conflict of interest over
investing in fiscal capacity which mirrors the conflict of interest over the
tax base itself. However, the patterns of political control also matter to
whether income tax capacity gets built. If the rich are securely in power,
they will invest in fiscal capacity to support public spending. However, if
they fear losing power, they will invest less as this will encourage the poor
to use income taxation more intensively in future making the rich pay for an
even larger share of public spending. If the poor are securely in power, this
should lead to a strong investment in income tax capacity. To the extent that
transitions to more democratic rule leads to lower income citizens being in the
ascendancy, we should observe a tendency to build income tax capacity. This
would be spurred on even further if the poor are more fearful of a reversion
to elite rule. Generally, the poor’s strategic incentive is to overinvest.
While we have applied this argument to income tax capacity, the same ar-
gument applies to any tax base which generates a strong conflict of interest
between groups. We have made the argument in the case of a common-
interest state, where there is agreement over the disbursement of public re-
41
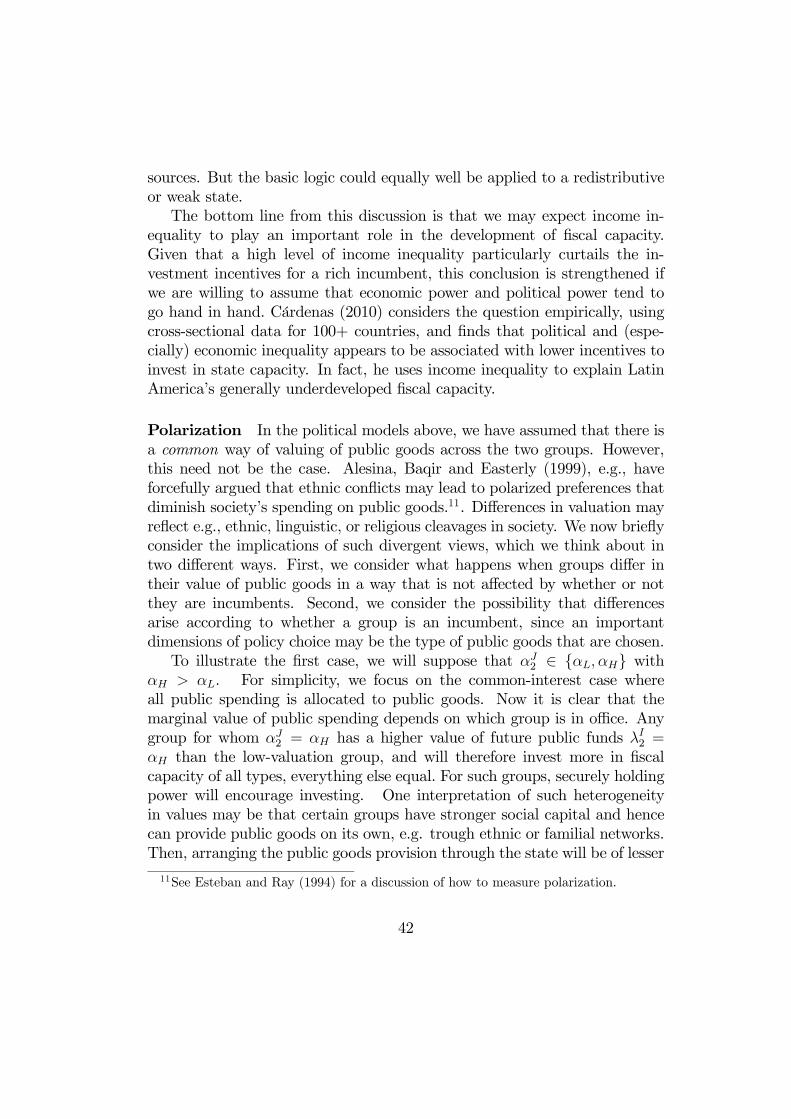
sources. But the basic logic could equally well be applied to a redistributive
or weak state.
The bottom line from this discussion is that we may expect income in-
equality to play an important role in the development of fiscal capacity.
Given that a high level of income inequality particularly curtails the in-
vestment incentives for a rich incumbent, this conclusion is strengthened if
we are willing to assume that economic power and political power tend to
go hand in hand. Cárdenas (2010) considers the question empirically, using
cross-sectional data for 100+ countries, and finds that political and (espe-
cially) economic inequality appears to be associated with lower incentives to
invest in state capacity. In fact, he uses income inequality to explain Latin
America’s generally underdeveloped fiscal capacity.
Polarization In the political models above, we have assumed that there is
a common way of valuing of public goods across the two groups. However,
this need not be the case. Alesina, Baqir and Easterly (1999), e.g., have
forcefully argued that ethnic conflicts may lead to polarized preferences that
diminish society’s spending on public goods.11. Differences in valuation may
reflect e.g., ethnic, linguistic, or religious cleavages in society. We now briefly
consider the implications of such divergent views, which we think about in
two different ways. First, we consider what happens when groups differ in
their value of public goods in a way that is not affected by whether or not
they are incumbents. Second, we consider the possibility that differences
arise according to whether a group is an incumbent, since an important
dimensions of policy choice may be the type of public goods that are chosen.
To illustrate the first case, we will suppose that 2 ∈ { } with
. For simplicity, we focus on the common-interest case where
all public spending is allocated to public goods. Now it is clear that the
marginal value of public spending depends on which group is in office. Any
group for whom 2 = has a higher value of future public funds 2 =
than the low-valuation group, and will therefore invest more in fiscal
capacity of all types, everything else equal. For such groups, securely holding
power will encourage investing. One interpretation of such heterogeneity
in values may be that certain groups have stronger social capital and hence
can provide public goods on its own, e.g. trough ethnic or familial networks.
Then, arranging the public goods provision through the state will be of lesser
11See Esteban and Ray (1994) for a discussion of how to measure polarization.
42

interest. For example, authors such as Esping-Andersen (1999) and, more
recently, Alesina and Giuliano (2010) have argued that countries with strong
family ties invest less in welfare state.
To illustrate the second case, where the decision rights of being in power
affects the mix of public goods when in office, we suppose that 2 =
= 2 .12 In this case, − becomes a natural measure of the po-
larization in preferences. The expected value of future public revenues to an
incumbent becomes
2 = [(1− ) + ]
It follows from the expressions above that more polarization and higher po-
litical instability both reduce the incentive to invest in fiscal capacity of all
types to boost future revenues. As shown in Figure 10, the partial corre-
lation (holding constant the same factor as those discussed under Figure
9) between ethnic heterogeneity and different measures of fiscal capacity is
indeed negative.
4.4 The Value of Public Spending
Our approach gives the value of spending on collectively valuable goods a
central place among the motives to build fiscal capacity. Formally, parameter
affects the value of public revenues in the eyes of group . In this section,
we discuss some factors that go into determining this value. Of course, in
the standard interpretation, these are just fixed preference parameters. But
there are strong reasons to think that they depend on factors which can be
shaped by history as well as policy.
Common-interest spending and war finance As discussed in the in-
troduction, war has played a central role in the history of public finance.
In terms of the model, external threats can be an important determinant
of the structure of preferences {2} . The threat of war may also act like
a common-interest shock that moves a society close to a common-interest
state, or from the status of a weak to a redistributive state (at least during a
period where the threat is felt). In our approach, the mechanism behind this
is to raise the value of public revenues and make it incentive compatible to
12A more involved case would explicitly introduce different types of public goods, with
different groups having a preference bias towards certain types, as in Alesina and Tabellini
(1990).
43
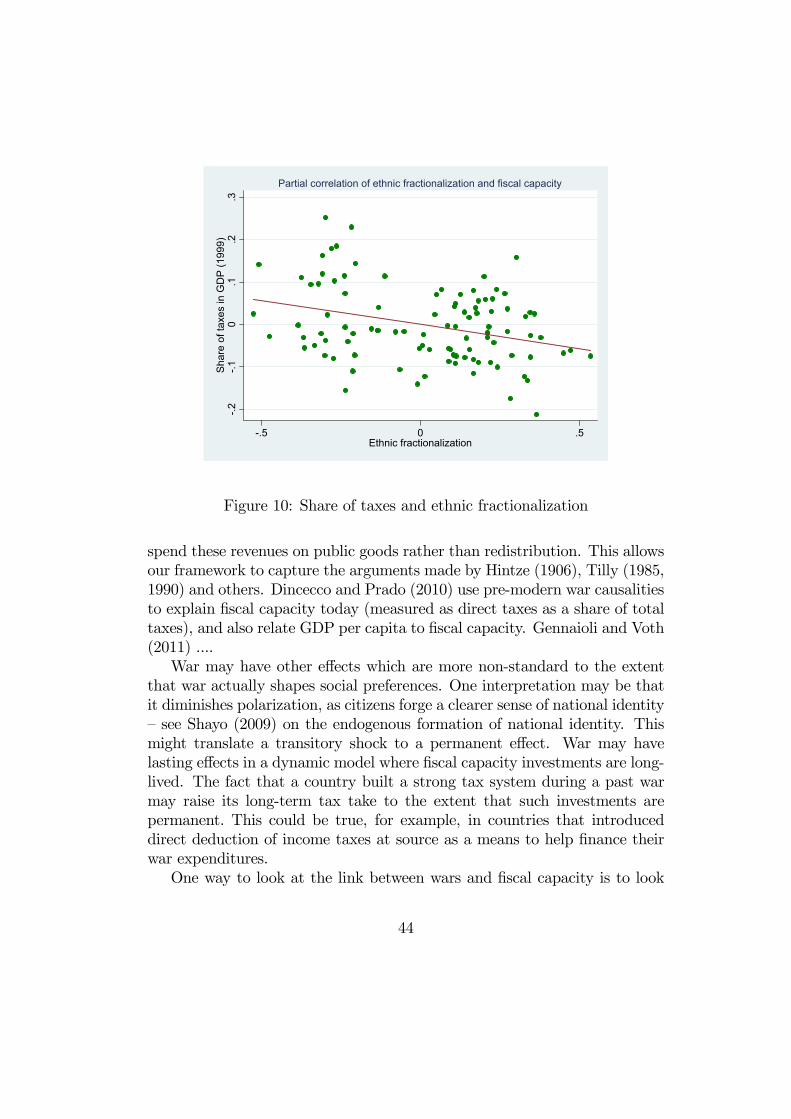
-.2
-.1
0.1
.2.3
Sha
re o
f ta
xes
in G
DP
(19
99)
-.5 0 .5Ethnic fractionalization
Partial correlation of ethnic fractionalization and fiscal capacity
Figure 10: Share of taxes and ethnic fractionalization
spend these revenues on public goods rather than redistribution. This allows
our framework to capture the arguments made by Hintze (1906), Tilly (1985,
1990) and others. Dincecco and Prado (2010) use pre-modern war causalities
to explain fiscal capacity today (measured as direct taxes as a share of total
taxes), and also relate GDP per capita to fiscal capacity. Gennaioli and Voth
(2011) ....
War may have other effects which are more non-standard to the extent
that war actually shapes social preferences. One interpretation may be that
it diminishes polarization, as citizens forge a clearer sense of national identity
— see Shayo (2009) on the endogenous formation of national identity. This
might translate a transitory shock to a permanent effect. War may have
lasting effects in a dynamic model where fiscal capacity investments are long-
lived. The fact that a country built a strong tax system during a past war
may raise its long-term tax take to the extent that such investments are
permanent. This could be true, for example, in countries that introduced
direct deduction of income taxes at source as a means to help finance their
war expenditures.
One way to look at the link between wars and fiscal capacity is to look
44

-.2
-.1
0.1
.2S
hare
of
taxe
s in
GD
P (
1999
)
-.05 0 .05 .1 .15Share of years in external war until 2000
Partial correlation of external war and fiscal capacity
Figure 11: Share of taxes in GDP and external war
at the partial correlation (again holding constant the same factors an in the
regression underlying Figure 9), between the years in external war from the
Correlates of War data base and the share of taxes in GDP. This is done in
Figure 11 which shows that there is an upward sloping relationship.
An important aspect of income tax compliance is direct withholding of
taxes from wage packets. So its introduction is an interesting discrete invest-
ment in income tax capacity. Figure 12, illustrates the introduction of with-
hold over time, comparing countries who participated in the second world war
with non-participants. The significant increase in the proportion of countries
with direct withholding among the war participants is striking when com-
pared to the non-perceptible effect among the non-participants. Although
this is certainly casual empiricism, it is consistent with the arguments in this
section.
Identifying public projects We could also see {2} as reflecting the
ability of governments to identify good projects. An important line of devel-
opment research in recent years has been instrumental in using Randomized
Controlled Trials (RCTs) to identify the value of public interventions. These
45

.2.4
.6.8
1P
ropo
rtio
n of
cou
ntrie
s w
ith t
ax w
ithho
ldin
g
1900 1920 1940 1960 1980 2000Year
War participants Out of War
Figure 12: Introduction of tax withholding and war
can be thought of as trying to find ways of better allocating resources to
public goods by identifying high benefit interventions. (See Duflo et al, 2007
for a discussion of the methodology.)
In our framework, we can represent an RCT as a particular form of ex-
periment to evaluate project effectiveness. To model this, suppose that there
is a continuum of possible public projects indexed by ∈ [0 1] where somehave high returns and other low returns. Preferences for public goods are
now: Z 1
0
() ( ())
where () is spending on projects of type . In the absence of discriminating
information, we assume that the expected return on projects is the same,
such that () = . In this case, spending will be identical on all projects.
For the sake of illustration, let us suppose that utility of public goods is
quadratic, i.e., () = − 122
Suppose now that RCTs have been conducted on a subset of projects,
which we assign to the interval [0 ] to establish which have high and low
returns. For simplicity, suppose all projects are equally likely to be high
46
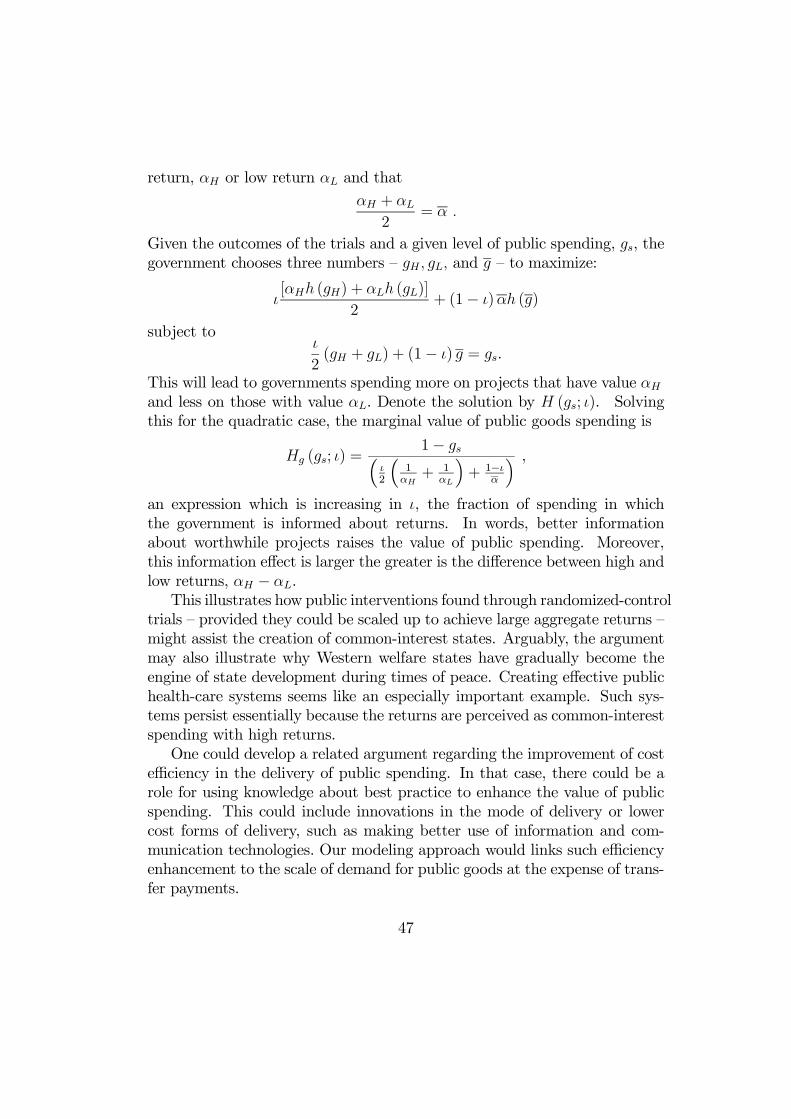
return, or low return and that
+
2=
Given the outcomes of the trials and a given level of public spending, , the
government chooses three numbers — and — to maximize:
[ () + ()]
2+ (1− ) ()
subject to
2( + ) + (1− ) = .
This will lead to governments spending more on projects that have value
and less on those with value . Denote the solution by (; ). Solving
this for the quadratic case, the marginal value of public goods spending is
(; ) =1− ³
2
³1+ 1
´+ 1−
´ ,an expression which is increasing in , the fraction of spending in which
the government is informed about returns. In words, better information
about worthwhile projects raises the value of public spending. Moreover,
this information effect is larger the greater is the difference between high and
low returns, − .
This illustrates how public interventions found through randomized-control
trials — provided they could be scaled up to achieve large aggregate returns —
might assist the creation of common-interest states. Arguably, the argument
may also illustrate why Western welfare states have gradually become the
engine of state development during times of peace. Creating effective public
health-care systems seems like an especially important example. Such sys-
tems persist essentially because the returns are perceived as common-interest
spending with high returns.
One could develop a related argument regarding the improvement of cost
efficiency in the delivery of public spending. In that case, there could be a
role for using knowledge about best practice to enhance the value of public
spending. This could include innovations in the mode of delivery or lower
cost forms of delivery, such as making better use of information and com-
munication technologies. Our modeling approach would links such efficiency
enhancement to the scale of demand for public goods at the expense of trans-
fer payments.
47

Corruption Our model assumes that all resources that are spent on public
projects finds their way into actual spending on public goods. But in many
countries, this is a poor assumption due to high levels of corruption. Many
studies, following the pioneering work by Reinikka and Svensson (2008), have
shown the value of interventions which reduce corruption and increase the
effective flow of spending benefiting the end users.
This argument is especially poignant when fiscal capacity is endogenous.
Suppose then that only a fraction of the intended spending on public goods
actually finds its way into actual spending on the ground. If so, the value of
public goods is
((1− ) )
In terms of accounting, a share of the spending, ends up in the hands
of citizens who earn corruption rents. Indeed, if is a pure transfer, then
corruption is also pure transfer. In practice, corruption in this or other forms
creates constituencies in favor of maintaining the status quo. In terms of our
approach, if the corruption rents flow disproportionately to ruling groups,
this can affect the decisions to build fiscal capacity.
To understand the implications for public finance, we ask how the para-
meter affects incentives to build fiscal capacity. Two broad effects need to
be understood. First, we have an effect on the marginal value of spending on
public goods. This depends on how
(1− ) ((1− ) )
depends on . As long as the elasticity − (1− ) falls short of
unity, greater corruption reduces the marginal value of spending on public
goods.
Second, we have an effect comes from the distribution of the rents from
corruption . If these accrue exclusively to the incumbent group, this
will enhance the value of holding power — in effect, there is a blur between
spending spending on transfers and on public goods since:
= ¡
¢[ (t τ ) + − −] +
With low political turnover this will tend to enhance motives for building
fiscal capacity as in the case of a redistributive state above but this effect will
be weakened by turnover as in the case of the redistributive state. Moreover,
even as → 1, a redistributive motive for building fiscal capacity remains
48

due to extra-budget transfers accruing to incumbents through corruption.
To the extent that corruption rents are widely held, i.e. are not distributed
towards incumbent status, these motives will be weakened.
In summary, the first effect via the marginal value of public goods likely
cuts the value of public funds and thus reduces the motives for investing in
fiscal capacity. The second effect, via corruption rents, may go the other
way at least when incumbents groups capture a large share of the rents from
corruption. .
Summary The discussion in this section ties together the taxation and
spending side of the state. A requirement for building a state run on common-
interest grounds is that public revenues are spent on goods that are valued
by a wide group of citizens. In history, war has arguably been an important
source of such common interests and provides a key motive for creating fiscal
capacity. Our framework suggests that states which lack common interests
will have fiscally weak states, all else equal. One way to foster such interests
might be to improve project evaluation and to identify which public inter-
ventions work in practice. This may not only improve the use for a given
budget, but it can also foster endogenous increases in fiscal capacity. As
we have seen, combatting corruption in public spending is also linked to the
motives for building an effective tax system.
4.5 Non-Tax Revenues
Our model framework allows for the possibility that states have non-tax rev-
enue, called in the form of aid or natural resources. These incentives are
made plain in the first-order conditions for fiscal capacity (8). The condi-
tions show that non-tax income matters for investments in the state through
changing the marginal value of tax revenue, as represented by 1 and 2.
Aid and development finance Anticipated period 2 aid, embodied in 2reduce the incentive to invest, whenever marginal spending is allocated to
public goods. However, current non-tax income, 1 reduces costs of investing
in the short term, when marginal spending is on public goods, thus boosting
the incentives to invest. When the transfer motive for investing in the state
is dominant, we would expect aid and resources to go into transfers leading
to no effect on incentives to build indigenous fiscal capacity. This observation
49

-.2
-.1
0.1
.2S
hare
of
taxe
s in
GD
P (
1999
)
-.1 0 .1 .2 .3Average aid share of GNI 1962-2006
Partial correlation of aid and fiscal capacity
Figure 13: Share of taxes in GDP and aid
shows why political institutions may matter, as we have already discussed,
since these govern the likelihood that the common-interest, rather than the
redistributive, motive is dominant.
This discussion justifies the standard focus of development finance on
lending to government rather than handing out cash grants. The former
promotes the incentives to build an effective tax system. When public goods
are valuable, a period-1 grant or loan should increase investment in fiscal
capacity. And forcing repayment of the loan, thereby increasing 2 further
reinforces the investment effect. But the incentives would be reversed in a
Samaritan’s dilemma, where a period-1 failure to invest in fiscal capacity
elicits more aid to be paid in period 2. This dilemma seems relevant for some
aid-dependent countries, where part of the gain from building indigenous
fiscal capacity would be taxed away in the form of lower aid.
Figure 13 looks at the relationship between fiscal capacity, measured by
the total tax take, and aid receipts as a share of gross national income. The
graph shows that the partial correlation is negative, in line with what we
would expect from the framework presented here.
50
Resource revenues The model also gives insights into why natural re-
source discoveries can stifle the efforts to build fiscal capacity. A government
that discovers oil in period 1 with anticipated revenues in period 2 will reduce
their investment in fiscal capacity. Of course, such resource revenues may be
beneficial but may necessitate a catch-up period of fiscal capacity building
and leave country vulnerable to negative commodity-price shocks.
Some data supports the proposition that fiscal capacity building is related
to resource dependence. Jensen (2011) presents econometric evidence, using
panel data with country-specific price indexes constructed for natural gas and
oil and weighted by respective shares in total national energy production. He
finds that a 1 percent increase in the share of natural resource rents in total
government income is associated with a 1.4 percent decrease in the fiscal
capacity of a country.
Informal taxation The previous section discussed the role of corruption
on the spending side of the state and touched upon the revenues generated by
corruption. But corruption may also work as a direct non-tax revenue-raising
device for governments or government bureaucrats. Like explicit taxation,
such informal taxation through corruption imposes static and dynamic dis-
tortions on the business of the private sector. Here, we briefly bring such
considerations into the approach.
Suppose that there are now two kinds of taxation on activity in period
, the formal tax rate studied above and informal taxation at rate .
Unlike formal taxation, we suppose that returns to corruption accrue directly
as transfers to the ruling group, rather than being funneled through the
public budget and subject to any checks and balances in place to constrain
government spending. Moreover, we suppose that the governing group has
some "informal fiscal capacity" and that non-compliance with corruption
is impossible. This may be extreme, but will serve us well to make a few
important points. It is clear that we could extend the treatment and make
informal and formal fiscal capacity more alike.
The individual budget constraint is now:
0+
X=1
(1 + + ) ≤
(1− − )+
+
X=1
[ − ( )]
51

and the earnings from informal taxation are
(T) =
X=1
+
JX=1
The existence of such informal taxation affects optimal formal tax rates as
there are both formal and informal tax rates on each base.
An increase in has a static effect in that it cuts available formal tax
revenue by reducing goods demand or labor supply. So there is a negative
externality for formal taxation. If the motive for informal taxation is purely
redistributive, as here, it should also reduce resources available to spend on
public goods. There are no checks and balances on raising such revenues
except any informal controls that may exist within a group. Incentives for
informal taxation are particularly high when the revenues accrue to a small
subset, an “elite”, within the ruling group. In addition to this static effect,
however, informal taxation through corruption can also have a dynamic ef-
fects. Specifically, it may undermine the incentives to invest in the formal
tax base, since the latter shrinks in response to informal taxation. The lower
tax base therefore diminishes investments in fiscal capacity, as did a lower
level of development in Section 4.1.
Unlike corruption on the spending side, we would thus expect higher
corruption on the revenues side to be associated with less tax collection,
everything else equal. This is confirmed in Figure 14, which plots the partial
correlation between fiscal capacity (measured by total tax take) and cor-
ruption, measured by a perceptions index from Transparency International.
Countries with a higher share of taxes in GDP are also the least corrupt.
4.6 Compliance
So far, we have basically left the technology for evading taxes and for in-
creasing compliance as a black box. In this section, we will glean a little on
the door of this black box and indicate how one may enrich the analysis. We
will begin with a simple model of the forces that may shape the costs of non-
compliance, and then extend it in a few ways to motivate policy interventions
to increase compliance.
A simple micro-foundation for the costs of non-compliance The
simplest micro-foundation for the evasion cost function ( ) which plays
52

-.2
-.1
0.1
.2S
hare
of
taxe
s in
GD
P (
1999
)
-1 0 1 2 3Corruption Perception Index 2006
Partial correlation of corruption and fiscal capacity
Figure 14: Share of taxes in GDP and corruption
a crucial role for tax compliance, is a variant of the classic analysis of de-
tection and punishment. Let () be a non-pecuniary punishment for non-
compliance with the tax code, increasing and convex in the amount of evasion
and let () be the probability of detection, increasing in .13 Then
( ) = () () .
This is the classic Allingham and Sandmo (1972) model of evasion, except
that we have supposed that punishments are non-pecuniary. To the extent
that () is pecuniary, it adds directly to tax revenue and would have to be
added to the government budget constraint. However, this would be a fairly
minor difference with little effect on the main insights and we therefore stick
with the non-pecuniary punishment case.
The other important part of the compliance technology is () — fac-
tors shaping the probability to be caught and face a sanction. A raft of
measures based on technological improvements in record keeping and com-
petence among tax authorities belong in here. It is questionable whether
13It would be straightforward to allow () depends on so larger transgressions are
more likely to be detected.
53

low-income countries generally use best practice procedures, so there might
be scope for technology transfer. (Cite some examples).
The function () also depends on the production structure, as we dis-
cussed in Section 4.1, with some kinds of economic activities intrinsically
easier to monitor than others depending the degree of formality, the need for
transparent record keeping, and the use of the formal financial system.
Social norms and tax morale The model can be used to crudely consider
the role of social norms in affecting tax compliance. Suppose that shame or
stigma from noncompliance in a particular tax base depends on the average
amount of non-compliance in the population as a whole, which we denote by
. Thus
( ; ) = () (; ) ,
with (; ) 0 i.e., an increasing amount of non-compliance in the popula-
tion as a whole lowers the stigma/shame from cheating. In this simple case,
the evasion decisions, corresponding to (1) in Section 3 will form a Nash
equilibrium where:
= ()¡∗;
∗
¢for = 1 if 0
With 0, we get the possibility of multiple Pareto-ranked tax-evasion
equilibria, since the reaction functions for evasion slope upwards.
This opens the door for tax culture to affect compliance. Countries with
a strong culture of compliance may find it much cheaper to achieve a similar
level of fiscal capacity compared to one where the norm is unfavorable. Such
issues have been discussed by political scientists, e.g., Torgler (2007), Levi
(1998) and Rothstein (2000).
Obviously, the simple model considered here could be modified in different
directions. For instance, there could be spillover effects between different tax
bases, so that common cheating on some tax base spreads by contagion and
erodes compliance with other taxes. Also, the relevant reference group for the
social norm espoused by some particular individual may be more local the
entire set of tax payers. Local reference groups of this sort might help explain
local pockets with widespread tax evasion, like the favelas at the outskirts
of large Brazilian cities in which whole communities function largely outside
the formal sector.
If tax morale is important, then interventions that increase the stigma
from non-compliance may be an important form of intervention to improve
54

compliance. It may even make sense to increase the visibility of compliers
and to associate compliance with social approval (Chetty (2009) and Chetty,
et al (2009)). But the real and fundamental question her — about which we
know very little, theoretically or empirically — is how legal and administrative
interventions interact with social norms — see, however, Benabou and Tirole
(2011) for a recent and very interesting analysis.
Our discussion here has been speculative and sketchy. But the issue
of tax morale is certainly important and it is plausible that different tax
cultures in, say, Sweden and Greece contributes to the large differences in
their tax take. The idea of tax morale also goes to the heart of debates
about state legitimacy, a concept we have not dealt with at all. However,
the interactions between social norms of compliance, state legitimacy, fiscal
capacity, and institutions is an interesting and important topic for further
research.
Incentives for tax inspectors In many countries, a major problem in
collecting tax revenues is the weak motives for tax inspectors. These could
reflect either low incentives to detect tax evasion or a willingness to take
bribes from non-compliers if caught. Our simple model allows us to think
about both issues.
Suppose that detection of evasion requires that inspectors put in effort
Such effort increases the chances of being catching an evader, but is privately
costly to the tax inspector. Denote the probability that an evader is caught
by ( ) with ( ) 0. For any given tax base and level of fiscal
capacity, let equilibrium evasion be
∗ ( ;) = argmax{− ( ) ()} .
It is easy to see that ∗ ( ;) is decreasing in . Let ( ) now be the
private profit per capita from non-compliance when tax inspectors put in
effort .
An important question, on which much tax administration has tripped up,
is what motivates inspectors to put in such costly monitoring. A traditional
view is that this is taken care by some kind of pro-social motivation, i.e.,
inspectors are intrinsically honest. But as governments have learned to their
cost, this cannot be taken for granted.
Assuming that inspectors have to be compensated for their disutility of
labor in a competitive labor market, the socially optimal level of tax revenue
55
raising effort is:
∗ ( ) = argmax{ ( ) + [
∗ ( ;)− ]} (22)
where , as above is the marginal value of public revenues. The maximand
includes two terms — the private non-compliance profits and the value of tax
revenues net of the cost of effort. Higher effort will reduce the first term
and increase the second term and the balance between the two will define
the optimum.
The main question is how the government can implement such an optimal
effort level. If is not observed, there is a potential moral-hazard problem for
inspectors — see Mookherjee and Png (1995) and Besley and McLaren (1993)
for studies along these lines. If the tax inspector were offered a fixed wage
and is not strongly intrinsically motivated, he would set = 0. In this case,
there would no point in employing inspectors at all. In this framework, we
can think of changes in fiscal capacity as corresponding to alternative ways
of organizing the tax-collection service to avoid this outcome.
One regime would be to focus on recruiting tax inspectors who set =
∗ ( ) by establishing some kind of rigorous recruiting and trainingregime. Such merit-based professionalization of the bureaucracy is certainly
a feature of fiscal history.
Another possibility would be to contemplate tax farming, a popular solu-
tion in historic times where tax inspectors are sold a franchise to collect taxes
on a particular tax base, in exchange for becoming a residual claimants. In
this case, we would expect:
( ) = argmax {∗ ( ;)− }
Comparing this to the expression in (22), we see that tax farming would
never be optimal in our framework, for reasons that make sense given the
history of tax farming. Specifically, tax farming would vest too much effort
in extracting taxes, as tax farmers would fail to internalize the utility costs
they impose on the public. In practice, tax farmers would have tended to use
sometime brutal methods of collecting taxes, ignoring most of the costs to
the populations from whom they are collecting.
Another option would be to pay tax inspectors efficiency wages, as dis-
cussed in Besley and McLaren (1993). To see how this might work, assume
inspectors are themselves subject to inspection in a hierarchical structure.
56
Suppose that inspectors are asked to put in effort and that the probabil-
ity a tax inspector is monitored and caught is (). Finally, assume that if
inspectors are caught, they are fired without being paid. Now, an inspector
will put in effort at a wage of if:
− ≥ (1− ())
Solving this inequality, says that the wage needed to elicit effort is an
increasing function :
=
() .
Compared to a benchmark model with observable and contractible effort, get-
ting effort is more expensive so for any () 1, the level of non-compliance
will be higher. However, compared to a world which relies entirely on public
spiritedness, or a world where = 0, this could be a worthwhile proposition.
Corrupt tax inspectors Now consider how the possibility of corruption
affects these arguments. Suppose for the moment that the level of effort put
into detection is fixed. After detection, however, a bribe of can be paid
by an evader to the inspector, which exempts the evader from suffering the
punishment (). Assume that the inspector and the evader engage in Nash
bargaining so that the bribe paid is:
∗ = argmax { (− + ())} = + ()
2.
In this case, higher penalties for non-compliance are partly transferred to tax
inspectors, since they give the ability to tax inspectors to extort money from
non-complying tax payers.
Somewhat paradoxically, bribery can motivate inspectors to put in greater
detection effort since their payoff is:
( )
∙+ ()
2
¸−
Moreover this effort is sensitive to tax rates with greater taxes actually mo-
tivating tax inspectors to put in greater effort. This suggests the possibility
that efforts to reduce bribery in a world where there is great deal of unob-
served effort need not necessarily increase tax compliance. This is not to
say that bribery should be condoned but that this is a second best world
57

where we need to consider the full set of incentives. Note also that if some
component of fiscal capacity is independent of the incentive scheme for the
inspectors’ own efforts (such as income tax withholding), then higher inde-
pendent capacity raises equilibrium effort by complementing the inspector’s
own efforts.
Exploiting local information How far should local information be har-
nessed in improving tax compliance? Focusing on the formal inspection
process underestimates the scope for schemes, which fall under the heading
of “cross reporting”. This has become very important in the development
literature on peer monitoring in micro-finance but has received less attention
in the taxation literature.
The main idea exploits something which is well known in mechanism
design theory is that once more than one person is informed about something
then a variety of means can be used to illicit that information (see Maskin
(1999) andMoore and Repullo (1988), among others). In the case of taxation,
the obvious counterpart to this is when there are two parties to a transaction.
The following canonical model illustrates the idea. Suppose that evasion
activity is observed by two parties — whom we can call a purchaser (denoted
by a subscript ) and a vendor (denoted by a subscript ). Suppose that the
vendor is asked first to declare and then the purchaser either agrees or
disagrees. If there is disagreement, the government audits the transaction
and the honest party is given a small reward and the dishonest party has to
pay ().
In the unique sub-game perfect equilibrium of this game, there is full com-
pliance as long as () In other words, it is as if there is complete and
costless auditing of transactions — the gamble in the traditional Allingham
and Sandmo (1972) model goes away. This simple “mechanism” is simple
illustration of the potential power of cross-reporting. However, it only works
under two key assumptions. First, that there is no scope for collusion between
the vendor and purchaser. Second, both parties to a given transaction can be
observed. The latter is true when there are formal contracts of employment
or purchase, where a receipt or record of the transaction is kept.
The evidence on informal taxation in Olken and Singhal (2011) suggest
that traditional societies have evolved ways of mutually raising revenues us-
ing local information and enforcement. In modern economies, firms have
taken on this role as argued by Kleven, Kreiner and Saez (2009). The ev-
58

idence from a clever field experiment in cooperation with the Chilean tax
administration reported in Pomeranz (2011), suggests that cross-reporting
in the value-added chain indeed helps enforce payments of the value added
tax.
5 Conclusion
A key question in public finance and development is to understand how a
state moves from collecting a low level of public revenue of around 10% of
national income towards collecting around 40%. In the process, tax bases
are typically shifting from trade taxes and excises towards labor income and
other broad bases, such as value added.
To study this process is fundamentally a challenge of appreciating incen-
tives and constraints. Incentives are shaped by political institutions, existing
power structures, and societal demands that the state perform certain func-
tions. Constraints are imposed by a society’s economic environment, social
cleavages, and political interests. Over time, these constraints can be shifted
and governments play a key role for such shifts. Governments might invest
to improve the working of the economy and the efficiency of public goods
provision. They may also try to create a sense of national identity and
propose reforms to political institutions. Analyzing such issues requires a
dynamic framework and our chapter has sketched one. We believe that the
factors highlighted in this framework provide substance to Schumpeter’s in-
sights about the centrality of taxation to understanding state development,
namely:
“The fiscal history of a people is above all an essential part
of its general history. An enormous influence on the fate of na-
tions emanates from the economic bleeding which the needs of
the state necessitates, and from the use to which the results are
put.” (Joseph Schumpeter, The Crisis of the Tax State, 1918)
If developing states are to be able to support their citizens at a level now
taken for granted by citizens in developed countries, this requires a series of
investments, making the state more effective and responsive. Uncovering the
preconditions for such investments to take place is a central task for research
on public finance and development.
59

References
[1] Acemoglu, Daron [2003], "Why Not a Political Coase Theorem: So-
cial Conflict, Commitment, and Politics", Journal of Comparative Eco-
nomics, vol. 31, 620-652.
[2] Acemoglu, Daron [2005], "Politics and Economics in Weak and Strong
States", Journal of Monetary Economics, vol. 52, 1199-1226.
[3] Acemoglu, Daron [2006], "Modeling Inefficient Institutions", in Blun-
dell, Richard, Whitney Newey and Torsten Persson (eds.), Advances in
Economic Theory and Econometrics: Proceedings of the Nineth World
Congress of the Econometric Society, Cambridge UK: Cambridge Uni-
versity Press.
[4] Acemoglu, Daron, Mikhail Golosov and Aleh Tsyvinski [2008], "Polit-
ical Economy of Mechanisms", Econometrica, vol. 76, 619-641.
[5] Acemoglu, Daron, Mikhail Golosov and Aleh Tsyvinski [2009], "Power
Fluctuations and Political Economy", NBER Working Paper 15400.
[6] Acemoglu, Daron and Simon Johnson [2005], "Unbundling Institu-
tions", Journal of Political Economy, vol. 113, 949-995.
[7] Acemoglu, Daron, Simon Johnson and James A. Robinson [2001], "The
Colonial Origins of Comparative Development: An Empirical Investi-
gation", American Economic Review, vol. 91, 1369-1401.
[8] Aghion, Philippe, Alberto Alesina and Francesco Trebbi [2004], "En-
dogenous Political Institutions", Quarterly Journal of Economics, vol
119, 565-612.
[9] Aidt, Toke S. and Peter S. Jensen [2009a], "The Taxman Tools Up: An
Event History Study of the Introduction of the Personal Income Tax",
Journal of Public Economics, vol. 93, 160-175.
[10] Aidt, Toke and Peter S. Jensen [2009b], "Tax Structure, Size of Gov-
ernment, and the Extension of the Voting Franchise inWestern Europe,
1860-1938", International Tax Public Finance, vol. 16, 362-394.
60
[11] Aizenman, Joshua and Yothin Jinjarak [2008], "The Collection Effi-
ciency of the Value Added Tax: Theory and International Evidence",
Journal of International Trade and Economic Development, vol. 17,
391-410.
[12] Alesina, Alberto, Reza Baqir and William Easterly [1999], "Public
Goods and Ethnic Divisions", Quarterly Journal of Economics, vol.
114, 1243-1284.
[13] Alesina, Alberto and David Dollar [2000], "Who Gives Foreign Aid to
Whom and Why?", Journal of Economic Growth, vol. 5, 33-63.
[14] Alesina, Alberto and Paola Guiliano [2010], "The Power of the Family",
Journal of Economic Growth, vol. 15, 93-125.
[15] Alesina, Alberto and Guido Tabellini [1990], "A Positive Theory of
Fiscal Deficits and Government Debt", Review of Economic Studies,
vol. 57, 403-414.
[16] Allingham, Michael G. and Agnar Sandmo [1972], "Income Tax Eva-
sion: A Theoretical Analysis", Journal of Public Economics, vol. 1,
323-338.
[17] Banerjee, Abhijit and Esther Duflo [2009], "The Experimental Ap-
proach to Development Economics", NBER Working Paper No. 14467.
[18] Baunsgaard, Thomas andMichael Keen [2005], "Tax Revenue and (or?)
Trade Liberalization", mimeo, IMF.
[19] Benabou, Roland and Jean Tirole [2011], "Laws and Norms", NBER
Working Paper No. 17579.
[20] Berry, Francis Stokes and William D. Berry [1992], "Tax Innovation in
the States: Capitalizing on Political Opportunity", American Journal
of Political Science, vol. 36, 715-742.
[21] Besley, Timothy and Stephen Coate [1997], "An Economic Model of
Representative Democracy", Quarterly Journal of Economics, vol 112,
85-114.
61

[22] Besley, Timothy, Ethan Ilzetzki and Torsten Persson [2010], "Weak
States, Strong States and Steady States: The Dynamics of Fiscal Ca-
pacity", mimeo, LSE.
[23] Besley and McLaren [1993], "Taxes and Bribery: The Role of Wage
Incentives", Economic Journal, vol. 103, 119-141.
[24] Besley, Timothy and Torsten Persson [2008], "Wars and State Capac-
ity", Journal of the European Economic Association, vol. 6, 522-530.
[25] Besley, Timothy and Torsten Persson [2009a], "Repression or Civil
War?", American Economic Review, Papers and Proceedings, vol 99,
292-297.
[26] Besley, Timothy and Torsten Persson [2009b], "The Origins of State
Capacity: Property Rights, Taxation and Politics", American Eco-
nomic Review, vol. 99, 1218-1244.
[27] Besley, Timothy and Torsten Persson [2010a], "State Capacity, Conflict
and Development", Econometrica, vol. 78, 1-34.
[28] Besley, Timothy and Torsten Persson [2010b], "From Trade Taxes to
Income Taxes: Theory and Evidence on Economic Development and
State Capacity", mimeo, LSE.
[29] Besley, Timothy and Torsten Persson [2011a], "Fragile States and De-
velopment Policy", Journal of the European Economic Association, vol.
9, 371-398.
[30] Besley, Timothy and Torsten Persson [2011b], "The Logic of Political
Violence", Quarterly Journal of Economics, vol. 126, 1411-1445.
[31] Besley, Timothy and Torsten Persson [2011c], Pillars of Prosperity:
The Political Economics of Development Clusters, Princeton: Prince-
ton University Press.
[32] Bird, Richard, [2004], “Administrative Dimensions of Tax Reform,”
Asia-Pacific Tax Bulletin, vol .10, 134-50.
[33] Bird, Richard and Oliver Oldman (eds.) [1980], Readings on Taxation
in Developing Countries, 3rd Edition, Baltimore: Johns Hopkins Uni-
versity Press.
62

[34] Bonney, Richard (ed.) [1999], The Rise of the Fiscal State in Europe
c1200-1815, Oxford: Oxford University Press.
[35] Boone, Peter [1996], "Politics and the Effectiveness of Foreign Aid",
European Economic Review, vol. 40, 289-329.
[36] Brennan, Geoffrey and James M. Buchanan [1985], The Reason of
Rules: Constitutional Political Economy, Cambridge: Cambridge Uni-
versity Press.
[37] Brewer, John [1989], The Sinews of Power: War, Money and the Eng-
lish State, 1688-1783, New York: Knopf.
[38] Bräutigam, Deborah, Odd-Helge Fjeldstad and Mick Moore [2008],
Taxation and State-Building in Developing Countries, Cambridge:
Cambridge University Press.
[39] Buchanan, James M. [1967], Public Finance in Democratic Process:
Fiscal Institutions and Individual Choice, Chapel Hill: University of
North Carolina Press.
[40] Buchanan, James M. [1987], "The Constitution of Economic Policy",
Nobel Prize Lecture, American Economic Review, vol. 77, 243-250.
[41] Buchanan, James M. and Gordon Tullock [1962], The Calculus of Con-
sent, Ann Arbor: University of Michigan Press.
[42] Burgess, Robin and Nicholas Stern [1993], "Taxation and Develop-
ment", Journal of Economic Literature, vol. 31, 762-830.
[43] Cárdenas, Mauricio [2010], "State Capacity in Latin America",
Economía, vol. 10, 1-45.
[44] Cárdenas, Mauricio and Didem Tuzemen [2010], "Under-Investment
in State Capacity: The Role of Inequality and Political Instability",
mimeo, The Brookings Institution.
[45] Centeno, Miguel A [1997], "Blood and Debt: War and Taxation in
Latin America", American Journal of Sociology, vol. 102, 1565-1605.
[46] Chetty, Raj [2009], "The Simple Economics of Salience and Taxation",
NBER Working Paper 15246.
63

[47] Chetty, Raj, Adam Looney and Kory Kroft [2009], "Salience and Tax-
ation: Theory and Evidence", American Economic Review, vol. 99,
1145-1177.
[48] Cukierman, Alex, Sebastian Edwards and Guido Tabellini [1992],
"Seignorage and Political Instability", American Economic Review, vol.
82, 537-555.
[49] Diamond, Peter and James Mirrlees [1971], "Optimal Taxation and
Public Production: I Production Efficiency", American Economic Re-
view, vol. 61, 8-27.
[50] Dincecco, Mark [2011], Political Transformations and Public Finances:
Europe, 1650-1913, Cambridge: Cambridge University Press.
[51] Dincecco, Mark and José Mauricio Prado Jr. [2010], "Warfare, Fis-
cal Capacity, and Performance", mimeo, IMT Lucca Institute for Ad-
vanced Studies.
[52] Doing Business 2007: How to Reform, [2006], World Bank, Washington
DC: The World Bank Group.
[53] Duflo, Esther, Rachel Glennerster and Michael Kremer [2007],"Us-
ing Randomization in Development Economics Research: A Toolkit",
Chapter 61 in T. P. Schultz and A. S. John (eds), Handbook of Devel-
opment Economics Volume 4, Amsterdam: Elsevier.
[54] Engerman, Stanley L. and Kenneth L. Sokoloff [2002], "Factor En-
dowments, Inequality, and Paths of Development among New World
Economies", Economia, vol. 3, 41-88.
[55] Esping-Andersen, Gösta [1999], Social Foundation of Post-Industrial
Economies, Oxford: Oxford University Press.
[56] Fearon, James [2003], "Ethnic and Cultural Diversity by Country",
Journal of Economic Growth, vol. 8, 195-222.
[57] Feldstein, Martin [1995], "Behavioral Responses to Tax Rates: Evi-
dence from the Tax Reform Act of 1986", American Economic Review,
vol. 85, 170-174.
64

[58] Feldstein, Martin [1999], "Tax Avoidance and the Deadweight Loss of
the Income Tax", The Review of Economics and Statistics, vol. 81,
674-680.
[59] Gennaioli, Nicola and Hans-Joachim Voth [2011], "State Capacity and
Military Conflict", Working Paper, UPF.
[60] Gordon, Roger (ed.) [2010], Taxation in Developing Countries: Six
Case Studies and Policy Implications, New York: Columbia University
Press.
[61] Gordon, Roger and Young Lee [2005], "Tax Structure and Economic
Growth", Journal of Public Economics, vol. 89, 1027—1043.
[62] Gordon, Roger andWei Li [2009], "Tax Structures in Developing Coun-
tries: Many Puzzles and a Possible Explanation", Journal of Public
Economics, vol. 93, 855-866
[63] Herbst, Jeffrey I. [2000], States and Power in Africa: Comparative
Lessons in Authority and Control, Princeton, NJ: Princeton University
Press.
[64] Heston, Alan, Robert Summers and Bettina Aten [2009], Penn World
Table Version 6.3, Center for International Comparisons of Production,
Income and Prices at the University of Pennsylvania.
[65] Hintze, Otto [1906], "Military Organization and the Organization of the
State", reprinted in Gilbert, Felix (ed.) [1970], The Historical Essays
of Otto Hintze, New York: Oxford University Press.
[66] Hinrichs, Harley H. [1966], A General Theory of Tax Structure Change
During Economic Development, Cambridge, MA: The Law School of
Harvard University.
[67] Hoffman, Philip and Jean-Laurent Rosenthal [1997], "Political Econ-
omy of Warfare and Taxation in Early Modern Europe: Historical
Lessons for Economic Development", in Drobak, John and John Nye
(eds.), The Frontiers of the New Institutional Economics, San Diego:
Academic Press.
65

[68] International Country Risk Guide, c° The PRS Group, Inc., East Syra-
cuse, NY, 1980-present.
[69] Jensen, Anders [2011], "State-Building in Resource-Rich Economies",
Atlantic Journal of Economics, vol. 39, 171-193.
[70] Kaldor, Nicholas [1963], "Taxation for Economic Development", Jour-
nal of Modern African Studies, vol. 1, 7-23.
[71] Keen, Michael [2010], "Taxation and Development Again", mimeo,
IMF.
[72] Keen, Michael and Ben Lockwood [2010], "The Value Added Tax: Its
Causes and Consequences", Journal of Development Economics, vol.
92, 138-151.
[73] Kenny, Lawrence and Stanley Winer [2006], "Tax Systems in the
World: An Empirical Investigation into the Importance of Tax Bases,
Administrative Costs, Scale and Political Regime", International Tax
and Public Finance, vol. 13, 181-215.
[74] Kleven, Henrik and Mazhar Waseem, [2011], "Tax Notches in Pakistan:
Tax Evasion, Real Responses, and Income Shifting", working paper,
LSE.
[75] Kleven, Henrik, Claus Thustrup Kreiner and Emmanuel Saez [2009],
"Why Can Modern Governments Tax So Much? An Agency Model of
Firms as Fiscal Intermediaries", NBER Working Paper 15218.
[76] Levi, Margaret [1988], "Of Rule and Revenue", Berkeley: University
of California Press.
[77] Levi, Margaret [1998], "A State of Trust", in Braithwaite, Valerie and
Margaret Levi (eds.), Trust & Governance, New York: Russell Sage
Foundation.
[78] Madisson, Angus [2001], The World Economy: A Millennial Perspec-
tive, Paris: Organisation for Economic Co-operation and Development.
66

[79] Marshall, Monty G. and Keith Jaggers [2010], "Polity IV Project:
Political Regime Characteristics and Transitions, 1800-2010", Ver-
sion p4v2010 [Computer File]. College Park, MD: Center for Systemic
Peace.
[80] Maskin, Eric [1999], "Nash Equilibrium and Welfare Optimality", Re-
view of Economic Studies, vol. 66, 23-38.
[81] Meltzer, Alan and Scott Richards [1981], "A Rational Theory of the
Size of Government", Journal of Political Economy, vol. 89, 914-927.
[82] Mitchell, Brian R. [2007a], International Historical Statistics: Africa,
Asia and Oceania 1750-2005, Palgrave Macmillan.
[83] Mitchell, Brian R. [2007b], International Historical Statistics: The
Americas, 1750-2005, Palgrave Macmillan.
[84] Mitchell, Brian R. [2007c], International Historical Statistics: Europe,
1750-2005, Palgrave Macmillan.
[85] Migdal, Joel S. [1988], Strong Societies and Weak States: State-Society
Relations and State Capabilities in the Third World, Princeton NJ:
Princeton University Press.
[86] Mookherjee, Dilip, and Ivan Png, [1995], “Corruptible Law Enforcers:
How Should They Be Compensated?” Economic Journal, vol. 105, 145-
159.
[87] Moore, Barrington, [1966], Social Origins of Dictatorship and Democ-
racy, Boston: Beacon Press.
[88] Moore, John and Rafael Repullo [1988], "Subgame Perfect Implemen-
tation", Econometrica, vol. 56, 1191-1220.
[89] Moore, Mick [2004], "Revenues, State Formation and the Quality of
Governance in Developing Countries", International Political Science
Review, vol 25, 297-319.
[90] Newbery, David and Nicholas Stern (eds.) [1987], The Theory of Tax-
ation for Developing Countries, Oxford: Oxford University Press for
the World Bank.
67
[91] North, Douglass C. [1990], Institutions, Institutional Change and Eco-
nomic Performance, Cambridge: Cambridge University Press.
[92] O’Brien, Patrick [2001], "Fiscal Exceptionalism: Great
Britain and its European Rivals From Civil War to Tri-
umph at Trafalgar and Waterloo", mimeo, available at
http://www2.lse.ac.uk/economicHistory/pdf/WP6501.pdf
[93] O’Brien, Patrick [2005], "Fiscal and Financial Preconditions for the
Rise of British Naval Hegemony: 1485-1815", mimeo, London School
of Economics.
[94] Olken, Benjamin A. and Monica Singhal [2011], "Informal Taxation",
American Economic Journal: Applied Economics, vol. 3, 1—28.
[95] Osborne, Martin J. and Al Slivinsky [1996], "AModel of Political Com-
petition with Citizen-candidates", Quarterly Journal of Economics,
vol. 111, 65-96.
[96] Persson, Torsten and Lars E.O. Svensson [1989], "Why a Stubborn
Conservative Would Run a Deficit: Policy with Time-Inconsistent Pref-
erences", Quarterly Journal of Economics, vol. 104, 325-345.
[97] Persson, Torsten, Gérard Roland and Guido Tabellini [2000], "Com-
parative Politics and Public Finance", Journal of Political Economy,
vol 108, 1121-1161.
[98] Persson, Torsten and Guido Tabellini [1994], "Is Inequality Harmful
for Growth?", American Economic Review, vol. 84, 600-621.
[99] Persson, Torsten and Guido Tabellini [2000], Political Economics: Ex-
plaining Economic Policy, Cambridge, MA: MIT Press.
[100] Persson, Torsten and Guido Tabellini [2002], "Political Economics and
Public Finance", Chapter 24 in Auerbach, Alan and Martin Feldstein
(eds), Handbook of Public Economics Volume 3, Amsterdam: Elsevier.
[101] Persson, Torsten and Guido Tabellini [2003], The Economic Effects of
Constitutions, Cambridge MA: MIT Press.
68

[102] Pomeranz, Dina [2011], "No Taxation without Information: Deterrence
and Self-Enforcement in the Value Added Tax", mimeo, Department
of Economics, Harvard University.
[103] Reinikka, Ritva and Jakob Svensson [2008], "Working for God? Evalu-
ating Service Delivery of Religious Not-for-profit Health Care Providers
in Uganda", Policy Research Working Paper WPS3058, World Bank.
[104] Roberts, Kevin [1977], "Voting over Income Tax Schedules", Journal
of Public Economics, vol. 8, 329-340.
[105] Romer, Thomas [1975], "Individual Welfare, Majority Voting, and the
Properties of a Linear Income Tax", Journal of Public Economics, vol.
4, 163-185.
[106] Rothstein, Bo [2000], "Trust, Social Dilemmas and Collective Memo-
ries", Journal of Theoretical Politics, vol. 12, 477-501.
[107] Saez, Emmanuel, Joel Slemrod, Seth H. Giertz, [2009], “The Elasticity
of Taxable Income with Respect to Marginal Tax Rates: A Critical
Review,” NBER Working Paper No. 15012.
[108] Sarkees, Meredith Reid and Frank Wayman [2010], Resort to War:
1816 - 2007, CQ Press.
[109] Schneider, Friedrich [2002], "Size and Measurement of the Informal
Economy in 110 Countries Around the World", mimeo.
[110] Schumpeter, Joseph A. [1918], "The Crisis of the Tax State", Interna-
tional Economic Papers, vol. 4, 5-38.
[111] Shayo, Moses [2009], "A Model of Social Identity with an Application
to Political Economy: Nation, Class, and Redistribution", American
Political Science Review, vol. 103, 147-174.
[112] Slemrod, Joel [2001], "A General Model of the Behavioral Response to
Taxation", International Tax and Public Finance, vol. 8, 119—128.
[113] Slemrod, Joel and Shlomo Yitzhaki [2002], "Tax Avoidance, Evasion,
and Administration", in Auerbach, Alan and Martin Feldstein (eds.),
Handbook of Public Economics, Vol 3, Amsterdam: Elsevier.
69

[114] Stasavage, David [2003], Public Debt and the Birth of the Democratic
State: France and Great Britain, 1688-1789, Cambridge: Cambridge
University Press.
[115] Stasavage, David [2007], "Partisan Politics and Public Debt: The Im-
portance of the ‘Whig Supremacy’ for Britain’s Financial Revolution",
European Review of Economic History, vol. 11, 123-153.
[116] Tanzi, Vito [1987], "Quantitative Characteristics of the Tax Systems of
Developing Countries", in Newbery, David and Nicholas Stern (eds),
The Theory of Taxation for Developing Countries, Oxford: Oxford
University Press for the World Bank.
[117] Tanzi, Vito [1992], "Structural Factors and Tax Revenue in Developing
Countries: A Decade of Evidence", in Goldin, Ian and L. Alan Win-
ters (eds.), Open Economies: Structural Adjustment and Agriculture,
Cambridge: Cambridge University Press.
[118] Temple, Jonathan [2010], "Aid and Conditionality", in Rodrik, Dani
and Mark Rosenzweig (eds.), Handbook of Development Economics, vol
5.
[119] Tilly, Charles (ed.) [1975], The Formation of National States in West-
ern Europe, Princeton: Princeton University Press.
[120] Tilly, Charles [1985], "Warmaking and State Making as Organized
Crime", in Evans, Peter, Dietrich Rueschemeyer and Theda Skocpol
(eds.), Bringing the State Back In, Cambridge: Cambridge University
Press.
[121] Tilly, Charles [1990], Coercion, Capital and European States, AD 990-
1992, Oxford: Blackwells.
[122] Torgler, Benno [2007], Tax Morale and Tax Compliance: A Theoretical
and Empirical Analysis, Cheltenham U.K.: Edward Elgar.
[123] Zolt, Eric M. and Richard M. Bird [2005], "Redistribution via Tax-
ation: The Limited Role of the Personal Income Tax in Developing
Countries", UCLA Law Review, vol. 52, 1627-1695.
70