PTC INDIA LTD. Investor... · Total Revenue from Operations 19,640.73 15,310.55 28.28% Expenses:...
14
PTC INDIA LTD. INVESTOR PRESENTATION – Q4FY18 & FY18
Transcript of PTC INDIA LTD. Investor... · Total Revenue from Operations 19,640.73 15,310.55 28.28% Expenses:...

PTC INDIA LTD.
INVESTOR PRESENTATION – Q4FY18 & FY18

2
DISCLAIMER
This presentation and the accompanying slides (the “Presentation”), which have been prepared by PTC India Limited
(the “Company”), have been prepared solely for information purposes and do not constitute any offer, recommendation
or invitation to purchase or subscribe for any securities, and shall not form the basis or be relied on in connection with
any contract or binding commitment whatsoever.
Certain matters discussed in this Presentation may contain statements regarding the Company’s market opportunity and
business prospects that are individually and collectively forward-looking statements. Such forward-looking statements
are not guarantees of future performance and are subject to known and unknown risks, uncertainties and assumptions
that are difficult to predict. These risks and uncertainties include, but are not limited to: the performance of the Indian
economy and of the economies of various international markets, the performance of the power industry in India and
world-wide, competition, the company’s ability to successfully implement its strategy, the Company’s future levels of
growth and expansion, technological implementation, changes and advancements, changes in revenue, income or cash
flows, the Company’s market preferences and its exposure to market risks, as well as other risks. The Company’s future
results, levels of activity, performance or achievements could differ materially and adversely from results expressed in or
implied by this Presentation. The Company assumes no obligation to update any forward-looking information contained
in this Presentation. Any forward-looking statements and projections made by third parties included in this Presentation
are not adopted by the Company and the Company is not responsible for such third party statements and projections.
The distribution of this document in certain jurisdictions may be restricted by law and persons into whose possession this
presentation comes should inform themselves about and observe any such restrictions.

PERFORMANCE REVIEW
3

4
Q4FY18 AT A GLANCE - Standalone
3,269.2
4,007.9
-
500.0
1,000.0
1,500.0
2,000.0
2,500.0
3,000.0
3,500.0
4,000.0
4,500.0
Q4FY17 Q4FY18
T o t a l R e v e n u e f r o m O p e r a t i o n ( I N R C r o r e s )
120.7
97.5
0
20
40
60
80
100
120
140
Q4FY17 Q4FY18
PBT (INR Crores)
78.7
64.4
0
20
40
60
80
100
Q4FY17 Q4FY18
PAT (INR Crores)
10106
11777
9000
9500
10000
10500
11000
11500
12000
Q4FY17 Q4FY18
Total Volumes (MUs)
5
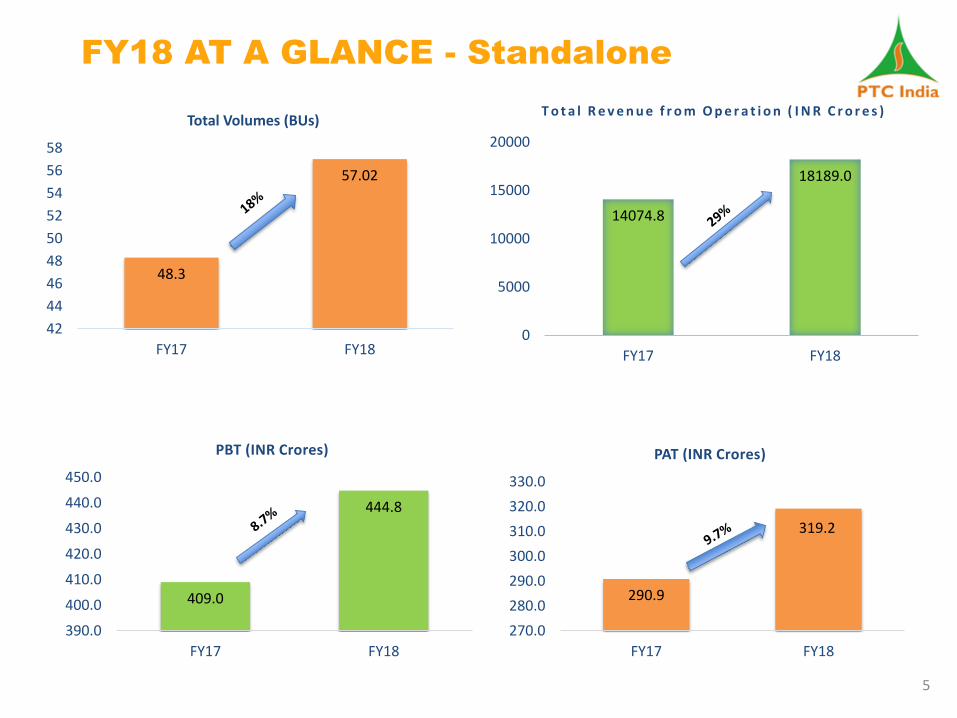
FY18 AT A GLANCE - Standalone
14074.8
18189.0
0
5000
10000
15000
20000
FY17 FY18
T o t a l R e v e n u e f r o m O p e r a t i o n ( I N R C r o r e s )
409.0
444.8
390.0
400.0
410.0
420.0
430.0
440.0
450.0
FY17 FY18
PBT (INR Crores)
290.9
319.2
270.0
280.0
290.0
300.0
310.0
320.0
330.0
FY17 FY18
PAT (INR Crores)
48.3
57.02
42
44
46
48
50
52
54
56
58
FY17 FY18
Total Volumes (BUs)

6
FY18 AT A GLANCE - Consolidated
15310.6
19640.7
0.0
5000.0
10000.0
15000.0
20000.0
25000.0
FY17 FY18
T o t a l R e v e n u e f r o m O p e r a t i o n ( I N R C r o r e s )
771.9
623.7
0.0
200.0
400.0
600.0
800.0
1000.0
FY17 FY18
PBT (INR Crores)
505.8
404.0
0.0
100.0
200.0
300.0
400.0
500.0
600.0
FY17 FY18
PAT (INR Crores)

7
PHYSICAL PERFORMANCE – SNAPSHOT
(Q4FY18)
* Short Term Trades also includes trades on power exchanges;
**Long Term Trades also includes trades from Cross Border and tolling converted into trading
Business Segment Q4FY17 Q4FY18 Growth
(Units in Millions) % of total trade (Units in Millions)
Short Term Trades * 5863 58.0% 6812 16.2%
Medium Term 608 6.0% 461 (24.2%)
Long Term Trades ** 3634 36.0% 4503 23.9%
Wind 1 0.0% 1 -
Total 10106 100.00% 11777 16.5%

8
PHYSICAL PERFORMANCE – SNAPSHOT
(FY18)
* Short Term Trades also includes trades on power exchanges;
**Long Term Trades also includes trades from Cross Border and tolling converted into trading
Business Segment FY17 FY18 Growth
(Units in Millions) % of total trade (Units in Millions)
Short Term Trades * 25896 53.6% 30934 19.4%
Medium Term 2710 5.6% 2187 (19.3%)
Long Term Trades ** 19700 40.8% 23884 21.2%
Wind 14 0.0% 13 (7.5%)
Total 48320 100.00% 57018 18%

• Operationalization of Karcham Wangoo 376 MW long Term PPA with Haryana & Punjab.
Similarly, Long Term PPA of 200 MW (Teesta Urja) has been operationalized from 12th May
2018.
• PTC to act as an aggregator for the purpose of procurement and supply of power for 2,500 MW
from thermal assets in the medium term.
• Aggregation of 1050 MW renewable power and signing of PPA / PSA with 5 developers and 7
states.
• Technology as a driver, engaged with Kongsberg to implement performance monitoring &
generation forecasting of Hydro Power with a pilot study in HP for small Hydro and in Bihar for
Load & Demand forecasting.
9
KEY HIGHLIGHTS – Q4FY18 & FY2017-18

10
NUMBERS UP-CLOSE Q4FY18 (STANDALONE)
P&L (Quarter Ending 31st March’ 2018)
Particulars in ( ₹ Crore) Q4 FY18 Q4 FY17 % Q-o-Q Q3 FY18 % Q-o-Q
Total Income from Operations 4,007.89 3,269.20 22.60% 4,490.07 -11% Expenses:
Purchases 3,847.81 3,097.70 24.22% 4,339.13 -11% Other Operating Expenses 48.42 46.39 4.38% 48.30 -
Employee Benefit Expenses 7.68 6.97 10.19% 7.67 - Depreciation 0.77 0.77 - 0.71 8%
Other Expenses 10.56 27.83 -62.06% 9.01 17% Total Expenses 3,915.24 3,179.66 23.13% 4,404.82 -11%
Profit from operations (before Other Income, Finance Costs & Exceptional Items) 92.65 89.54 3.47% 85.25 9%
Other Income 17.55 75.96 -76.90% 17.75 -1% Finance Costs 12.70 44.77 -71.63% 16.03 -21%
Exceptional Items 0.02 -0.03 - - Profit Before Tax 97.52 120.70 -19.20% 86.97 12%
Tax Expenses 33.15 41.93 -20.94% 28.03 18% (including deferred tax)
Net Profit for the Period 64.37 78.77 -18.28% 58.94 9%

11
NUMBERS UP-CLOSE FY18 (STANDALONE)
P&L (Full Year Ending 31st March’ 2018)
Particulars in (₹ Crore) FY 18 FY 17 Variance
Total Income from Operations 18189.04 14074.83 29% Expenses:
Purchases 17563.38 13479.27 30% Other Operating Expenses 189.43 210.07 -10%
Employee Benefit Expenses 30.42 28.66 6% Depreciation 2.85 2.71 5%
Other Expenses 44.04 48.49 -9% Total Expenses 17830.12 13769.2 29%
Profit from operations (before Other Income, Finance Costs & Exceptional Items) 358.92 305.63 17%
Other Income 203.11 237.99 -15% Finance Costs 117.28 134.59 -13%
Exceptional Items 0.02 -0.02 - Profit Before Tax 444.77 409.01 9%
Tax Expenses 125.57 118.14 6% (including deferred tax)
Net Profit for the Period 319.2 290.87 10%

12
NUMBERS UP-CLOSE FY18 (CONSOLIDATED)
P&L (Full Year Ending 31st March’ 2018)
Particulars in (₹ Crore) FY 18 FY 17 Variance Total Revenue from Operations 19,640.73 15,310.55 28.28%
Expenses:
Purchases 17,563.38 13,479.27 30.30% Provision for Expected Credit Loss 241.58 113.73 112.42%
Operating Expenses 194.96 210.60 -7.43% Employee benefit expenses 48.21 43.99 9.59%
Depreciation and Amortization Expenses 97.44 21.24 358.76% Other Expenses 73.01 73.04 - Total Expenses 18,218.58 13,941.87 30.68%
Profit from operations before other income, finance costs and exceptional items 1,422.15 1,368.68 3.91%
Other Income 145.87 202.92 -28.11% Profit from ordinary activities before finance costs and exceptional items 1,568.02 1,571.60 -0.23%
Finance costs 944.37 799.73 18.09% Profit from ordinary activities after finance costs but before exceptional items 623.65 771.87 -19.20%
Exceptional items:
-Provision for diminution in value of long term investment
-Profit / (Loss) on sale of fixed assets 0.02 -0.02 Profit from ordinary activities before tax
Tax expenses:
Current tax 261.26 288.31 Deferred tax expenditure/ (income) -41.56 -22.27
Net Profit for the period 403.97 505.81 -20.13%

13
RECEIVABLES & REBATES
Particulars Q4FY18 Q4FY17 FY18 FY17
Net Rebate disallowed (Rs. Cr.) 24.27 13.46 64.66 47.61
Net surcharge received (Rs. Cr.) 32.09 59.44 114.13 95.17
Margin per unit (Rs./unit) 0.093 0.12 0.074 0.078
Margin per unit (without rebate &
surcharge) (Rs./ unit) 0.045 0.048 0.043 0.049

“To be a frontrunner in power trading by developing a vibrant power
market and striving to correct market distortions”
Our Vision
For more information contact: Anand Kumar / Harsh Wardhan PTC India Limited / Fortuna PR Tel: +91 9873988920 / Tel: +91 9810162711 Email: [email protected] Email: [email protected]
THANK YOU WWW.PTCINDIA.COM