
Lviv Outsourcing Forum 2016 Михайло Крамаренко “IT-outsourcing: Retrospection & opportunities”
Growing togetherbeyond “Chemistry”
PTA - Retrospection&
Way Ahead
Presented By Mr. Amitava Banerjee
General Manager – Marketing & Raw Materials
5th Aug, 2014
Contents
PTA Capacity (World / Asia / China).
Demand Supply Balance of PTA (World / Asia / China).
Historic Price Trend (Asia).
PTA Demand Supply Scenario in India.
Sector Wise Growth of Polyester in India.
Barriers to Growth in India
PTA Outlook

PTA CAPACITY

World PTA Capacity
11% 8%2%
79%
2011 N.America
S.America
EU
Middle East/Africa
Asia/Far East
7%
1%
6%2%
84%
2014 N.America
S.America
EU
Middle East/Africa
Asia/Far East
7%1%
6% 3%
83%
2017 N.America
S.America
EU
Middle East/Africa
Asia/Far East
Asia dominates the PTA market.
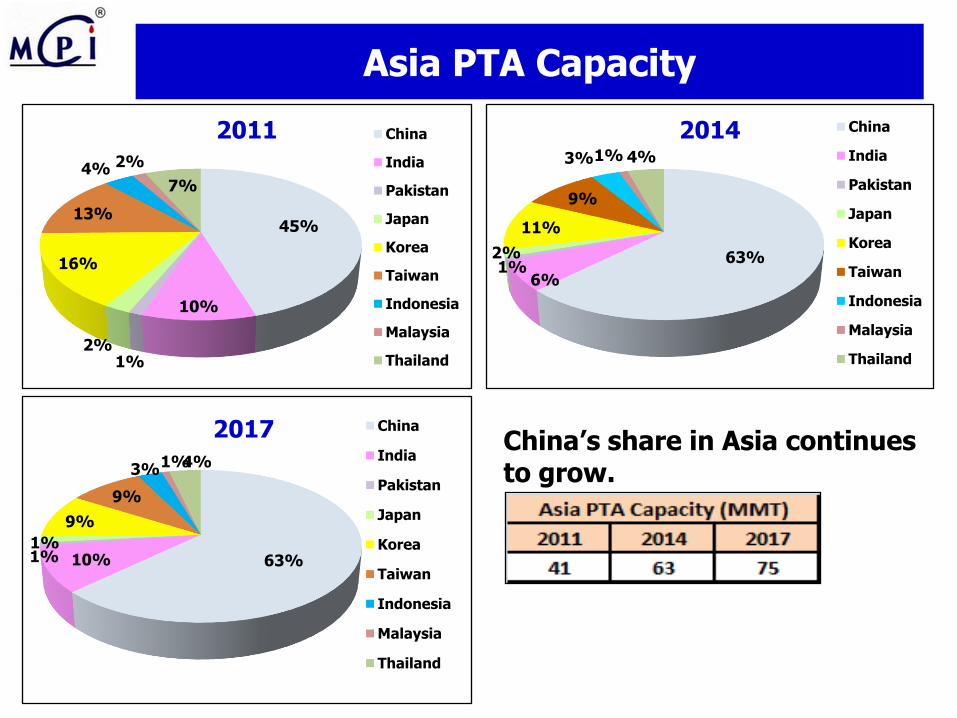
Asia PTA Capacity
China’s share in Asia continues to grow.
45%
10%
1%2%
16%
13%
4% 2%
7%
2011 China
India
Pakistan
Japan
Korea
Taiwan
Indonesia
Malaysia
Thailand
63%
6%1%
2%
11%
9%
3%1% 4%
2014 China
India
Pakistan
Japan
Korea
Taiwan
Indonesia
Malaysia
Thailand
63%10%1%1%
9%
9%
3%1%4%
2017 China
India
Pakistan
Japan
Korea
Taiwan
Indonesia
Malaysia
Thailand

China PTA Capacity
3 Major PTA makers share more than 60% of China PTA capacity.
8% 9%
22%
11%19%
32%
2011 BP Zhuhai
Hengli
Xianglu
Yisheng
Yuandong
Sinopec
Others
4%
13%
15%
26%8%
9%
25%
2014 BP Zhuhai
Hengli
Xianglu
Yisheng
Yuandong
Sinopec
Others
7%
14%
13%
31%
7%
9%
20%
2017 BP Zhuhai
Hengli
Xianglu
Yisheng
Yuandong
Sinopec
Others

PTA Capacity Expansion Plan in Asia

DEMAND SUPPLY BALANCE OF PTA
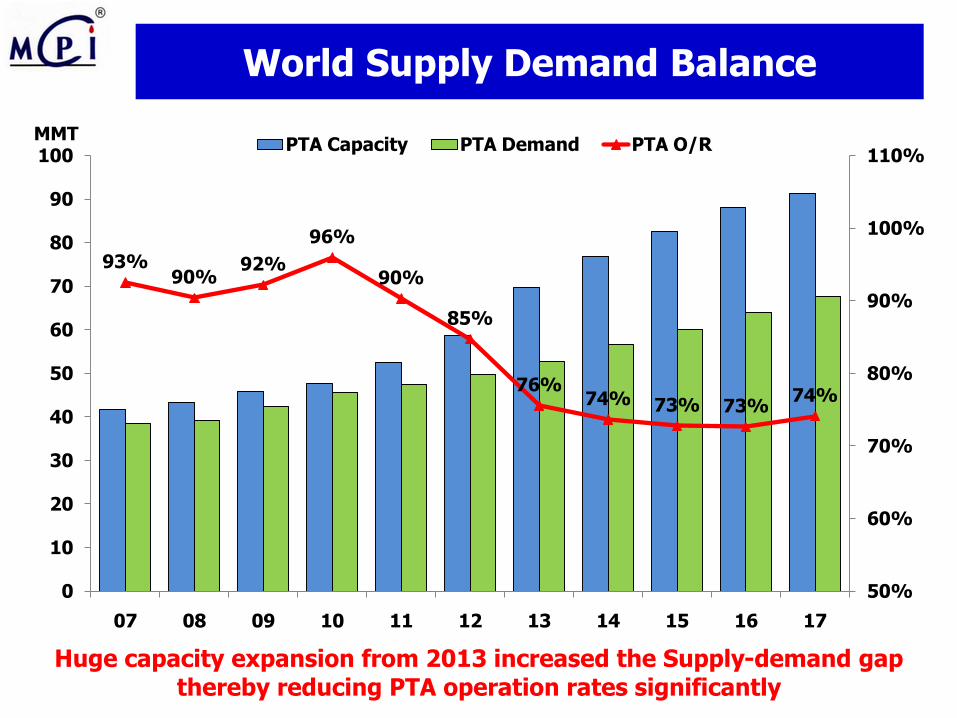
93%90%
92%
96%
90%
85%
76%74% 73% 73%
74%
50%
60%
70%
80%
90%
100%
110%
0
10
20
30
40
50
60
70
80
90
100
07 08 09 10 11 12 13 14 15 16 17
MMTPTA Capacity PTA Demand PTA O/R
World Supply Demand Balance
Huge capacity expansion from 2013 increased the Supply-demand gap thereby reducing PTA operation rates significantly
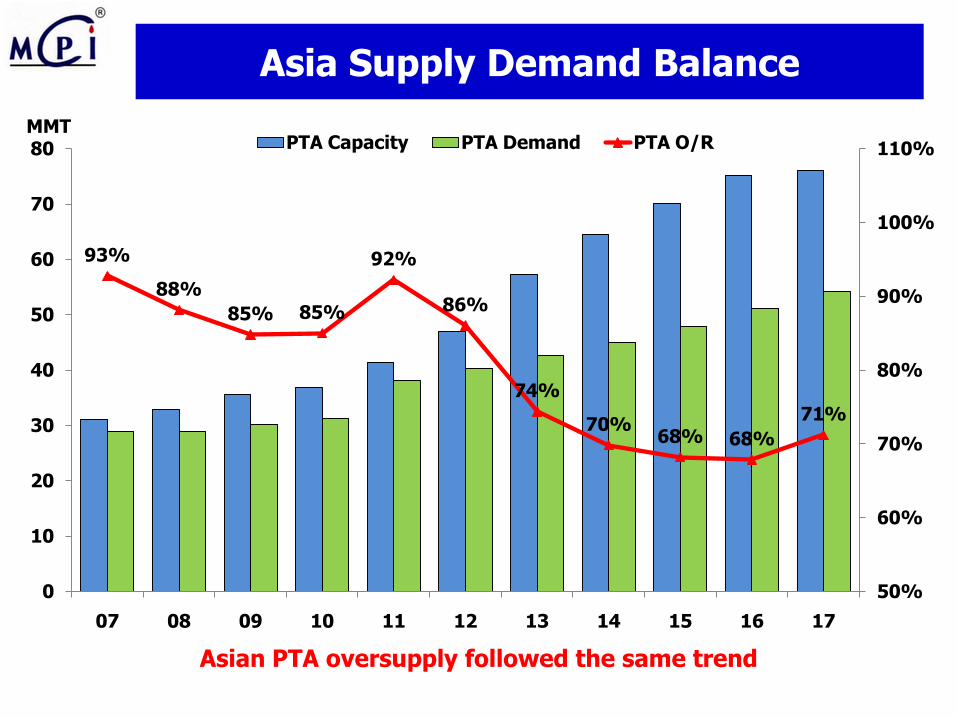
93%
88%
85% 85%
92%
86%
74%
70%68% 68%
71%
50%
60%
70%
80%
90%
100%
110%
0
10
20
30
40
50
60
70
80
07 08 09 10 11 12 13 14 15 16 17
MMTPTA Capacity PTA Demand PTA O/R
Asia Supply Demand Balance
Asian PTA oversupply followed the same trend

95%
87% 87%
94% 94%
88%
75%
69% 68%66%
71%
50%
60%
70%
80%
90%
100%
110%
0
5
10
15
20
25
30
35
40
45
50
07 08 09 10 11 12 13 14 15 16 17
MMT
PTA Capacity PTA Demand PTA O/R
China Supply Demand Balance
Huge capacity additions in China reducing overall operation.

-5062 -5443
-2742
5821
10256
11350
13491
11347
105
-50 -248 -591-1156 -764
989131
-11000
-6000
-1000
4000
9000
14000
2010 2011 2012 2013 2014 2015 2016 2017
KT/Y
China Korea Taiwan Thailand India
PTA Trade Balance Country Wise
Oversupply situation peaks in 2016.2017 onwards trade deficit reduces.

HISTORIC PRICE TREND

-
100
200
300
400
500
600
700
800
900
1,000
0
200
400
600
800
1,000
1,200
1,400
1,600
1,800
2,000
Jan
Au
g
Feb Oct
2011
($/T)($/T)PX-MX PX CFRT MX FOBK Average Spread
Jan Mar May Jul Sep Nov Jan Mar May Jul Sep Nov Jan Mar May Jul Sep Nov Jan Mar May Jul
2011 2012 2013 2014
PX/MX Price Trend
PX/MX spread is getting squeezed due to PX overcapacity.

-
100
200
300
400
500
600
700
800
900
1,000
0
200
400
600
800
1,000
1,200
1,400
1,600
1,800
2,000
Jan
Au
g
Feb Oct
2011
($/T)($/T)PX-MOPJ PX CFRT MOPJ Average Spread
Jan Mar May Jul Sep Nov Jan Mar May Jul Sep Nov Jan Mar May Jul Sep Nov Jan Mar May Jul
2011 2012 2013 2014
PX/Naphtha Price Trend
From 2014 onwards PX / Naphtha spread reduces because of new PX capacities.

PTA & PX Price Trend In China
Whereas PX enjoyed hefty margins, PTA suffered.
207262 245
9075
63
0
200
400
600
800
1000
1200
1400
1600
1800
JA
N
MA
R
MA
Y
JU
L
SE
P
NO
V
JA
N
MA
R
MA
Y
JU
L
SE
P
NO
V
JA
N
MA
R
MA
Y
JU
L
SE
P
NO
V
JA
N
MA
R
MA
Y
JU
L
SE
P
NO
V
JA
N
MA
R
MA
Y
JU
LY
SE
P
NO
V
Ja
n
Ma
r
Ma
y
2009 2010 2011 2012 2013 2014
Spread China PTA PX China Avg Spread (Yearly)$/MT
2010 Avg.PTA 946$/T
PX 1,037 $/T SPREAD 262$/T
2011 AvgPTA 1,277$/T PX 1,541$/T
SPREAD 245$/T
2012 AvgPTA 1,001$/T PX 1,510$/T
SPREAD 90$/T
2013 AvgPTA 1,074$/T PX 1,490 $/T
SPREAD 75$/T
2009 Avg.PTA 818$/T PX 912 $/T SPREAD 207$/T
PTA Supply & Demand Scenario - India
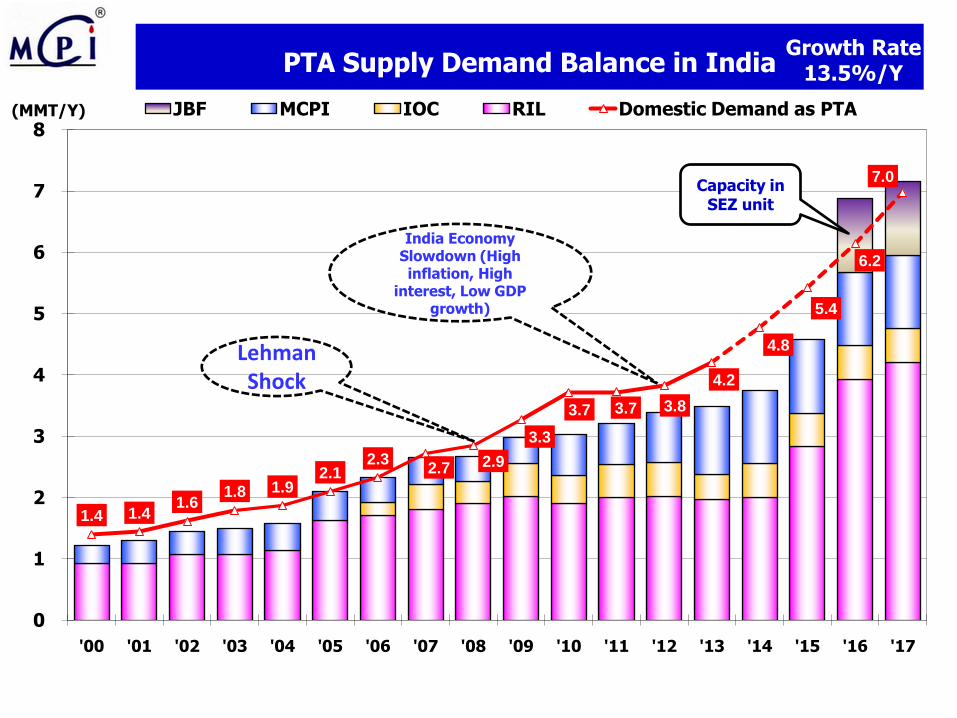
PTA Supply Demand Balance in India
1.4 1.41.6
1.8 1.92.1
2.32.7 2.9
3.3
3.7 3.7 3.8
4.2
4.8
5.4
6.2
7.0
0
1
2
3
4
5
6
7
8
'00 '01 '02 '03 '04 '05 '06 '07 '08 '09 '10 '11 '12 '13 '14 '15 '16 '17
JBF MCPI IOC RIL Domestic Demand as PTA (MMT/Y)
Lehman Shock
India Economy Slowdown (High inflation, High
interest, Low GDP growth)
Capacity in SEZ unit
Growth Rate 13.5%/Y

MCC PTA Production History
0
200
400
600
800
1000
1200
1400
2000 2001 2002 2003 2004 2005 2006 2007 2008 2009 2010 2011 2012 2013 2014 (Est)
KT MCPI has been a partner to the growth of Polyester industry in India.
Currently the biggest PTA merchant seller in India.
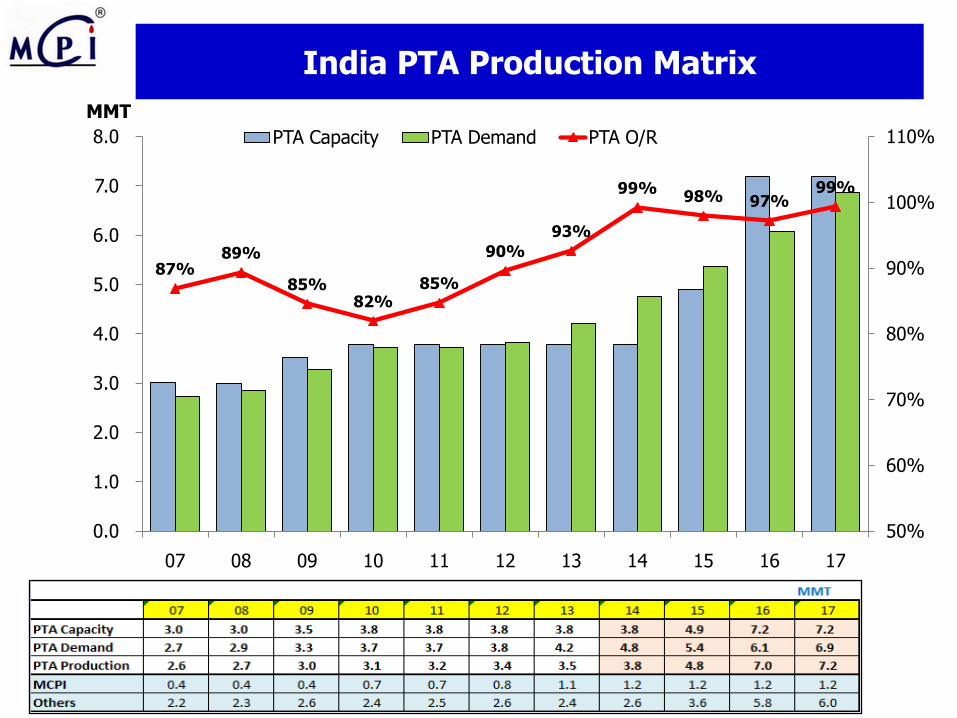
India PTA Production Matrix
87%89%
85%82%
85%
90%
93%
99%98% 97%
99%
50%
60%
70%
80%
90%
100%
110%
0.0
1.0
2.0
3.0
4.0
5.0
6.0
7.0
8.0
07 08 09 10 11 12 13 14 15 16 17
MMT
PTA Capacity PTA Demand PTA O/R
India – Immense Potential for Growth

0
2
4
6
8
10
12
14
16
18
2001 2002 2003 2004 2005 2006 2007 2008 2009 2010 2011 2012 2013 2014 2015 2016 2017 2018
GDP growth (%) Polyester growth
2014 GDP Growth Estimate 5.4%
• 13.5% Polyester Growth Estimated from 2014.• Strong Co-relation with GDP.
Actual Polyester Growth 10% in 2013.
General Election Year
General Election Year
Source : IMF
GDP Vs Polyester Growth - India
General Election Year
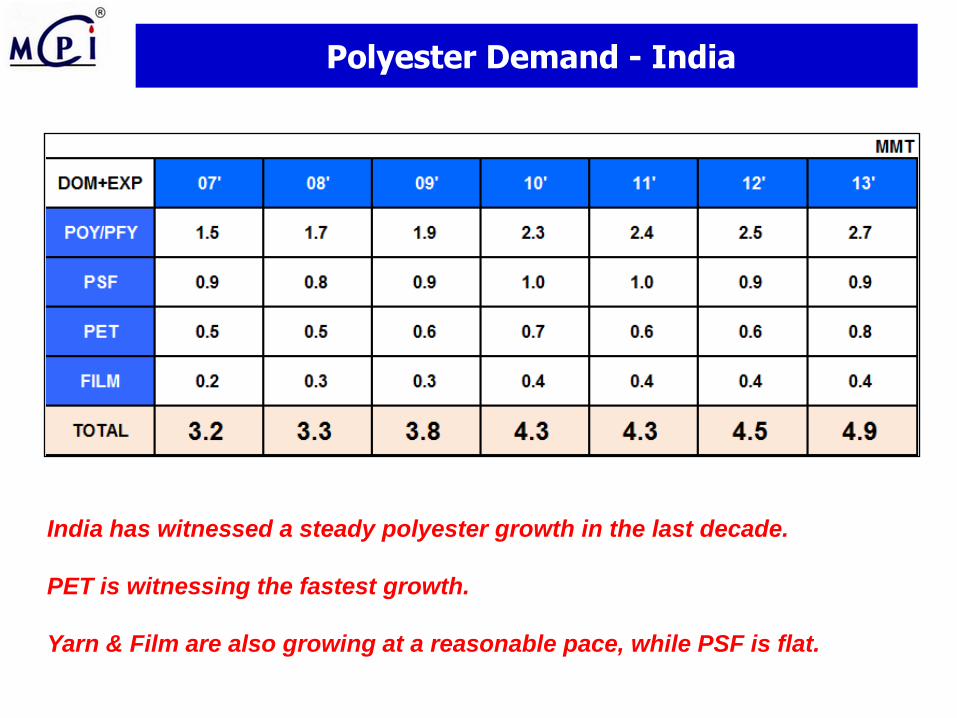
Polyester Demand - India
India has witnessed a steady polyester growth in the last decade.
PET is witnessing the fastest growth.
Yarn & Film are also growing at a reasonable pace, while PSF is flat.
6.8 7.38.2
8.9
12.713.5 13.9 14.2
20.3
26.6 26.9 27.2
0
5
10
15
20
25
30
KG/Capita
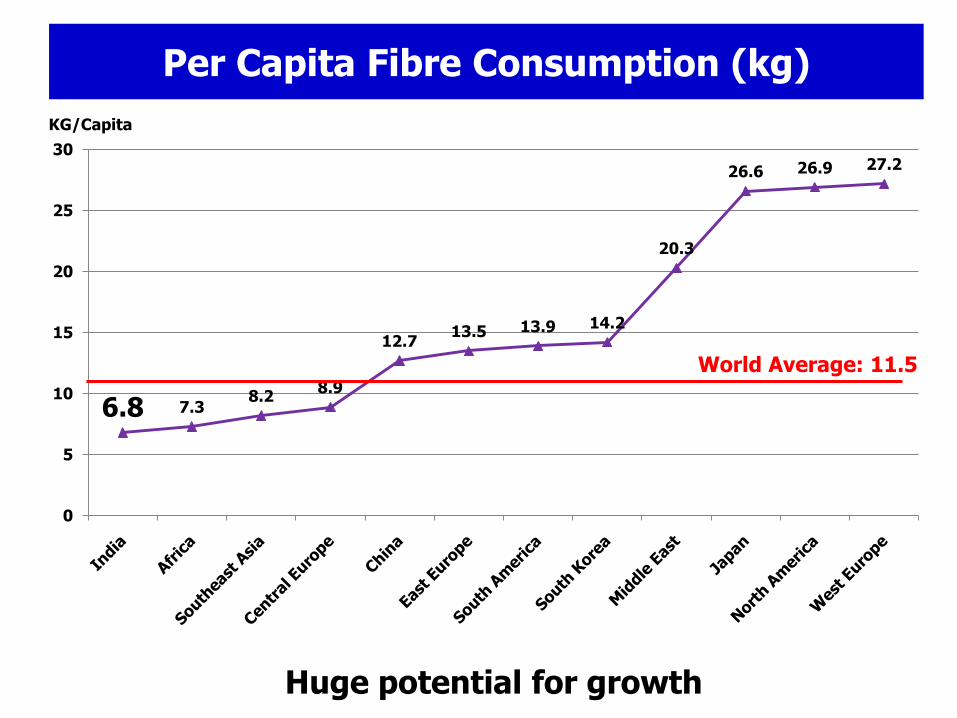
Per Capita Fibre Consumption (kg)
Huge potential for growth
World Average: 11.5
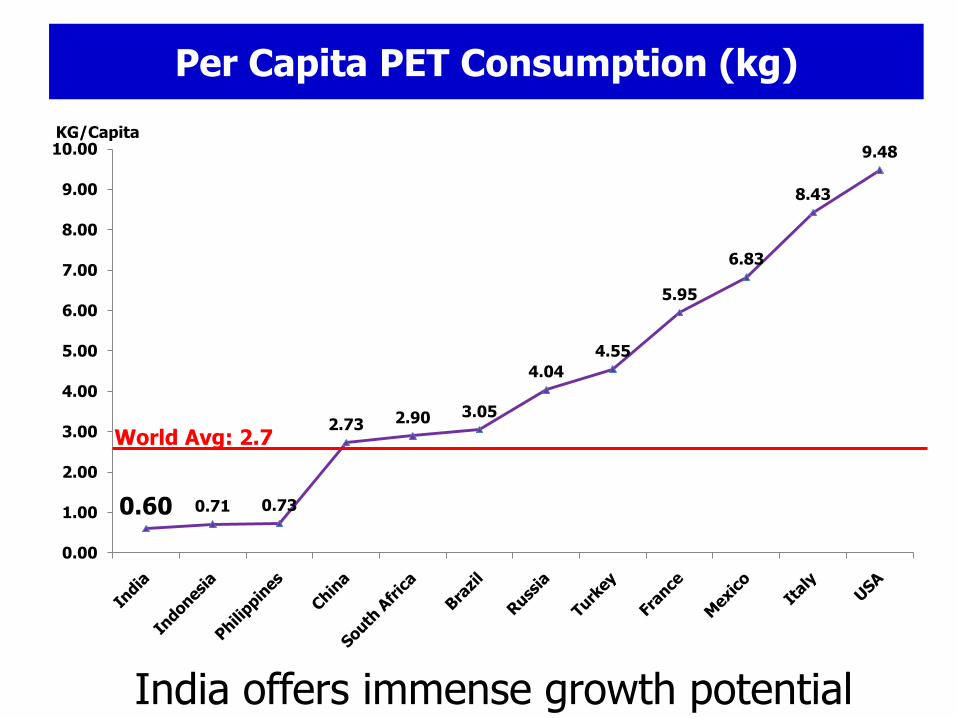
Per Capita PET Consumption (kg)
0.60 0.71 0.73
2.73 2.90 3.05
4.04
4.55
5.95
6.83
8.43
9.48
0.00
1.00
2.00
3.00
4.00
5.00
6.00
7.00
8.00
9.00
10.00KG/Capita
World Avg: 2.7
India offers immense growth potential

Barriers to Growth
- Disproportionate duty structure - hindrance to growth.
- Disproportionate duty structure for “Virgin” and “Re-cycled” Staple Fibre.
- India’s power cost is 30-75% higher compared to other countries. Need to select cheap source of fuel. Coal based power & Hot Oil heating system introduced by most of the polyester makers.
- Stringent labour law & lack of skilled manpower.
- Unorganized downstream. Less number of integrated players having the entire chain up to dying and processing.

Retrospection - Asia
Huge capacity addition in China led to PTA oversupply
situation.
However PX expansions could not catch up with PTA.
Polyester growth also could not catch up with the huge PTA
capacity.
PTA faced historically low spread from November 2011.
Operation cuts of many PTA plants started from 2013.
Taiwan has been the biggest sufferer till now.

Future Ahead - Asia
Tight PX situation to ease in 2H 2014 after planned PX
start ups in Asia leading to long PX situation.
PTA manufacturers suffering for last two years because of
poor PX-PTA spread expect recovery of spread to better
levels.
All countries in Asia already introduced PX link price for
PTA. India need to follow soon.
PTA is one of those few commodities in the world which is
growing at 5~6%.

Ray of Hope
India holds huge potential for Polyester Growth.
Polyester to grow in line with positive GDP.
Recent investment in Yarn & Fibreto get absorbed in near future, although PET will be in excess.
New investments expected in polyester in near future.
Introduction of GST should make tax laws simpler.
PTA producers shall continue to operate & maintain healthy operation in view of robust domestic demand.

THANK YOU…


![Traditional pest contro]: A retrospection - NISCAIRnopr.niscair.res.in/bitstream/123456789/19367/1/IJTK 1(Inaugural... · Traditional pest contro]: A retrospection ... cope-up with](https://static.fdocuments.in/doc/165x107/5aa18fe57f8b9a80378bd060/traditional-pest-contro-a-retrospection-1inauguraltraditional-pest-contro.jpg)
