Psl trails guide exploration and microcolony formation in...
5
LETTER doi:10.1038/nature12155 Psl trails guide exploration and microcolony formation in Pseudomonas aeruginosa biofilms Kun Zhao 1 *, Boo Shan Tseng 2 *, Bernard Beckerman 3 , Fan Jin 4 , Maxsim L. Gibiansky 1 , Joe J. Harrison 2 , Erik Luijten 3,5 , Matthew R. Parsek 2 & Gerard C. L. Wong 1,6,7 Bacterial biofilms are surface-associated, multicellular, morph- ologically complex microbial communities 1–7 . Biofilm-forming bacteria such as the opportunistic pathogen Pseudomonas aerugi- nosa are phenotypically distinct from their free-swimming, plank- tonic counterparts 7–10 . Much work has focused on factors affecting surface adhesion, and it is known that P. aeruginosa secretes the Psl exopolysaccharide, which promotes surface attachment by acting as ‘molecular glue’ 11–15 . However, how individual surface-attached bacteria self-organize into microcolonies, the first step in com- munal biofilm organization, is not well understood. Here we identify a new role for Psl in early biofilm development using a massively parallel cell-tracking algorithm to extract the motility history of every cell on a newly colonized surface 16 . By combining this technique with fluorescent Psl staining and computer simula- tions, we show that P. aeruginosa deposits a trail of Psl as it moves on a surface, which influences the surface motility of subsequent cells that encounter these trails and thus generates positive feed- back. Both experiments and simulations indicate that the web of secreted Psl controls the distribution of surface visit frequencies, which can be approximated by a power law. This Pareto-type 17 behaviour indicates that the bacterial community self-organizes in a manner analogous to a capitalist economic system 18 , a ‘rich- get-richer’ mechanism of Psl accumulation that results in a small number of ‘elite’ cells becoming extremely enriched in communally produced Psl. Using engineered strains with inducible Psl produc- tion, we show that local Psl concentrations determine post-division cell fates and that high local Psl concentrations ultimately allow elite cells to serve as the founding population for initial micro- colony development. The extracellular matrix of P. aeruginosa biofilms is composed mostly of exopolysaccharides, proteins and DNA 19–21 . Biofilms formed by non-mucoid isolates of P. aeruginosa primarily use two types of exopolysaccharide: Psl and Pel 22 . To initiate biofilm development, the wild-type strain PAO1 uses Psl to promote adhesion of cells to surfaces 14,15 . Once associated with a surface, P. aeruginosa can remain fixed at the point of attachment or move. Formation of microcolonies (aggregates of ,50 cells or less) is the first step in the communal organization of a biofilm; however, little is known regarding the trans- ition of individual cells to these discrete microcolonies 3–5,23 . Consistent with the role of Psl in surface adhesion 7,24 , the average surface residence time of a PAO1 DpslD mutant strain (which cannot produce Psl) was 35 6 10% shorter than that of wild type. Tracking algorithms allow us to isolate differences in spatial characteristics of cell–surface interactions, in addition to temporal characteristics such as residence time. We observed a fundamental difference in surface exploration patterns between the wild-type and DpslD strains (Fig. 1a–d and Supplementary Video 1) when we tracked the motility history of all cells in a 67 mm 3 67 mm field of view (.700,000 images of individual cells, 11 h of data, time resolution of 3 s per frame). In Fig. 1a–d, black regions represent ‘untouched’ surface areas, whereas red regions represent areas visited by bacteria. For wild type, the surface coverage increased slowly to a maximum of ,55 6 5% in 5 h. In contrast, the DpslD mutant covered 79 6 10% in 5 h. These observed differences are not due to differ- ences in growth between strains (Supplementary Fig. 1). To confirm that changes in surface motility, rather than changes in the numbers of bacteria visiting the surface, are responsible for these observations, we also com- pared wild type and DpslD at the same total number of bacterial visits (that is, the sum of the number of bacteria in all frames, N s 5 P n i , where n i is the number of bacteria in frame i; Supplementary Fig. 2). Indeed, essen- tially the same trend was observed, with a surface coverage of 52 6 4% for wild type at N s 5 124,000 and a surface coverage of 83 6 10% for DpslD at the same N s . These are averages from at least three replicates (Sup- plementary Methods). Because Psl is important in both surface motility and adhesion, we characterized its spatial distribution with respect to bacterial traject- ories. A TRITC-conjugated, Psl-specific lectin 12 was used to visualize Psl. We allowed wild-type cells to traverse a surface for 2h before lectin staining and found that a trail of Psl was left on the surface (Supplementary Fig. 3). We verified that extracellular DNA 21 was not found in the trails (by staining with propidium iodide (data not shown) and SYTO 9 (Supplementary Figs 4 and 5)). 1 Department of Bioengineering, University of California, Los Angeles, California 90095, USA. 2 Department of Microbiology, University of Washington, Seattle, Washington 98195, USA. 3 Department of Materials Science and Engineering, Northwestern University, Evanston, Illinois 60208, USA. 4 CAS Key Laboratory of Soft Matter Chemistry, University of Science and Technology of China, Hefei, Anhui 230026, China. 5 Department of Engineering Sciences and Applied Mathematics, Northwestern University, Evanston, Illinois 60208, USA. 6 Department of Chemistry and Biochemistry, University of California, Los Angeles, California 90095, USA. 7 California NanoSystems Institute, University of California, Los Angeles, California 90095, USA. *These authors contributed equally to this work. WT ΔpslD Reconstructed trajectories Fluorescent-lectin- stained Psl trails I(t 2 = 18.7 h) – I(t 1 = 16.3 h) 0 250 500 t = 0.5 h t = 5 h a c d b e f Figure 1 | Efficiency of surface coverage by bacterial trajectories and correlation with Psl trails. a–d, Cumulative surface coverage at 0.5h (a, b) and 5 h (c, d). Red and black colours indicate traversed (that is, covered by bacterial trajectories) and fresh surface, respectively. Bacteria in the frame at the specified time points are shown in green. e, Reconstructed bacterial trajectories of wild type generated between 16.3 and 18.7h after inoculation (colour scale indicates the time a given cell spent at each point). f, Psl trail left behind by bacteria in the same period, stained by fluorescently conjugated Hippeastrum hybrid (amaryllis) lectin. Scale bars, 10 mm. 388 | NATURE | VOL 497 | 16 MAY 2013 Macmillan Publishers Limited. All rights reserved ©2013
Transcript of Psl trails guide exploration and microcolony formation in...
LETTERdoi:10.1038/nature12155
Psl trails guide exploration and microcolonyformation in Pseudomonas aeruginosa biofilmsKun Zhao1*, Boo Shan Tseng2*, Bernard Beckerman3, Fan Jin4, Maxsim L. Gibiansky1, Joe J. Harrison2, Erik Luijten3,5,Matthew R. Parsek2 & Gerard C. L. Wong1,6,7
Bacterial biofilms are surface-associated, multicellular, morph-ologically complex microbial communities1–7. Biofilm-formingbacteria such as the opportunistic pathogen Pseudomonas aerugi-nosa are phenotypically distinct from their free-swimming, plank-tonic counterparts7–10. Much work has focused on factors affectingsurface adhesion, and it is known that P. aeruginosa secretes the Pslexopolysaccharide, which promotes surface attachment by actingas ‘molecular glue’11–15. However, how individual surface-attachedbacteria self-organize into microcolonies, the first step in com-munal biofilm organization, is not well understood. Here weidentify a new role for Psl in early biofilm development using amassively parallel cell-tracking algorithm to extract the motilityhistory of every cell on a newly colonized surface16. By combiningthis technique with fluorescent Psl staining and computer simula-tions, we show that P. aeruginosa deposits a trail of Psl as it moveson a surface, which influences the surface motility of subsequentcells that encounter these trails and thus generates positive feed-back. Both experiments and simulations indicate that the web ofsecreted Psl controls the distribution of surface visit frequencies,which can be approximated by a power law. This Pareto-type17
behaviour indicates that the bacterial community self-organizesin a manner analogous to a capitalist economic system18, a ‘rich-get-richer’ mechanism of Psl accumulation that results in a smallnumber of ‘elite’ cells becoming extremely enriched in communallyproduced Psl. Using engineered strains with inducible Psl produc-tion, we show that local Psl concentrations determine post-divisioncell fates and that high local Psl concentrations ultimately allowelite cells to serve as the founding population for initial micro-colony development.
The extracellular matrix of P. aeruginosa biofilms is composedmostly of exopolysaccharides, proteins and DNA19–21. Biofilms formedby non-mucoid isolates of P. aeruginosa primarily use two types ofexopolysaccharide: Psl and Pel22. To initiate biofilm development,the wild-type strain PAO1 uses Psl to promote adhesion of cells tosurfaces14,15. Once associated with a surface, P. aeruginosa can remainfixed at the point of attachment or move. Formation of microcolonies(aggregates of ,50 cells or less) is the first step in the communalorganization of a biofilm; however, little is known regarding the trans-ition of individual cells to these discrete microcolonies3–5,23.
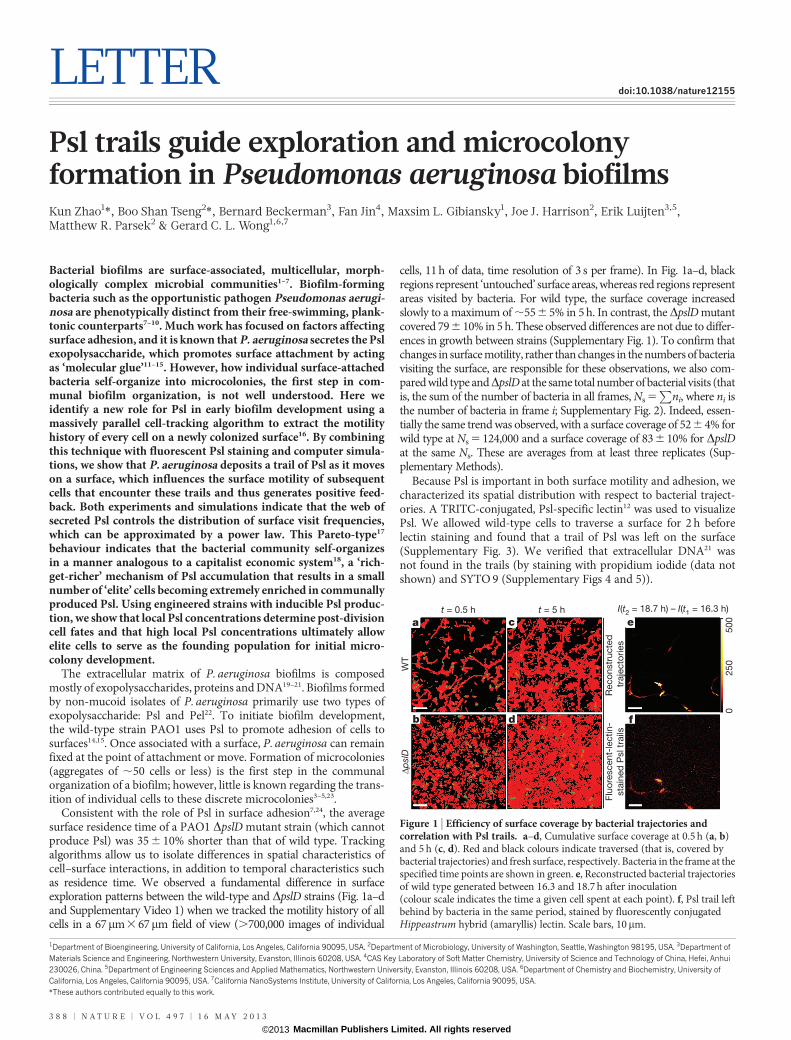
Consistent with the role of Psl in surface adhesion7,24, the averagesurface residence time of a PAO1 DpslD mutant strain (which cannotproduce Psl) was 35 6 10% shorter than that of wild type. Trackingalgorithms allow us to isolate differences in spatial characteristics ofcell–surface interactions, in addition to temporal characteristics suchas residence time. We observed a fundamental difference in surfaceexploration patterns between the wild-type and DpslD strains (Fig. 1a–dand Supplementary Video 1) when we tracked the motility history of allcells in a 67mm3 67mm field of view (.700,000 images of individual
cells, 11 h of data, time resolution of 3 s per frame). In Fig. 1a–d, blackregions represent ‘untouched’ surface areas, whereas red regions representareas visited by bacteria. For wild type, the surface coverage increasedslowly to a maximum of ,556 5% in 5 h. In contrast, the DpslD mutantcovered 79 6 10% in 5 h. These observed differences are not due to differ-ences in growth between strains (Supplementary Fig. 1). To confirm thatchanges in surface motility, rather than changes in the numbers of bacteriavisiting the surface, are responsible for these observations, we also com-pared wild type andDpslD at the same total number of bacterial visits (thatis, the sum of the number of bacteria in all frames, Ns 5
Pni, where ni is
the number of bacteria in frame i; Supplementary Fig. 2). Indeed, essen-tially the same trend was observed, with a surface coverage of 52 6 4% forwild type at Ns 5 124,000 and a surface coverage of 83 6 10% for DpslDat the same Ns. These are averages from at least three replicates (Sup-plementary Methods).
Because Psl is important in both surface motility and adhesion, wecharacterized its spatial distribution with respect to bacterial traject-ories. A TRITC-conjugated, Psl-specific lectin12 was used to visualizePsl. We allowed wild-type cells to traverse a surface for 2 h beforelectin staining and found that a trail of Psl was left on the surface(Supplementary Fig. 3). We verified that extracellular DNA21 wasnot found in the trails (by staining with propidium iodide (data notshown) and SYTO 9 (Supplementary Figs 4 and 5)).
1Department of Bioengineering, University of California, Los Angeles, California 90095, USA. 2Department of Microbiology, University of Washington, Seattle, Washington 98195, USA. 3Department ofMaterials Science and Engineering, Northwestern University, Evanston, Illinois 60208, USA. 4CAS Key Laboratory of Soft Matter Chemistry, University of Science and Technology of China, Hefei, Anhui230026, China. 5Department of Engineering Sciences and Applied Mathematics, Northwestern University, Evanston, Illinois 60208, USA. 6Department of Chemistry and Biochemistry, University ofCalifornia, Los Angeles, California 90095, USA. 7California NanoSystems Institute, University of California, Los Angeles, California 90095, USA.*These authors contributed equally to this work.
WT
Δpsl
D
Reco
nstr
ucte
d
traje
cto
ries
Flu
ore
scent-
lectin-
sta
ined
Psl tr
ails
I(t2 = 18.7 h) – I(t1 = 16.3 h)
0250
500
t = 0.5 h t = 5 h
a c
db
e
f
Figure 1 | Efficiency of surface coverage by bacterial trajectories andcorrelation with Psl trails. a–d, Cumulative surface coverage at 0.5 h (a, b)and 5 h (c, d). Red and black colours indicate traversed (that is, covered bybacterial trajectories) and fresh surface, respectively. Bacteria in the frame at thespecified time points are shown in green. e, Reconstructed bacterial trajectoriesof wild type generated between 16.3 and 18.7 h after inoculation(colour scale indicates the time a given cell spent at each point). f, Psl trail leftbehind by bacteria in the same period, stained by fluorescently conjugatedHippeastrum hybrid (amaryllis) lectin. Scale bars, 10mm.
3 8 8 | N A T U R E | V O L 4 9 7 | 1 6 M A Y 2 0 1 3
Macmillan Publishers Limited. All rights reserved©2013
Cell-tracking algorithms and lectin staining were combined toinvestigate the spatiotemporal aspects of Psl deposition in a mannerthat accounts for the changing speeds (and, therefore, local residencetimes) of cells. Figure 1e shows bacterial trajectories between times t1
(16.3 h after inoculation) and t2 (18.7 h after inoculation). Figure 1fshows the lectin-stained Psl trails generated in this time period(Methods and Supplementary Fig. 6). Surface regions with the bright-est fluorescence signals and, hence, the highest local surface concen-trations of Psl corresponded to those with the longest bacterial visits.Multiple visits to a surface region by different cells and extendedresidence times of a specific cell on the same surface region both servedto increase local Psl concentration.
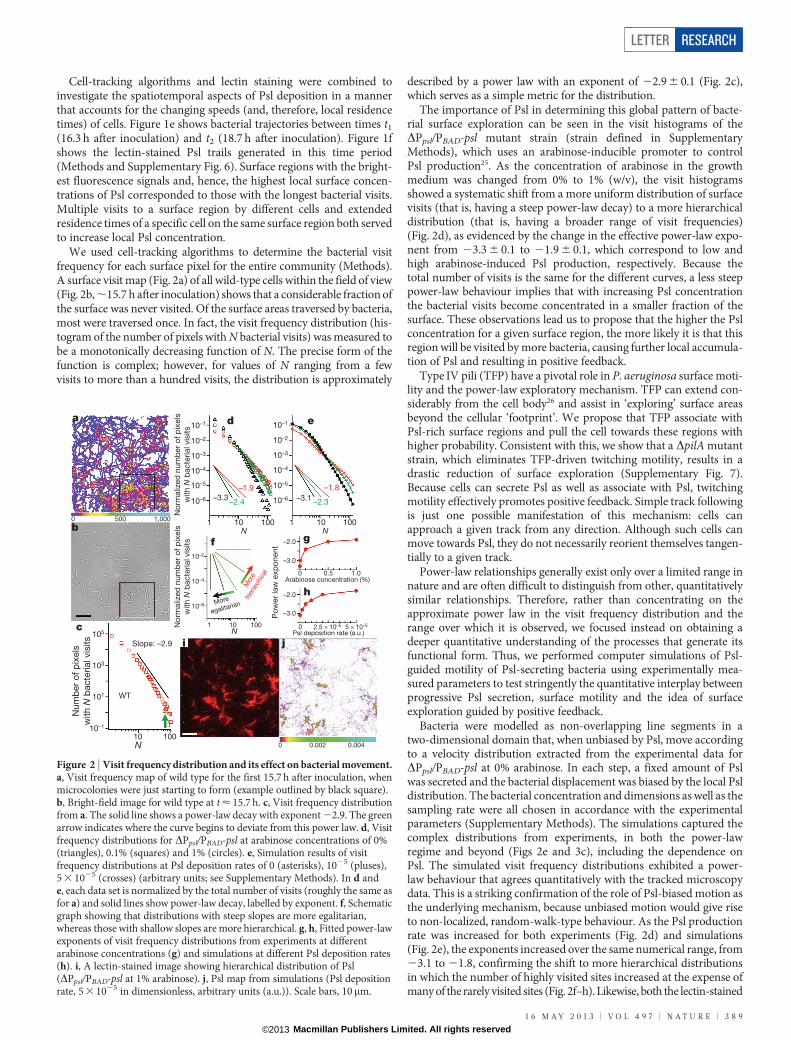
We used cell-tracking algorithms to determine the bacterial visitfrequency for each surface pixel for the entire community (Methods).A surface visit map (Fig. 2a) of all wild-type cells within the field of view(Fig. 2b, ,15.7 h after inoculation) shows that a considerable fraction ofthe surface was never visited. Of the surface areas traversed by bacteria,most were traversed once. In fact, the visit frequency distribution (his-togram of the number of pixels with N bacterial visits) was measured tobe a monotonically decreasing function of N. The precise form of thefunction is complex; however, for values of N ranging from a fewvisits to more than a hundred visits, the distribution is approximately
described by a power law with an exponent of 22.9 6 0.1 (Fig. 2c),which serves as a simple metric for the distribution.
The importance of Psl in determining this global pattern of bacte-rial surface exploration can be seen in the visit histograms of theDPpsl/PBAD-psl mutant strain (strain defined in SupplementaryMethods), which uses an arabinose-inducible promoter to controlPsl production25. As the concentration of arabinose in the growthmedium was changed from 0% to 1% (w/v), the visit histogramsshowed a systematic shift from a more uniform distribution of surfacevisits (that is, having a steep power-law decay) to a more hierarchicaldistribution (that is, having a broader range of visit frequencies)(Fig. 2d), as evidenced by the change in the effective power-law expo-nent from 23.3 6 0.1 to 21.9 6 0.1, which correspond to low andhigh arabinose-induced Psl production, respectively. Because thetotal number of visits is the same for the different curves, a less steeppower-law behaviour implies that with increasing Psl concentrationthe bacterial visits become concentrated in a smaller fraction of thesurface. These observations lead us to propose that the higher the Pslconcentration for a given surface region, the more likely it is that thisregion will be visited by more bacteria, causing further local accumula-tion of Psl and resulting in positive feedback.
Type IV pili (TFP) have a pivotal role in P. aeruginosa surface moti-lity and the power-law exploratory mechanism. TFP can extend con-siderably from the cell body26 and assist in ‘exploring’ surface areasbeyond the cellular ‘footprint’. We propose that TFP associate withPsl-rich surface regions and pull the cell towards these regions withhigher probability. Consistent with this, we show that a DpilA mutantstrain, which eliminates TFP-driven twitching motility, results in adrastic reduction of surface exploration (Supplementary Fig. 7).Because cells can secrete Psl as well as associate with Psl, twitchingmotility effectively promotes positive feedback. Simple track followingis just one possible manifestation of this mechanism: cells canapproach a given track from any direction. Although such cells canmove towards Psl, they do not necessarily reorient themselves tangen-tially to a given track.
Power-law relationships generally exist only over a limited range innature and are often difficult to distinguish from other, quantitativelysimilar relationships. Therefore, rather than concentrating on theapproximate power law in the visit frequency distribution and therange over which it is observed, we focused instead on obtaining adeeper quantitative understanding of the processes that generate itsfunctional form. Thus, we performed computer simulations of Psl-guided motility of Psl-secreting bacteria using experimentally mea-sured parameters to test stringently the quantitative interplay betweenprogressive Psl secretion, surface motility and the idea of surfaceexploration guided by positive feedback.
Bacteria were modelled as non-overlapping line segments in atwo-dimensional domain that, when unbiased by Psl, move accordingto a velocity distribution extracted from the experimental data forDPpsl/PBAD-psl at 0% arabinose. In each step, a fixed amount of Pslwas secreted and the bacterial displacement was biased by the local Psldistribution. The bacterial concentration and dimensions as well as thesampling rate were all chosen in accordance with the experimentalparameters (Supplementary Methods). The simulations captured thecomplex distributions from experiments, in both the power-lawregime and beyond (Figs 2e and 3c), including the dependence onPsl. The simulated visit frequency distributions exhibited a power-law behaviour that agrees quantitatively with the tracked microscopydata. This is a striking confirmation of the role of Psl-biased motion asthe underlying mechanism, because unbiased motion would give riseto non-localized, random-walk-type behaviour. As the Psl productionrate was increased for both experiments (Fig. 2d) and simulations(Fig. 2e), the exponents increased over the same numerical range, from23.1 to 21.8, confirming the shift to more hierarchical distributionsin which the number of highly visited sites increased at the expense ofmany of the rarely visited sites (Fig. 2f–h). Likewise, both the lectin-stained
M
ore
hier
arch
ical
More
egalitarian
a
b
c
d e
f g
h
i j
WT
Slope: –2.9
N
Num
ber
of
pix
els
with N
bacte
rial vis
its
N
No
rmaliz
ed
num
ber
of
pix
els
with N
bacte
rial vis
its
N
N
No
rmaliz
ed
num
ber
of
pix
els
with N
bacte
rial vis
its
Arabinose concentration (%)
Psl deposition rate (a.u.)
Po
wer
law
exp
onent
0 500 1,000
0 0.002 0.004
–3.3 –3.1–2.4 –2.3
–1.9 –1.8
10–1
101
103
105
10 100
10–1
10–2
10–3
10–4
10–5
10–6
1 10 100
10–1
10–2
10–3
10–4
10–5
10–6
1 10 100
10–2
10–4
10–6
1 10 100
–2.0
–3.0
0 0.5 1.0
2.5 × 10⁻⁵ 5 × 10⁻⁵
–3.0
–2.0
0
Figure 2 | Visit frequency distribution and its effect on bacterial movement.a, Visit frequency map of wild type for the first 15.7 h after inoculation, whenmicrocolonies were just starting to form (example outlined by black square).b, Bright-field image for wild type at t < 15.7 h. c, Visit frequency distributionfrom a. The solid line shows a power-law decay with exponent 22.9. The greenarrow indicates where the curve begins to deviate from this power law. d, Visitfrequency distributions for DPpsl/PBAD-psl at arabinose concentrations of 0%(triangles), 0.1% (squares) and 1% (circles). e, Simulation results of visitfrequency distributions at Psl deposition rates of 0 (asterisks), 1025 (pluses),5 3 1025 (crosses) (arbitrary units; see Supplementary Methods). In d ande, each data set is normalized by the total number of visits (roughly the same asfor a) and solid lines show power-law decay, labelled by exponent. f, Schematicgraph showing that distributions with steep slopes are more egalitarian,whereas those with shallow slopes are more hierarchical. g, h, Fitted power-lawexponents of visit frequency distributions from experiments at differentarabinose concentrations (g) and simulations at different Psl deposition rates(h). i, A lectin-stained image showing hierarchical distribution of Psl(DPpsl/PBAD-psl at 1% arabinose). j, Psl map from simulations (Psl depositionrate, 5 3 1025 in dimensionless, arbitrary units (a.u.)). Scale bars, 10mm.
LETTER RESEARCH
1 6 M A Y 2 0 1 3 | V O L 4 9 7 | N A T U R E | 3 8 9
Macmillan Publishers Limited. All rights reserved©2013
Psl image observed in experiments (Fig. 2i) and the simulated Psl map(Fig. 2j) showed the hierarchical nature of the spatial distribution of Psl.
Power laws (such as Zipf’s law17,18 or its continuous generalization,Pareto distributions) are known to describe self-organized systems likethe wealth distributions in capitalist economies18. We found that bac-teria are guided by synergistic rich-get-richer mechanisms. Both simu-lations and experiments indicate that the ability of P. aeruginosa tosecrete Psl and its tendency to associate with Psl result in an explor-atory strategy by which cells go where other cells go most often. (Therange of exponents we observe here for bacteria is essentially the sameas for income distributions27.) This strategy results in a small numberof cells being positioned at locations that are extremely enriched incommunally produced Psl. This arrangement provides the conditionsnecessary for microcolony growth. Notably, these effects persist evenwhen we completely turn off cell division in computer simulations,which indicates that the distribution of cells is a consequence of theirexploratory strategy rather than of growth.
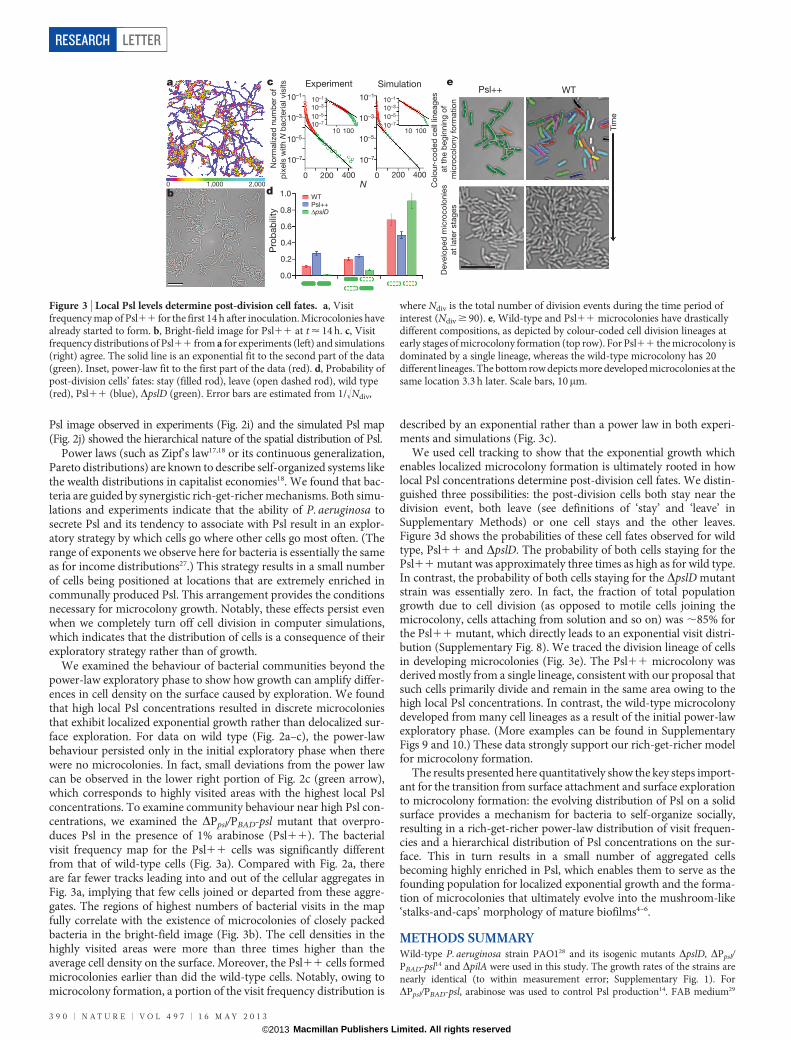
We examined the behaviour of bacterial communities beyond thepower-law exploratory phase to show how growth can amplify differ-ences in cell density on the surface caused by exploration. We foundthat high local Psl concentrations resulted in discrete microcoloniesthat exhibit localized exponential growth rather than delocalized sur-face exploration. For data on wild type (Fig. 2a–c), the power-lawbehaviour persisted only in the initial exploratory phase when therewere no microcolonies. In fact, small deviations from the power lawcan be observed in the lower right portion of Fig. 2c (green arrow),which corresponds to highly visited areas with the highest local Pslconcentrations. To examine community behaviour near high Psl con-centrations, we examined the DPpsl/PBAD-psl mutant that overpro-duces Psl in the presence of 1% arabinose (Psl11). The bacterialvisit frequency map for the Psl11 cells was significantly differentfrom that of wild-type cells (Fig. 3a). Compared with Fig. 2a, thereare far fewer tracks leading into and out of the cellular aggregates inFig. 3a, implying that few cells joined or departed from these aggre-gates. The regions of highest numbers of bacterial visits in the mapfully correlate with the existence of microcolonies of closely packedbacteria in the bright-field image (Fig. 3b). The cell densities in thehighly visited areas were more than three times higher than theaverage cell density on the surface. Moreover, the Psl11 cells formedmicrocolonies earlier than did the wild-type cells. Notably, owing tomicrocolony formation, a portion of the visit frequency distribution is
described by an exponential rather than a power law in both experi-ments and simulations (Fig. 3c).
We used cell tracking to show that the exponential growth whichenables localized microcolony formation is ultimately rooted in howlocal Psl concentrations determine post-division cell fates. We distin-guished three possibilities: the post-division cells both stay near thedivision event, both leave (see definitions of ‘stay’ and ‘leave’ inSupplementary Methods) or one cell stays and the other leaves.Figure 3d shows the probabilities of these cell fates observed for wildtype, Psl11 and DpslD. The probability of both cells staying for thePsl11 mutant was approximately three times as high as for wild type.In contrast, the probability of both cells staying for the DpslD mutantstrain was essentially zero. In fact, the fraction of total populationgrowth due to cell division (as opposed to motile cells joining themicrocolony, cells attaching from solution and so on) was ,85% forthe Psl11 mutant, which directly leads to an exponential visit distri-bution (Supplementary Fig. 8). We traced the division lineage of cellsin developing microcolonies (Fig. 3e). The Psl11 microcolony wasderived mostly from a single lineage, consistent with our proposal thatsuch cells primarily divide and remain in the same area owing to thehigh local Psl concentrations. In contrast, the wild-type microcolonydeveloped from many cell lineages as a result of the initial power-lawexploratory phase. (More examples can be found in SupplementaryFigs 9 and 10.) These data strongly support our rich-get-richer modelfor microcolony formation.
The results presented here quantitatively show the key steps import-ant for the transition from surface attachment and surface explorationto microcolony formation: the evolving distribution of Psl on a solidsurface provides a mechanism for bacteria to self-organize socially,resulting in a rich-get-richer power-law distribution of visit frequen-cies and a hierarchical distribution of Psl concentrations on the sur-face. This in turn results in a small number of aggregated cellsbecoming highly enriched in Psl, which enables them to serve as thefounding population for localized exponential growth and the forma-tion of microcolonies that ultimately evolve into the mushroom-like‘stalks-and-caps’ morphology of mature biofilms4–6.
METHODS SUMMARYWild-type P. aeruginosa strain PAO128 and its isogenic mutants DpslD, DPpsl/PBAD-psl14 and DpilA were used in this study. The growth rates of the strains arenearly identical (to within measurement error; Supplementary Fig. 1). ForDPpsl/PBAD-psl, arabinose was used to control Psl production14. FAB medium29
0 1,000 2,000
a
b
c
d
e
WTPsl++ΔpslD
Experiment Simulation
N
No
rmaliz
ed
num
ber
of
pix
els
with N
bacte
rial vis
its
Psl++ WT
Tim
e
Develo
ped
mic
roco
lonie
s
at
late
r sta
ges
Co
lour-
co
ded
cell
lineag
es
at
the b
eg
innin
g o
f
mic
roco
lony f
orm
atio
n10–1
10–3
10–5
10–7
10–1
10–3
10–5
10–7
10 100
10–1
10–3
10–5
10–7
10–1
10–3
10–5
10–7
0 0200 200400 400
10 100
Pro
bab
ility
1.0
0.8
0.6
0.4
0.2
0.0
Figure 3 | Local Psl levels determine post-division cell fates. a, Visitfrequency map of Psl11 for the first 14 h after inoculation. Microcolonies havealready started to form. b, Bright-field image for Psl11 at t < 14 h. c, Visitfrequency distributions of Psl11 from a for experiments (left) and simulations(right) agree. The solid line is an exponential fit to the second part of the data(green). Inset, power-law fit to the first part of the data (red). d, Probability ofpost-division cells’ fates: stay (filled rod), leave (open dashed rod), wild type(red), Psl11 (blue), DpslD (green). Error bars are estimated from 1/!Ndiv,
where Ndiv is the total number of division events during the time period ofinterest (Ndiv $ 90). e, Wild-type and Psl11 microcolonies have drasticallydifferent compositions, as depicted by colour-coded cell division lineages atearly stages of microcolony formation (top row). For Psl11 the microcolony isdominated by a single lineage, whereas the wild-type microcolony has 20different lineages. The bottom row depicts more developed microcolonies at thesame location 3.3 h later. Scale bars, 10mm.
RESEARCH LETTER
3 9 0 | N A T U R E | V O L 4 9 7 | 1 6 M A Y 2 0 1 3
Macmillan Publishers Limited. All rights reserved©2013
with 0.6 mM glutamate was used for flow cell experiments, which were conductedat 30 uC with a flow rate of 3 ml h21. Flow cells were assembled as previouslydescribed30. The flow was stopped for bacterial inoculation and 20 min of incuba-tion, and then resumed with the initiation of image recording.
Images were made with an Olympus microscope. Bright-field images wererecorded every 3 s. Each data set, which had 18,000–48,000 frames, containedup to 1,000,000 bacteria images. Psl was stained with 100mg ml21 TRITC-labelledHippeastrum hybrid lectin from amaryllis12. The image size was 67mm 3 67mm(1,024 3 1,024 pixels).
In simulations, line segments (representing bacteria) moved within a squaresurface window with periodic boundary conditions. Each bacterium moved withfixed step size at a variable angle deviating from its cell body axis according todistributions drawn from experiments, and deposited Psl at its centre at a tunablerate. This Psl in turn modified the bacterial motion through Psl-concentration-based biasing. In addition, random reorientations happened at a prescribed rate inaccordance with the bacterial mean square displacement from experiments, influ-enced by Psl. The total simulation time was chosen such that the final visit countwas the same as in experiments.
Full Methods and any associated references are available in the online version ofthe paper.
Received 19 September 2012; accepted 8 April 2013.
Published online 8 May 2013.
1. Costerton, J. W., Stewart, P. S. & Greenberg, E. P. Bacterial biofilms: a commoncause of persistent infections. Science 284, 1318–1322 (1999).
2. O’Toole, G. A. & Kolter, R. Flagellar and twitching motility are necessary forPseudomonas aeruginosa biofilm development. Mol. Microbiol. 30, 295–304(1998).
3. O’Toole, G., Kaplan, H. B. & Kolter, R. Biofilm formation as microbial development.Annu. Rev. Microbiol. 54, 49–79 (2000).
4. Stoodley, P., Sauer, K., Davies, D. G. & Costerton, J. W. Biofilms as complexdifferentiated communities. Annu. Rev. Microbiol. 56, 187–209 (2002).
5. Klausen, M., Aaes-Jørgensen, A., Molin, S. & Tolker-Nielsen, T. Involvement ofbacterial migration in the development of complex multicellular structures inPseudomonas aeruginosa biofilms. Mol. Microbiol. 50, 61–68 (2003).
6. Davies, D. G. et al. The involvement of cell-to-cell signals in the development of abacterial biofilm. Science 280, 295–298 (1998).
7. Mann, E. E. & Wozniak, D. J. Pseudomonas biofilm matrix composition and nichebiology. FEMS Microbiol. Rev. 36, 893–916 (2012).
8. Lyczak, J. B., Cannon, C. L. & Pier, G. B. Establishment of Pseudomonas aeruginosainfection: lessons from a versatile opportunist. Microbes Infect. 2, 1051–1060(2000).
9. Tatterson, L. E., Poschet, J. F., Firoved, A., Skidmore, J. & Deretic, V. CFTR andpseudomonas infections in cystic fibrosis. Front. Biosci. 6, d890–897 (2001).
10. Singh, P. K. et al. Quorum-sensing signals indicate that cystic fibrosis lungs areinfected with bacterial biofilms. Nature 407, 762–764 (2000).
11. Friedman, L. & Kolter, R. Two genetic loci produce distinct carbohydrate-richstructural components of the Pseudomonas aeruginosa biofilm matrix. J. Bacteriol.186, 4457–4465 (2004).
12. Ma, L. Y., Lu, H. P., Sprinkle, A., Parsek, M. R. & Wozniak, D. J. Pseudomonasaeruginosa Psl is a galactose- and mannose-rich exopolysaccharide. J. Bacteriol.189, 8353–8356 (2007).
13. Byrd, M. S. et al. Genetic and biochemical analyses of the Pseudomonas aeruginosaPsl exopolysaccharide reveal overlapping roles for polysaccharide synthesisenzymes in Psl and LPS production. Mol. Microbiol. 73, 622–638 (2009).
14. Ma, L., Jackson, K. D., Landry, R. M., Parsek, M. R. & Wozniak, D. J. Analysis ofPseudomonas aeruginosa conditional psl variants reveals roles for the psl
polysaccharide in adhesion and maintaining biofilm structure postattachment.J. Bacteriol. 188, 8213–8221 (2006).
15. Byrd, M. S., Pang, B., Mishra, M., Swords, W. E. & Wozniak, D. J. The Pseudomonasaeruginosa exopolysaccharide Psl facilitates surface adherence and NF-kBactivation in A549 cells. mBio 1, e00140–10 (2010).
16. Gibiansky, M. L. et al. Bacteria use type IV pili to walk upright and detach fromsurfaces. Science 330, 197 (2010).
17. Newman, M. E. J. Power laws, Pareto distributions and Zipf’s law. Contemp. Phys.46, 323–351 (2005).
18. Gabaix, X. Power laws in economics and finance. Annu. Rev. Econ. 1, 255–294(2009).
19. Eagon, R. G. Composition of an extracellular slime produced by Pseudomonasaeruginosa. Can. J. Microbiol. 8, 585–586 (1962).
20. Sutherland, I. W. The biofilm matrix: an immobilized but dynamic microbialenvironment. Trends Microbiol. 9, 222–227 (2001).
21. Whitchurch, C. B., Tolker-Nielsen, T., Ragas, P. C. & Mattick, J. S. Extracellular DNArequired for bacterial biofilm formation. Science 295, 1487 (2002).
22. Colvin, K. M. et al. The Pel and Psl polysaccharides provide Pseudomonasaeruginosa structural redundancy within the biofilm matrix. Environ. Microbiol. 14,1913–1928 (2012).
23. Monroe, D. Looking for chinks in the armor of bacterial biofilms. PLoS Biol. 5, e307(2007).
24. Flemming, H. C., Neu, T. R. & Wozniak, D. J. The EPS matrix: the ‘‘house of biofilmcells’’. J. Bacteriol. 189, 7945–7947 (2007).
25. Newman, J. R. & Fuqua, C. Broad-host-range expression vectors that carry thel-arabinose-inducible Escherichia coli araBAD promoter and the araC regulator.Gene 227, 197–203 (1999).
26. Skerker, J. M. & Berg, H. C. Direct observation of extension and retraction of type IVpili. Proc. Natl Acad. Sci. USA 98, 6901–6904 (2001).
27. Solomon, S. & Richmond, P. Power laws of wealth, market order volumes andmarket returns. Physica A 299, 188–197 (2001).
28. Holloway, B. W. Genetic recombination in Pseudomonas aeruginosa. J. Gen.Microbiol. 13, 572–581 (1955).
29. Heydorn, A. et al. Experimental reproducibility in flow-chamber biofilms.Microbiology 146, 2409–2415 (2000).
30. Sternberg,C.& Tolker-Nielsen,T.Growingandanalyzing biofilms in flowcells. Curr.Protocols Microbiol. 21, 1B.2.1–1B.2.17 (2006).
Supplementary Information is available in the online version of the paper.
Acknowledgements K.Z., B.S.T., M.R.P. and G.C.L.W. are supported by the US NationalInstitutes of Health (NIH 1RO1HL087920). K.Z. and G.C.L.W. also acknowledge supportfrom the US National Science Foundation (NSF DMR1106106) and a UCLATransdisciplinary Seed Grant. B.S.T., J.J.H. and M.R.P. also acknowledge support fromthe NIH (R01AI077628, R01AI081983, R56AI061396) and NSF (MCB0822405).B.S.T. is supported by the Cystic Fibrosis Foundation Postdoctoral Fellowship(TSENG11F0). J.J.H. was supported by a postdoctoral fellowship from the NaturalSciences and Engineering Research Council of Canada. B.B. and E.L. acknowledgesupport from the NSF under DMR-1006430 (E.L.) and DGE-0824162 (B.B.). Theauthors would like to thank J. Copic for discussions and R. J. Siehnel for technicalassistance. We dedicate this paper to the memory of M. Shannon.
Author Contributions G.C.L.W., M.R.P. and K.Z. conceived the project. K.Z., B.S.T., M.R.P.and G.C.L.W. designed studies. K.Z. and B.S.T. performed experimental measurements.K.Z. and G.C.L.W. performed image analysis. F.J. helped in performing image analysis.M.L.G. helped in collecting experimental data. B.S.T., J.J.H. and M.R.P. constructedstrains. B.B. and E.L. designed the model and performed computer simulations. K.Z.,B.S.T., B.B., E.L., M.R.P. and G.C.L.W. wrote the paper. All authors discussed the resultsand commented on the manuscript.
Author Information Reprints and permissions information is available atwww.nature.com/reprints. The authors declare no competing financial interests.Readers are welcome to comment on the online version of the paper. Correspondenceand requests for materials should be addressed to G.C.L.W. ([email protected]),M.R.P. ([email protected]) or E.L. ([email protected]).
LETTER RESEARCH
1 6 M A Y 2 0 1 3 | V O L 4 9 7 | N A T U R E | 3 9 1
Macmillan Publishers Limited. All rights reserved©2013
METHODSStrains and growth conditions. Pseudomonas aeruginosa strain PAO1 wildtype28 and its isogenic mutants DpslD, the psl-inducible strain DPpsl/PBAD-psland DpilA were used in this study. The growth rates of the strains were nearlyidentical (to within measurement error; Supplementary Fig. 1). For strainDPpsl/PBAD-psl, different amounts of arabinose (Sigma-Aldrich; 1%, 0.1% and0.005% were used in this work) were added into the medium to control theproduction of Psl14.
FAB medium29 with 0.6 mM glutamate (Sigma-Aldrich) as the carbon sourcewas used for flow cell experiments. An inoculum was prepared by growing strainsin test tubes containing FAB with 30 mM glutamate, shaking at 220 r.p.m. and37 uC to D600nm ,0.5. Cultures were then diluted to D600nm ,0.01 in FAB mediumwith 0.6 mM glutamate, which was used for injection into the flow chamber.Flow cell assembly, sterilization and washing of the system. The flow cell waspurchased from the Department of Systems Biology, Technical University ofDenmark and assembled as previously described30. The assembled flow cell wasconnected to a syringe through a 0.22-mm filter (Fisher Scientific) using silicontubing (Dow Corning). Then the whole system was sterilized overnight with 3%H2O2 (Fisher Scientific) at 3 ml h21 using a syringe pump (KD Scientific). Afterthe sterilization, autoclaved, deionized water was used to wash the whole systemovernight. The system was washed again using FAB medium with 0.6 mM glu-tamate before starting the inoculation of the bacteria into the flow cell. The flowwas stopped for bacterial inoculation and 20 min of incubation, and then resumedwith the initiation of image recording. Different flow rates have recently beenreported to have an effect on bacterial surface behaviour31, and it will be interestingto using large-scale tracking methods in this context. In this work, the flow cellexperiments were conducted at 30 uC with a flow rate of 3 ml h21.Data acquisition. The images were made using an EMCCD camera (Andor iXon)using IQ software (Andor) on an Olympus IX81 microscope equipped with ZeroDrift autofocus system. The bright-field images were recorded every 3 s for a totalrecording time of about 20 h (varying by strain). Each data set, which had 18,000–48,000 frames, contained up to 1,000,000 bacteria images. The image size is 67mm3 67mm (1,024 3 1,024 pixels).Lectin staining. The Psl trails left by bacteria were stained with TRITC-labelledHippeastrum hybrid (amaryllis) (HHA) lectin (EY laboratories)12. Flow was sus-pended and 0.3 ml of 100mg ml21 TRITC-HHA in FAB medium with 0.6 mMglutamate was injected upstream of the inlet flow. During the injection, the flow
chamber was monitored through the camera to make sure there was no shift ordisturbance of the stage due to injection. The flow chamber was stained for 15 minwithout flow and then washed for 15 min with flow at a flow rate of 3 ml h21 in thedark before imaging.Image analysis, surface coverage map and visit frequency map. Images wereanalysed as previously described16. In Fig. 1a–e, we used the area of each movingcell to generate the surface coverage from the bacterial trajectories. The visitfrequency distributions are generated at full data resolution; for the visit maps,we used the centre of the cell to mark the trail, and spread each of these marks overa square patch eight pixels (,0.5mm) wide, in accordance with bacterium width.The distribution of Psl on the PAO1 surface is expected to be more complex32, butthis will amount to a more complex point spread function and is not expected toalter the results qualitatively.Simulation of Psl-guided motility of Psl-secreting bacteria. The computersimulations used a two-dimensional model in which an exponentially growingnumber of line segments of unit length moved within a square, periodic domain ofside length 35, approximately corresponding to the experimental viewing window.Each bacterium was assigned a fixed step size and stepped with a variable angle.Both the step size and the stepping angle were drawn from the experimentallydetermined motion distribution for the DPpsl/PBAD-psl strain at an arabinoseconcentration of 0% (that is, in the absence of Psl). Starting from a randomnon-overlapping configuration, all bacteria propagated in discrete time steps(Dt 5 3 s), either moving at their constant, assigned rate, keeping their directorfixed, or randomly reorienting. Reorientations occurred at a frequency 3.7%,determined by the mean squared displacement of the bacteria in the experiment.The effect of arabinose was represented by letting each bacterium deposit Psl at itscentre at a tunable rate. The surface accumulation of Psl was recorded in element-ary squares of side length 1/29 (corresponding to the experimental pixel size). Themotion was in turn biased according to the presence of Psl within the vicinity of theleading pole of the bacterium. The total simulation time was chosen such that thefinal visit count was the same as in experiments. Over this window, we sampledindividual bacterial trajectories as well as visit frequencies of all pixels(Supplementary Methods).
31. Lecuyer, S. et al. Shear stress increases the residence time of adhesion ofPseudomonas aeruginosa. Biophys. J. 100, 341–350 (2011).
32. Ma, L. et al. Assembly and development of the Pseudomonas aeruginosa biofilmmatrix. PLoS Pathog. 5, e1000354 (2009).
RESEARCH LETTER
Macmillan Publishers Limited. All rights reserved©2013