ps-2.kev009.comps-2.kev009.com/basil.holloway/ALL PDF/sg245657.pdfps-2.kev009.com
210
WebSphere V3 Performance Tuning Guide Ken Ueno, Tom Alcott, Jeff Carlson, Andrew Dunshea, Hajo Kitzhöfer, Yuko Hayakawa, Frank Mogus, Colin D. Wordsworth International Technical Support Organization SG24-5657-00 www.redbooks.ibm.com
Transcript of ps-2.kev009.comps-2.kev009.com/basil.holloway/ALL PDF/sg245657.pdfps-2.kev009.com

WebSphere V3Performance Tuning Guide
Ken Ueno, Tom Alcott, Jeff Carlson, Andrew Dunshea, Hajo Kitzhöfer,Yuko Hayakawa, Frank Mogus, Colin D. Wordsworth
International Technical Support Organization
SG24-5657-00
www.redbooks.ibm.com


International Technical Support Organization SG24-5657-00
WebSphere V3Performance Tuning Guide
March 2000

© Copyright International Business Machines Corporation 2000. All rights reserved.Note to U.S Government Users - Documentation related to restricted rights - Use, duplication or disclosure is subject to restrictionsset forth in GSA ADP Schedule Contract with IBM Corp.
First Edition (March 2000)
This edition applies to:
• IBM WebSphere Application Server Version 3.02• IBM HTTP Server Version 1.3.6.2• IBM Java Development Kit Version 1.1.6.9
for use with the AIX V4.3.2 operating system.
Comments may be addressed to:IBM Corporation, International Technical Support OrganizationDept. HZ8 Building 678P.O. Box 12195Research Triangle Park, NC 27709-2195
When you send information to IBM, you grant IBM a non-exclusive right to use or distribute the information in anyway it believes appropriate without incurring any obligation to you.
Before using this information and the product it supports, be sure to read the general information in Appendix B,“Special notices” on page 185.
Take Note!

Contents
Preface . . . . . . . . . . . . . . . . . . . . . . . . . . . . . . . . . . . . . . . . . . . . . . . . . . . . . . viiThe team that wrote this redbook . . . . . . . . . . . . . . . . . . . . . . . . . . . . . . . . . . . . . . viiComments welcome . . . . . . . . . . . . . . . . . . . . . . . . . . . . . . . . . . . . . . . . . . . . . . . . . ix
Chapter 1. Overview of WebSphere Application Server V3 . . . . . . . . . . . . .11.1 WebSphere Application Server V3 . . . . . . . . . . . . . . . . . . . . . . . . . . . . . . .11.2 Standard Edition . . . . . . . . . . . . . . . . . . . . . . . . . . . . . . . . . . . . . . . . . . . . .31.3 Advanced Edition . . . . . . . . . . . . . . . . . . . . . . . . . . . . . . . . . . . . . . . . . . . .3
Chapter 2. Performance tuning approach . . . . . . . . . . . . . . . . . . . . . . . . . . .72.1 WebSphere Application Server V3 topologies . . . . . . . . . . . . . . . . . . . . . . .8
2.1.1 Topology 1: single machine. . . . . . . . . . . . . . . . . . . . . . . . . . . . . . . . .82.1.2 Topology 2: separating the database server from WAS . . . . . . . . . . . .92.1.3 Topology 3: multiple application servers . . . . . . . . . . . . . . . . . . . . . .102.1.4 Topology 4: advanced topology. . . . . . . . . . . . . . . . . . . . . . . . . . . . .102.1.5 Our test application . . . . . . . . . . . . . . . . . . . . . . . . . . . . . . . . . . . . . .11
2.2 Network and hardware configuration . . . . . . . . . . . . . . . . . . . . . . . . . . . . .13
Chapter 3. AIX TCP/IP tuning . . . . . . . . . . . . . . . . . . . . . . . . . . . . . . . . . . . .153.1 Network tuning with no command . . . . . . . . . . . . . . . . . . . . . . . . . . . . . . .153.2 Tuning parameter summary . . . . . . . . . . . . . . . . . . . . . . . . . . . . . . . . . . .19
Chapter 4. Web Server: IBM HTTP Server 1.3.6 . . . . . . . . . . . . . . . . . . . . . .214.1 Process handling . . . . . . . . . . . . . . . . . . . . . . . . . . . . . . . . . . . . . . . . . . .214.2 Connection . . . . . . . . . . . . . . . . . . . . . . . . . . . . . . . . . . . . . . . . . . . . . . . .224.3 Resource usage . . . . . . . . . . . . . . . . . . . . . . . . . . . . . . . . . . . . . . . . . . . .234.4 Name resolution . . . . . . . . . . . . . . . . . . . . . . . . . . . . . . . . . . . . . . . . . . . .244.5 Fast Response Cache Accelerator . . . . . . . . . . . . . . . . . . . . . . . . . . . . . .244.6 APAR for Web server performance . . . . . . . . . . . . . . . . . . . . . . . . . . . . . .27
Chapter 5. WebSphere Engine . . . . . . . . . . . . . . . . . . . . . . . . . . . . . . . . . . .295.1 JVM . . . . . . . . . . . . . . . . . . . . . . . . . . . . . . . . . . . . . . . . . . . . . . . . . . . . .30
5.1.1 Selecting a JVM . . . . . . . . . . . . . . . . . . . . . . . . . . . . . . . . . . . . . . . .305.1.2 Tuning the JVM . . . . . . . . . . . . . . . . . . . . . . . . . . . . . . . . . . . . . . . . .305.1.3 JVM heap size . . . . . . . . . . . . . . . . . . . . . . . . . . . . . . . . . . . . . . . . .315.1.4 JIT. . . . . . . . . . . . . . . . . . . . . . . . . . . . . . . . . . . . . . . . . . . . . . . . . . .335.1.5 Garbage collection . . . . . . . . . . . . . . . . . . . . . . . . . . . . . . . . . . . . . .345.1.6 Java stack and native thread stack size . . . . . . . . . . . . . . . . . . . . . .34
5.2 Transport queue . . . . . . . . . . . . . . . . . . . . . . . . . . . . . . . . . . . . . . . . . . . .365.2.1 Queue type: OSE . . . . . . . . . . . . . . . . . . . . . . . . . . . . . . . . . . . . . . .365.2.2 Transport type. . . . . . . . . . . . . . . . . . . . . . . . . . . . . . . . . . . . . . . . . .375.2.3 Maximum connections. . . . . . . . . . . . . . . . . . . . . . . . . . . . . . . . . . . .385.2.4 Queue type for servlet redirector . . . . . . . . . . . . . . . . . . . . . . . . . . . .38
5.3 Servlets Auto Reload . . . . . . . . . . . . . . . . . . . . . . . . . . . . . . . . . . . . . . . .405.4 EJB Container. . . . . . . . . . . . . . . . . . . . . . . . . . . . . . . . . . . . . . . . . . . . . .41
5.4.1 Cache size . . . . . . . . . . . . . . . . . . . . . . . . . . . . . . . . . . . . . . . . . . . .425.4.2 Cache preferred limit . . . . . . . . . . . . . . . . . . . . . . . . . . . . . . . . . . . . .425.4.3 Cache absolute limit . . . . . . . . . . . . . . . . . . . . . . . . . . . . . . . . . . . . .435.4.4 Cache cleanup interval . . . . . . . . . . . . . . . . . . . . . . . . . . . . . . . . . . .435.4.5 Option A and option C caching performance considerations . . . . . . .445.4.6 Number of containers . . . . . . . . . . . . . . . . . . . . . . . . . . . . . . . . . . . .45
© Copyright IBM Corp. 2000 iii

5.5 ORB . . . . . . . . . . . . . . . . . . . . . . . . . . . . . . . . . . . . . . . . . . . . . . . . . . . . 45
Chapter 6. Security . . . . . . . . . . . . . . . . . . . . . . . . . . . . . . . . . . . . . . . . . . . 496.1 WebSphere security overview . . . . . . . . . . . . . . . . . . . . . . . . . . . . . . . . . 496.2 Configuring security . . . . . . . . . . . . . . . . . . . . . . . . . . . . . . . . . . . . . . . . . 51
6.2.1 Enabling security . . . . . . . . . . . . . . . . . . . . . . . . . . . . . . . . . . . . . . . 516.2.2 Security cache timeout. . . . . . . . . . . . . . . . . . . . . . . . . . . . . . . . . . . 526.2.3 SSL V3 timeout . . . . . . . . . . . . . . . . . . . . . . . . . . . . . . . . . . . . . . . . 53
6.3 The invoker servlet . . . . . . . . . . . . . . . . . . . . . . . . . . . . . . . . . . . . . . . . . 54
Chapter 7. Database tuning . . . . . . . . . . . . . . . . . . . . . . . . . . . . . . . . . . . . 577.1 The WebSphere administrative repository . . . . . . . . . . . . . . . . . . . . . . . . 57
7.1.1 Serious event reporting . . . . . . . . . . . . . . . . . . . . . . . . . . . . . . . . . . 597.2 DataSource object settings . . . . . . . . . . . . . . . . . . . . . . . . . . . . . . . . . . . 61
7.2.1 Connection pooling . . . . . . . . . . . . . . . . . . . . . . . . . . . . . . . . . . . . . 617.3 Prepared statements . . . . . . . . . . . . . . . . . . . . . . . . . . . . . . . . . . . . . . . . 64
7.3.1 Prepared statement cache . . . . . . . . . . . . . . . . . . . . . . . . . . . . . . . . 647.3.2 Prepared statement key cache. . . . . . . . . . . . . . . . . . . . . . . . . . . . . 65
7.4 UDB configuration . . . . . . . . . . . . . . . . . . . . . . . . . . . . . . . . . . . . . . . . . . 667.4.1 Buffpage . . . . . . . . . . . . . . . . . . . . . . . . . . . . . . . . . . . . . . . . . . . . . 677.4.2 Applheapsz . . . . . . . . . . . . . . . . . . . . . . . . . . . . . . . . . . . . . . . . . . . 707.4.3 Pckcachesz . . . . . . . . . . . . . . . . . . . . . . . . . . . . . . . . . . . . . . . . . . . 717.4.4 Maxappls . . . . . . . . . . . . . . . . . . . . . . . . . . . . . . . . . . . . . . . . . . . . . 717.4.5 Dft_degree. . . . . . . . . . . . . . . . . . . . . . . . . . . . . . . . . . . . . . . . . . . . 717.4.6 Locklist . . . . . . . . . . . . . . . . . . . . . . . . . . . . . . . . . . . . . . . . . . . . . . 727.4.7 Maxlocks . . . . . . . . . . . . . . . . . . . . . . . . . . . . . . . . . . . . . . . . . . . . . 727.4.8 Locktimeout . . . . . . . . . . . . . . . . . . . . . . . . . . . . . . . . . . . . . . . . . . . 737.4.9 Maxagents . . . . . . . . . . . . . . . . . . . . . . . . . . . . . . . . . . . . . . . . . . . . 73
Chapter 8. Session management . . . . . . . . . . . . . . . . . . . . . . . . . . . . . . . . 758.1 Session information . . . . . . . . . . . . . . . . . . . . . . . . . . . . . . . . . . . . . . . . . 758.2 Keeping session information in memory . . . . . . . . . . . . . . . . . . . . . . . . . 758.3 Persistent sessions . . . . . . . . . . . . . . . . . . . . . . . . . . . . . . . . . . . . . . . . . 76
8.3.1 Database/Datasource configuration . . . . . . . . . . . . . . . . . . . . . . . . . 768.3.2 Session Manager configuration . . . . . . . . . . . . . . . . . . . . . . . . . . . . 76
8.4 Tuning the Session Manager . . . . . . . . . . . . . . . . . . . . . . . . . . . . . . . . . . 778.4.1 The Invalidate Time setting . . . . . . . . . . . . . . . . . . . . . . . . . . . . . . . 778.4.2 Monitor and estimate Invalidate Time. . . . . . . . . . . . . . . . . . . . . . . . 788.4.3 Tuning parameters on the Tuning tab . . . . . . . . . . . . . . . . . . . . . . . 798.4.4 Multirow sessions . . . . . . . . . . . . . . . . . . . . . . . . . . . . . . . . . . . . . . 808.4.5 Using cache. . . . . . . . . . . . . . . . . . . . . . . . . . . . . . . . . . . . . . . . . . . 818.4.6 Using manual update . . . . . . . . . . . . . . . . . . . . . . . . . . . . . . . . . . . . 828.4.7 Using native access . . . . . . . . . . . . . . . . . . . . . . . . . . . . . . . . . . . . . 828.4.8 Allow overflow . . . . . . . . . . . . . . . . . . . . . . . . . . . . . . . . . . . . . . . . . 828.4.9 Base memory size . . . . . . . . . . . . . . . . . . . . . . . . . . . . . . . . . . . . . . 83
Chapter 9. Performance test tools . . . . . . . . . . . . . . . . . . . . . . . . . . . . . . . 859.1 WebStone . . . . . . . . . . . . . . . . . . . . . . . . . . . . . . . . . . . . . . . . . . . . . . . . 859.2 AKtools . . . . . . . . . . . . . . . . . . . . . . . . . . . . . . . . . . . . . . . . . . . . . . . . . . 859.3 Apache Bench . . . . . . . . . . . . . . . . . . . . . . . . . . . . . . . . . . . . . . . . . . . . . 869.4 Rational Suite Performance Studio . . . . . . . . . . . . . . . . . . . . . . . . . . . . . 879.5 JMeter . . . . . . . . . . . . . . . . . . . . . . . . . . . . . . . . . . . . . . . . . . . . . . . . . . . 879.6 WebLoad . . . . . . . . . . . . . . . . . . . . . . . . . . . . . . . . . . . . . . . . . . . . . . . . . 889.7 LoadRunner. . . . . . . . . . . . . . . . . . . . . . . . . . . . . . . . . . . . . . . . . . . . . . . 88
iv WebSphere V3 Performance Tuning Guide
Chapter 10. Monitoring tools . . . . . . . . . . . . . . . . . . . . . . . . . . . . . . . . . . . .8910.1 WebSphere Application Server Resource Analyzer . . . . . . . . . . . . . . . . .89
10.1.1 Enterprise beans . . . . . . . . . . . . . . . . . . . . . . . . . . . . . . . . . . . . . . .9110.1.2 Servlets . . . . . . . . . . . . . . . . . . . . . . . . . . . . . . . . . . . . . . . . . . . . . .9610.1.3 Sessions . . . . . . . . . . . . . . . . . . . . . . . . . . . . . . . . . . . . . . . . . . . . .9910.1.4 System Resources . . . . . . . . . . . . . . . . . . . . . . . . . . . . . . . . . . . .10110.1.5 DB pools . . . . . . . . . . . . . . . . . . . . . . . . . . . . . . . . . . . . . . . . . . . .103
10.2 AIX performance tools. . . . . . . . . . . . . . . . . . . . . . . . . . . . . . . . . . . . . .10710.3 Managing memory resources . . . . . . . . . . . . . . . . . . . . . . . . . . . . . . . .107
10.3.1 Monitoring memory with vmstat . . . . . . . . . . . . . . . . . . . . . . . . . . .10710.3.2 Monitoring memory with sar . . . . . . . . . . . . . . . . . . . . . . . . . . . . .10910.3.3 Monitoring memory with lsps . . . . . . . . . . . . . . . . . . . . . . . . . . . . .10910.3.4 Monitoring memory with ps . . . . . . . . . . . . . . . . . . . . . . . . . . . . . .11010.3.5 Monitoring memory with svmon . . . . . . . . . . . . . . . . . . . . . . . . . . .110
10.4 Managing CPU resources . . . . . . . . . . . . . . . . . . . . . . . . . . . . . . . . . . .11210.4.1 Monitoring the CPU with vmstat . . . . . . . . . . . . . . . . . . . . . . . . . .11310.4.2 Monitoring the CPU with sar . . . . . . . . . . . . . . . . . . . . . . . . . . . . .11410.4.3 Monitoring the CPU with time . . . . . . . . . . . . . . . . . . . . . . . . . . . .11510.4.4 Checking active CPUs using cpu_state . . . . . . . . . . . . . . . . . . . . .115
10.5 Managing network resources . . . . . . . . . . . . . . . . . . . . . . . . . . . . . . . .11610.5.1 Monitoring the network with netstat . . . . . . . . . . . . . . . . . . . . . . . .116
10.6 Tuning methodology example with changing JVM parameters . . . . . . .11910.6.1 Case 1: -mx64m . . . . . . . . . . . . . . . . . . . . . . . . . . . . . . . . . . . . . .11910.6.2 Case 2: -ms32m, -mx64m . . . . . . . . . . . . . . . . . . . . . . . . . . . . . . .12410.6.3 Case 3: -ms64m, -mx64m . . . . . . . . . . . . . . . . . . . . . . . . . . . . . . .129
Chapter 11. WebSphere Application Server Site Analyzer . . . . . . . . . . . .13311.1 What is WebSphere Application Server Site Analyzer? . . . . . . . . . . . . .13311.2 Why do I need WebSphere Application Server Site Analyzer? . . . . . . .134
11.2.1 Features of WebSphere Application Server Site Analyzer . . . . . . .13511.2.2 Content analysis . . . . . . . . . . . . . . . . . . . . . . . . . . . . . . . . . . . . . .13511.2.3 Usage analysis . . . . . . . . . . . . . . . . . . . . . . . . . . . . . . . . . . . . . . .13611.2.4 Visualization and reports . . . . . . . . . . . . . . . . . . . . . . . . . . . . . . . .13711.2.5 Usability . . . . . . . . . . . . . . . . . . . . . . . . . . . . . . . . . . . . . . . . . . . .13811.2.6 Technology . . . . . . . . . . . . . . . . . . . . . . . . . . . . . . . . . . . . . . . . . .13911.2.7 Client/server configuration. . . . . . . . . . . . . . . . . . . . . . . . . . . . . . .140
Chapter 12. AFS performance tuning guide . . . . . . . . . . . . . . . . . . . . . . .14112.1 Overview. . . . . . . . . . . . . . . . . . . . . . . . . . . . . . . . . . . . . . . . . . . . . . . .14112.2 Communications with the fileserver process . . . . . . . . . . . . . . . . . . . . .14212.3 Commonly used parameters . . . . . . . . . . . . . . . . . . . . . . . . . . . . . . . . .14412.4 Overview of AFS 3.5 File Server changes . . . . . . . . . . . . . . . . . . . . . . .14612.5 AFS 3.5 File Server performance improvements . . . . . . . . . . . . . . . . . .146
12.5.1 POSIX threads . . . . . . . . . . . . . . . . . . . . . . . . . . . . . . . . . . . . . . .14712.5.2 RX slow start . . . . . . . . . . . . . . . . . . . . . . . . . . . . . . . . . . . . . . . . .14712.5.3 File descriptor caching . . . . . . . . . . . . . . . . . . . . . . . . . . . . . . . . .14712.5.4 Reduced lock contention . . . . . . . . . . . . . . . . . . . . . . . . . . . . . . . .14812.5.5 Overload processing . . . . . . . . . . . . . . . . . . . . . . . . . . . . . . . . . . .14812.5.6 Buffer management . . . . . . . . . . . . . . . . . . . . . . . . . . . . . . . . . . . .150
12.6 AFS 3.5 File Server parameter changes . . . . . . . . . . . . . . . . . . . . . . . .15112.7 Scenarios . . . . . . . . . . . . . . . . . . . . . . . . . . . . . . . . . . . . . . . . . . . . . . .152
12.7.1 Scenario #1. . . . . . . . . . . . . . . . . . . . . . . . . . . . . . . . . . . . . . . . . .15212.7.2 Scenario #2. . . . . . . . . . . . . . . . . . . . . . . . . . . . . . . . . . . . . . . . . .154
v

12.7.3 Scenario #3 . . . . . . . . . . . . . . . . . . . . . . . . . . . . . . . . . . . . . . . . . 15712.7.4 Scenario #4 . . . . . . . . . . . . . . . . . . . . . . . . . . . . . . . . . . . . . . . . . 158
12.8 Debugging tools and example output . . . . . . . . . . . . . . . . . . . . . . . . . . 16012.8.1 RXDEBUG incorporated in the meltdown script . . . . . . . . . . . . . . 16012.8.2 tcpdump. . . . . . . . . . . . . . . . . . . . . . . . . . . . . . . . . . . . . . . . . . . . 16212.8.3 netstat . . . . . . . . . . . . . . . . . . . . . . . . . . . . . . . . . . . . . . . . . . . . . 164
12.9 Summary . . . . . . . . . . . . . . . . . . . . . . . . . . . . . . . . . . . . . . . . . . . . . . . 165
Appendix A. TCP/IP overview and tuning . . . . . . . . . . . . . . . . . . . . . . . . . . .167A.1 TCP/IP overview . . . . . . . . . . . . . . . . . . . . . . . . . . . . . . . . . . . . . . . . . . . . . .167A.2 Maximum Transmission Unit (MTU). . . . . . . . . . . . . . . . . . . . . . . . . . . . . . . .169A.3 Adapter queue size . . . . . . . . . . . . . . . . . . . . . . . . . . . . . . . . . . . . . . . . . . . .169
A.3.1 Transmit and receive queues. . . . . . . . . . . . . . . . . . . . . . . . . . . . . . . . .170A.3.2 Adapter queue settings . . . . . . . . . . . . . . . . . . . . . . . . . . . . . . . . . . . . .171A.3.3 Adapter tuning recommendations . . . . . . . . . . . . . . . . . . . . . . . . . . . . .172
A.4 TCP maximum segment size (MSS) . . . . . . . . . . . . . . . . . . . . . . . . . . . . . . .172A.4.1 Subnetting and the subnetsarelocal. . . . . . . . . . . . . . . . . . . . . . . . . . . .172A.4.2 TCP data flow . . . . . . . . . . . . . . . . . . . . . . . . . . . . . . . . . . . . . . . . . . . .174
A.5 TCP sliding window . . . . . . . . . . . . . . . . . . . . . . . . . . . . . . . . . . . . . . . . . . . .175A.6 Socket layer . . . . . . . . . . . . . . . . . . . . . . . . . . . . . . . . . . . . . . . . . . . . . . . . . .177A.7 Communication subsystem memory management . . . . . . . . . . . . . . . . . . . .178A.8 Interface specific network options for AIX 4.3.3 . . . . . . . . . . . . . . . . . . . . . . .181
A.8.1 Implementation overview . . . . . . . . . . . . . . . . . . . . . . . . . . . . . . . . . . . .182A.8.2 How to use the new options. . . . . . . . . . . . . . . . . . . . . . . . . . . . . . . . . .182A.8.3 References for the ISNO . . . . . . . . . . . . . . . . . . . . . . . . . . . . . . . . . . . .183
Appendix B. Special notices . . . . . . . . . . . . . . . . . . . . . . . . . . . . . . . . . . . . . .185
Appendix C. Related publications . . . . . . . . . . . . . . . . . . . . . . . . . . . . . . . . .187C.1 IBM Redbooks . . . . . . . . . . . . . . . . . . . . . . . . . . . . . . . . . . . . . . . . . . . . . . . .187C.2 IBM Redbooks collections . . . . . . . . . . . . . . . . . . . . . . . . . . . . . . . . . . . . . . .187C.3 Other resources . . . . . . . . . . . . . . . . . . . . . . . . . . . . . . . . . . . . . . . . . . . . . . .187C.4 Referenced Web sites . . . . . . . . . . . . . . . . . . . . . . . . . . . . . . . . . . . . . . . . . .188
How to get IBM Redbooks . . . . . . . . . . . . . . . . . . . . . . . . . . . . . . . . . . . . . 189IBM Redbooks fax order form . . . . . . . . . . . . . . . . . . . . . . . . . . . . . . . . . . . . . . . .190
Index . . . . . . . . . . . . . . . . . . . . . . . . . . . . . . . . . . . . . . . . . . . . . . . . . . . . . . 191
IBM Redbooks review . . . . . . . . . . . . . . . . . . . . . . . . . . . . . . . . . . . . . . . . . 197
vi WebSphere V3 Performance Tuning Guide

Preface
This redbook will help you to design and configure WebSphere Application ServerV3.02 for AIX, Solaris, and Windows NT for better performance. The main tuningobjectives for WebSphere are to improve performance, response time, andresource utilization.
This redbook gives some general recommendations and describes specific tuningmethodologies. It provides hints and tips on the various factors and variables thatcan enhance the performance of WebSphere including AIX networks and IBMHTTP Server performance tuning. We introduce performance test tools andmonitoring tools. WebSphere tuning methodology examples are included. Thisredbook also contains an overview of WebSphere Site Analyzer. We also providea performance tuning guide for AFS, which is a part of WebSphere PerformancePack.
Some knowledge of WebSphere Application Server V3.02, DB2 UDB, and AIXare assumed. Note that in this redbook we will not discuss the basicconfigurations of WebSphere, DB2 UDB, or AIX.
The team that wrote this redbook
This redbook was produced by a team of specialists from around the worldworking at the International Technical Support Organization, Raleigh Center.
Ken Ueno is an advisory International Technical Support Representative at theInternational Technical Support Organization, Raleigh Center. He managesresidencies and produces redbooks. Before joining the ITSO, he worked inInternet Systems, IBM Japan Systems Engineering Co., Ltd in Japan as an I/TSpecialist. He can be reached at [email protected].
Tom Alcott is an advisory I/T specialist in the United States. He has been amember of the World Wide WebSphere Technical Sales Support team since itsinception. Before he started working with WebSphere, he was a systemsengineer for IBM’s Transarc Lab supporting TXSeries. His background includesover 18 years of application design and development on both mainframe-basedand distributed systems. He has written and presented extensively on a numberof WebSphere runtime and security issues.
Jeff Carlson is a Staff Software Engineer on the AFS/WSPP team at the IBMTransarc Lab in the United States. He has over 10 years of experience in thesupport of various mainframe, PC/LAN, and UNIX workstation products. Jeffgraduated Magna Cum Laude from Robert Morris College with a Bachelor'sdegree in Business Administration. At the IBM Transarc Lab, he has writtenextensively on AFS performance tuning.
Andrew Dunshea is a Performance Analyst from IBM New Zealand. He has 10years of experience in application development. His areas of expertise includeobject-oriented software development and analysis, systems programming, andperformance analysis.
Dr. Hajo Kitzhöfer is an Advisory International Technical Support Organization(ITSO) Specialist for RS/6000 SP at the Poughkeepsie Center. His areas of
© Copyright IBM Corp. 2000 vii

expertise include RS/6000 SP, SMP, and Benchmarks. He now specializes in SPSystem Management, SP Performance Tuning, and SP hardware.
Yuko Hayakawa is an I/T Specialist in Japan. she has four years of experience inthe e-commerce field. She has worked at IBM for 4 years. Yuko has writtenextensively on database tuning and session management.
Frank Mogus is a Systems Consultant in Canada. He has several years of UNIXexperience and has worked with The Braegen Group for four years.
Colin D. Wordsworth is a software engineer in Australia. He has 16 years ofexperience in applications development. He has been with IBM for the last fiveyears, and is currently involved in setting up the e-business centre for excellencein Western Australia.
Thanks to the following people from the International Technical SupportOrganization, Raleigh Center:
Carla SadtlerGail ChristensenShawn WalshJohn GanciBarry NusbaumMargaret TicknorMike Haley
Thanks to the following IBM employees:
Ruth Willenborg, Manager, WebSphere Performance, RaleighChris Forte, WebSphere Performance, RaleighRon Bostick, WebSphere Performance, RaleighCharlie Bradley, WebSphere Performance, RaleighJerry Cuomo, Manager, WebSphere Performance and Security, RaleighGraeme N. Dixon, STSM, WebSphere Development, IBM Transarc LabJason R McGee, WebSphere Development, RaleighSongquan Liu, WebSphere Development, IBM Transarc LabTianyu Jiang, WebSphere Development, IBM Transarc LabCindy Tipper, WebSphere Development, IBM Transarc LabChris Newbold, WebSphere Development, IBM Transarc LabChriss Stephens, WebSphere Development, IBM Transarc LabGabe Montero, WebSphere Development, RaleighAllan Dickson, WebSphere Development, RaleighLinh Nguyen, Project Manager, IBM HTTP Server Development, RaleighDavid Allen, IBM HTTP Server Development, RaleighTom Hartrick, Manager, Site Analyzer Development, RaleighGopi Attaluri, DB2 Performance Team, TorontoSteve Schormann, DB2 Performance Team, TorontoRichard Nesbitt, Special Events Development, RaleighSteve King, System Administration, RaleighMarco Pistoia, T.J. Watson ResearchTetsuya Shirai, ITSO San Jose CenterJoanne Luedtke, Manager, ITSO Austin Center
viii WebSphere V3 Performance Tuning Guide

Comments welcome
Your comments are important to us!
We want our redbooks to be as helpful as possible. Please send us yourcomments about this or other redbooks in one of the following ways:
• Fax the evaluation form found in “IBM Redbooks review” on page 197 to thefax number shown on the form.
• Use the online evaluation form found at http://www.redbooks.ibm.com/
• Send your comments in an internet note to [email protected]
ix

x WebSphere V3 Performance Tuning Guide

Chapter 1. Overview of WebSphere Application Server V3
This chapter gives an overview of the WebSphere Application Server V3, whichcomes in three editions:
• WebSphere Application Server, Standard Edition• WebSphere Application Server, Advanced Edition• WebSphere Application Server, Enterprise Edition
The Enterprise Edition builds on the Advanced Edition. It combines the TXSeriesand Component Broker with the Advanced Edition. The Enterprise Edition is notcovered in this redbook.
1.1 WebSphere Application Server V3
Our discussion will cover two editions of WebSphere: Standard and Advanced.Both products are based on and support key open-industry standards such asHyperText Transfer Protocol (HTTP), HyperText Markup Language (HTML),Extensible Markup Language (XML), Secure Sockets Layer (SSL), Java,JavaBeans, Common Object Request Broker Architecture (CORBA), LightweightDirectory Access Protocol (LDAP), and most importantly the following EnterpriseJava APIs:
• Enterprise JavaBeans (EJB) technology is a reusable Java component forconnectivity and transactions (EJB support is provided only in the AdvancedEdition).
• Java Server Pages (JSP) represent inline Java code scripted within Webpages.
• Java Servlets are used in building and deploying server-side Javaapplications.
• Java Interface Definition Language (JIDL), is used to connect to CORBAobjects and applications.
• Java DataBase Connectivity (JDBC) is for connections to relationaldatabases. WebSphere supports JDBC within its Connection Manager andwithin EJBs, for distributed database interactions and transactions.
• Java Messaging Service (JMS) is to be supported via MQSeries forasynchronous messaging and queuing and for providing an interface.
• Java Transaction Service (JTS) and Java Transaction API (JTA) are low-levelAPIs for interacting with transaction processing systems and relationaldatabases, respectively. WebSphere uses these within EJBs for supportingdistributed transactions.
• Java Naming and Directory Interface (JNDI) is for communicating withdirectories and naming systems and is used in WebSphere Application Serverto look up existing EJBs and interact with directories.
• Java Remote Method Invocation over Internet Inter-ORB Protocol (RMI/IIOP)is for communicating with other ORBs (Object Request Brokers) andCORBA-compliant applications.
© Copyright IBM Corp. 2000 1

Version 3 of WebSphere introduces a new runtime architecture for theWebSphere Application Server. This runtime architecture is divided into thefollowing components:
• Administration Server (“adminserver”) - The adminserver is the SystemsManagement runtime component of WebSphere. The adminserver isresponsible for runtime management, security, transaction coordination,and workload management. In most cases (exceptions will be outlinedlater) the adminserver runs on all nodes in a WebSphere Administrativedomain and controls the interaction between each node and applicationserver process in the domain.
• Administrative Console (“adminclient”) - The adminclient is the graphicaluser interface used for administration of a WebSphere Administrativedomain. The adminclient can run on one of the nodes that the adminserveris running on, or it can be a remote node that attaches to a runningadminserver.
• System Configuration Repository - WebSphere stores all runtimeconfiguration information in a persistent repository. In Standard Edition thisrepository can be either UDB V5.2, UDB V6.1, Oracle 8.05, or InstantDB(which ships with the Standard Edition). Advanced Edition supports UDBand Oracle as noted for Standard Edition. This repository can either existon the same physical server as WebSphere or can be configured on aremote server.
• Application Server - WebSphere V3 introduces the notion of an applicationserver process that is separate from the runtime server (adminserver). Ineither WebSphere Standard or Advanced Edition, you can define multipleapplication servers, each of which has its own JVM. These applicationservers in turn can have either a servlet engine, EJB container, or bothdefined to them depending on application requirements.
The components of WebSphere V3 are depicted below.
Figure 1. WebSphere components
AdministrationServer
AdministrationClient
DB
ApplicationServer(s)
ApplicationServer(s)
2 WebSphere V3 Performance Tuning Guide

1.2 Standard Edition
WebSphere Standard Edition is a single system, extremely easy-to-use Webapplication server. Programmers developing applications think that they areimplementing extended HTML content. The content/page styles include:
• Static HTML (HTML, .gif, .wav, etc.)
• HTML with imbedded client-side scripts, for example JavaScript
• Java Server Pages (JSP)
WebSphere Standard Edition’s objective is to be a simple, easy-to-use butcomplete solution for building an active Web site and basic Web applications thatintegrate with databases.
WebSphere Standard Edition does not provide the Work Load Management(WLM) functionality that is available in WebSphere Advanced Edition, but doesallow for multiple JVMs on a single physical server. WebSphere Standard Editionis also limited to a single node/machine unlike WebSphere Advanced Edition.These JVMs can be mapped to multiple virtual hosts on a single HTTP server toprovide support for hosting multiple Web sites on a single application server. Thisis useful for Internet service providers (ISPs) or for a company wishing to host theInternet and Intranet Web site on a single server, since WebSphere StandardEdition has single system application server scalability, achieved through the useof a product such as Network Dispatcher, which is a part of WebSpherePerformance Pack. An example configuration is shown in Figure 2.
Figure 2. WebSphere Application Server with Network Dispatcher
1.3 Advanced Edition
WebSphere Advanced Edition extends the WebSphere Standard Edition’sfunctions across multiple machines to provide complete support for developingnew high-performance, scalable and available, transactional Web-drivenapplications. WebSphere Advanced Edition focuses on new applications (JSPsand EJBs) that access relational databases for persistent state data.
Web Browser
Enterprise Data
DBCICS
NetworkDispatcher
HTTPServer
WebSphereApplication Server
Application Server Node
WebSphereApplication Server
WebSphereApplication Server
HTTPServer
HTTPServer
Chapter 1. Overview of WebSphere Application Server V3 3

WebSphere Advanced Edition also supports distributed system management fornetworks and clusters of WebSphere Advanced Edition systems, and supports ashared name and security between networks and clusters of WebSphereAdvanced Edition systems.
In an object-oriented distributed computing environment, clients must have amechanism to locate and identify the objects as if the clients and objects were allon the same machine. A naming service provides this mechanism. In the EJBserver environment, the Java Naming and Directory Interface (JNDI) is used toprovide a common front-end to the naming service.
JNDI provides naming and directory functionality to Java applications, but the APIis independent of any specific implementation of a naming and directory service.This independence ensures that different naming and directory services can beused by accessing them through the JNDI API. Therefore, Java applications canuse many existing naming and directory services, for example, the LightweightDirectory Access Protocol (LDAP) or the Domain Name System (DNS).WebSphere V3 supports JNDI via CosNaming only.
In the Advanced Edition environment, the main component of the security serviceis an EJB server that runs as a component of the adminserver that contains thesecurity beans. When system administrators administer the security service, theymanipulate the security beans.
After an EJB client is authenticated, it can attempt to invoke methods on theenterprise beans that it manipulates. A method is successfully invoked if theprincipal associated with the method invocation has the required permissions toinvoke the method. These permissions can be set by application (anadministrator-defined set of Web and object resources) and by method group (anadministrator-defined set of Java interface-method pairs). An application cancontain multiple method groups.
In general, the principal under which a method is invoked is associated with thatinvocation across multiple Web servers and EJB servers (this association isknown as delegation). Delegating the method invocations in this way ensures thatthe user of an EJB client needs to authenticate only once. HTTP cookies areused to propagate a user's authentication information across multiple Webservers. These cookies have a lifetime equal to the life of the browser session.
A transaction is a set of operations that transforms data from one consistent stateto another. The EJB server manages transactions for EJB applications by usingthe mechanism defined in the Java Transaction API (JTA).
For most purposes, enterprise bean developers can delegate the tasks involvedin managing a transaction to the EJB server. The developer performs thisdelegation by setting the deployment descriptor attributes for transactions. Theenterprise bean code itself does not need to contain transactional logic.
The Work Load Management (WLM) functionality in WebSphere AdvancedEdition introduces the notion of modelling of application server processes.Clones, which are instances of a model, can be created either on a singlemachine or across multiple machines in a cluster. In either case the WebSphereAdvanced Edition WLM provides workload distribution and failover. A sampleconfiguration is shown in Figure 3 on page 5.
4 WebSphere V3 Performance Tuning Guide

Figure 3. WebSphere Application Server WLM with Network Dispatcher
While the WLM in WebSphere Advanced Edition can work in conjunction with theNetwork Dispatcher (ND) component of WebSphere Performance Pack asdepicted above, WLM can also be used independently of ND. The WebSphereproduct family provides support for scalability in two dimensions:
• The number of concurrent connected users (horizontal scaling)• The number of concurrent requests (vertical scaling)
Horizontal scaling is used to add support for additional concurrent users. Forexample, if a machine is serving 100 transactions per second to 100 users with thedesired response time, and you want to be able to serve more concurrently accessedusers, then horizontal scaling techniques of adding additional hardware with theHTTP server and WebSphere Application Server can be used. This allows you toserve nearly twice the client load, at the same response time.
Vertical scaling is used to increase the concurrent requests. For example, if amachine is serving 100 transactions per second to 100 users, and you want to beable to serve high transaction rates (that is 200 tps), then vertical scaling techniquesof adding additional Application Servers to the machine can be used. This assumesthat the machine is not already running at capacity (if it is, then you would also haveto add more processors).
WebSphere Performance Pack helps with the number of connected users. TheWLM in WebSphere Advanced Edition uses multithreading, and connection poolmanagement helps to increase the number of concurrent requests.
Since the focus of this redbook is the WebSphere Application Server, we will notbe testing system topologies using WebSphere Performance Pack. However, itshould be mentioned that lab-based performance testing has demonstrated nearlinear scalability (greater than 96%) across nodes when using WebSpherePerformance Pack. WebSphere Performance Pack also has been used in animpressive list of production sites, including the Atlanta and Nagano Olympicgames.
W e b B ro wse r
E n te rp ris e D a ta
D BC IC S
N etw orkD ispa tc her
H T T PS e rve r W e b Sp h ere
A p p lic a tion S e rve rM od e l (clo n e)
W e bS p h ereA p plic a tio n S erve r
M o d e l (clo ne )
H T T PS erver W e b S ph e re
Ap p lic atio n Se rv e rM o d el (c lo n e )
W e b Sp h e reAp p lica tio n Se rv er
M o d el (c lo n e )
W LM
W LM
Chapter 1. Overview of WebSphere Application Server V3 5

6 WebSphere V3 Performance Tuning Guide
Chapter 2. Performance tuning approach
This redbook is a performance tuning guide for Web application servers. Weoutline various performance tuning points along with suggestions andrecommendations for initial starting values. Web application server performancetuning is an ongoing learning experience especially with WebSphere ApplicationServer V3. Since the largest factor in Web application server performance is thespecific application, specifics of performance tuning for your application mightvary from those presented here. Accordingly, we will not present the results ofperformance benchmark tests that we performed for this publication.
There are three main areas that affect Web application server performance:
• The hardware capacity and settings• The operating system settings• The Web application server settings
In this redbook, we do not discuss hardware capacity or settings. Though it mightsound trite, the simplest and best way to improve performance is to increasememory and processor speed as long as you are not I/O or network bound. If youhave the latter problem, then reconfiguring clients and servers into the sameserver will help (assuming free cycles on the app server machine).
Your network topology and network adapter card settings can also affect overallperformance. You might want to consider that outgoing response packets fromWeb application server are much larger than incoming request packets frombrowsers to Web application server.
We discuss the operating system settings in Chapter 3, “AIX TCP/IP tuning” onpage 15.
The Web application server settings are the main topics of this redbook. In thisbook, we focus on WebSphere Application Server V3 for AIX. The WebSphereApplication Server V3 architecture provides several decision points that affect theoverall performance of your Web applications. Each decision point, in turn, offerstrade-offs that you might view favorably or negatively depending on yourcircumstances. There is no one-size-fits-all solution.
There are four fundamental decision points that have their own tuning options:
1. The Web server (HTTP server)
2. The WebSphere Application Server Engine
3. The Java Virtual Machine (JVM)
4. The database server
We discuss all of them in this redbook. Chapter 4, “Web Server: IBM HTTPServer 1.3.6” on page 21 discusses the Web server settings. Chapter 5,“WebSphere Engine” on page 29 and Chapter 6, “Security” on page 49 discussthe WebSphere Application Server Engine and JVM. The database serversettings are covered in Chapter 7, “Database tuning” on page 57 and Chapter 8,“Session management” on page 75.
© Copyright IBM Corp. 2000 7

Figure 4. Fundamental tuning points of WebSphere Application Server settings
2.1 WebSphere Application Server V3 topologies
The performance testing done for this redbook was based on four distincttopologies.
2.1.1 Topology 1: single machineIn order to establish a baseline for our performance testing we configured asingle machine with the topology depicted in Figure 5. In our single machinetopology (topology 1) the database server with the business application data andthe configuration repository reside on the same machine as the WebSphereApplication Server (WAS).
Figure 5. Topology 1
While this configuration may be suitable for a development environment, it shouldbe avoided for production environments where performance is a concern.
WebServer
DatabaseServerRouter
Plug-in
ServletEngine
EJBContainer
JVM
WebSphere ApplicationServer Engine
(1)
(2)
(3)
(4)
AdministrationServer
ApplicationServer(s)
AdministrationClient
WASConfiguration
Repository
HTTP Server BusinessApplication
Data
Machine A
HTTP(s)
Topology 1
8 WebSphere V3 Performance Tuning Guide

Installation of a database on a UNIX system involves changes to the UNIX OSkernel. Depending on the database and operating system the changes are eithermade explicitly by the systems administrator or by the installation program for thedatabase. For example, kernel changes are made automatically on AIX wheninstalling DB2, while installation of DB2 on Solaris or HP-UX require explicitmodification of the kernel. Oracle also requires modification of the kernelparameters. The result is that a server running both a database server andWebSphere Application Server is optimized for database performance and notthe application server.
The other issue and perhaps more significant factor with running both processeson the same physical server is that under load you have both WebSphere and thedatabase competing for system resources.
When we moved the database processes to a second remote server (shown laterin topology 2), we observed a significant performance improvement over runningthe application server processes and database server processes on the samenode as WAS.
2.1.2 Topology 2: separating the database server from WASWhile it is possible to host both WAS and its configuration/administrativerepository on the same physical server as shown in topology 1 in Figure 5 onpage 8, in practice most organizations choose to maintain a single databaseserver that hosts all databases, most likely residing on a separate machine fromWAS. This means putting the WAS configuration/administrative repository on thesame database server as the business application data, facilitating a morestreamlined system of backups, system maintenance and performance tuning.
Topology 2, shown in Figure 6 on page 10, would be typical for a small Web sitewhere all the application server and HTTP server processes are hosted on asingle machine. In this topology, we used the same database server for the WASconfiguration repository, business application data, and session persistencemanager.
Though Windows NT uses a thread-based architecture as opposed to theprocess-based architecture of UNIX, performance on Windows NT suffers to asimilar degree when hosting both the database and application server on thesame machine.
Note for Windows NT
Performance Tip
Run the WebSphere Application Server and the database server on separateservers.
Chapter 2. Performance tuning approach 9

Figure 6. Topology 2
2.1.3 Topology 3: multiple application serversTopology 3, shown in Figure 7, expands on topology 2 by adding a clone of theapplication server process on the same server that the other application serverand the HTTP server processes are running on. This topology demonstrates theapplication process scalability and WLM capability for a single server.
Figure 7. Topology 3
2.1.4 Topology 4: advanced topologyIn topology 4, shown in Figure 8 on page 11, we have separated the HTTP serverfrom the application server using the servlet redirector that comes withWebSphere Application Server. This topology is typical of many customer
AdministrationServer
Administration
ClientWASConfigurationRepository
HTTP Server BusinessApplicationData
MachineA Machine B
Topology 2
ApplicationServer
HTTP(s)
AdministrationServer
ApplicationServer(s)
Administration
ClientWASConfigurationRepository
HTTP Server BusinessApplicationData
Machine A Machine B
Topology 3ApplicationServer(s)HTTP(s)
10 WebSphere V3 Performance Tuning Guide

environments where the HTTP server is physically separated from the applicationserver and runs on one side of a firewall, either outside the firewall or betweentwo firewalls inside a Demilitarized Zone (DMZ). For our testing we did notactually configure a firewall.
In this topology, the HTTP server communicates locally with the servlet redirectorusing Open Servlet Engine (OSE). The servlet redirector in turn, forwards or“redirects” the servlet requests to the application server running on anotherphysical server via Internet Inter-ORB Protocol (IIOP).
Figure 8. Topology 4
2.1.5 Our test applicationThe application used for our performance tests is known as the Trade application.This sample application program is an internal tool. It was designed to test theWebSphere Application Server for aspects of scalability, performance andcompetitiveness. The Trade application is a collection of Java classes, Javaservlets, Java Server Pages and Enterprise JavaBeans. The application isdesigned to be portable between the WebSphere 3.x Standard, Advanced andEnterprise Editions.
The Trade application simulates an online stock trading Web site. The applicationallows a user to perform the following actions using a Web browser:
• Registration• Site login• Inquiry of the current price for a stock ticker symbol• Purchase of shares• Sale of shares• Portfolio review• Logout from site
2.1.5.1 Trade application componentsThe Trade application contains six major objects:
W ASC onf igurationR eposito ry
HTT P Serve r
Busines sApp lic ationD ata
Machine A Machine B
Topology 4
Machine C
Servle tR ed irector
Adminis trationServe r
Adm inis trationClient
(C onso le )
ApplicationServer(s)
Adminis trationServe r
DB2C lient
DB2C lient
O SE
HTTP(s)
JDBCIIO P
Chapter 2. Performance tuning approach 11

• Trade• Account• Registry• Profile• Holding• Quote
These objects and their primary data fields and methods are depicted in Figure 9.
Figure 9. Trade application components
The Trade object is a stateless object that encapsulates the primary operations ofthe Trade application. When the Trade application is configured to use EJBs, theTrade object takes the form of a Stateless Session EJB. Otherwise the Tradeobject takes the form of a standard Java class.
The five remaining objects: Account, Registry, Quote, Profile and Holding aredata objects. When the Trade application is configured to use EJBs, these objectsare Container Managed Entity EJBs. Otherwise, these objects are encapsulatedin a Java data bean. The data bean is a standard Java class that uses JDBCprepared SQL statements to manipulate data within a database table.
The topology for the Trade application is shown in Figure 10 on page 13.
Trade
getPortfoliogetBalancegetQuote
register, loginbuy, sell
Account
getBalance
userid, balance
Registry
authenticate
userid, password
Holding
findByUidgetHolding
userid, idx, symbol, quantity,price, details
Quote
getSymbolgetPrice
symbol, price
Profileuserid, address, e-mail,credit-card
Trade Application -Performance and Scalability
Test application
Trade JDBC (SE)JSP, Servlet, HTTP Session,DataBeans, JDBC
Trade EJB (AE)JSP, Servlet, HTTP Session,SessionBean, EntityBean
12 WebSphere V3 Performance Tuning Guide

Figure 10. Trade application runtime
The Trade servlet is the controller for the application with calls from servletinstances to the DataBeans and JDBC as required. As the controller for theapplication, the Trade servlet coordinates:
• Registering or logging in• Buy scenarios (which includes getting quotes and buying stocks)• Sell scenarios (which includes browsing your portfolio and sales of holdings)• Logging out
2.2 Network and hardware configuration
All tests, unless otherwise stated, were run on a nine-node SP frame. Eight of the SPnodes were 2x332 MHz CPUs with 512 MB of RAM, while the ninth node was a4x332 MHz CPU with 1 GB of RAM. Each node has a 9 GB disk assigned to it.
This allowed us to simulate multiple physical servers while minimizing thenetwork latency. While in the real world there would be some network latency, thepurpose of this publication is to determine the optimal settings for the WebSphereApplication Server runtime, and this is best done by eliminating externalinfluences such as network latency. The hardware and corresponding softwareconfiguration for our performance testing is shown in Figure 11 on page 14.
Trade Application Runtime Topology
WebBrowser
HTTPHTTPServerServer
WebSphere ApplicationWebSphere ApplicationServerServer
EnterpriseData
BusinessData
Access
request
response
http/https
EJBJDBC
Trade
ServletsServletsServlets
ServletsJSPs
Chapter 2. Performance tuning approach 13

Figure 11. Testing hardware and software configuration
The software used was:
• AIX 4.3.2 + PTF• WebSphere Application Server Advanced Edition V3.02 for AIX• UDB V5.2 + FP11• UDB V6.1 + FP1c• Oracle 8.05• IBM HTTP Server V1.3.6• JDK 1.1.6.9 (PTF9)
2x332 MHz512 MB
2x332 MHz512 MB
2x332 MHz512 MB
2x332 MHz512 MB
2x332 MHz512 MB
2x332 MHz512 MB
2x332 MHz512 MB
2x332 MHz512 MB
4x332 MHz1024 MB
WAS Adv3.02 + IHS
WAS Std3.02 + IHS
AKStress
UDB 6.1 UBD 5.2Oracle 8.05
WAS Advanced3.02
WAS Adv3.02 + IHS
WASAdminclient
14 WebSphere V3 Performance Tuning Guide

Chapter 3. AIX TCP/IP tuning
Before you start WebSphere tuning, we recommend reviewing and modifying thesystem settings of your Web site, especially the TCP/IP network settings becausewhen Web browsers access WebSphere, they have to establish TCP/IP networkconnections. In this chapter, we show you several TCP/IP network tunableparameters that should be modified. We provide an AIX TCP/IP overview as anappendix. For more in-depth knowledge of AIX performance tuning, werecommend the AIX Performance Tuning Guide, SR28-5930 and RS/6000 SPSystem Performance Tuning, SG24-5340.
3.1 Network tuning with no command
The tunable parameters should be set to customized values during the AIXinstallation process.
Use the no command to display the current settings and change it as shownbelow.
no -o <parameter>no -o <parameter>=<newvalue>
Figure 12. Usage of no command
In the output of the no -a command taken from AIX 4.3.2 in Figure 13 on page 16,the appropriate tunables are highlighted.
The following are specific details for setting the network tunables for AIXsystems:
thewall
Specifies the maximum amount of memory, in KB, that is allocated to thememory pool. In AIX Version 4.3.2 and later, the default value is 1/2 of realmemory or 1048576 (1 GB), whichever is smaller. thewall is a runtimeattribute. Changes take effect immediately and remain in effect until the nextreboot. For tuning, increase size, preferably in multiples of 4 KB.
sb_max
Provides an absolute upper bound on the size of TCP and UDP socket buffersper socket. Limits udp_sendspace, udp_recvspace, tcp_sendspace andtcp_recvspace. The units are in bytes. For tuning, increase size, preferably inmultiples of 4096. This value should be at least twice the size of the largestvalue for tcp_sendspace, tcp_recvspace, or udp_recvspace. This ensures thatif the buffer utilization is better than 50% efficient, then the entire size of the
# no -o thewallthewall = 262124## no -o thewall=300000## no -o thewallthewall = 300000#
© Copyright IBM Corp. 1999 15

tcp and udp byte limits can be utilized. Changes take effect immediately fornew connections and remain in effect until the next reboot.
Figure 13. Displaying Network Options
somaxconn
Specifies the maximum listen backlog. The default is 1024 bytes. somaxconnis a runtime attribute.
tcp_sendspace
Provides the default value for the size of the TCP socket send buffer, in bytes.This is never higher than the major network adapter transmit queue limit. Tocalculate this limit, use:
(major adapter queue size) * (major network adapter MTU)
For tuning increase size, preferably to a multiple of 4096. Changes take effectimmediately for new connections and remain in effect until the next reboot.
tcp_recvspace
Provides the default value for the size of the TCP socket receive buffer. Thevalue is in bytes. This is never higher than the major network adapter transmitqueue limit.
(major adapter queue size) * (major network adapter MTU)
thewall = 262124
= 85
sb_max = 1048576
somaxconn = 1024
clean_partial_conns = 0
net_malloc_police = 0
rto_low = 1
rto_high = 64
rto_limit = 7
rto_length = 13
inet_stack_size = 16
arptab_bsiz = 7
arptab_nb = 25
tcp_ndebug =
ifsize = 8
arpqsize 1
ndpqsize = 50
route_expire 0
strmsgsz = 0
strctlsz = 1024
nstrpush = 8
strthresh = 85
psetimers = 20
extendednetstats = 0
sockthresh
=
100
=
fasttimo
send_file_duation
routerevalidate
nbc_limit
nbc_max_cache
nbc_pseg_limit
nbc_min_cache
nbc_pseg
=
=
=
=
=
=
=
=
200
300
0
0
131072
262124
1
0
tcp_pmtu_discover = 0
ipqmaxlen = 100
directed_broadcast = 1
ipignoreredirects = 0
ipsrcroutesend = 1
ipsrcrouterecv = 0
ipsrcrouteforward = 1
ip6srcrouteforward = 1
ip6_defttl = 64
ndpt_keep = 120
ndpt_reachable = 30
ndpt_retrans = 1
ndpt_probe = 5
ndpt_down = 3
ndp_umaxtries = 3
ndp_mmaxtries = 3
ip6_prune = 2
tcp_timewait = 1
tcp_ephemeral_low = 32768
tcp_ephemeral_high = 65535
udp_ephemeral_low = 32768
udp_ephemeral_high = 65535
tcp_timewait
ip6forwarding
multi_homed
main_if6
site6_index
maxnip6q
llsleep_timeout
main_site6
=
=
=
=
=
=
=
=
1
0
1
0
0
20
3
0
udp_pmtu_discover = 0psebufcalls = 20
strturncnt = 15
lowthresh = 90
medthresh = 95
psecache = 1
subnetsarelocal = 1
maxttl = 255
ipfragttl = 60
ipsendredirects = 1
ipforwarding = 0
udp_ttl = 30
tcp_ttl = 60
arpt_killc = 20
tcp_sendspace = 16384
tcp_recvspace = 16384
udp_sendspace = 9216
udp_recvspace = 41920
rfc1122addrchk = 0
nonlocsrcroute = 0
tcp_keepintvl = 150
tcp_keepidle = 14400
bcastping = 1
udpcksum = 0
tcp_mssdflt = 512
icmpaddressmask = 0
tcp_keepinit = 150
ie5_old_multicast_mapping = 0
rfc1323 = 0
pmtu_default_age = 10
pmtu_rediscover_interval = 30
pseintrstack = 12288
16 WebSphere V3 Performance Tuning Guide

For tuning, increase size, preferably to a multiple of 4096. Changes take effectimmediately for new connections and remain in effect until the next reboot.
tcp_sendspace and tcp_recvspace
These tunables establish the size of the TCP window on a per datagramsocket connection. The effective size used is the least common denominatorbetween the sending side tcp_sendspace and the receiving sidetcp_recvspace. The size depends on the network you are sending over.
udp_sendspace
Provides the default value for the size of the UDP socket send buffer, in bytes.Set to 65536, because anything beyond 65536 is essentially ineffective. SinceUDP transmits a packet as soon as it gets any data, and since IP has an upperlimit of 65536 bytes per packet, anything beyond 65536 runs the small risk ofgetting thrown away by IP. For tuning, increase size, preferably to a multiple of4096. Should always be less than udp_recvspace, but never greater than65536. Changes take effect immediately for new connections and remain ineffect until the next reboot.
udp_recvspace
Provides the default value for the size of the UDP socket receive buffer. Asuggestion for the starting value of udp_recvspace is 10 times the value ofudp_sendspace, because UDP may not be able to pass a packet to theapplication before another one arrives. For tuning, increase size, preferably toa multiple of 4096. Should always be greater than udp_sendspace and sizedto handle as many simultaneous UDP packets as can be expected per UDPsocket. Changes take effect immediately for new connections and remain ineffect until the next reboot.
rfc1323
Value of 1 indicates that tcp_sendspace and tcp_recvspace sizes can exceed64 KB. If the value is 0, the effective tcp_sendspace and tcp_recvspace sizesare limited to a maximum of 65535. If you are setting tcp_recvspace andtcp_sendspace greater than 65536, you need to set rfc1323=1 on each side ofthe connection. Without having rfc1323 set on both sides, the effective valuesfor tcp_recvspace and tcp_sendspace will be 65536. For better performance,we recommend that this always be set to 1. Changes take effect immediatelyfor new connections and remain in effect until the next reboot.
tcp_timewait
The tcp_timewait option is used to configure how long connections are kept inthe timewait state. It is given in 15 second intervals, and the default is 1.
nbc_max_cache
Specifies the maximum size of the cache object allowed in the Network BufferCache (NBC). This attribute is in bytes; the default is 131072 (128 KB). A dataobject bigger than this size is not put in the NBC.
nbc_pseg_limit
Specifies the maximum amount of cached data allowed in private segments inthe Network Buffer Cache. This value is expressed in KB. The default value ishalf of the total real memory size on the running system. Since data cached inprivate segments is pinned by the Network Buffer Cache, nbc_pseg_limit
Chapter 3. AIX TCP/IP tuning 17

controls the amount of pinned memory used for the Network Buffer Cache inaddition to the network buffers in global segments. When the amount ofcached data reaches this limit, cache data in private segments may be flushedfor new cache data so that the total pinned memory size doesn't exceed thelimit. When nbc_pseg_limit is set to 0, all caches in private segments areflushed.
nbc_pseg
Specifies the maximum number of private segments that can be created forthe Network Buffer Cache. The default value is 0. When this option is set atnon-0, a data object between the size specified in nbc_max_cache and thesegment size (256 MB) is cached in a private segment. A data object biggerthan the segment size is not cached at all. When the maximum number ofprivate segments exist, cache data in private segments may be flushed fornew cache data so that the number of private segments do not exceed thelimit. When nbc_pseg is set to 0, all caches in private segments are flushed.
nbc_limit
Specifies the total maximum amount of memory that can be used for theNetwork Buffer Cache. This attribute is in KB. The default value is derivedfrom thewall. When the cache grows to this limit, the least-used cache objectsare flushed out of cache to make room for the new ones.
tcp_mssdflt
Default maximum segment size used to communicate with remote networks.This tunable is used to set the maximum packet size for communication withremote networks; however, only one value can be set even if there are severaladapters with different MTU sizes. It is the same as the MTU forcommunication across a local network except for one small difference: thetcp_mssdflt size is for the size of the data only, in a packet. You need toreduce the tcp_mssdflt for the size of any headers so that you send fullpackets instead of a full packet and a fragment. The way to calculate this is asfollows:
MTU of interface - TCP header size - IP header size - rfc1323 header size
which is:
MTU - 20 - 20 - 12 , or MTU - 52
Limiting data to MTU - 52 bytes ensures that, where possible, only full packetswill be sent.
If set higher than the MTU of the adapter, IP or an intermediate router mayfragment packets. Changes take effect immediately for new connections andremain in effect until the next reboot.
18 WebSphere V3 Performance Tuning Guide

subnetsarelocal
Specifies that all subnets that match the subnet mask are to be consideredlocal for purposes of using MTU instead of the maximum segment size (MSS).This is a configuration decision with performance consequences. If thesubnets do have the same MTU, and subnetsarelocal is 0, TCP sessions mayuse an unnecessarily small MSS. Changes take effect immediately for newconnections and remain in effect until the next reboot.
MTU
Limits the size of packets that are transmitted on the network, in bytes. Defaultvalue is adapter dependent. The range of values is 512 bytes to 65536 bytes.
To obtain the current setting, use the lsattr command. For example,
lsattr -E -l interface tr0
To change the value, use the chdev command. For instance,
chdev -l interface -a mtu=<newvalue>
Because all the systems on the LAN must have the same MTU, they mustchange simultaneously. Change is effective across boots.
3.2 Tuning parameter summary
Table 1 shows you a summary of tunable parameters for the no command. InTable 2 on page 20, we show you the parameter settings for Web site tuning. IBMhas tested Web server performance with SPECweb96. We’ve summarized theinformation, which you can get from the following Web site:
http://www.spec.org.
Table 1. The tunable parameters of the no command
Parameter Default Value Range
thewall 1/2 of RAM or 1048576(1 GB)
sb_max 65536
subnetsarelocal 1 (yes) 0 or 1
somaxconn 1024
tcp_sendspace 16384 0 to 64 KB (if rfc1323=0)0 to 4 GB (if rfc1323=1)
tcp_recvspace 16384 0 to 64 KB (if rfc1323=0)0 to 4 GB (if rfc1323=1)
udp_sendspace 9216 0 to 65536
udp_recvspace 41600
rfc1323 0 0 or 1
tcp_timewait 1
nbc_max_cache 131072
nbc_seg_limit 0
nbc_pseg 0
Chapter 3. AIX TCP/IP tuning 19

Table 2. The results of SPECweb96 and tunable parameters
nbc_limit 786432
tcp_mssdflt 512 512 to unlimited
S7AIHS 1.3.4
7026 - H70IHS 1.3.4
S80IHS 1.3.6
43P-260IHS 1.3.6
SPECweb96 20200 11774 40161 4597
Processor 262 MHzRS64-2
PowerPCRS64-II340MHz
450 MHzRS64-III
200 MHzPOWER3
# of Processors 12 8 12 2
Memory 8 GB 4 GB 16 GB 4 GB
OS AIX 4.3.2 +APAR IX86737
AIX 4.3.2 +APAR IX86737
AIX 4.3.3 AIX 4.3.3
MTU ATMMTU=9180
ATMMTU=9180 &Jumbo FrameGigabitMTU=9000
Gigabit JumboFrameMTU=9000
Jumbo FrameGigabitMTU=9000
no
sb_max 262144 262144 262144 262144
somaxconn 8192 8192 16384 16384
nbc_max_cache 100000 100000 60000 100000
nbc_seg_limit 10000 10000
tcp_sendspace 28000 28000 28000 28000
tcp_recvspace 28000 28000 28000 28000
tcp_timewait 5 5 5 5
nbc_pseg 80000 20000
nbc_limit 393216
Parameter Default Value Range
20 WebSphere V3 Performance Tuning Guide

Chapter 4. Web Server: IBM HTTP Server 1.3.6
As of January 2000, IBM HTTP Server for AIX on an RS/6000 S80 holds theworld record for the performance benchmark result by SPECweb96. For detailedinformation, see http://www.spec.org/
This chapter focuses on Web Server performance tuning. We concentrate on theWeb server produced by IBM, the IBM HTTP Server V1.3.6 (IHS), which is basedon the popular open standards-based Apache Web server.
While the settings will be different for each Web server and application themethodology used to performance tune IHS still holds true for your Web serverapplication combination.
Most of these settings will need to be tested with the individual applications thatwill be run on the server. This tuning guide provides information which you canuse as a starting point for your performance tuning tests. You probably save yourtime with this publication.
In the following sections we cover some of the performance tuning directivesfound in the httpd.conf file. You can use a text editor to modify the parameters inthe httpd.conf file in the directory /usr/HTTPServer/conf on AIX.
There are several directives that we can specify in the httpd.conf file. We havecategorized them in five different areas:
• Process handling
• Connection
• Resource usage
• Name resolution
• Fast Response Cache Accelerator (FRCA)
You may also refer to/usr/HTTPServer/htdocs/<LANG>/manual/misc/perf-tuning.html by Dean Gaudet.This is a very good reference for the Web site that mainly serves HTML contents.In other words, some information in these performance notes is not appropriatefor WebSphere.
4.1 Process handling
This category is primarily related to the httpd processes.
MaxClients - Limit on the total number of simultaneous HTTP requests that IHScan serve. Since IHS uses one child server process for each HTTP request, thisis the limit of the number of child server processes that are able to runsimultaneously. The default value is 150 and maximum value is 2048.
The value of this directive can significantly impact your application performance,particularly if it is too high. The optimum value depends on your application. Ingeneral:
• Use a lower MaxClients value for a simple, CPU intensive application.
© Copyright IBM Corp. 2000 21

• Use a higher MaxClients value for a more complex, database intensiveapplication with longer wait times.
For example, exceptional performance on simple servlets such as “HelloWorld”and “Snoop” have been achieved using values as low as 25.
A good approach to tuning this parameter is to start with a setting of 50 andcapture the performance under normal load. Repeat your test with settings of 40and 60. Use this data to refine your tuning. Use small increments and decrementsrather than large ones.
During these tests, be sure to watch the server CPU utilization. Do not increasethe MaxClient setting if the CPU utilization reaches 100% busy and doing socauses server response time to exceed your response time criteria.
StartServers - The number of child server processes that are created when IHSis started. Default value is 5.
MaxSpareServers - Specifies the upper number of idle httpd child processeswhich are not handling any requests.
MinSpareServers - Specifies the lower number of idle httpd child processeswhich are not handling any requests.
If there are fewer than MinSpareServers, then the parent process creates newchild processes at a maximum rate of 1 per second. If there are more thanMaxSpareServers, then the parent process kills off the excess child processes.Default value of MaxSpareServers is 10 and MinSpareServers is 5.
The above three directives can also impact your application performance. Foroptimum performance runs, keep the MaxClients, the StartServers and theMaxSpareServers directives equal so that CPU is not expended creating anddestroying httpd child server processes.
MaxRequestsPerChild - restricts the number of requests handled by each childhttpd process. Once this value is reached, the child process terminates. One ofthe intentions of this parameter is to limit the lifetime of an httpd client process inorder to prevent it from using too much memory resource in case of memoryleaks. The number specified can be fairly high if stable operation is expected.Default value is 10000.
ListenBacklog - The maximum length of the queue of pending connections fromthe clients. Generally no tuning is needed or desired, however on some systemsit is desirable to increase this when under a TCP SYN flood attack. See thebacklog parameter to the listen(2) system call. Default value is 511.
4.2 Connection
These directives deal with the persistent connection feature of the HTTP/1.1specification. With HTTP/1.0, each HTTP session establishes a new TCPconnection. If your home page has a lot of images, you will need to establish TCPconnections many times to send all data for one page. The persistent connectionfeature is designed to avoid this behavior. After one session is finished, theconnection still remains and the next request can re-use the connection. If IHS
22 WebSphere V3 Performance Tuning Guide

gets an HTTP/1.1 request, IHS can re-use the connection until it receives theconnection close request.
KeepAlive - Whether or not to allow persistent connections (more than onerequest per connection). Set to "off" to deactivate. Default is on.
KeepAliveTimeout - Number of seconds to wait for the next request. Defaultvalue is 15. To avoid waiting too long for the next request, you can specify thenumber of seconds to wait. Once the request has been received, the Timeoutdirective will apply.
MaxKeepAliveRequests - The maximum number of requests to allow during apersistent connection. Set to 0 to allow an unlimited number.
Timeout - Sets the number of seconds the IHS waits for these three events:
• Time taken to receive a GET request
• Time taken between receipt of TCP packets on a POST or PUT request
• Time taken between acknowledgments on transmissions of TCP packets inresponses
Default value is 300.
4.3 Resource usage
These directives restrict the amount of system resource usage by the httpd childprocess.
RLimitCPU - Controls the number of seconds per process. This directive takesone or two parameters. The first parameter sets the soft resource limit for allprocesses and can be specified as a number or “max.” The second parametercan be specified only as “max.” The “max” means the maximum resource limitallowed by the operating system.
RLimitMEM - Sets the number of bytes per process. This directive also takes oneor two parameters. The first parameter sets the soft resource limit for allprocesses and can be set to a number or “max”. The “max” indicates to the server
If your Web site is busy, you should set a very small KeepAliveTimeout such as2 or 3 because if a browser does not send a connection close request, IHSkeeps the connection until the period of time specified in the KeepAliveTimeoutdirective. If you specify a large number, it blocks the system resources if norequests are submitted.
Note
The directives explained in this section are not included in the defaultconfiguration file since they are normally not used, because they can bespecified at the operation system level, if required. These directives shouldonly be used when the values need to be set lower than what the operatingsystem permits.
Note
Chapter 4. Web Server: IBM HTTP Server 1.3.6 23

that the limit should be set to the maximum resource limit allowed by theoperating system.
RLimitNPROC - Controls the maximum number of simultaneous processes peruse. This directive takes one or two parameters as well. The first parameter setsthe soft resource limit for all processes and the second parameter sets themaximum resource limit the same as the above two directives. For the case ofCGI processes running under the same UID as the Web server, which is thenormal case, the limitation set with this directive restricts the number ofprocesses the server itself can create by forking. Thus, it might limit a server’sability to create new httpd processes.
Figure 14. RLimit directives in the httpd.conf
SendBufferSize - Specifies the TCP buffer size to a specific number of bytes.
4.4 Name resolution
This category includes the directives that affect the httpd processes specifically inthe client-parsing phase in the runtime environment.
HostnameLookups - Enables or disables DNS lookups to be performed suchthat host names (rather than IP addresses) can be logged. To increaseperformance in any case, you should set the HostnameLookups directive to off.The default is off.
4.5 Fast Response Cache Accelerator
Fast Response Cache Accelerator (FRCA) provides a kernel level cache to storeserver static HTML documents and images. There are several limitations whenusing FRCA. FRCA can cache only static contents. In other words, dynamiccontents which are generated by servlets, JSPs and EJBs are not cached byFRCA. FRCA does not support protected pages, POST method, or any pagesover SSL connections. But many Web sites still use static pages. Therefore,FRCA can provide performance improvements for these sites.
The following are the basic steps for setting up FRCA for AIX.
#RLimitCPU 5 max
RLimitMEM max
RLimitNPROC max max
When using allow from domain or deny from domain directives there is adouble, reverse DNS lookup. For best performance avoid using thesedirectives.
Note
24 WebSphere V3 Performance Tuning Guide
FRCA is new function of IBM HTTP Server 1.3.6 for AIX. IHS 1.3.3 for AIX doesnot support it. For AIX 4.3.2, you have to apply APAR IX86737. If you are usingAIX 4.3.3, no APAR is required. For FRCA support you install the http_server.frcafileset. Then, configure AIX for FRCA. During the AIX FRCA configuration, theNetwork Buffer Cache options will be requested, which can be obtained by the no
command.
Network Buffer Cache options:
• nbc_limit: sets the maximum size of the network buffer cache in KB. This valueshould not be set higher than 1/2 the value of thewall which you can get withno -a command.
• nb_max_cache: sets the maximum size of a cache object that will be allowedin the Network Buffer Cache.
• nbc_min_cache: sets the minimum size of a cache object that will be allowedin the Network Buffer Cache.
After you set the Network Buffer Cache options, you can load the Fast ResponseCache Accelerator into the AIX kernel. The command frcactrl load will activatethe FRCA kernel. You have to load it before IHS is started. By default, IHS isstarted automatically when AIX is booted. If you do not want to start IHSautomatically, you can comment out the line that starts with ihshttpd in the/etc/inittab.
To activate the FRCA module, the following lines should be added to the IHSconfiguration file (/usr/HTTPServer/conf/httpd.conf by default):
•LoadModule ibm_afpa_module libexec/mod_ibm_afpa.so
•AddModule mod_ibm_afpa.c
There are several directives that are related to FRCA:
• AfpaBindLogger [-1, 0, 1, ..., n]: allows you to bind the FRCA logging thread toa specific CPU on a multiple processor machine.
• AfpaCache on | off: allows you to turn FRCA on or off for a particular scopesuch as a directory.
• AfpaEnable: enables the FRCA to listen on the TCP port specified by the Portdirective or the default port 80.
• AfpaLogFile file_path_and _name log_format: sets the FRCA log file name,location and format
• Log formats:• CLF: Command Log Format• ECLF: Extended Common Log Format• V-CLF: Common Log Format with virtual host information• V-ECLF: Extended Common Log Format with virtual host information• BINARY: Binary Log Format with virtual host information
The LoadModule and AddModule directives should be the first dynamicmodules listed in the configuration.
Note
Chapter 4. Web Server: IBM HTTP Server 1.3.6 25

• AfpaSendServerHeader true | false: specifies whether or not FRCA will sendthe HTTP Server header in the response.
• AfpaLogging on | off: turns FRCA logging on or off.
• AfpaMaxCache [size]: specifies the maximum file size in bytes which can beadded to the FRCA cache.
• AfpaMiCache [size]: specifies the minimum file size in bytes which can beadded to the FRCA cache.
• AfpaRevalidationTimeout [seconds]: sets the time interval for files cached tobe revalidated.
In our test environment, we specified the AFPA configuration directives in the/usr/HTTPServer/conf/httpd.conf file. See below in Figure 15.
Figure 15. AFPA configuration in the httpd.conf file
Then, start IHS with the /usr/HTTPServer/bin/apachectl start command.
There are three ways to monitor FRCA:
• Fast Response Cache Accelerator Log: the FRCA log can be used to observefiles being served out of the cache.
• Using netstat to monitor the Network Buffer Cache: using the commandnetstat -c you can observe the current status of the Network Buffer Cache.
• Using frcactrl to monitor the FRCA kernel: using the command frcactrl
stats you can observe statistics from the FRCA kernel such as the totalnumber of requests handled and the total number of successful cache hits.
Now, you can set up FRCA successfully.
We tested FRCA with two scenarios. One is for HTML static documents and theother is for a dynamic document that is created by a servlet.
For the HTML static document test case, we accessed the welcome page, whichincludes several gif files. We saw significant performance improvements withFRCA. In our environment, using FRCA allowed twice as many HTTP requeststhan without FRCA. In addition the CPU utilization of the Web server machinewas lower than the non-FRCA case. With the frcactrl stats command, wenoticed that our HTTP requests hit cached data.
#LoadModule ibm_afpa_module
AddModule mod_ibm_afpa.c
AfpaEnableAfpaCache onAfpaLogFile /usr/HTTPServer/logs/afpa-log V-ECLFAfpaMinCache 0AfpaMaxCache 100000AfpaLogging onAfpaBindLogger -1AfpaSendServerHeader true
26 WebSphere V3 Performance Tuning Guide

The other test case for dynamic content showed that using FRCA did not improveperformance. FRCA is designed for static content only as we described before.From this test result, we can tell that using FRCA does not affect for dynamiccontents. In other words, FRCA does not cause any performance decreases fordynamic content. Of course, there is no cache hit with FRCA for dynamic content.
4.6 APAR for Web server performance
There are several APARs that are related to Web server performance. Thefollowing AIX APARs are related to all AIX Web servers, so they should always beinstalled:
• IX88664:
Abstract: server performance is suboptimal
• xIX86737:
Abstract: Web server performance improvements
• xIY02324:
Abstract: wrong http response on if-unmodified-since header
• xIY00957:
Abstract: get engine can crash the system
The instfix -ik command tells you if you’ve applied the APAR. See Figure 16.
Figure 16. instfix -ik command
The above output tells us that we have not installed all filesets for IX86737.
Now, we show you how we can find the filesets which we need to install forIX86737.
We also used the instfix -icvk command to determine the status of IX86737 onour system. See Figure 17 on page 28.
# instfix -ik IX88664All filesets for IX88664 were found.
# instfix -ik IX86737Not all filesets for IX86737 were found.
# instfix -ik IY00957All filesets for IY00957 were found.
Chapter 4. Web Server: IBM HTTP Server 1.3.6 27
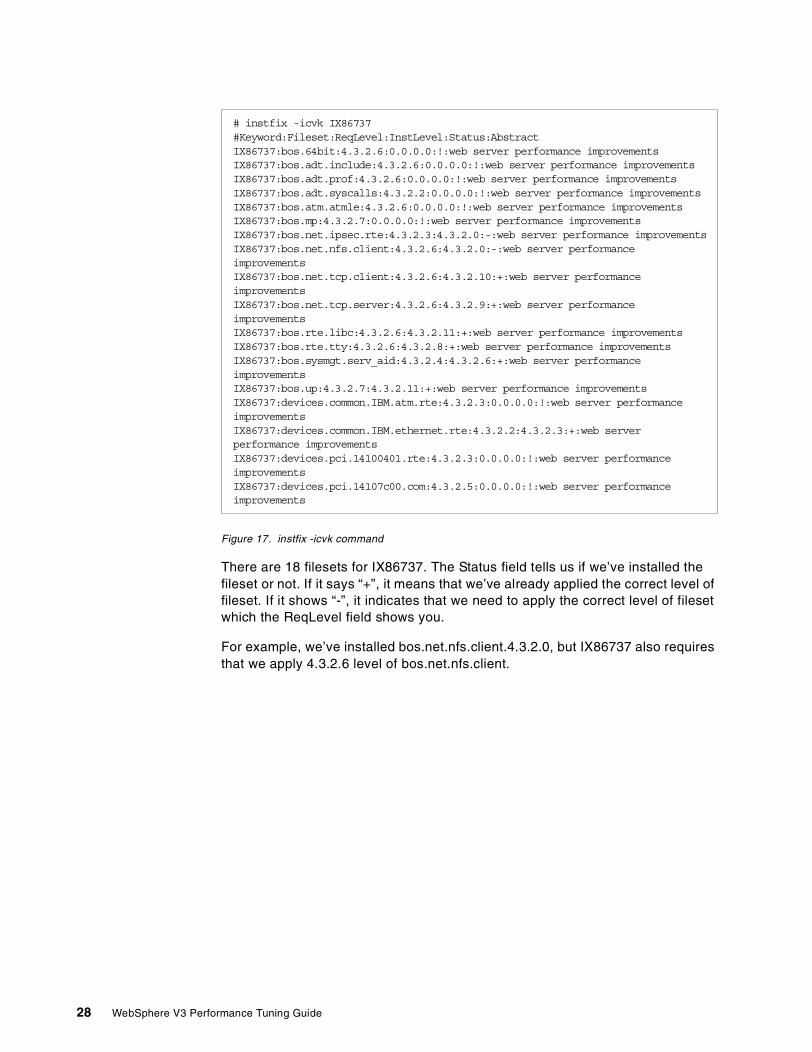
Figure 17. instfix -icvk command
There are 18 filesets for IX86737. The Status field tells us if we’ve installed thefileset or not. If it says “+”, it means that we’ve already applied the correct level offileset. If it shows “-”, it indicates that we need to apply the correct level of filesetwhich the ReqLevel field shows you.
For example, we’ve installed bos.net.nfs.client.4.3.2.0, but IX86737 also requiresthat we apply 4.3.2.6 level of bos.net.nfs.client.
# instfix -icvk IX86737#Keyword:Fileset:ReqLevel:InstLevel:Status:AbstractIX86737:bos.64bit:4.3.2.6:0.0.0.0:!:web server performance improvementsIX86737:bos.adt.include:4.3.2.6:0.0.0.0:!:web server performance improvementsIX86737:bos.adt.prof:4.3.2.6:0.0.0.0:!:web server performance improvementsIX86737:bos.adt.syscalls:4.3.2.2:0.0.0.0:!:web server performance improvementsIX86737:bos.atm.atmle:4.3.2.6:0.0.0.0:!:web server performance improvementsIX86737:bos.mp:4.3.2.7:0.0.0.0:!:web server performance improvementsIX86737:bos.net.ipsec.rte:4.3.2.3:4.3.2.0:-:web server performance improvementsIX86737:bos.net.nfs.client:4.3.2.6:4.3.2.0:-:web server performanceimprovementsIX86737:bos.net.tcp.client:4.3.2.6:4.3.2.10:+:web server performanceimprovementsIX86737:bos.net.tcp.server:4.3.2.6:4.3.2.9:+:web server performanceimprovementsIX86737:bos.rte.libc:4.3.2.6:4.3.2.11:+:web server performance improvementsIX86737:bos.rte.tty:4.3.2.6:4.3.2.8:+:web server performance improvementsIX86737:bos.sysmgt.serv_aid:4.3.2.4:4.3.2.6:+:web server performanceimprovementsIX86737:bos.up:4.3.2.7:4.3.2.11:+:web server performance improvementsIX86737:devices.common.IBM.atm.rte:4.3.2.3:0.0.0.0:!:web server performanceimprovementsIX86737:devices.common.IBM.ethernet.rte:4.3.2.2:4.3.2.3:+:web serverperformance improvementsIX86737:devices.pci.14100401.rte:4.3.2.3:0.0.0.0:!:web server performanceimprovementsIX86737:devices.pci.14107c00.com:4.3.2.5:0.0.0.0:!:web server performanceimprovements
28 WebSphere V3 Performance Tuning Guide

Chapter 5. WebSphere Engine
Version 3.0 of the WebSphere Application Server introduced a new runtime andsystems management infrastructure. The new Systems Managementinfrastructure introduced a new “look and feel” that is significantly different fromthe administration tools in prior versions of WebSphere. Primary among thesechanges is the storing of the Application Server configuration in 34 entity EJBs ina UDB or Oracle database (InstantDB is also available for Standard Edition). Thismeans that changes to the system configuration need to be made through theAdministrative Console (“adminclient”) pictured below, not by changing settings inproperties files as was the case in previous versions. While there are still anumber of properties files in the WebSphere directory structure, these areintended primarily for debugging and should not be used for making theconfiguration changes described below.
Figure 18. Administrative Console
For an application server in WebSphere V3 there are a number of settings thathave an impact on performance. In addition to the settings for the applicationserver itself there are also a number of settings for the various components of anapplication server: Servlet Engine, Web Application, and the EJB Container thatcan affect performance.
The WebSphere Engine has several parameters that will influence the overallperformance of your Web site. The following parameters are set using theWebSphere Application Server Administrative Console:
• JVM
• Transport Queue
• Servlets Auto Reload
© Copyright IBM Corp. 1999 29

• EJB Container
• ORB
The parameters listed above will be discussed in detail in the following sections.
5.1 JVM
WebSphere requires a JVM to run. Though WebSphere ships with a default JVM,on some platforms alternate JVMs can be used. In general, upgrading to thelatest 1.1.n level will provide better performance as JVM technology is continuallyimproving.
5.1.1 Selecting a JVMOn AIX, two JDKs are currently supported: JDK 1.1.6 PTF 9 and JDK 1.1.8 PTF4. All tests for this redbook were run using JDK 1.1.6 PTF 9.
5.1.2 Tuning the JVMThe JVM offers several tuning parameters that will impact the performance ofWebSphere (which is primarily a Java application), as well as your ownapplications. In WebSphere V3, JVM parameters are set via the command linearguments of the Application Server on the Administrative Console. TheCommand Line Arguments are located on the General tab for each applicationserver (Trade Server in Figure 19 on page 31). Highlight the application server foryour node in the WebSphere Administrative Domain to get to this tab.
Click Topology tab -> <node> -> <application server> as shown in Figure 19 onpage 31.
There are five topics for JVM performance tuning:
• Heap Size
• JIT
• Garbage Collection
As of late December 1999, the only supported JVM for Windows NT is the IBMDeveloper Kit and Runtime Environment for Windows, Java TechnologyEdition, Version 1.1.7p that ships with WebSphere V3. It has incorporated via"backporting" some of the features from JDK 1.2 such as JDBC as well as theJava ORB from JDK 1.3.
JDK for Windows NT
On Solaris, a Solaris-tuned JVM (currently Solaris JDK 1.1.7_08) availablefrom SunSoft will typically outperform the base Solaris referenceimplementation from JavaSoft. WebSphere V3 ships the JavaSoft referenceimplementation. WebSphere for Solaris ships with the JavaSoft JDK fromJavaSoft. You can also go to the Sun Web site and download the SunSoft JDKfor Solaris. The SunSoft JDK typically performs better than the JavaSoft JDK.
JDK for Solaris
30 WebSphere V3 Performance Tuning Guide

• Java Stack Size
• Native Thread Stack Size
Figure 19. JVM Parameters settings
5.1.3 JVM heap sizeJava mx and ms are used to set:
• The maximum heap for the JVM
• The starting (minimum) heap for the JVM
When running performance tests, the best performance will typically be realizedwhen ms and mx heap values are equal. Setting mx and ms heap values equalduring performance runs provides highly repeatable results by eliminating any heapgrowth. This may not necessarily be appropriate in a production environment whereother system resources may need to utilize the physical memory that would beallocated by setting these two values equal.
As a starting point on AIX (also Windows NT and Solaris with the JavaSoft JDK)consider setting the maximum heap size to 1/4 the total physical memory on theserver and setting the minimum to 1/2 of the maximum.
For example, for a server with 512 MB of memory:
-ms64m -mx128m (mx = 1/4 physical memory, ms = 1/2 mx)
Chapter 5. WebSphere Engine 31

Bigger is not always better for heap size. In general increasing the size of theJava heap improves throughput to the point where the heap no longer resides inphysical memory. Once the heap begins swapping to disk, Java performancedrastically suffers. Therefore, the mx heap setting should be set small enough tocontain the heap within physical memory. This will depend on your particularconfiguration since physical memory usage must be shared between the JVMand other applications.
The other issue to consider when increasing the heap size is that whilethroughput will be improved, pause times will increase. Large heaps can takeseveral seconds to fill up, but garbage collection occurs less frequently. Ingeneral, it is probably good practice not to set the maximum heap size larger than256 MB without extensive testing and monitoring (with -verbosegc) of yourapplication under load.
The sizing guidelines mentioned above should prove adequate for mostapplications. You can refine your heap size settings even further by running testsutilizing the -verbosegc command line argument. This additional output is loggedby stderr for the application server.
Some sample output from -verbosegc is shown below. This first entry occurredduring server startup without a load applied. The first thing to consider will beincreasing the minimum heap size (-ms).
Of course you’ll need to further examine the output in order to make an estimateof how much to increase the minimum heap size. By looking for at the lastoccasion where the JVM heap size was increased you’ll have a good startingpoint. In the example below we can see on the last line that the heap size wasincreased to just over 29 MB by the JVM. As a result we chose to increase theminimum heap size to 32 MB.
Sun recommends that ms be set to somewhere between 1/10 and 1/4 of the mxsetting. They do not recommend ever setting ms and mx to be the same. Thishas to do with their garbage collection algorithms and the need for Sun to trackthe memory as it is allocated. An example JVM setting is as follows:
-ms32m -mx128m (mx = 1/4 physical memory, ms = 1/4 mx)
Solaris with the SunSoft JDK
<AF[1]: managing allocation failure. need 1040 bytes, action=1(80688/16777208)><GC: not GC'ing classes: 0 verifier running><GC(1): freed 258785 objects, 14314168 bytes in 323 ms, 85% free(14394256/16777208)><GC(1): mark: 102 ms, sweep: 105 ms, compact: 116 ms><GC(1): moved 37493 objects, 2124448 bytes in 116 ms>
<FIN: async finalizer thread waking>
32 WebSphere V3 Performance Tuning Guide

In this example it turned out that increasing the minimum heap size to 32 MB wasstill not sufficient to prevent garbage collection from occurring during startup, butit did prevent the JVM from growing the heap during testing. We then increasedthe minimum heap size to 48 MB. This setting did prevent garbage collection fromoccurring during system startup and also resulted in our best throughput.
In our testing we found the best performance came with settings of -ms192m and-mx192m. Recall that this was on a two-way AIX server with 512 MB of RAM.
5.1.4 JITBy default on JDK 1.1.6 for AIX and JDK 1.1.7 for Windows NT the Just In Time(JIT) compiler is turned on. This results in significantly better performance and wevalidated this in our tests. It's unlikely that you would ever want to turn the JITcompiler off for performance reasons, but in some cases it might be necessary todo so for debugging purposes.
As with the other JVM arguments, this is specified on the Application Servercommand line arguments. The specific arguments vary with each JDK. For AIXand Windows NT the arguments to turn JIT off are:
-Djava.compiler=off (AIX)
-nojit (Windows NT)
Again, these arguments turn JIT off, so you would normally not specify theseexcept for debugging purposes.
<AF[22]: managing allocation failure. need 1552 bytes, action=2(18071624/27222008)><FIN: async finalizer thread waking><AF[22]: synchronously running 399 finalizers><GC: not GC'ing classes: 0 verifier running><GC(29): freed 6368 objects, 488752 bytes in 499 ms, 67% free(18255704/27222008)><GC(29): mark: 450 ms, sweep: 49 ms, compact: 0 ms>
<AF[22]: managing allocation failure. need 1552 bytes, action=3(18255704/27222008)><AF[22]: zeroed 6 of 6 soft refs><GC: not GC'ing classes: 0 verifier running><GC(30): freed 102 objects, 9568 bytes in 316 ms, 67% free(18265272/27222008)><GC(30): mark: 272 ms, sweep: 44 ms, compact: 0 ms>
<AF[22]: managing allocation failure. need 1552 bytes, action=3(18265272/27222008)><AF[22]: managing allocation failure. need 1552 bytes, action=4(18265272/27222008)><AF[22]: Heap Expansion due to GC ratio: 0.171187.><AF: expanded heap by 2637824 to 29859832 bytes, 70% free>
With JDK 1.1.8 for AIX you will need to turn JIT off, in which case it would beappropriate to specify this argument.
Note
Chapter 5. WebSphere Engine 33

5.1.5 Garbage collectionThe WebSphere performance lab in Raleigh has seen cases on Solaris usingEJBs where turning off asynchronous garbage collection ("-noasyncgc") actuallyimproved performance significantly. You can also turn off class garbage collectionto enable more class reuse. The parameter is set on the server command line:
-noasyncgc (using -noasyncgc on Solaris may occasionally improveperformance)
-noclassgc ("no" will enable more class reuse; default is for classgc to beon)
Specifying -noasyncgchad no significant impact on performance nor did specifying-noclassgc.
5.1.6 Java stack and native thread stack sizeJava stack size and the native thread stack size are set with the -oss and -ss
command line arguments. Specifying a size of 819200 for both resulted in a slightperformance improvement (less than 1%).
Setting these values to 409600 did result in performance degradation ofapproximately 16% from our baseline (819200). Conversely we encounteredproblems in starting the application server when they were set to too large avalue. When we set these to 1638400 we received a java.lang.OutOfMemoryError:
cannot create anymore threads message. If you wish to specify a value on thecommand line of your application server, recommended starting points would be:
-oss=819200: Java Stack Size
-ss=819200: Native Thread Stack Size
34 WebSphere V3 Performance Tuning Guide

When making changes to some of the settings described above such as JVMheap size (-ms and -mx) take care when typing. If you make a mistake you’lllikely encounter the error depicted below: Server start failed (in Figure 20 thename of the server is “Default Server”). In addition to the messages in red inthe console messages section, you’ll notice the yellow icons with “?” in them.You’ll need to highlight the server you were trying to start (as depicted below),and stop the server (right mouse button --> stop or depress the red button atthe top of the console). In some cases it might be necessary to affect a “forcestop” of the server (highlight the server --> right mouse button - force stop)which marks the processes as stopped in the repository. Once you’ve stoppedthe server review, and correct your command line arguments before startingthe server again (don’t forget to click the Apply button after you make yourchanges or corrections).
An additional word of caution: for some arguments the order matters. If youchange the -oss, -ss, classgc, or Djava.compiler arguments, these need tocome immediately after the -ms, -mx arguments and immediately precedingany other command line arguments.
Figure 20. Command line arguments
Command Line Arguments - Making Changes
Chapter 5. WebSphere Engine 35

5.2 Transport queue
Remember that each application server in your WebSphere Application Severproduct is comprised of an enterprise bean container and servlet engine. To routeservlet requests from the Web server to the servlet engines, the productestablishes a transport queue between the Web server plug-in and each servletengine.
You can adjust the transport queue to improve performance. There are threeparameters that you need to consider:
1. Queue type2. Transport type3. Maximum connections
as shown in Figure 21.
Figure 21. Transport queue tuning
The queue type is of central importance. If distributing servlet requests from theWeb server to servlets on remote machines known as “redirecting servlets”, youshould use an IIOP-based queue. We will discuss this setting in 5.2.4, “Queuetype for servlet redirector” on page 38. If not constrained to use IIOP, you shoulduse Open Servlet Engine (OSE). The second tuning point is the transport type.And the last one is the number of maximum connections.
5.2.1 Queue type: OSEThe OSE will provide the best performance for the transport queue between the Webserver plug-in and WebSphere servlet engine. The queue type is configured fromthe Advanced tab for the Servlet Engine (Topology tab -> WebSphereAdministrative Domain -> node -> Application Server -> Servlet Engine ->Advanced) as shown in Figure 22 on page 37.
HTTPServer
ServletEngine
1. Queue Type?OSEHTTP
NONE
2. Transport Type?Local Pipes(AIX, NT)INET Sockets(Solaris)Java TCP/IP
(OLT/OLD)
3. MaximumConnections?(default: 100)
36 WebSphere V3 Performance Tuning Guide

Figure 22. Servlet Engine: Advanced
5.2.2 Transport typeThe Servlet Engine Transport Type is edited by selecting Settings from theAdvanced tab for the servlet engine after choosing OSE. You have three choicesas shown in Figure 23.
Figure 23. Transport Type
Local Pipes is the default on Windows NT and AIX and typically performs fasteston those platforms.
INET Sockets is the default on Solaris and typically performs better under loadthan Local Pipes.
Chapter 5. WebSphere Engine 37

JAVA TCP/IP is only provided for debugging in special cases. For the most part youshould never specify Java TCP/IP since OLT/OLD support for this transport is lackingin the runtime.
For those readers familiar with WebSphere V2.0 the Servlet Engine TransportType replaces ose.outofproc.transport.type.
5.2.3 Maximum connectionsThe Max Connections parameter on the Servlet Engine Advanced tab, as shownin Figure 25 on page 40, specifies the number of connections to use for thecommunication channel between the Web server and the WebSphere engine.Each connection represents a request for a servlet.
Typically, optimum performance and stability will be achieved by setting theMaxConnections slightly less than or equal to the number of threads or processesthat are running within the Web server.
For example, if the IHS AIX MaxClients parameter is set at 50, theMaxConnections parameter should be set to 50 or slightly lower.
More is not necessarily better for this. In our testing with MaxClients set to 50 onIHS, we found that performance did not vary significantly as we varied MaxConnections from 30 to 55. Once we increased Max Connections to 60 howeverwe noticed a significant performance decrease.
In testing for your application and hardware infrastructure you’ll want to makesmall changes (5 or less) in this parameter until you determine what’s optimal foryour environment.
For those familiar with WebSphere V2, the Max Connections property replacesthe ose.outofproc.link.cache.size property.
5.2.4 Queue type for servlet redirectorWhen configuring WebSphere in a cluster that includes use of a servlet redirectorit is possible to change the Queue Type for the Servlet Engine from “OSE” to“NONE”. You can continue to use the OSE (default) or HTTP queue type but it'scounterproductive. When using the servlet redirector there is no longer a localqueue or transport (INET Sockets or Local Pipes). All incoming servlet requestsflow over RMI/IIOP from the servlet redirector to the application server(s) wherethe servlet engine(s) are running.
By specifying "NONE" you eliminate the cost of starting and running a processthat is never used. This prevents the application server from unnecessarily loadingthe transport layer and all of its associated threads, which saves resources on theserver machine(s). The result is that you have more resources available toperform "real work" (responding to servlet requests) and performance is better.
Recall that in the configuration where the application server is located on a separateserver from the HTTP server and the servlet redirector is used, all communicationbetween machines is via IIOP. Hence there is no need for a queue on the machinethat is running the application server. This is illustrated in the diagram in Figure 24 onpage 39, which shows one possible means of configuring the servlet redirector.
38 WebSphere V3 Performance Tuning Guide

Figure 24. Servlet redirector and queue type
To change the queue type, navigate to the Servlet Engine for the application servervia the Topology tab. Highlight the Servlet Engine, then click the Advanced tab andchange the queue type from OSE to NONE, and then click the Apply button asdepicted in Figure 25 on page 40.
In our testing we saw performance improvements of up to 14% by changing thequeue type from OSE to NONE for the configuration depicted in Figure 24 onpage 39.
WASConfigurationRepository
HTTPServer
BusinessApplicationData
Machine A MachineBMachine C
ServletRedirector
AdministrationServer
AdministrationClient
(Console)
ApplicationServer(s)
AdministrationServer
DB2Client
DB2Client
OSE
HTTP(s)
JDBCIIOP
You cannot specify "none" as the queue type in conjunction with INET Socketson Solaris; you must specify OSE as the queue type on Solaris.
Note
Chapter 5. WebSphere Engine 39

Figure 25. Queue type
5.3 Servlets Auto Reload
With WebSphere V3, you can set parameters specific for each Web applicationthat is deployed. WebSphere has an auto reload capability that specifies whetherto automatically reload servlets in the Web application when their class fileschange. This capability may simplify testing and management of your Web site byenabling you to quickly modify your site without restarting the server; however,this dynamic ability to reload servlets and associated polling will have a negativeimpact on performance. Once you are in production mode, you should turn offAuto Reload.
This property is accessed by navigating to the web application: Topology ->WebSphere Administrative Domain -> Node -> Application Server -> servletEngine -> web application -> Advanced tab (the values for Node, ApplicationServer, Servlet Engine and web application in the picture are: alcott,Trade Server,serveltEngine and trade_app) and then scrolling down to the bottom of the tab toAuto Reload. Using the pull-down, change the value from True (the default) toFalse and select Apply and Changing (alcott in the picture) (trade_app in thepicture). See Figure 26 on page 41.
There is also a Reload Interval property, as shown in Figure 26 on page 41, thatcan be used to control the number of seconds between class reloading. Analternative to changing Auto Reload to False would be to change the value forReload Interval to a very high interval for reload.
40 WebSphere V3 Performance Tuning Guide

Figure 26. Web Application: Auto Reload
5.4 EJB Container
With the EJB Container in WebSphere V3, you can specify several settings forthe container cache that can impact performance. These settings areaccessible from the Advanced tab on the EJB container (Topology tab ->node -> Application Server -> EJB Container). This is depicted for theDefault Container in Figure 27 on page 42. The defaults are shown in thesame figure.
Chapter 5. WebSphere Engine 41
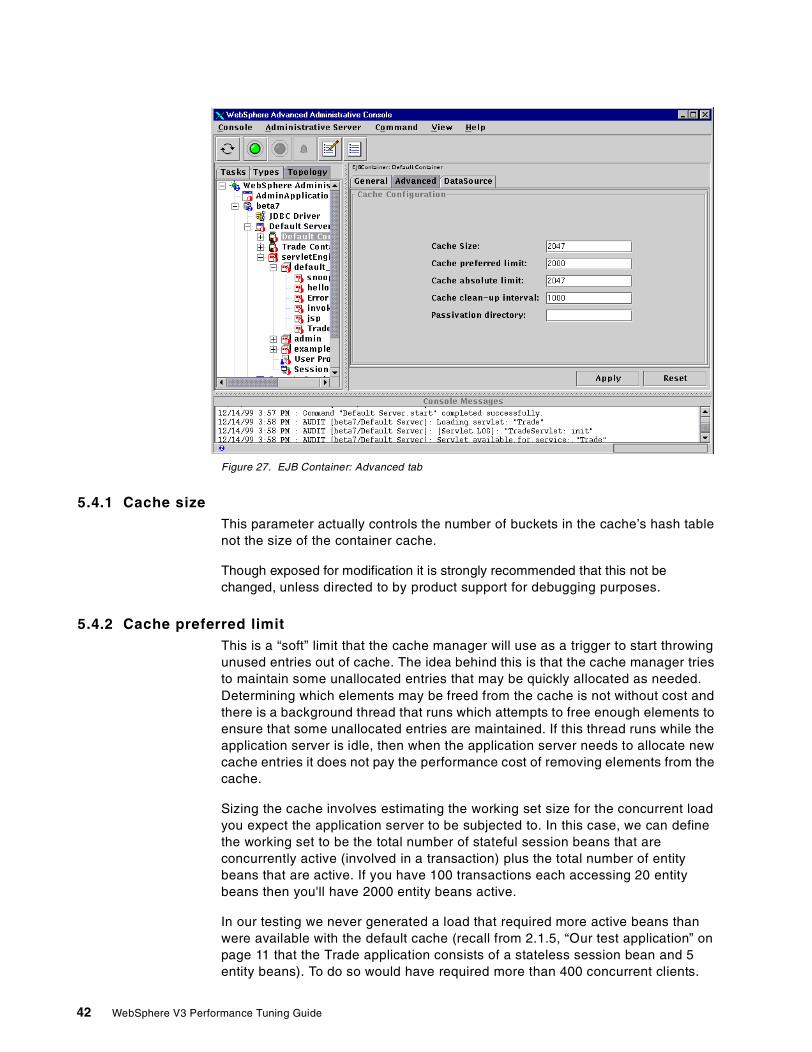
Figure 27. EJB Container: Advanced tab
5.4.1 Cache sizeThis parameter actually controls the number of buckets in the cache’s hash tablenot the size of the container cache.
Though exposed for modification it is strongly recommended that this not bechanged, unless directed to by product support for debugging purposes.
5.4.2 Cache preferred limitThis is a “soft” limit that the cache manager will use as a trigger to start throwingunused entries out of cache. The idea behind this is that the cache manager triesto maintain some unallocated entries that may be quickly allocated as needed.Determining which elements may be freed from the cache is not without cost andthere is a background thread that runs which attempts to free enough elements toensure that some unallocated entries are maintained. If this thread runs while theapplication server is idle, then when the application server needs to allocate newcache entries it does not pay the performance cost of removing elements from thecache.
Sizing the cache involves estimating the working set size for the concurrent loadyou expect the application server to be subjected to. In this case, we can definethe working set to be the total number of stateful session beans that areconcurrently active (involved in a transaction) plus the total number of entitybeans that are active. If you have 100 transactions each accessing 20 entitybeans then you'll have 2000 entity beans active.
In our testing we never generated a load that required more active beans thanwere available with the default cache (recall from 2.1.5, “Our test application” onpage 11 that the Trade application consists of a stateless session bean and 5entity beans). To do so would have required more than 400 concurrent clients.
42 WebSphere V3 Performance Tuning Guide

We did, however, decrease the size of the cache several times under load beforewe noticed a change in performance. In fact performance did not changesignificantly until we decreased the Cache preferred limit to 20, and Cacheabsolute limit to 27.
Our recommendation would be to estimate the number of active beans in themanner described earlier (the number of beans * the number of concurrent clientsthat are accessing beans) to use this as a starting point for your testing. You'llthen need to monitor the total number of active beans (you can see the number inthe Active Beans column) under load using the WebSphere Resource Analyzerdepicted in Figure 28 and adjust the number of beans upward as necessary. Notethat increasing the number of beans in cache can increase the JVM in use, soyou may need to modify the JVM maximum heap size as a result.
5.4.3 Cache absolute limitThis is the absolute limit for entries that will be maintained in cache by thecontainer cache manager. The container will fail to allocate new bean instanceswhen the total number of active beans reaches this limit.
5.4.4 Cache cleanup intervalThis is the interval in milliseconds for the background thread discussed abovethat attempts to ensure that there are always free elements in the cache (thedifference between the cache absolute limit and the cache preferred limit). Ingeneral this parameter should be increased as the cache size increases but inour testing we never generated a load sufficient to require increasing the cacheand thus were not able to determine a specific recommendation for changing this.
Figure 28. Monitor the total number of active beans
Chapter 5. WebSphere Engine 43

5.4.5 Option A and option C caching performance considerationsWebSphere V3.02 allows you to choose between Option A (“exclusive”) cachingand Option C (“shared”) caching as defined by the EJB specification. The defaultfor this property is “shared” and is specified by from the Database accessproperty on each enterprise bean. This property is accessed by navigating toTopology tab -> node -> Application Server -> EJB Container ->EnterpriseBean as shown in Figure 29.
Figure 29. Option A and Option C caching
With option C caching (“shared”), the cache size will typically have very littleeffect on performance since beans are cached for the duration of the transactionthey are involved in. To understand this, consider two sequential transactions thattouch bean A. The first transaction loads the bean into the cache, does its work,commits, and removes the bean. The second transaction then has to reload thebean and repeat. As long as there is room in the cache, the performance of thisscenario will be the same regardless of whether there are 100 or 10,000 otherbeans in the cache. The primary reason to change the cache size when usingoption C caching is to ensure that it can hold the entire working set required byhighly concurrent loads.
With option A caching (“exclusive”) there is a potential performance benefit froma larger cache. Namely, that loading the persistent state of the bean from thedatabase will be amortized over multiple transactions. If the cache can hold morebeans and the workload has reasonable locality then the chances for a cache hitgo up with cache size.
44 WebSphere V3 Performance Tuning Guide

There is no guarantee that a larger cache will increase application performance.If the application has poor locality then the overhead of the larger cache(increased garbage collection in the JVM, increased process size, cost of cachemanagement) may outweigh any benefits.
5.4.6 Number of containersYou'll typically realize your best performance by deploying all your EJBs in asingle container per application server. This minimizes the cost (in JVM heapsize) associated with creating a container inside the application server and allowsthe container to optimize the cache. The net effect is that when you createmultiple containers, you've increased the process overhead in the JVM, withoutany gain in performance.
5.5 ORB
There are several settings controlling internal ORB processing that can be usedto improve application performance when EJBs are used.
EJB programming is a remote programming style. Like other remoteprogramming styles such as DCE and CORBA, when you invoke a remote objecta local representation (proxy) is created. This local proxy is the localrepresentation of the remote object. All client interaction is through this proxy, theclient does not "talk" directly with the remote object.
Normally, Remote Method Invocation (RMI) is Pass By Value (a copy of thecalling functions arguments used by the object being called), regardless of in- orout-process.
When both the client and the remote object are in the same JVM, for in-processcalls (that is one EJB to another), local copies can be disabled allowing the objectbeing called to get a reference to the calling arguments. In other words, we canget a reference to the calling arguments instead of using “pass by value" andcreating a copy/proxy.
This eliminates the process cost of creating the "proxy object". This seems toimprove performance by better than 10%.
In order to disable local copies, you need to add the following two arguments tothe Command line arguments for your application server as shown in Figure 30:
-Djavax.rmi.CORBA.UtilClass=com.ibm.CORBA.iiop.Util
-Dcom.ibm.CORBA.iiop.noLocalCopies=true
There is a significant restriction for using option A caching: the applicationserver must be the only updater of the data in the persistent store. This meansyou cannot use option A caching with WLM'ed servers or with a database thatis shared among multiple applications that are trying to modify the data.
Note
Chapter 5. WebSphere Engine 45

Figure 30. ORB Tuning
While the use of "noLocalCopies" can improve performance, there can also beunintended side effects. A possible unintended side effect is illustrated with thefollowing example:
void execute() {MyObject myObject = new MyObject();myObject.setString("hello");remoteObject.foo(myObject);System.out.println(myObject.toString());}
RemoteObject...void foo(MyObject obj) {obj.setString("hello world");}
Without "noLocalCopies", the method call to foo passes a copy of MyObject.When the foo method modifies the value of the String field (via setString), ithas no bearing on the original object. This results in the output of "hello".
With "noLocalCopies", the method call to foo passes an object reference ofMyObject. When the foo method modifies the value of the String field (viasetString), it has an effect on the original object. This results in the output of"hello world".
Use caution when using "noLocalCopies"
46 WebSphere V3 Performance Tuning Guide
We made the following modifications to thecom.ibm.ejs.sm.util.process.Nanny.adminServerJvmArgs line in the/<was_dir>/bin/admin.config file. We added three entries in addition to-mx128m, which is the default:
-mx128m -ms64m -Djavax.rmi.CORBA.UtilClass=com.ibm.CORBA.iiop.Util
-Dcom.ibm.CORBA.iiop.noLocalCopies=true
As we discussed before, the first argument increases the minimum heapsize for the JVM that the WebSphere adminserver process uses. And alsowe've discussed what the second one does as well. Since WebSphere isbuilt on an RMI/IIOP and EJB architecture (just like applications), theadminserver starts faster (~25%) and seems to perform better, as does theadminclient. This seems most pronounced on UNIX. There doesn't seem tobe as much improvement on Windows NT.
Tuning for the adminserver
Chapter 5. WebSphere Engine 47

48 WebSphere V3 Performance Tuning Guide

Chapter 6. Security
In V3 of WebSphere Application Server the security infrastructure is designed tosupport a single integrated policy to govern the security of Web pages, servlets,and enterprise beans. The infrastructure provides for management of the securitypolicies and services provided by both WebSphere Standard and AdvancedEditions in a distributed manner utilizing the WebSphere systems console(adminclient).
Among the improvements in security implementation in V3 of WebSphere from V2are the integration of HTML, JSP file, servlet, and enterprise bean security. V3 ofWebSphere also provides for an HTTP Single Sign-On solution, as well assupport for modes of delegation between WebSphere servers and secure Javaclients. Finally V3 improves on Lightweight Directory Access Protocol (LDAP)support for use as a security registry when compared to V2.
6.1 WebSphere security overview
The WebSphere Application Server runtime relies on Remote Method Invocation/Internet Inter-ORB Protocol (RMI/IIOP) for all interprocess communication. WhenWebSphere security is enabled all interprocess communication is encrypted withSecure Sockets Layer (SSL), thus all communications use RMI/IIOP/SSL. As isthe case when encrypting HTTP with SSL for HTTPS, there are performanceimpacts. Once the security is enabled additional processes are invoked for theapplication.
As an example consider the process flow for the Inc Bean sample that ships withWebSphere depicted in Figure 31 on page 49.
Figure 31. The process flow for the Inc Bean sample
servlet engine
Application Server
EJB container
IncServlet
IncBean
W eb serverplug-in
servlet request
servlet invocation
Web server
© Copyright IBM Corp. 1999 49
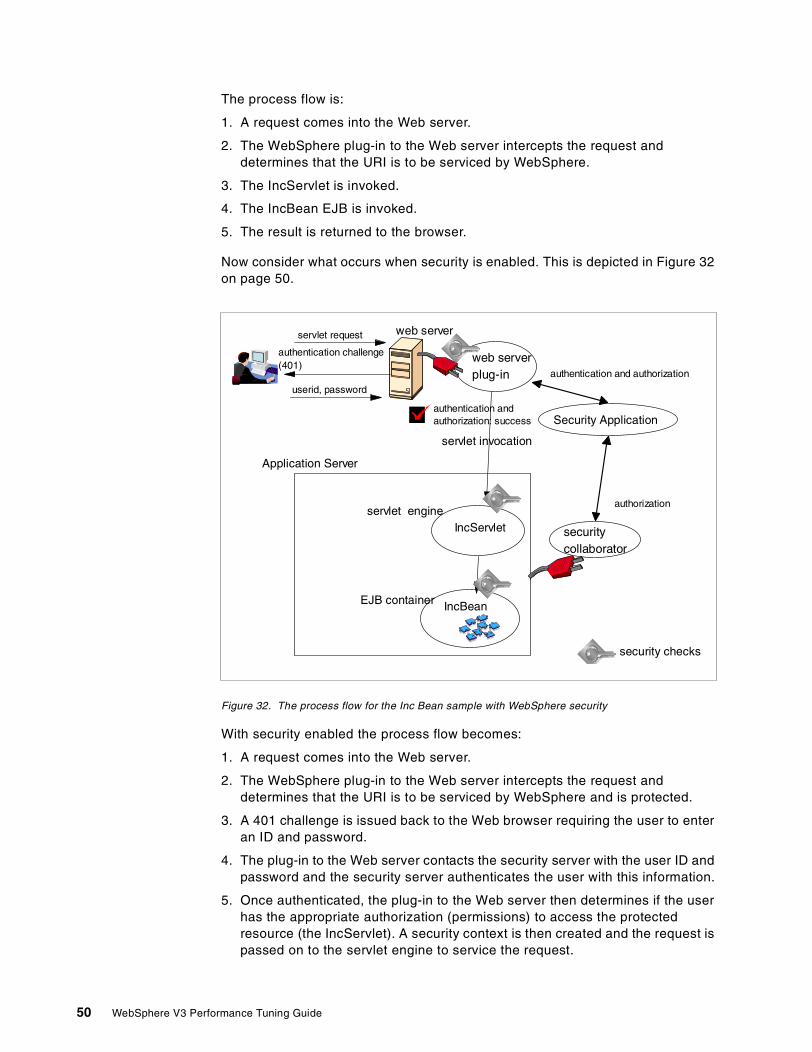
The process flow is:
1. A request comes into the Web server.
2. The WebSphere plug-in to the Web server intercepts the request anddetermines that the URI is to be serviced by WebSphere.
3. The IncServlet is invoked.
4. The IncBean EJB is invoked.
5. The result is returned to the browser.
Now consider what occurs when security is enabled. This is depicted in Figure 32on page 50.
Figure 32. The process flow for the Inc Bean sample with WebSphere security
With security enabled the process flow becomes:
1. A request comes into the Web server.
2. The WebSphere plug-in to the Web server intercepts the request anddetermines that the URI is to be serviced by WebSphere and is protected.
3. A 401 challenge is issued back to the Web browser requiring the user to enteran ID and password.
4. The plug-in to the Web server contacts the security server with the user ID andpassword and the security server authenticates the user with this information.
5. Once authenticated, the plug-in to the Web server then determines if the userhas the appropriate authorization (permissions) to access the protectedresource (the IncServlet). A security context is then created and the request ispassed on to the servlet engine to service the request.
servlet engine
securitycollaborator
authorization
Application Server
EJB container
IncServlet
IncBean
web serverplug-in
Security Application
servlet request
authentication challenge(401)
userid, password
authentication and authorization
authentication andauthorization: success
servlet invocation
web server
security checks
50 WebSphere V3 Performance Tuning Guide

6. Before allowing the request to be processed, the security context is checkedto ensure that the user is authorized to invoke the method on the servlet.
7. When the IncServlet invokes a method on the IncBean, once again thesecurity context is checked to ensure that the caller has the appropriatepermissions to invoke the increment() method in the IncBean.
8. The method is then invoked and the result is returned to the browser from theservlet engine.
As can be seen, the number of steps have nearly doubled when security isenabled, plus the overhead of SSL is added to the additional steps. Whensecurity is enabled, performance is degraded by about 50%.
Now that we’ve explained why there’s an impact, the obvious question is whatcan be done to minimize the performance impact.
6.2 Configuring security
Security in WebSphere V3 is a global setting enabled from the Tasks tab of theWebSphere Administration Console Tasks -> Security ->Specify GlobalSettings as shown in Figure 33.
Figure 33. Security global settings
6.2.1 Enabling securitySelecting Enable Security as depicted in Figure 34 on page 52 will result in SSLencryption of all interprocess communication in WebSphere. Also, all subsequentinvocations of the WebSphere Administrative Console will result in achallenge/authentication dialog prompt once the adminserver has been restarted.
Chapter 6. Security 51

Figure 34. Enable Security
6.2.2 Security cache timeoutOn the same tab on which you enable WebSphere security as depicted in Figure34, there is setting for the Security Cache Timeout that can influenceperformance. This timeout specifies how often the security-related caches needto be refreshed. The information on beans, permissions, and credentials are allcached. Every time the cache is refreshed the values become invalid.Subsequent requests for those values potentially result in a database lookup oreven an LDAP-bind or native authentication.
In a simple 20-minute test case, we raised the cache timeout from the600-second default to 6000 seconds so that it did not time out during the run, andachieved a 40% performance improvement. You can experiment here to find thebest trade-off (performance versus how long you want the security cache toremain valid) for your application based on your site usage and your businessrules.
Once security is enabled you’ll still need to create an enterprise application tospecify security for each object and its methods.
Customer will need to create an enterprise app to specify security for eachobject and its methods.
Note
52 WebSphere V3 Performance Tuning Guide

6.2.3 SSL V3 timeoutThere is one property for the SAS (Secure Association Server) that isperformance related. This is the com.ibm.CORBA.SSLV3SessionTimeoutproperty value, which is set by default to 9600 secs. This is the time interval afterwhich SSL sessions are renegotiated. This is a high setting, and probably won'trealize any significant impact from modification. The SAS parameters aremodified by editing the "sas.server.props" and "sas.client.props" files found in the<wasroot>/properties directory as depicted in Figure 35 and Figure 36 on page54.
Also note that SAS establishes an SSL connection only if it goes out of the ORB(to another ORB), so if all the beans are CO-located within an ORB, then SAS'sSSL performance should not be hindered.
Figure 35. sas.server.props
#SAS Properties - Editable#Wed Jun 16 17:27:51 EDT 1999com.ibm.CORBA.loginUserid=demousercom.ibm.CORBA.loginPassword=demopasswdcom.ibm.CORBA.securityEnabled=falsecom.ibm.CORBA.authenticationTarget=LOCALOScom.ibm.CORBA.delegateCredentials=methodDefinedcom.ibm.CORBA.principalName=my.domain.name/demouser#SAS Properties - DO NOT EDIT#Wed Jun 16 17:27:51 EDT 1999com.ibm.CORBA.SSLKeyRing=com.ibm.websphere.DummyKeyringcom.ibm.CORBA.SSLKeyRingPassword=WebAScom.ibm.CORBA.SSLClientKeyRing=com.ibm.websphere.DummyKeyringcom.ibm.CORBA.SSLClientKeyRingPassword=WebAScom.ibm.CORBA.SSLTypeIServerAssociationEnabled=truecom.ibm.CORBA.SSLTypeIClientAssociationEnabled=truecom.ibm.CORBA.SSLV3SessionTimeout=9600com.ibm.CORBA.standardClaimQOPModels=integritycom.ibm.CORBA.standardPerformQOPModels=confidentialitycom.ibm.CORBA.loginTimeout=30com.ibm.CORBA.loginSource=propertiescom.ibm.CORBA.LTPAServerAssociationEnabled=truecom.ibm.CORBA.LTPAClientAssociationEnabled=falsecom.ibm.CORBA.keytabFileName=c:/websphere/etc/keytab5com.ibm.CORBA.securityDebug=nocom.ibm.CORBA.securityTraceLevel=nonecom.ibm.CORBA.bootstrapRepositoryLocation=c:/websphere/etc/secbootrepcom.ibm.CORBA.disableSecurityDuringBootstrap=falseLOCALOS.server.id=demouserLOCALOS.server.pwd=demopasswd
Chapter 6. Security 53

Figure 36. sas.client.props
6.3 The invoker servlet
The invoker servlet is a special servlet that is created as part of the sampledefault configuration. While useful for a development environment, this servletexacts a very slight performance penalty. More important is the security risk thatthis servlet represents.
For those of you not familiar with “invoker”, this is a servlet that has a servicemethod only. This service method searches the classpath for other servlets andthen invokes (or executes) them. This allows you to place servlet class files in thedefault directory and execute them without defining them. The easiest way to seethis is to use the servlet snoop. You’ll notice that snoop is defined in thedefault_app and can be called in a browser as http://localhost/servlet/snoop.When this happens you’ve called the servlet directly, and invoker is not required.However if you choose to call snoop by its class name,http://localhost/servlet/SnoopServlet, then invoker is used to service thisrequest. If you look closely at the Request Information section on the pagereturned to the browser you’ll see different URIs and paths returned for each ofthese even though they are the same servlet. You can also go to the WebSphereResource Analyzer and monitor the number of executions of each servlet as youpress Enter on your browser.
While the performance cost of using the invoker servlet to execute your servletsis negligible, of significant importance is the fact that this exposes your Web siteto unauthorized execution of servlets. In WebSphere V3 the permissions aredefined by URL, so if you alias a servlet /servlet/something, then the permissionsaren’t applied to /servlet/com.someone.something. This can we worked aroundby securing both URLs for each servlet. The other possible issue is that aprovider of a support class library could sneak a servlet into their JAR file and useit as a back door into Web sites.
com.ibm.CORBA.securityEnabled=truecom.ibm.CORBA.loginSource=promptcom.ibm.CORBA.loginTimeout=30com.ibm.CORBA.loginUserid=com.ibm.CORBA.loginPassword=com.ibm.CORBA.keytabFileName=/usr/WebSphere/AppServer//etc/keytab5com.ibm.CORBA.SSLTypeIClientAssociationEnabled=truecom.ibm.CORBA.SSLTypeIServerAssociationEnabled=truecom.ibm.CORBA.LTPAClientAssociationEnabled=falsecom.ibm.CORBA.LTPAServerAssociationEnabled=truecom.ibm.CORBA.authenticationTarget=LocalOScom.ibm.CORBA.SSLKeyRing=com.ibm.websphere.DummyKeyringcom.ibm.CORBA.SSLKeyRingPassword=WebAScom.ibm.CORBA.SSLServerKeyRing=com.ibm.websphere.DummyKeyringcom.ibm.CORBA.SSLServerKeyRingPassword=WebAScom.ibm.CORBA.SSLV3SessionTimeout=9600com.ibm.CORBA.standardPerformQOPModels=confidentialitycom.ibm.CORBA.standardClaimQOPModels=integritycom.ibm.CORBA.bootstrapRepositoryLocation=none
54 WebSphere V3 Performance Tuning Guide

Figure 37. The invoker servlet
You remove the invoker servlet from the Web application to turn it off.
To enable the invoker servlet you either specify "Serve Servlets By Classname"when creating a Web Application (Tasks tab) or create a servlet in an existingapplication with the servlet class name:com.ibm.servlet.engine.webapp.InvokerServlet.
Chapter 6. Security 55

56 WebSphere V3 Performance Tuning Guide

Chapter 7. Database tuning
WebSphere V3 uses a relational database, called the administrative repository, tostore configuration information. The WebSphere product includes relationaldatabase software in the shipment; WebSphere Standard Edition ships withInstantDB and WebSphere Advanced Edition ships with UDB V5.2. Both editionssupport the administrative repository on UDB V5.2, UDB V6.1, and Oracle.
In addition to the administrative repository, many applications use a database astheir back-end system. In this case, database tuning can have the largest impacton your application performance.
WebSphere also can use a database for persistent sessions, which we willdiscuss in Chapter 8, “Session management” on page 75.
Figure 38. WebSphere and databases
Basically, there are two areas where tuning can affect database performance.The first area is in the WebSphere parameters relating to the database. Thesecond is the database configuration. We will not go into detail on databaseconfiguration but we will take a look at some of the most effective tuningparameters.
In this chapter, we will discuss:
• Administrative repository implementation
• DataSource object settings
• Prepared statement cache sizing
• Database configuration
7.1 The WebSphere administrative repository
WebSphere Application Server uses a database to store configuration data.Parameters like servlet name, application server name, session timeout value,and others, are stored in this administrative repository. Generally, WebSphere
Plug-in
AdminServer
HTTPServer AppServ 1
Machine AND
Machine C
Plug-inAdminServer
HTTPServer AppServ 1
Machine B
PersistentSession
DB
Machine D
Plug-in
AdminServer
HTTPServer AppServ 1
Machine A
AdministrativeRepository
Machine B
DBPlug-in
AdminServer
HTTPServer AppServ 1
Machine A
ApplicationDB
Machine B
DB
(1) (2)
(3)
© Copyright IBM Corp. 1999 57

Admin Server keeps up to four database connections open to the administrativerepository. And when you start an AdminClient the total number of connectionscan be up to seven.
The administrative repository needs to be created before bringing up WebSpherefor the first time. For example, if you are building the database with UDB thefollowing statements are used:
db2 create database wasdb2 update database configuration for was using applheapsz 256
The database name “was” is the default repository name. You will specify thisname later in the installation wizard when you start WebSphere for the first time.
It is recommended that you increase the applheapsz to 256. The applheapsz isdiscussed later in 7.4.2, “Applheapsz” on page 70.
The tables in the administrative repository will be created when you start anAdmin Server (on AIX, startupServer.sh is executed) for the first time. Starting theAdmin Server the first time will take a few minutes due to the tables being built.
WebSphere determines that the tables need to be built by looking at a setting inthe /usr/WebSphere/AppServer/bin/admin.config file.
Figure 39. admin.config (selection)
If install.initial.config is set to true, the tables will be created. If the initialization oftables has already been done, this setting will be false (see Figure 39).
If, at some time, you want to create and use a new administrative repository thesteps are easy. Simply create the new database, change the install.initial.configto true (so the tables will be created) and change the URL of the database in theadmin.config file to point to the new database (see Figure 40). This is especiallyuseful in test environments where you can try different configurations byswitching the administrative repository.
Figure 40. admin.config (selection)
In this example, the administrative repository name is was52rem. The user IDand password for the database are also stored in the admin.config file with thefollowing settings:
com.ibm.ejs.sm.adminServer.nameServiceJar=/usr/WebSphere/AppServer/lib/ns.jarinstall.initial.config=falsecom.ibm.ejs.sm.adminServer.initializer=com.ibm.ejs.security.Initializer,com.ibm.servlet.engine.ejs.ServletEngineAdminInitializer,com.ibm.servlet.config.InitialSetupInitializer
com.ibm.ejs.sm.adminServer.traceFile=/usr/WebSphere/AppServer/logs/tracefilecom.ibm.ejs.sm.adminServer.dbUrl=jdbc:db2:was52remserver.root=/usr/WebSphere/AppServercom.ibm.ejs.sm.util.process.Nanny.traceFile=/usr/WebSphere/AppServer/logs/nanny.tracecom.ibm.ws.jdk.path=/usr/jdk_base/com.ibm.ejs.sm.adminServer.dbPassword=db2inst1
58 WebSphere V3 Performance Tuning Guide

com.ibm.ejs.sm.adminServer.dbUsercom.ibm.ejs.sm.adminServer.dbPassword
Note that you can save WebSphere’s configuration by backing up the database.
The relationship between WebSphere Application Server and its administrativerepository is determined by the com.ibm.ejs.sm.adminServer.dbUrl setting in theadmin.config file. If the database is on a remote machine, this is transparent toWebSphere. It only looks for the database name, user ID and password specifiedin the database catalog. Just make sure the database connection is configuredcorrectly and working before you start the Admin Server.
Detailed information on setting up the administrative repository is found inWebSphere Application Server Advanced Edition: Getting Started (shipped withthe product).
7.1.1 Serious event reportingThe administrative repository stores event logs as well as configurations. Eventinformation will appear in the bottom pane of the Administrative Console. Eventinformation is also stored in standard output files such asdefault_server_stdout.log and default_server_stderr.log under the<was_root>/logs directory.
7.1.1.1 Serious event pool intervalThe Serious Event listener is a lightweight background thread that runs every 10seconds by default, polling the administrative repository for changes in theconfiguration or runtime state. The listener executes select statements and storesthem in the administrative repository. By default, a database select is issued tothe administrative repository for each type of event (fatal, warning audit). Anyevents returned as a result are reported in the Console Messages section of theAdministration Client. While not a significant use of resources, the Serious Eventlistener thread can be tuned to execute at a desired time interval.
Chapter 7. Database tuning 59

You can change the polling interval and the types of messages reported by selectingthe node in the Administration Client then selecting Console-> Trace-> SeriousEvents. See Figure 41.
Figure 41. Serious Events
You get the new Serious Events window and under the Preferences tab shown inFigure 42, you can then adjust the Serious Event Pool Interval from the default 10seconds.
Figure 42. Serious Events Preferences
60 WebSphere V3 Performance Tuning Guide

A value of 0 turns this off and is not recommended. Once you go into production youcan set this interval period to be longer. The check boxes allow you to choose theevent categories to be selected.
7.1.1.2 Log limitA more important setting for performance is the Log Limit for the Serious Eventstable in the WebSphere configuration repository.
The default setting for the Log Limit is 0 (zero) as depicted in Figure 42 on page60. This setting is misleading since this actually maps to no limit being set for theentries in the Serious Events table. Over time this will degrade databaseperformance as the table grows and could result in a database error if sufficientspace on the file is not allocated.
Setting this to a value of between 1000 and 5000 should provide adequatelogging while not adversely impacting system performance.
7.2 DataSource object settings
In WebSphere Version 3 administration, databases are defined as DataSourceobjects. A DataSource object represents an application database which will beused for user applications. The WebSphere administrative repository is notconsidered a user application and therefore is not a DataSource object.
DataSource objects are used by servlets through the connection pool, by theSession Manager for persistent sessions, and by EJB containers.
7.2.1 Connection poolingOne of the most time-consuming procedures of a database application isestablishing a connection to the database. In WebSphere Version 2 theConnection Manager API was used to reduce this overhead. WebSphere Version3 provides a new API called connection pooling. Connection pooling is defined asa part of the JDBC 2.0 Standard Extension API.
Connection pooling establishes a pool of connections that user servlets can use.Once a connection is established, it is reused repeatedly so subsequent userrequests incur only a fraction of the cost of a connect/disconnect. Connectionpooling also lets you control the number of concurrent connections to a databaseserver. This is useful if you have to manage the number of database users tocomply with a database server license agreement.
Connection pooling is the recommended method to use when developing newservlets. The old Connection Manager API is supported by WebSphere Version 3,but only as a migration path. The differences between the Connection ManagerAPI and connection pooling are discussed in the “What Is -> Connection Pooling”topic of the online documentation provided with WebSphere.
Servlets use a connection pool as follows:
• When a user makes a request over the Web to a servlet, the servlet uses anexisting connection from the pool.
• When the request is satisfied, the servlet returns the connection to theconnection pool for use by other servlets.
Chapter 7. Database tuning 61

• The servlet uses a DataSource object to get a connection, and the connectionpooling services are automatically provided through the DataSource object.
Note that the servlet does not access the connection pool directly. The servletrequests a connection through a DataSource object and the connection pooling isprovided automatically.
You can modify the configuration of a connection pool using the adminclient.Select Topology -> Datasource -> Advanced. The defaults are shown in thefigure below.
Figure 43. Datasource - Advanced
Minimum connection pool sizeThis is the number of connections which will be prepared at serverstartup.
Maximum connection pool sizeThis is the maximum number of connections. It includes in-use, idle,and orphaned connections. If a client request reaches minimumconnection pool size, WebSphere creates a new connection. Then, if arequest reaches Maximum connection pool size and all connectionsare in-use, the next request will have to wait for a connection to bereleased by other servlets.
Connection timeoutIf a connection is not made available during this specified period, acom.ibm.ejs.dbm.jdbcext.ConnectionTimeoutException (a subclass ofSQLException) will be returned to your application. In a productionenvironment the default of 300 seconds is probably too long foracceptable performance. You'll want to test various settings for thisparameter under load for your environment and response time criteria.A suggested start point for your testing would be in the range of 1-10(seconds), again depending on your requirements.
62 WebSphere V3 Performance Tuning Guide

Idle timeoutThis parameter determines how long an idle connection can remain inthe pool before being removed to free resources.
Orphan timeoutThis parameter determines how long a connection can be owned by aservlet before being considered orphaned. WebSphere will consider aconnection as orphaned, when the servlet uses the connectionmultiple times over an extended period and the connection becomesunresponsive. This might be caused by an unexpected problem.
7.2.1.1 Sample case 1To see the effects of the connection pooling parameters we performed a primitivetest of management connections. We used the ConnPoolTest.class, included inthe WebSphere Samples Gallery, to access a database using the connectionpooling API. The servlet accesses the SAMPLE database and executes a simpleselect statement.
The test configuration looked like topology 2, shown in Figure 6 on page 10, withthe WebSphere Application Server residing on a different machine than thedatabase server.
In our test environment, setting the maximum connection pool size to 3-5 gavethe best performance. We set the max connections to higher than 5 and itresulted in high CPU activity with the vmstat command. Of course, theWebSphere node gets heavier stress than the database node in this simple SQLstatement. We used the same spec machines for each node.
7.2.1.2 Sample case 2Next, we used the sample Trade application with connection pooling to see theeffect of changing the maximum and minimum connection pool size. We used fivecases, setting the maximum connection pool size to 1, 3, 5, 7 and 10 respectively.
In our test environment, we saw the best performance when the maximumconnection pool size was 5. Setting this parameter to 1 significantly reduced theperformance (by as much as 50% of the performance with the setting at 5).Setting the maximum connection pool size to 5 or more, ensured there was lessCPU idle time.
7.2.1.3 Rules of thumb• If your application uses more than one database, you have to consider the
total number of connections. If you create a clone environment or if youimplement the session persistence feature, connections to the sessiondatabase are also necessary. The total number of connections will be asfollows:
Maximum total number of database connections =
Application DataSource Maximum connection pool size * Number of cloneServers +
Session DataSource Maximum connection pool size * Number of cloneServers+
WebSphere administrative repository connections+
Chapter 7. Database tuning 63

(Connections from any other applications or temporary connections fromcommand line)
• Each connection uses about 700 KB - 1800 KB of memory on each node.Increasing the maximum connection pool size seems to have a positive effecton performance until you reach the point where CPU processing becomes abottleneck. Increasing the CPU power of the WebSphere node could allow youto increase the maximum connection pool size.
• Specifying too small a number of connections will cause the application to geta connection timeout.
7.3 Prepared statements
Each time your application submits a query to a database, the database managercreates a query plan. The query is then executed with this plan. If yourapplication is coded to use the PreparedStatement class instead of the Statementclass an object is created that precompiles and stores the SQL (Structured QueryLanguage) associated with the query plan. This approach is more efficient thanrunning the same statement multiple times with a Statement object, whichcompiles the statement each time it runs.
In the example below the database builds the query plan only once when the firststatement is executed.
Figure 44. Example of the prepared statements
7.3.1 Prepared statement cacheWebSphere V3.x provides an additional performance improvement to that alreadyprovided by using the PreparedStatement class, with a Prepared Statementcache. By caching prepared statements, the initial overhead of the databasemanager creating an SQL query plan (as described above) for aPreparedStatement class is avoided. When possible, WebSphere will provide thedatabase manager with an existing execution plan for the prepared statement.
The size of the prepared statement cache is specified by adding a command lineargument to your application server, select Topology-> Default Server->General. As shown in Figure 45, in the Command line arguments field specify:
It is important that a DataSource object for persistent sessions have its ownconnections aside from the connections to an application DataSource. Bydefault, the maximum connection pool size of a DataSource is 30.
DataSource Object for Persistent Sessions
PreparedStatement pstmt = con.prepareStatement(select exchange_rate fromrates where currency = ?");
//Initialize first parameter with currencypstmt.setString(1, Flan);ResultSet results = ps.executeQuery();
Subsequent invocations of the query are performed by substitution of theappropriate variables
pstmt.setString(1, Lira);
64 WebSphere V3 Performance Tuning Guide

-Dcom.ibm.ejs.dbm.PrepStmtCacheSize.
This cache is shared among all DataSources. In our testing on AIX we found thefollowing formula most appropriate for determining the appropriate setting:
Cache = (# unique prepared statements) * (number of concurrent clients)
For the application that we tested there were only two prepared statements. Sofor our tests with 100 concurrent clients, we set the prepared statement cache to200 and noticed a significant performance improvement from tests with cachesettings of 50, 100, 150, and did not notice any significant improvement in testswhere the setting was higher than this.
For example, for 20 concurrent user threads, you would set the maximumconnection pool size to 20. Assuming each client is doing just an entity read andthere are two different PrepStmts (load and save), the prepared statement cachesize should be at least 2*20 = 40.
Figure 45. Prepared statement cache
7.3.2 Prepared statement key cacheThis parameter controls the size of the intermediate cache used to map betweenSQL statements and entries in the prepared statement cache. Unlike the
The WebSphere Performance team has found that the following formula worksbest on Windows NT:
PrepStmtCache > #PrepStmt * min (concurrent user threads, connection PoolSize)
For Windows NT
Chapter 7. Database tuning 65

prepared statement cache which is shared among all Data Sources, thisparameter specifies the number of entries in cache for each Data Source. Areasonable value would be the expected number of unique prepared statementswhich you expect to have in the application. As in Figure 46, we can specify in theCommand line arguments field:
-Dcom.ibm.ejs.dbm.PrepStmtKeyCacheSize
Figure 46. Prepared statement key cache
7.4 UDB configuration
In this topic we will discuss only general parameters to consider. All parameterswhich we describe can apply to your application database, the WebSphereadministrative repository and the persistent session database. Table 3 shows theparameters we used in testing the performance of our test application, Tradeservlet.
Table 3. Database configuration parameters
Parameter Default Value
BUFFPAGE 1000 (4 KB page)
APPLHEAPSZ 128 (4 KB)
PCKCACHESZ 8 * maxappls, if it is smaller than32, 32 will be the default value
MAXAPPLS 40
DFT_DEGREE 1
LOCKLIST 100 (4 KB)
MAXLOCKS 10 (%)
66 WebSphere V3 Performance Tuning Guide

7.4.1 BuffpageThe buffer pool is allocated when the first application connects to the database orwhen the database is explicitly activated. As an application requests data out ofthe database, pages containing that data are transferred to one of the bufferpools. Pages are not written back until the page is changed and one of thefollowing occurs:
• All applications disconnect from the database.• The database is explicitly deactivated.• The database quiesces.• Its space is required for another page that needs to be read into the buffer
pool.• A page cleaner is available and is activated by the database manager.
If the buffer pools are large enough to keep the required data in memory, lessdisk activity will occur. If the buffer pools are not large enough, the overallperformance of the database can be adversely affected.
7.4.1.1 Update buffpage sizeThe default value for buffpage, 1000 (4 MB), is often not large enough. You canupdate a buffpage parameter with the following command:
db2 update db cfg for <database_name> using BUFFPAGE 2000
In our test case, we changed the buffsize value from 1000 (4 MB) to 2000 (8 MB).This change gave us a 2.11% performance increase in our sample tradeapplication. Keep in mind that the buffpage parameter will hold a specific amountof memory, so you need to balance increased buffer pool sizes with the need forenough memory for the rest of the processes active on the machine.
7.4.1.2 Monitor buffpage sizeBefore updating the buffpage size, we recommend that you check the currentusage of buffer pages. We used a DB2 snapshot of the data collected by the DB2system monitor to do this.
DB2 has a system monitor that collects information about performance. The typeof information collected can be determined by setting monitor switches. By
LOCKTIMEOUT -1 (sec)
MAXAGENTS 200
Parameter Default Value
To determine whether the buffpage parameter is active for a buffer pool, youcan use the following command:
SELECT * from SYSCAT.BUFFERPOOLS
Each buffer pool that has an NPAGES value of -1 uses buffpage.
To change the value NPAGES of an existing buffer pool to -1, you can usethe db2 alter command as follows:
db2 alter bufferpool ibmdefaultbp size -1
Note
Chapter 7. Database tuning 67

default, buffer related information is not collected so you will need to set up themonitoring switches. There are two ways to do this:
1. Set the DFT_MON_BUFPOOL parameter “on” with the following command:
db2 update dbm cfg using DFT_MON_BUFPOOL ON
2. Use the update monitor switches command:
db2 update monitor switches using BUFFERPOOL on
The first option, the update dbm cfg command, will be effective until you re-issuethe command and specify Off. It doesn’t affect applications which were connectedto the database before the command was executed.
The second option, the update monitor switches command, affects only theapplication that executes this command. This value will be reset when theapplication terminates.
To confirm the current setting of monitor switches, use the following command:
db2 get monitor switches
To reset the statistics, use the following command:
db2 reset monitor all
To get a snapshot of the information, use the following command:
db2 connect to <database_name>
db2 get snapshot for database on <database_name>
The following command collects only buffer pool related information:
db2 get snapshot for bufferpools on <database_name>
68 WebSphere V3 Performance Tuning Guide

Figure 47 shows the output of the snapshot command. As you can see there is aline that tells the number of buffer pool data physical reads. The higher thisnumber is, the more impact you will see on performance because physical readsand writes are time consuming.
Figure 47. Output of snapshot #1 (before update buffpage size)
Database Snapshot
Database name = TRADESDatabase path =/home/db2inst1/db2inst1/NODE0000/SQL00003/Input database alias = TRADESDatabase status = ActiveCatalog node number = 0Catalog network node name =Operating system running at database server= AIXLocation of the database = LocalFirst database connect timestamp = 12-03-1999 12:08:47.403708Last reset timestamp =Last backup timestamp = 12-02-1999 13:49:50.499393Snapshot timestamp = 12-03-1999 12:15:58.821643
// omitting..
High water mark for database heap = 340573
Buffer pool data logical reads = 64580Buffer pool data physical reads = 116Asynchronous pool data page reads = 63Buffer pool data writes = 72Asynchronous pool data page writes = 71Buffer pool index logical reads = 95101Buffer pool index physical reads = 104Asynchronous pool index page reads = 0Buffer pool index writes = 43Asynchronous pool index page writes = 40Total buffer pool read time (ms) = 586Total buffer pool write time (ms) = 1041Total elapsed asynchronous read time = 41Total elapsed asynchronous write time = 949
Chapter 7. Database tuning 69

Figure 48 shows a snapshot taken after the parameter was changed from 1000 to2000. The number of reads has dropped to 0. This means that all read requestshit the buffer pool cache in the memory.
Figure 48. Output of snapshot #2 (after update buffpage size)
7.4.2 ApplheapszApplication heap contains memory blocks used by UDB to process applicationrequests. To update the applheapsz parameter:
db2 update db cfg for <database_name> using applheapsz <block_number>
When we set this value to 512 (versus the default of 128) for our test databaseapplication, we saw a performance improvement of 5.44%.
Database Snapshot
Database name = TRADESDatabase path =/home/db2inst1/db2inst1/NODE0000/SQL00003/Input database alias = TRADESDatabase status = ActiveCatalog node number = 0Catalog network node name =Operating system running at database server= AIXLocation of the database = LocalFirst database connect timestamp = 12-03-1999 13:13:26.866103Last reset timestamp = 12-03-1999 13:28:08.993190Last backup timestamp = 12-02-1999 13:49:50.499393Snapshot timestamp = 12-03-1999 13:32:00.568447
High water mark for connections = 10
//
Buffer pool data logical reads = 11318Buffer pool data physical reads = 0Asynchronous pool data page reads = 0Buffer pool data writes = 1Asynchronous pool data page writes = 0Buffer pool index logical reads = 18692Buffer pool index physical reads = 0Asynchronous pool index page reads = 0Buffer pool index writes = 5Asynchronous pool index page writes = 0Total buffer pool read time (ms) = 0Total buffer pool write time (ms) = 150Total elapsed asynchronous read time = 0Total elapsed asynchronous write time = 0
70 WebSphere V3 Performance Tuning Guide

7.4.3 PckcacheszThe package cache size (pckcachesz) is allocated from the application heap size(applheapsz). Access plans are stored in the package cache. You will need toconsider resizing the applheapsz parameter if you increase the package cachesize. When an application uses a specific section often the package cache will beefficiently used. You can use the following command to update the size ofpckcachesz:
db2 update db cfg for <database_name> using pckcachesz <number>
7.4.4 MaxapplsThis parameter specifies the maximum number of concurrent applications thatcan be connected (both local and remote) to a database. You can update thisvalue with the following command:
db2 update db cfg for <database_name> using maxappls <number>
To estimate the total number of connections to an application database use thefollowing formula:
Application DataSource Maximum connection pool size * Number of CloneServers + (Connections from any other applications or temporary connectionfrom command line)
You also need to consider this value for the session database. If you increaseDataSource Maximum connection pool size without increasing this value, you willget SQL Error SQL1040N and your application will fail.
See also 7.4.6, “Locklist” on page 72 and 7.4.9, “Maxagents” on page 73.
7.4.5 Dft_degreeThe dft_degree parameter specifies whether to enable SMP parallel procedures.The default value is 1, meaning not to use SMP parallel. SMP parallel is suitablefor applications which use only a select statement and utilities which collectinformation from the database. If your application is an OLTP type, enabling thisSMP parallel procedure might cause a decrease in performance.
In our test case using Trade (an OLTP application), performance decreased byapproximately 36% when we set dft_degree to -1 (use SMP parallel) with thefollowing command:
db2 update db cfg for <database_name> using dft_degree -1
If you used the <was_dir>/bin/createdb2.sh shell script when you installedWebSphere, it updated the applheapsz parameter to 256 for the WebSphereadministrative repository.
Note
Chapter 7. Database tuning 71

7.4.6 LocklistLocklist indicates the amount of storage that is allocated to the lock list. Lockingis the mechanism that the database manager uses to control concurrent accessto data in the database by multiple applications. Both rows and tables can belocked. There is one lock list per database and it contains the locks held by allapplications concurrently connected to the database. Lock escalation is theprocess of replacing row locks with table locks, reducing the number of locks inthe list. You can update this value with the following command:
db2 update db cfg for <database_name> using locklist <number>
We tested with two locklist values, 100 and 200. When we set this value to 200,we saw performance improvements with database lock snapshot. The value oflock waits went down 19%, lock list memory in use went down 20%, Timedatabase waited on locks (ms) went down 38%. And also we noticed that theHTTP performance (request per second) went up 5%.
7.4.7 MaxlocksThe maxlocks parameter defines a percentage of the lock list held by anapplication. When the number of locks held by any one application reaches thispercentage of the total lock list size, lock escalation will occur for the locks heldby that application. Lock escalation also occurs if the lock list runs out of space.Therefore, when you increase maxappls, you should keep it lower than maxlocksor increase locklist to prevent lock escalation.
If you don’t want to use SMP parallel at all, you should specify no for theINTRA_PARALLEL parameter in the Database Manager configuration.
db2 update dbm cfg using INTRA_PARALLEL no
Note
Use the snapshot command to see if lock escalation has occurred. Bydefault, locking related information is not monitored. There are two ways toturn on monitoring for locking information.
Set the DFT_MON_LOCK parameter to ON with the following command:
db2 update dbm cfg using DFT_MON_LOCK ON
Use the update monitor switches command:
db2 update monitor switches using LOCK on
To reset snapshot data, use the following command:
db2 reset monitor all
Use the following commands to connect to the database and take asnapshot of the lock related information:
db2 connect to <database_name>db2 get snapshot for locks on <database_name>
Monitoring Lock Escalation
72 WebSphere V3 Performance Tuning Guide

7.4.8 LocktimeoutIf your application response time appears to be too long, review the locktimeoutsetting. The default setting is -1, which means no connection timeout. If you donot want the transaction to keep trying to get a connection, set the locktimeoutvalue to a positive number measured in seconds. The application programmerwill need to determine what locktimeout value is appropriate for the usercommunity.
For example, user A connects to the database and is updating table T1. When thelocktimeout value is set to the default (-1), user B will not be able to update tableT1. There is no recommended number to use for the locktimeout value. Theapplication programmer will need to experiment with different locktimeout valuesuntil the application response time is appropriate for the application users.
You can change the locktimeout value with the following command:
db2 update db cfg for <database_name> using locktimeout <number>
7.4.9 MaxagentsThe maxagents parameter indicates the maximum number of database manageragents. The value of maxagents should be at least the sum of the values formaxappls in each database allowed to be accessed concurrently.
For Websphere applications the maximum number of connections can becalculated with the following formula:
Maximum total number of database connections =
Application DataSource Maximum connection pool size * Number of CloneServers +
Session DataSource Maximum connection pool size * Number of CloneServers +
WebSphere administrative repository connections +
(Connections from any other applications or temporary connections from acommand line)
You can change the value of maxagents with the following command:
db2 update dbm cfg using maxagents <number>
Chapter 7. Database tuning 73

74 WebSphere V3 Performance Tuning Guide

Chapter 8. Session management
When establishing a Web application site, it is desirable to be able to track clientstatus. In many cases, a client’s desired procedure will consist of several Webpages and several methods of a servlet. A series of requests from the same clientto the same browser is called a session. If your application requires sessions tobe maintained across requests, WebSphere supports the Servlet APIHttpSession Interfaces (javax.servlet.http.HttpSession). With this interface, anapplication can track client status and keep client information temporarily.WebSphere provides a Session Manager to handle these session objects.
8.1 Session information
WebSphere provides two ways to store session information on the applicationserver. One way is to store the session in memory. The second way is to store thesession in a database. Sessions stored in a database are called persistentsessions.
8.2 Keeping session information in memory
By default, the Session Manager uses the in-memory mode.
From the Topology-> WebSphereAdminDomain-> hostname->DefaultServer-> servletEngine-> Session Manager-> Enabled tab as shown inFigure 49 on page 75, you can see that Enable Persistent Sessions is set to thedefault setting of No.
Figure 49. Session Manager - Enable
© Copyright IBM Corp. 1999 75

8.3 Persistent sessions
Using persistent sessions is of significant value to a Web application. By storingsessions in a database the session state is maintained even if you reboot theapplication server, or if an unexpected system error occurs. It also allows accessfrom more than one instance of an application server, which allows for applicationserver clustering. If you are considering cloning applications on a single node, orusing more than one application server on separate machines, or using acombination of the two, sessions must be persisted to a database.
Figure 50. Persistent sessions
In a scenario with one application server, a persistent session is generally slowerthan a session in memory and may cause degradation in performance.
8.3.1 Database/Datasource configurationTo use persistent sessions, you have to create a database on your databaseserver and then define it as a Datasource object in WebSphere. As we discussedin the previous chapter, you should modify your database settings. And also werecommend that you modify the number of connections in the Datasource settingfor session persistence.
8.3.2 Session Manager configurationTo modify the Session Manager setting to allow persistent sessions:
1. On the Topology-> WebSphere Administrative Domain-> hostname->Default Server-> servletEngine-> Session Manager-> Enable tab, setEnable Persistent Sessions to Yes and click Apply.
2. On the Session Manager -> Persistence tab as shown in Figure 51, click theDatasource Change button and select the Datasource you defined before.
Plug-in
AdminServer
AppServ 1Clone 4
AppServ 1Clone 3
AppServ 1Clone 2
AppServ 1Clone 1
Machine A
PersistentSession
DB
Machine B
HTTPServer
Plug-in
AdminServer
HTTPServer AppServ 1
Machine AND
Machine C
Plug-in
AdminServer
HTTPServer AppServ 1
Machine B
PersistentSession
DB
Machine D
Plug-in
AdminServer
HTTPServer
AppServ 1Clone 2
AppServ 1Clone 1
Machine A
Plug-in
AdminServer
HTTPServer
AppServ 1Clone 2
AppServ 1Clone 1
Machine B
ND
Machine C PersistentSession
DB
Machine D
76 WebSphere V3 Performance Tuning Guide

Keep the Persistence Type set to directodb, meaning that WebSphere will storethe session information to a database using the JDBC connection. PersistenceType ejb will be supported in a future version of WebSphere. For the time being,do not select this option.
Figure 51. Session Manager - Persistence
8.4 Tuning the Session Manager
There are two tabs related to performance tuning on the Session Manager panel,the Intervals tab and the Tuning tab. We will discuss the tuning parameters in thefollowing sections.
8.4.1 The Invalidate Time settingUnder the Intervals tab, you can specify the period a session is allowed to gounused until it is no longer considered valid in the Invalidate Time field. Integersrepresenting seconds are allowed. A “-1” means the session will not beinvalidated.
Chapter 8. Session management 77

Figure 52. Session Manager - Intervals
If you are using in-memory mode sessions, a session that passes the InvalidateTime setting will disappear from memory.
If the session is persistent and the Invalidate Time has been reached, the rowsthat contain the session information will be deleted from the Sessions table in thedatabase.
8.4.2 Monitor and estimate Invalidate TimeThe correct Invalidate Time value for a particular application varies with machinecapacity. To estimate it, you can use vmstat to monitor memory usage and theResource Analyzer to confirm session numbers and usage. The default value(1800 seconds) may be desirable to lower it, so you might start testing around600 seconds. On the Sessions tab with Resource Analyzer as shown in Figure 53on page 79, you can see the number of sessions that have been created andinvalidated within the monitoring refresh interval.
If you are using in-memory mode, the Invalidate Time should be set to anappropriate value that doesn’t stress the actual memory size of the machine. Ifthe value is too high and too many sessions are kept in memory, paging will go upand performance will suffer.
It depends on your application, but if possible, sessions should be closed with theinvalidate method. If your application is not the type which can release sessionsor if the clients tend to leave the site before the end of the procedure, the numberof sessions can become large. Since the Invalidate Time parameter affects theamount of memory used for sessions, the setting of this parameter is extremelyimportant and can affect application server response time. We will also discussother options for managing the number of in memory sessions, such as AllowOverflow, and Base Memory Size later.
78 WebSphere V3 Performance Tuning Guide

Figure 53. Resource Analyzer - Sessions
8.4.3 Tuning parameters on the Tuning tabWith WebSphere 3.0 Session Management, several new features have beenadded that allow advanced customers to tune the performance and operatingcharacteristics of the Session Manager. You can also specify these features withthe Tuning tab as shown in Figure 54 on page 80.
Chapter 8. Session management 79

Figure 54. Session Manager - Tuning
8.4.4 Multirow sessionsBy default (or select No), a single session maps to a single row in the databasetable used to hold sessions. With this setup, there are hard limits on the amountof user-defined, application-specific data that WebSphere Application Server canaccess. Specifically, with UDB, the maximum space available is 32,700 bytes(using the long varchar for bit data UDB type vs. BLOBs as a compromisebetween space and performance). With Oracle, the maximum amount is 2 MB(where the only choices are "raw" for a maximum of 2 KB, or the "long raw" datatype of 2 MB).
WebSphere Application Server V3.0 Session Manager, however, allows for theuse of a multirow schema option where each piece of application-specific data isstored in a separate row of the database. With this mode, the total amount thatcan be placed in a session is now bound only by the capacities of the database.We will relax the restriction and add a BLOB column for UDB. The only practicallimit remaining is the size of the data object itself, where the above limits (32 KBfor UDB or 2 MB for Oracle) should be more than enough for any single Javaobject.
This parameter is applicable only when using persistent sessions.
Another reason to use this setting is that you can store the session informationseparately by property ID. With this parameter, the session table is used asshown in Table 4 on page 81.
80 WebSphere V3 Performance Tuning Guide

Table 4. Model of session table with setting using multirow
The property name which you specified in the Session.putValue() method will bestored in the PROPID column.
When the application needs to refer to only one property, the Session Managerdoesn’t have to seek the whole object. The Session Manager selects theappropriate object more efficiently by using the Propid key.
The multirow schema potentially has performance benefits in certain usagescenarios, such as when larger amounts of data are stored in the session but onlysmall amounts are specifically accessed during a given servlet's processing of anHTTP request. In such a scenario, avoiding unneeded Java object serialization isbeneficial to performance.
To determine if this parameter is good for your application, create two sessiondatabases: one using the default setting (which uses a single row for eachsession), the other using multirow. Create two Datasource objects (one for eachsession database) and switch between the two using SessionManager->Persistence -> Datasource. When you choose the session databasethat specifies Using Multirow Sessions as Yes, the Session Manager will create arow for each session object. And then, you can compare the performance resultsof both settings.
8.4.5 Using cacheWebSphere will maintain a list of the most recently used sessions in memory andavoid using the database to read in or access the session when it determines thatthe cache entry is still the most recently updated copy. The default is No.
In our test cases, a 21% performance improvement was seen when this settingwas Yes.
This value applies only when persistent sessions are enabled and thePersistence Type is "direct to database."
See 8.4.9, “Base memory size” on page 83 about controlling the size of thecache.
To efficiently use the cache, WebSphere Application Server Version 3.0 needs an"affinity" mechanism to help ensure cache hits. As an example, if Fred is visiting aWeb site serviced by a WebSphere cluster consisting of 3 machines (A, B, andC), and his client hits machine A on a given request, then there is a performance
ID PROPID MEDIUM
<Cookie id A> <Cookie id A> -
<Cookie id A> <Property name 1> <Value of property 1>
<Cookie id A> <Property name 2> <Value of property 2>
<Cookie id B> <Cookie id B> -
<Cookie id B> <Property name 1> <Value of property 1>
<Cookie id B> <Property name 2> <Value of property 2>
Chapter 8. Session management 81

benefit to the WebSphere clustering mechanism by ensuring his client will usemachine A on subsequent requests.
For WebSphere 3.0, the affinity features are provided by our sister product, theWebSphere Performance Pack (which includes among other things the NetworkDispatcher and the Web Traffic Express Proxy Server facilities). In particular, twoaffinity features exist. The first and older feature is the "sticky port", whereNetwork Dispatcher (ND) uses, on top of its load balancing functionality, theclient's IP address to maintain the affinity. The second and newer feature iscontent-based or cookie-based affinity, where ND and the Web Traffic Express(WTE) Proxy Server work in conjunction to load balance, using cookies to identifyclients and maintain affinity.
8.4.6 Using manual updateWebSphere Application Server Version 3.0 by default always updates thedatabase with any changes made to the session during the servlet's processingof an HTTP request (that is the execution of the service() method). Theseupdates minimally include the last access time of the session, and typically alsoinclude changes made by the servlet (that is updating or removing applicationdata).
When manual update is turned on (select Yes), WebSphere will no longerautomatically update the database at the end of a servlet's service() method. Thelast update times are cached and updated asynchronously prior to checks forsession invalidation. For any permanent changes to the session as part of theservlet processing, the servlet must manually call the sync() method provided aspart of the WebSphere extension to HttpSession, thecom.ibm.websphere.servlet.session.IBMSession interface when running inmanual update mode.
This value applies only when persistent sessions are enabled and thePersistence Type is "direct to database."
Depending on your application, performance can be improved by allowing theservlet to determine when a write to the database should be made. This isbecause the number of times an HTTP request's processing leads to changing asession (typically its application data) may actually be less than the number oftimes the session is accessed or read in. If one is able to combine manualupdating (for minimizing database writes) along with caching (to minimizedatabase reads), performance can greatly improve.
8.4.7 Using native accessSpecifies whether to perform session persistence database updates usingoptimized JNI-based SQL access, written in the C programming language. Thedefault is No. This parameter will be supported in a future version of WebSphere.For the time being, it is not used.
8.4.8 Allow overflowBy default, the number of sessions maintained in memory is specified by BaseMemory Size. If you do not wish to place a limit on the number of sessionsmaintained in memory and allow overflow, set this value to Yes as default.Allowing for an unlimited number of sessions, however, can potentially exhaust
82 WebSphere V3 Performance Tuning Guide

system memory and even allow for system sabotage (where somebody couldwrite a malicious program that continually hits your site and creates sessions, butignores any cookies or encoded URLs and never utilizes the same session fromone HTTP request to the next).
When overflow is disallowed, the Session Manager will still return a session withthe HttpServletRequest's getSession(true) method if the memory limit hascurrently been reached, but it will be an invalid session which is not saved. Withthe WebSphere extension to HttpSession,com.ibm.websphere.servlet.session.IBMSession, there is an isOverflow() methodwhich will return "true" if the session is invalid. Your application could then checkthis and react accordingly.
8.4.9 Base memory sizeThe base memory size setting specifies the number of sessions in memory. Thedefault is 1000. This value holds when you are using in-memory sessions,persistent sessions with caching, or persistent sessions with manual updates.(The manual update cache keeps the last n time stamps representing "lastaccess" times, with n being the base memory size value.)
This number has several meanings:
• For the in-memory mode sessions:
This value specifies the number of sessions in the base session table. Use theAllow Overflow property to specify whether to limit sessions to this number forthe entire Session Manager, or allow additional sessions to be stored insecondary tables.
• For the persistent sessions:
It also specifies the size of the cache, as well as the number of last accesstime updates that are saved in manual update mode. In either case, once thisnumber is surpassed, these functions are bypassed (that is any sessions afterthis number are simply not cached, and any session updates past this numberare automatically sent back to the database).
In other words, if the cache property is enabled, the base memory size specifieshow many session updates will be cached before the Session Manager reverts toreading session updates from the database automatically.
This parameter can be used to tune performance when memory is used at a highrate. With the Resource Analyzer, check the usage of memory for sessions andtune this parameter. How you customize this setting will depend on yourhardware system, the usage characteristics of your site, and your willingness toincrease the stack sizes of the Java processes for your application servers toaccommodate a larger value. The size of the session objects and number ofsessions (base memory size) will need to be determined by the application
Chapter 8. Session management 83

programmer. These values should be recorded and given to the systemsadministrator to make these changes.
Table 5. .Base Memory Size
EnablePersistence
UsingCache
ManualUpdate
AllowOverFlow
Base Memory Size
No(in-memory)
Yes / No N / A No The number of sessions in thebase session hash table.
No(in-memory)
Yes / No N / A Yes The total number of sessions.Secondary hash table allowed tobe created.
Yes(in-database)
No Not regarded.
Yes(in-database)
Yes The number of session updateswill be cached in memory beforethe Session Manager saveschanges into the database.
Yes(in-database)
No Not regarded.
Yes(in-database)
Yes The manual update cache keepsdata related to invalidated time,and corresponding number ofsessions at base memory size.
84 WebSphere V3 Performance Tuning Guide

Chapter 9. Performance test tools
In order to test the throughput and scalability of a particular application orhardware architecture you will need to simulate a load. The WebSphereApplication Server does not include any tools for the purpose of load generationor client side performance monitoring. There are a number of tools available forthis purpose. Some are available for free and some are at cost. Any of the toolsmentioned below can be used alone or in conjunction with the WebSphereResource Analyzer for performance testing. Some of the tools, in no particularorder one discussed in the following sections.
9.1 WebStone
WebStone is an open source benchmark tool that is freely available fromMindcraft. WebStone was originally developed by Silicon Graphics to measurethe performance of Web server software and hardware products. Mindcraft Inc.acquired the rights to WebStone from Silicon Graphics and is currently providingsupport for WebStone 2.5.
WebStone simulates the activity of multiple Web clients thus creating a load on aWeb server. The load can be generated from either one client computer or bymultiple client computers. According to Mindcraft it is possible to run in excess of100 simulated Web clients on a single computer.
As freeware though WebStone does not offer many of the features that areavailable from other products at cost. Among the features not supported as ofthis writing are:
SSL, POST, HTTP 1.1, cookies, dynamic workloads with database access,authentication, HTTP 1.0 keep-alive support, and multiple headers/URLs.
Further information and downloads of the source code and executables areavailable from Mindcraft at http://www.mindcraft.com.
9.2 AKtools
AKtools are a set of internal IBM applications which allow a user to test Webapplication performance and was the tool used in writing this redbook.
The two current applications are AKstress and AKrecord. AKstress is a highperformance, simple threaded HTTP engine which is capable of simulatinghundreds or even thousands of HTTP clients, using a highly configurable set ofdirectives from a plain text configuration file. AKrecord is a simple eaves droppingproxy which will record a user’s session against a Web server for later playbackin AKstress.
AKtools provides a variety of functions:
• Fully configurable HTTP headers
• SSL support
• Support for HTTP/1.1
• Built-in cookie caching
© Copyright IBM Corp. 2000 85

• Result verification
• Full logging
• Overall and request-level statistics
• Simple protocol for sending statistics to third-party tools
• Proxy request capability
• AKstress process statistics
Figure 55. Sample output of AKstress
9.3 Apache Bench
The IBM HTTP Server (IHS) which is included with WebSphere ApplicationServer does include the Apache Bench (AB) tool on UNIX platforms (ApacheBench is Perl script-based). This tool allows for HTTP client load simulation. Youcan specify the URL, number of total requests and the number of concurrentrequests with this tool. A sample of the output from AB is provided below.
Further information and the source code for Apache Bench are available from theApache Software Foundation at http://www.apache.org.
Uptime: 0 hours 1 minutes 6 secondsNumber of Threads: 5Pages Completed: 1000Pages To Be Completed: 1000Pages per second: 15.15Requests completed: 1000Requests per second: 15.15Failed Connections: 0Incorrect response codes: 0Content verification failed: 0Request write failures: 0Number of early closes: 0Number of early server closes: 0Number of request write failures: 0SSL handshake failures: 0
Request statistics for request /servlet/trade (Rec_Request_dHe8Ea)Successes: 1000Return Code Failures: 0Early Server Closes: 0Content Verification Failures: 0Min time (milliseconds): 0Max time (milliseconds): 1953Mean time (milliseconds): 323
akstress - execution complete
86 WebSphere V3 Performance Tuning Guide

Figure 56. Sample output of Apache Bench
9.4 Rational Suite Performance Studio
Performance Studio offers support for a variety of clients, both Web and non-Webbased. Among the clients supported are HTML, DHTML, Document ObjectModel, Visual Basic, Visual C++, Java, ActiveX and PowerBuilder. PerformanceStudio records user inputs for playback as scripts that are used in performancetesting.
More information on Rational Suite Performance Studio, including an evaluationcopy is available from http://www.rational.com.
9.5 JMeter
JMeter is another freely available tool from the Apache Software Foundation.JMeter is a Java desktop application designed to test URL behavior and measureperformance. Apache JMeter may be used to test server performance both onstatic and dynamic resources (files or CGI, servlets, Perl scripts). Simple to use,JMeter is limited to 20 concurrent requests per JMeter client, but can be used forinitial performance testing.
JMeter is available from the Apache Software Foundation at:http://www.apache.org.
# ab -n 100 -c 10 http://ken/servlet/snoopThis is ApacheBench, Version 1.3Copyright (c) 1996 Adam Twiss, Zeus Technology Ltd,http://www.zeustech.net/Copyright (c) 1998-1999 The Apache Group, http://www.apache.org/
Server Software: IBM_HTTP_Server/1.3.6.2Server Hostname: kenServer Port: 80
Document Path: /servlet/snoopDocument Length: 2740 bytes
Concurrency Level: 10Time taken for tests: 1.222 secondsComplete requests: 100Failed requests: 0Total transferred: 315773 bytesHTML transferred: 298660 bytesRequests per second: 81.83Transfer rate: 258.41 kb/s received
Connnection Times (ms)min avg max
Connect: 0 0 15Processing: 11 113 1088Total: 11 113 1103
Chapter 9. Performance test tools 87

Figure 57. Sample output of JMeter
9.6 WebLoad
WebLoad from Radview provides support for the HTTP 1.0 and 1.1 protocolsincluding cookies, proxies, SSL, keep-alive, and client certificates. Support isalso provided for a variety of authentication mechanisms such as basicauthentication, proxy, form, NT challenge response, client certificate, and useragent.
Additional information on WebLoad is available from Radview athttp://www.radview.com.
9.7 LoadRunner
LoadRunner from Mercury Interactive Corporation supports a variety of differentclients, including Web, ERP, database (DB), Java or remote terminal emulator(RTE).
Additional information on LoadRunner is available at http://www.merc-int.com.
88 WebSphere V3 Performance Tuning Guide

Chapter 10. Monitoring tools
In Version 3 of WebSphere Application Server the Resource Analyzer provides atool that can be used in conjunction with operating system tools such as vmstat tomonitor a number of performance measures. For more in depth knowledge onAIX performance tuning, we recommend you to read the AIX Performance TuningGuide, SR28-5930 and RS/6000 SP System Performance Tuning, SG24-5340.The Resource Analyzer will be described below in more detail. AnotherWebSphere Product: Site Analyzer, also comes with WebSphere ApplicationServer and can be used to analyze your HTTP site usage patterns. Site Analyzerwill be discussed in Chapter 11, “WebSphere Application Server Site Analyzer”on page 133.
10.1 WebSphere Application Server Resource Analyzer
WebSphere Application Server V3 expands on the summary server executionanalysis that is available in V2 of the application server and provides a number ofsummary and discrete monitoring functions for a variety of resources.
If you intend to monitor performance using the Resource Analyzer in WebSphereyou will need to explicitly define your servlets and JSPs as part of your Webapplication definition. Thus only the items shown below under the trade_app Webapplication can be monitored by WebSphere.
Figure 58. Web Application: trade_app
The WebSphere Resource Analyzer can be accessed from the Tasks tab of theWebSphere Administrative Console: Task Tab -> Performance -> ResourceAnalyzer and can be started once the Resource Analyzer is highlighted either by
© Copyright IBM Corp. 2000 89
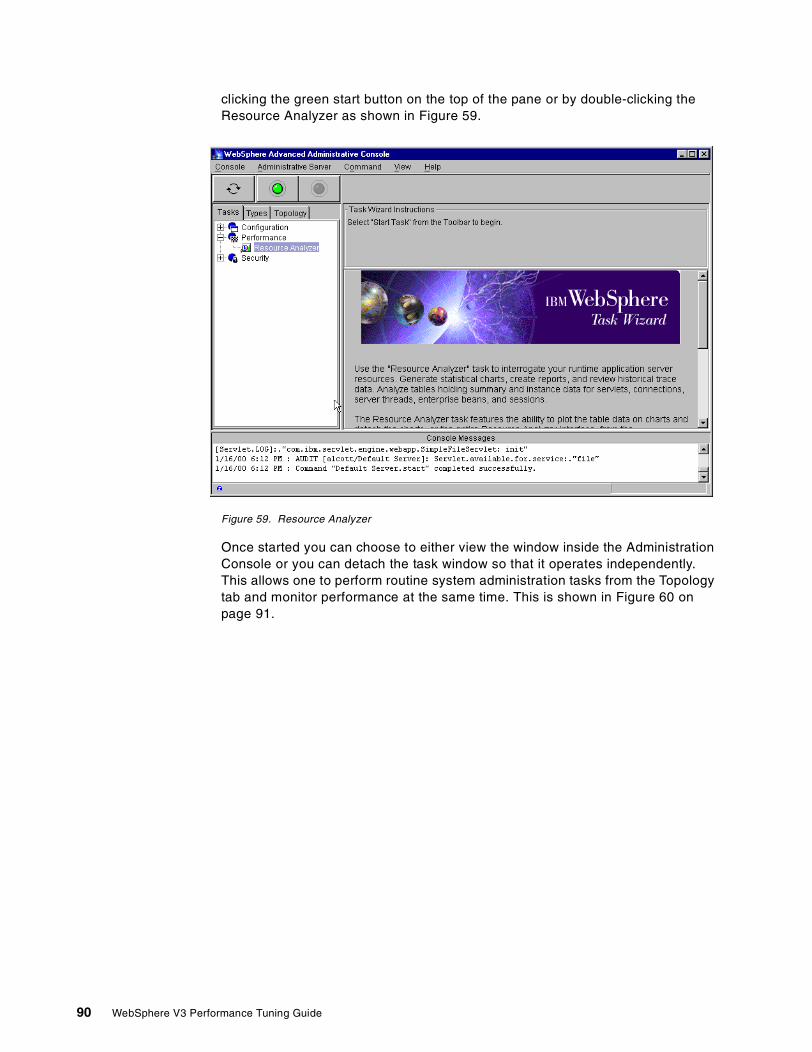
clicking the green start button on the top of the pane or by double-clicking theResource Analyzer as shown in Figure 59.
Figure 59. Resource Analyzer
Once started you can choose to either view the window inside the AdministrationConsole or you can detach the task window so that it operates independently.This allows one to perform routine system administration tasks from the Topologytab and monitor performance at the same time. This is shown in Figure 60 onpage 91.
90 WebSphere V3 Performance Tuning Guide

Figure 60. Detach Task Window
10.1.1 Enterprise beansThe first tab on the resource analyzer allows you to monitor execution of yourEJBs. Upon clicking the Select button in the middle of the page, you’ll beprompted with the dialog box shown below that allows you to specify monitoringat:
1. The server level
2. The container level
3. The individual EJB level
Figure 61. EJBs Selection Dialog
Chapter 10. Monitoring tools 91

Once you specify the monitoring level, the information below will be displayed forthe appropriate enterprise beans. Data specific to each enterprise bean will bedisplayed as well as aggregate summary data for all enterprise beans as notedbelow.
Figure 62. Resource Analyzer: Enterprise Beans
Name
Indicates the enterprise bean being monitored. The table might list two ormore enterprise beans with the same name. To distinguish the beans from oneanother, drag your cursor over a bean to see the container with which thebean is associated. Each bean will be associated with a unique container.
Instantiates
Indicates the number of times the create() method was invoked against theenterprise bean, as measured during the most recently completed pollinginterval.
Destroys
Indicates the number of times an enterprise bean destroyed one of itsenterprise bean instances, as measured during the most recently completedpolling interval. The enterprise bean instance might have been destroyed bythe remove() method, or by other means.
Requests
Indicates the total number of requests handled by instances of the enterprisebean, as measured during the most recently completed polling interval.
92 WebSphere V3 Performance Tuning Guide

Because an active method can handle one or more requests concurrently, thisvalue will be greater than or equal to the Requests/Sec. value.
Requests/Sec.
Indicates the average number for all instances of all the listed enterprisebeans, as measured during the most recently completed polling interval.
Execution Time
Indicates the average number of seconds the enterprise bean has required toprocess requests from start to finish. The average is taken from the time theadministrative server was started to the end of the most recently completedpolling interval.
Live Beans
Indicates the number of enterprise bean instances at the server (pooled andactive) at this point in time. This value applies to stateless and stateful sessionbeans and entity beans.
Active Beans
Indicates the number of live beans that are active at this point in time. Thisvalue applies to stateful session beans and entity beans.
Creates
Indicates the number of times the create() method was invoked against theenterprise bean, as measured during the most recently completed pollinginterval. This value applies to stateful session beans and entity beans.
Removes
Indicates the number of times an enterprise bean instance was removed, asmeasured during the most recently completed polling interval. The enterprisebean instance might have been removed by the remove() method, or by othermeans invoked by the client. This value applies to stateful session beans andentity beans.
Activations
Indicates the number of times the enterprise bean's container activated(retrieved from secondary storage) the enterprise bean, as measured duringthe most recently completed polling interval. Note, because stateless sessionbeans are never activated, this data point is not applicable to them.
Passivations
Indicates the number of times the enterprise bean's container passivated(transferred to secondary storage) the bean, as measured during the mostrecently completed polling interval. Note, because stateless session beansare never passivated, they are not included in the total.
Loads
Indicates the number of times a BMP or CMP entity bean loaded informationfrom the database into itself during the polling interval.
Chapter 10. Monitoring tools 93

Stores
Indicates the number of times an entity bean persisted its state in thedatabase during the polling interval.
10.1.1.1 Aggregated Data PointStateless Session Instantiates
Indicates the total number of times the create() method was invoked againstthe listed stateless session beans, as measured during the most recentlycompleted polling interval.
Stateful Session Instantiates
Indicates the total number of times the create() method was invoked againstthe listed stateful session beans, as measured during the most recentlycompleted polling interval.
Entity Instantiates
Indicates the number of entity bean objects created by the server during thepolling interval.
Stateless Session Destroys
Indicates the total number of times the listed enterprise beans destroyed astateless session bean instance, as measured during the most recentlycompleted polling interval.
Stateful Session Destroys
Indicates the total number of times the listed enterprise beans destroyed astateful session bean instance, as measured during the most recentlycompleted polling interval.
Entity Destroys
Indicates the total number of times the listed enterprise beans destroyed anentity bean instance, as measured during the most recently completed pollinginterval.
Requests
Indicates the total number of requests handled by the enterprise beans, asmeasured during the most recently completed polling interval.
Requests/Sec.
Indicates the average number of requests per second handled by theenterprise beans, as measured during the most recently completed pollinginterval.
Live Stateless Session Beans
Indicates the number of stateless session beans at the server (pooled andactive).
Live Stateful Session Beans
Indicates the number of stateful session beans at the server (pooled andactive).
94 WebSphere V3 Performance Tuning Guide

Live Entity Beans
Indicates the number of entity beans at the server (pooled and active).
Active Stateful Session Beans
Indicates the total number of live stateful session beans that are active. Thisvalue will be less than or equal to the number of live stateful session beans.
Active Entity Beans
Indicates the total number of live entity beans that are active.
Stateful Session Creates
Indicates the total number of times the create() method was invoked againstthe listed stateful session beans, as measured during the most recentlycompleted polling interval.
Entity Creates
Indicates the total number of times the create() method was invoked againstthe listed entity beans, as measured during the most recently completedpolling interval.
Stateful Session Removes
Indicates the number of times stateful session bean instances were removedduring the most recently completed polling interval. The enterprise beaninstances might have been removed by the remove() method, or by othermeans invoked by the client.
Entity Removes
Indicates the number of times entity bean instances were removed during themost recently completed polling interval. The enterprise bean instance mighthave been removed by the remove() method, or by other means invoked bythe client.
Stateful Activations
Indicates the number of times the stateful session bean containers activated(retrieved from secondary storage) the enterprise beans, as measured duringthe most recently completed polling interval.
Entity Activations
Indicates the number of times the enterprise bean containers activated(retrieved from secondary storage) the enterprise beans, as measured duringthe most recently completed polling interval.
Chapter 10. Monitoring tools 95

Stateful Passivations
Indicates the number of times the enterprise bean containers passivated(transferred to secondary storage) the enterprise beans, as measured duringthe most recently completed polling interval.
Entity Passivations
Indicates the number of times the enterprise bean containers passivated(transferred to secondary storage) the enterprise beans, as measured duringthe most recently completed polling interval.
Entity Loads
Indicates the number of times entity beans loaded information from thedatabase into themselves.
Entity Stores
Indicates the number of times entity beans stored information in the database.
10.1.1.2 How enterprise bean statistics apply to the bean typesTable 6 indicates which enterprise bean statistics apply to each type of enterprisebean.
Table 6. Enterprise bean statistics
10.1.2 ServletsThe second tab on the Resource Analyzer allows you to specify which servletresources you wish to monitor. As with Enterprise Beans you can specify afiltering level, by clicking the Select button. You will be prompted with a ServletSelection Dialog box that allows you to select servlet monitoring at:
Statistic Stateless sessionbeans
Stateful sessionbeans
Entity beans
Instantiates YES YES YES
Destroys YES YES YES
Requests YES YES YES
Requests persecond
YES YES YES
Execution time YES YES YES
Live beans (pooledand active)
YES YES YES
Active beans YES YES
Creates YES YES
Removes YES YES
Activations YES YES
Passivations YES YES
Loads YES
Stores YES
96 WebSphere V3 Performance Tuning Guide

1. Server level
2. Servlet Engine level
3. Web Application level
4. By individual servlet
Figure 63. Servlets Selection Dialog
Again there are a number of statistics for each servlet resource as well asaggregate data for all servlet resources as described in Figure 64 on page 97.
Figure 64. Resource Analyzer: Servlets
Chapter 10. Monitoring tools 97

Name
Indicates the servlet instance being monitored. If the table lists more than oneinstance with the same name and you need to tell the instances apart, dragthe cursor over an instance to see the servlet group with which the instance isassociated.
Group
Indicates the servlet group (Web application) to which this servlet belongs. Ifyou are monitoring servlets from multiple Web applications, this value helpsyou distinguish the servlets from one another.
Requests
Indicates the number of requests this instance of the servlet handled duringthe most recently completed polling interval.
Requests/Sec.
Indicates the average number of requests per second for the servlet instance,as measured during the most recent polling interval.
Execution Time
Indicates the average time the servlet instance spent performing servicessuch as service(), doGet(), or doPost(), measured from the time theadministrative server was started, to the end of the most recently completedpolling interval.
Errors
Indicates the number of errors associated with this servlet instance, measuredfrom the time the administrative server was started, to the end of the mostrecently completed polling interval.
Idle
Indicates the number of seconds the servlet instance has been idle, if theservlet is currently idle. If the servlet instance is active, this value will be 0.
Loaded
Indicates the time at which the class file for the servlet instance was mostrecently loaded. The value is 0 if the servlet class is not currently loaded.
10.1.2.1 The Aggregated Data PointRequests
Indicates the total number of requests all servlets handled during the mostrecently completed polling interval.
Requests/Second
Indicates the average number of requests per second for all servlets duringthe most recently completed polling interval.
98 WebSphere V3 Performance Tuning Guide

Execution Time
Indicates the average time the servlet spent during individual executions. It isthe total time spent executing, divided by the number of executions of theservlet.
The average is measured from the time the administrative server was started,to the end of the most recently completed polling interval.
10.1.3 SessionsThe third tab on the Resource Analyzer is for monitoring of session resources.Clicking the Select button results in a selection dialog, which allows you to selectthe application server for which you wish to monitor session resources. This isshown in Figure 65 on page 99.
Figure 65. Sessions Selection Dialog
Unlike other resources such as EJBs and servlets, there are no statisticsavailable for individual sessions, only aggregate data at the server level.
Chapter 10. Monitoring tools 99

Figure 66. Resource Analyzer: Sessions
Creates
Indicates the number of sessions created during the most recently completedpolling interval. This includes sessions that were available, active, orinvalidated.
Creates/Second
Indicates the average number of sessions created per second during the mostrecently completed polling interval.
Invalidates
Indicates the number of sessions invalidated (removed from available oractive state) during the most recently completed polling interval. This value isvalid only in terms of in-memory sessions, not persistent sessions.
Invalidates/Second
Indicates the average number of sessions invalidated (removed from availableor active state) per second during the most recently completed polling interval.This value is valid only in terms of in-memory sessions, not persistentsessions.
Average Lifetime
Indicates the average number of seconds sessions have remained alive inmemory. The average is measured from the time the administrative server wasstarted, ending with the most recently completed polling interval. The value is
100 WebSphere V3 Performance Tuning Guide

valid only in terms of in-memory sessions, not persistent sessions. Currentlyvalid sessions are not included in the calculation because their life spans arenot yet known.
10.1.4 System ResourcesThe System Resources tab allows you to monitor Java Virtual Machine (JVM)resource use for each JVM in use. Recall that in WebSphere V3 each applicationserver process is a separate JVM. Clicking the Select button results in a dialogthat prompts you to select the application server (JVM) that you wish to monitor.This is shown in Figure 67.
Figure 67. Server Resources Filter Dialog
Chapter 10. Monitoring tools 101

Figure 68. Resource Analyzer: System Resources
Total JVM Memory (K)
Indicates the total memory, in kilobytes, available to the Java Virtual Machineduring the most recently completed polling interval. This value is the JVMheap size. This value will not necessarily match values reported on thePerformance tab of the Windows Task Manager because this does not includethe native component of the process.
JVM Memory in Use (K)
Indicates the memory in use by the Java Virtual Machine during the mostrecently completed polling interval. The value is in kilobytes.
Available JVM Memory (K)
Indicates the memory available (in kilobytes) to the Java Virtual Machineduring the most recently completed polling interval. This is the differencebetween the total JVM memory and the memory in use. Because the Javavirtual machine can increase the virtual memory in the storage heap asneeded, this value can fluctuate.
10.1.4.1 Thread pool propertiesThe remaining properties on the Server Resources tabbed page of the ResourceAnalyzer correspond to the thread pools maintained by application servers. Eachapplication server has its own thread pool or cache from which it uses threads toprocess remote method invocations.
102 WebSphere V3 Performance Tuning Guide

The size of a server's thread pool varies throughout the server's lifetime. Threadsare created when needed and destroyed when there are too many idle threads.
Thread creates
Indicates the number of threads created during the interval.
Thread destroys
Indicates the number of threads destroyed during the interval.
Total threads (active and idle)
Indicates the total number of threads that are currently either idle or active.
Active threads
Indicates how many threads are currently active.
Configured maximum pool size
Indicates the maximum size of the thread pool.
Percent of time pool maxed
Indicates how often the pool was "maxed out" during the most recentlycompleted polling interval. The thread pool is considered "maxed out" when allof its threads are in use.
If this number is high, consider increasing the number of threads allocated tothe server.
10.1.5 DB poolsThe final tab on the Resource Analyzer allows you to monitor use of databasepools. The Select button allows you to specify the application server for whichyou wish to monitor database pool resources. The selection dialog is shown inFigure 69.
Figure 69. Database Pools Selection Dialog
Each table row on the DB Pools tabbed page represents one pool. Each row liststhe data source and the user for which the pool maintains connections.
Chapter 10. Monitoring tools 103

Figure 70. Resource Analyzer: DB Pools
User
Indicates the ID used to log into the database to which this pool maintainsconnections.
Datasource
Indicates the datasource object associated with the pool. A datasource objectkeeps a connection pool from which database connections can be borrowed.
Size
Indicates the average pool size, as measured from the time the administrativeserver was started, ending with the most recently completed polling interval.
Percent in Use
Indicates the percentage of the connections that are currently unavailable forservicing requests. The connections might be orphaned, or already servicingrequests.
Creates
Indicates the number of connections created during the most recentlycompleted polling interval.
Destroys
Indicates the number of connections destroyed by this pool during the mostrecently completed polling interval. For example, an orphaned connection
104 WebSphere V3 Performance Tuning Guide
might be destroyed because its owning client has died or is otherwiseunresponsive.
Waiting
Indicates the number of threads currently waiting for connections from thispool.
Wait Time
Indicates the average number of seconds threads must wait to gainconnections from the pool, and whether or not the pool has availableconnections when requests are made. The average is taken from the time theadministrative server was started, to the end of the most recently completedpolling interval.
Preempted
Indicates the number of times a connection was returned to the pool before arequest was finished using it. This might happen as a result of time outs on theclient side, or for other reasons. A high value indicates a possible problem.
Time Held
Indicates the average number of seconds requests hold connections fromthis pool, measured from the time the administrative server was started, tothe end of the most recently completed polling interval.
Time Available
Indicates the number of seconds the pool had one or more availableconnections, measured from the time the administrative server was started, tothe end of the most recently completed polling interval.
10.1.5.1 The Aggregated Data PointSize
Indicates the average pool size, as measured from the time the administrativeserver was started, and ending with the most recently completed pollinginterval.
Percent in Use
Indicates the percentage of the connections (in all the pools) that are currentlyunavailable for servicing requests. The connections might be orphaned, oralready servicing requests.
Creates
Indicates the total number of connections (for all pools) created during themost recently completed polling interval.
Destroys
Indicates the number of connections destroyed by pools during the mostrecently completed polling interval. For example, an orphaned connectionmight be destroyed because its owning client has died or is otherwiseunresponsive.
Chapter 10. Monitoring tools 105

Waiting
Indicates the number of threads currently waiting for connections from thepools.
Wait Time
Indicates the average number of seconds threads must wait to gainconnections from the pools, and whether or not the pools have availableconnections when requests are made. The average is taken from the time theadministrative server was started, to the end of the most recently completedpolling interval.
Preempted
Indicates the number of times connections were returned to the pool beforerequests were finished using them. This might happen as a result of timeoutson the client side, or for other reasons. A high value indicates a possibleproblem.
Time Held
Indicates the average number of seconds requests hold connections from thepools, measured from the time the administrative server was started, to theend of the most recently completed polling interval.
Time Available
Indicates the number of seconds the pools had one or more availableconnections, measured from the time the administrative server was started, tothe end of the most recently completed polling interval.
106 WebSphere V3 Performance Tuning Guide
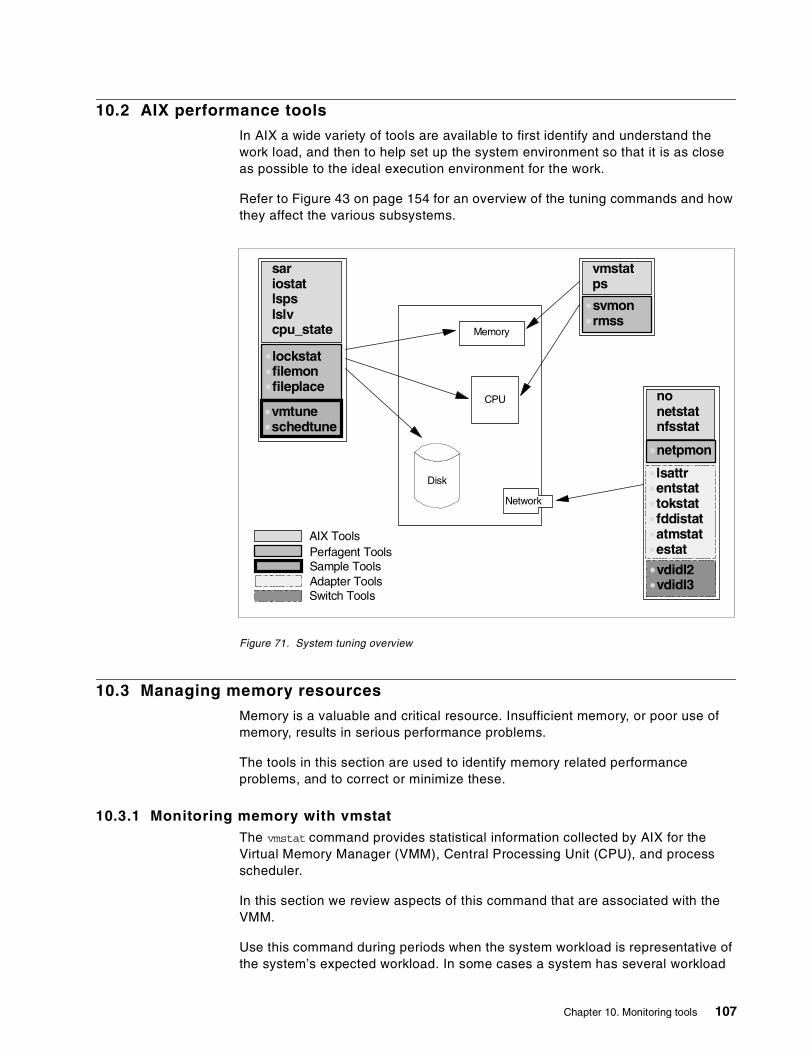
10.2 AIX performance tools
In AIX a wide variety of tools are available to first identify and understand thework load, and then to help set up the system environment so that it is as closeas possible to the ideal execution environment for the work.
Refer to Figure 43 on page 154 for an overview of the tuning commands and howthey affect the various subsystems.
Figure 71. System tuning overview
10.3 Managing memory resources
Memory is a valuable and critical resource. Insufficient memory, or poor use ofmemory, results in serious performance problems.
The tools in this section are used to identify memory related performanceproblems, and to correct or minimize these.
10.3.1 Monitoring memory with vmstatThe vmstat command provides statistical information collected by AIX for theVirtual Memory Manager (VMM), Central Processing Unit (CPU), and processscheduler.
In this section we review aspects of this command that are associated with theVMM.
Use this command during periods when the system workload is representative ofthe system’s expected workload. In some cases a system has several workload
Memory
CPU
Disk
Network
sariostatlspslslvcpu_state
svmonrmss
lockstatfilemonfileplace
vmstatps
vmtuneschedtune
AIX ToolsPerfagent ToolsSample ToolsAdapter ToolsSwitch Tools
nonetstatnfsstat
netpmon
vdidl2vdidl3
lsattrentstattokstatfddistatatmstatestat
Chapter 10. Monitoring tools 107

patterns. It is important to gain an understanding of memory utilization duringthese periods.
The output shown in Figure 72 was captured using vmstat 5 10. Using thiscommand we monitored the changing memory usage every five seconds for atotal of 50 seconds. The first line is statistical information, collected by AIX whenthe system was last booted.
Figure 72. vmstat output
If the fre column (number of pages in the free list) is low (below 2 * MB of realmemory - 8), and the pi column (page in rate/s) exceeds 5 per second, memory isovercommitted.
A high page scan (sr) to page steal (fr) ratio indicates that the memory subsystemis overactive. The higher this ratio, the more time the VMM is spending searchingfor available memory to allocate. Further investigation of this should beundertaken.
Other column headings are as follows:
• r - the number of runnable processes during the interval• b- the number of processes blocked waiting for high-speed I/O• avm - active virtual memory in units of 4 KB pages• fre - size of the list of free RAM pages• pi - the number of pages per second that have been paged• po - the number of pages per second that have been paged out since the last
report• fr - page steal rate• cs- average context switches per second (an idle system will average 20 to 60
per second)• us - user mode cpu average• sy -system mode cpu average• id - idle time average• wa - disk I/O wait average
In AIX Version 4 and onward, the page reclaim column (re) is always 0. Pagereclaims (a page that is released by the VMM and then reclaimed by the sameprocess before allocation to another process) are no longer recorded.
# vmstat 5 10kthr memory page faults cpu----- ------------ ----------------------- ------------- -----------r b avm fre re pi po fr sr cy in sy cs us sy id wa0 0 219963 201 0 0 0 14 50 0 138 457 65 13 10 59 182 2 217167 3002 0 0 0 25 34 0 992 1638 238 30 8 49 133 2 221754 228 0 0 1 402 1736 0 959 1198 217 31 8 56 53 2 216648 5034 0 0 0 65 84 0 943 1383 194 31 7 60 13 2 221020 536 0 0 0 0 0 0 948 2697 181 31 17 52 03 2 222456 437 0 0 0 311 406 0 953 1730 187 35 12 52 03 2 214221 8633 0 0 0 13 19 0 960 2955 224 25 14 58 34 2 216900 5887 0 3 0 0 0 0 969 19824 381 31 17 48 43 2 216366 5902 0 0 0 0 0 0 949 29553 193 30 9 59 23 2 216054 4472 0 0 0 0 0 0 973 2570 274 26 11 46 17
108 WebSphere V3 Performance Tuning Guide
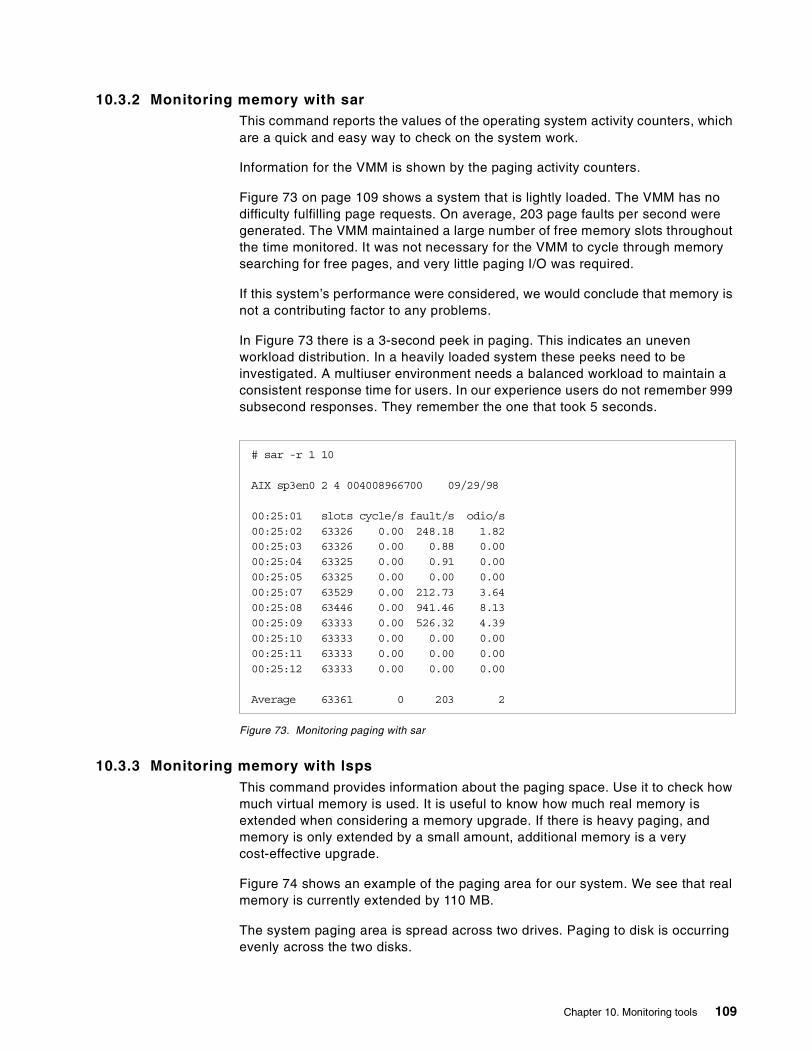
10.3.2 Monitoring memory with sarThis command reports the values of the operating system activity counters, whichare a quick and easy way to check on the system work.
Information for the VMM is shown by the paging activity counters.
Figure 73 on page 109 shows a system that is lightly loaded. The VMM has nodifficulty fulfilling page requests. On average, 203 page faults per second weregenerated. The VMM maintained a large number of free memory slots throughoutthe time monitored. It was not necessary for the VMM to cycle through memorysearching for free pages, and very little paging I/O was required.
If this system’s performance were considered, we would conclude that memory isnot a contributing factor to any problems.
In Figure 73 there is a 3-second peek in paging. This indicates an unevenworkload distribution. In a heavily loaded system these peeks need to beinvestigated. A multiuser environment needs a balanced workload to maintain aconsistent response time for users. In our experience users do not remember 999subsecond responses. They remember the one that took 5 seconds.
Figure 73. Monitoring paging with sar
10.3.3 Monitoring memory with lspsThis command provides information about the paging space. Use it to check howmuch virtual memory is used. It is useful to know how much real memory isextended when considering a memory upgrade. If there is heavy paging, andmemory is only extended by a small amount, additional memory is a verycost-effective upgrade.
Figure 74 shows an example of the paging area for our system. We see that realmemory is currently extended by 110 MB.
The system paging area is spread across two drives. Paging to disk is occurringevenly across the two disks.
# sar -r 1 10
AIX sp3en0 2 4 004008966700 09/29/98
00:25:01 slots cycle/s fault/s odio/s00:25:02 63326 0.00 248.18 1.8200:25:03 63326 0.00 0.88 0.0000:25:04 63325 0.00 0.91 0.0000:25:05 63325 0.00 0.00 0.0000:25:07 63529 0.00 212.73 3.6400:25:08 63446 0.00 941.46 8.1300:25:09 63333 0.00 526.32 4.3900:25:10 63333 0.00 0.00 0.0000:25:11 63333 0.00 0.00 0.0000:25:12 63333 0.00 0.00 0.00
Average 63361 0 203 2
Chapter 10. Monitoring tools 109

Figure 74. Viewing paging space
10.3.4 Monitoring memory with psThis command lists the current processes and their status. By examining theprocesses, we obtain an overview of how much memory each process uses. Wealso obtain information of the VMM overhead for each process.
This command takes a snapshot of the system showing a set of statistics for eachprocess.
Figure 75 is the output of ps gvc on our system. This example has been reducedto 10 lines.
Figure 75. ps gvc output
When using this command to review memory usage, examine:
• PGIN: Number of memory frames paged in
• %MEM: Percentage of system memory used
10.3.5 Monitoring memory with svmonThis command shows the current state and usage of memory.
With svmon memory page use can be viewed from the:
• System level
• Process level
• Segment level
10.3.5.1 Total memory usageAlways obtain an overview of memory usage from the system level. Aperformance problem caused by memory contention is unlikely when the systemhas sufficient memory available.
Figure 76 is the output of svmon -G on our system.
lsps -aPage Space Physical Volume Volume Group Size %Used Active Auto Typepaging01 hdisk2 rootvg 144MB 38 yes yes lvpaging00 hdisk1 rootvg 128MB 38 yes yes lv
paging00 hdisk2 rootvg 16MB 38 yes yes lv
# ps gvcPID TTY STAT TIME PGIN SIZE RSS LIM TSIZ TRS %CPU %MEM COMMAND31124 - A 0:01 1058 1332 96 32768 35 84 0.0 0.0 db2sysc31474 pts/13 A 0:05 704 516 52 32768 295 40 0.0 0.0 tcsh33146 - A 0:00 0 112 232 32768 49 80 0.0 0.0 xlC_r267064 ? A 0:00 185 384 12 32768 261 0 0.0 0.0 aixterm268156 - A 0:10 0 15116 17572 32768 2862 2408 4.0 2.0 xlCentry273814 - A 0:10 92 1036 148 32768 274 104 0.0 0.0 db2bp_s274866 pts/3 A 0:00 0 112 232 32768 49 80 0.0 0.0 xlC_r306432 - A 0:21 1507 1268 224 32768 485 16 0.0 0.0 dtwm306722 pts/19 A 0:00 3 176 232 32768 195 220 0.0 0.0 ksh
307380 pts/3 A 0:10 0 12928 15384 32768 2862 2408 9.6 2.0 xlCentry
110 WebSphere V3 Performance Tuning Guide

Figure 76. Global memory view
Note: The values are displayed as memory pages. A memory page is 4069 bytes.
Interpretation of the svmon report:
• memory: System memory usage
size: Total size of real memory
inuse: Amount of memory in use
free: Amount of free memory
pin: Pinned memory (memory pages that cannot be swapped out)
• inuse: Expands the column memory in use
work: The system working set (data and stack regions)
pers: Pages that are persistent on file
clnt: Client allocated memory (network clients)
• pin: Expands the column pin
(Refer to preceding description of in use columns.)
• pg space: Size of the paging space
size: Size of paging area
inuse: Amount of page space in use (size of real memory extension)
10.3.5.2 Process memory usageWhen memory has been identified as a performance issue, isolating the causerequires details on how memory is used by the processes.
Using ps gvc | grep app (refer to 10.3.4, “Monitoring memory with ps” on page110 for more detail on the use of this command), we identified a process runningapp (we are using app to represent an application). The process ID was 51994.
Figure 77 is an example of using svmon to view a process’s memory usage.
# svmon -Gm e m o r y i n u s e p i n p g s p a c e
size inuse free pin work pers clnt work pers clnt size inuse
65536 62724 2812 3508 41482 21242 0 3347 161 0 131072 25555
Chapter 10. Monitoring tools 111
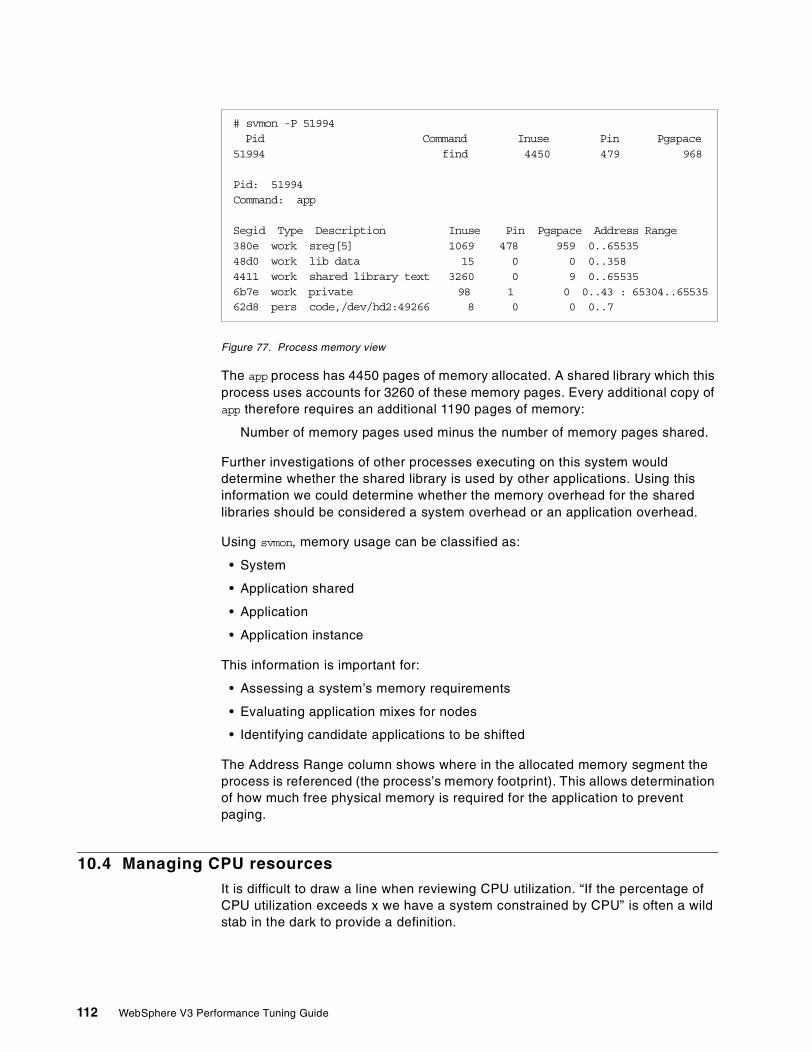
Figure 77. Process memory view
The app process has 4450 pages of memory allocated. A shared library which thisprocess uses accounts for 3260 of these memory pages. Every additional copy ofapp therefore requires an additional 1190 pages of memory:
Number of memory pages used minus the number of memory pages shared.
Further investigations of other processes executing on this system woulddetermine whether the shared library is used by other applications. Using thisinformation we could determine whether the memory overhead for the sharedlibraries should be considered a system overhead or an application overhead.
Using svmon, memory usage can be classified as:
• System
• Application shared
• Application
• Application instance
This information is important for:
• Assessing a system’s memory requirements
• Evaluating application mixes for nodes
• Identifying candidate applications to be shifted
The Address Range column shows where in the allocated memory segment theprocess is referenced (the process’s memory footprint). This allows determinationof how much free physical memory is required for the application to preventpaging.
10.4 Managing CPU resources
It is difficult to draw a line when reviewing CPU utilization. “If the percentage ofCPU utilization exceeds x we have a system constrained by CPU” is often a wildstab in the dark to provide a definition.
# svmon -P 51994Pid Command Inuse Pin Pgspace
51994 find 4450 479 968
Pid: 51994Command: app
Segid Type Description Inuse Pin Pgspace Address Range380e work sreg[5] 1069 478 959 0..6553548d0 work lib data 15 0 0 0..3584411 work shared library text 3260 0 9 0..655356b7e work private 98 1 0 0..43 : 65304..6553562d8 pers code,/dev/hd2:49266 8 0 0 0..7
112 WebSphere V3 Performance Tuning Guide

10.4.1 Monitoring the CPU with vmstatWe have already reviewed this command in 10.3.1, “Monitoring memory withvmstat” on page 107.
vmstat is used to monitor CPU usage. It provides a single line report, which showsa quick status of CPU utilization.
Figure 78 on page 113 is an example of using vmstat 5 on a system with free CPUresources. While monitoring this system, a peak in the workload occurs.
Figure 78. CPU monitoring with vmstat output
Interpreting system activity from this vmstat report:
1. The CPU is lightly utilized:
Idle average 40% (id)Users average 40% (us)System average 20% (sy)Low I/O wait (wa)
Conclusion: CPU utilization of 40% is not due to an I/O bound system.
2. The system workload peaks:
Idle average 0%User average 75%System average 25%Low I/O waitFree list low (fre)High number of page scans (sr)High number of page steals (fr)
# vmstat 5kthr memory page faults cpu----- ------------ ----------------------- ------------ -----------r b avm fre re pi po fr sr cy in sy cs us sy id wa0 0 25565 5251 0 0 0 0 1 0 131 365 64 1 2 96 16 0 41263 124 0 0 0 56 56 0 724 2564 450 41 24 34 03 0 40600 1374 0 0 0 97 114 0 746 2097 393 40 21 38 03 0 40769 1212 0 0 0 0 0 0 698 2142 389 40 24 36 16 0 41019 871 0 0 0 0 0 0 719 2707 493 48 22 27 30 0 41301 529 0 0 0 0 0 0 610 1439 304 25 10 64 02 0 41517 479 0 0 0 64 71 0 628 2588 421 47 23 23 76 0 43293 147 0 0 0 360 368 0 691 3429 407 74 26 0 08 1 43636 190 0 0 0 86 114 0 724 3899 508 67 33 0 06 0 44093 175 0 0 0 108 109 0 689 2807 378 71 29 0 07 0 44416 415 0 0 0 120 120 0 721 3676 448 67 33 0 07 0 44169 853 0 0 0 25 25 0 693 2927 403 74 26 0 06 0 43075 2363 0 0 0 0 0 0 653 2907 436 85 14 0 02 0 42395 3087 0 0 0 0 0 0 732 3413 432 80 17 2 13 0 42635 2764 0 0 0 0 0 0 718 3020 415 59 19 19 32 0 42748 2647 0 0 0 0 0 0 752 2704 432 55 16 29 01 0 41626 4092 0 0 0 0 0 0 748 2506 452 52 17 21 100 0 41228 4610 0 0 0 0 0 0 730 2806 450 54 17 26 33 0 40773 5216 0 0 0 0 0 0 673 2782 445 67 21 12 0
Chapter 10. Monitoring tools 113

Conclusion: VMM is searching for memory to replenish the free list. Thisoverhead is constraining the user application CPU requirement.
3. Workload constrained by CPU:
Idle average 0%User average 85%System average 15%No I/O waitFree memory availableNo paging
Conclusion: The system is CPU bound. Users’ CPU utilization increased assystem CPU utilization decreased. This confirms the above conclusion thatVMM constrained the user CPU utilization.
4. The system workload drops:
Idle average 20%User average 50%System average 20%I/O wait 10%
Conclusion: The workload peak is over and a backlog of work is being clearedin the I/O subsystem.
The peak in workload was a few lines on this report, each line representing 5real-time seconds. The peak in workload therefore lasted 40 seconds. Oncecompleted, the system response was still degraded while a backlog of work wascleared.
Further investigation of this will be required. Identify the program/application anddetermine its loading pattern (when and how often is this application executed).
10.4.2 Monitoring the CPU with sarIn 10.3.2, “Monitoring memory with sar” on page 109 we discussed using thiscommand to check paging statistics.
This command provides a simple method to review CPU utilization.
10.4.2.1 CPU utilization reportTo obtain an overview of CPU utilization, that is, how much time is spent doingactual work versus the time spent being idle or waiting on I/O, use the default saroptions.
Figure 79 on page 115 is an example of using sar to report CPU utilization. Thereport is for a system where the CPU is a limiting factor and is 100% utilized.
114 WebSphere V3 Performance Tuning Guide

Figure 79. CPU Utilization report using sar
10.4.3 Monitoring the CPU with timeThe time command gives CPU and real-time execution figures for commands andapplications.
Use this command to determine an application’s CPU utilization. A good exampleof when it should be used is given in 10.4.1, “Monitoring the CPU with vmstat” onpage 113. An application was executed which used substantial CPU resources.time can be used to quantify the CPU requirement.
Figure 80 shows the result of using time to measure the CPU resourcerequirement to execute our application apprep. This is an unobtrusive method ofcollecting CPU utilization for applications.
Figure 80. Checking CPU utilization with time
10.4.4 Checking active CPUs using cpu_stateThis command sets and displays which processors will be active when thesystem is restarted. It is only available for SMP RS/6000 models.
With cpu_state, processors are selectively enabled or disabled. The changes takeeffect when the node is rebooted.
Generally, disabling processors reduces performance. We do not recommenddisabling CPUs on production systems.
# sar 1 10
AIX sp3en0 3 4 000081007000 09/28/98
07:48:32 %usr %sys %wio %idle07:48:33 77 23 0 007:48:34 82 18 0 007:48:35 81 19 0 007:48:36 79 21 0 007:48:37 81 19 0 007:48:38 80 20 0 007:48:39 79 21 0 007:48:40 81 19 0 007:48:41 77 23 0 007:48:42 67 33 0 0
Average 78 22 0 0
# time apprep
real 3m12.76suser 2m38.72ssys 0m26.54s
Chapter 10. Monitoring tools 115

When assessing performance of applications, there are situations whencomparisons between an SMP and a uniprocessor are required, for example todetermine the performance benefits of an SMP node.
We used this feature to perform low-level application tracing. With multiple CPUsit was difficult to paste execution streams into a sequenced execution flow.
Figure 81 is a report from an 8-way SMP machine after 7 of the 8 processorswere disabled.
Figure 81. Active CPU report
10.5 Managing network resources
Network communication is a combination of hardware and complex software. It isimportant that network parameters are set appropriately.
10.5.1 Monitoring the network with netstatThis command is used to assess the network load and the reliability of thenetwork. It is traditionally used for problem determination. We have found thiscommand to be useful for determining the network load, and whether the networkis congested.
10.5.1.1 Determine the proportion of network traffic for an adapterUse netstat -I to compare the network traffic on a selected adapter with the totalvolume of network traffic.
Figure 82 is an example of a netstat -I report. This report was produced while alarge file was transferred using ftp (a file transfer application) between two nodes.The high-speed switch css0 was chosen to do this transfer.
# cpu_state -lName Cpu Status Locationproc0 0 enabled 00-0P-00-00proc1 1 disabled 00-0P-00-01proc2 2 disabled 00-0Q-00-00proc3 3 disabled 00-0Q-00-01proc4 4 disabled 00-0R-00-00proc5 5 disabled 00-0R-00-01proc6 6 disabled 00-0S-00-00proc7 7 disabled 00-0S-00-01
116 WebSphere V3 Performance Tuning Guide
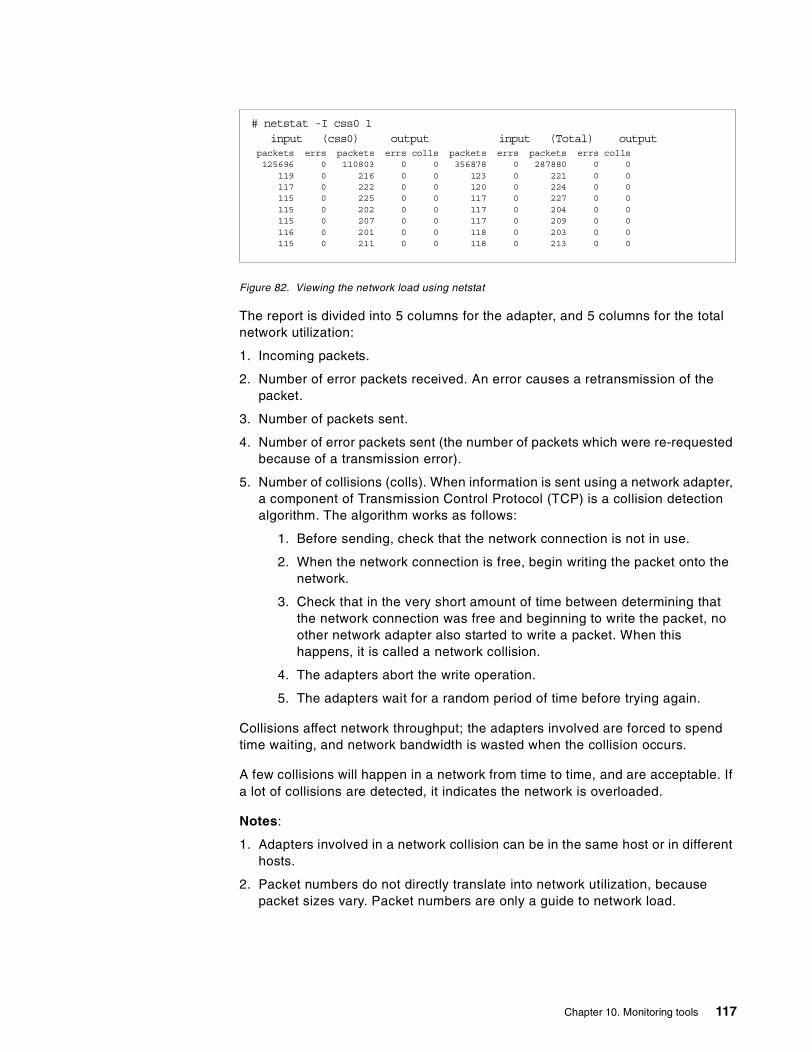
Figure 82. Viewing the network load using netstat
The report is divided into 5 columns for the adapter, and 5 columns for the totalnetwork utilization:
1. Incoming packets.
2. Number of error packets received. An error causes a retransmission of thepacket.
3. Number of packets sent.
4. Number of error packets sent (the number of packets which were re-requestedbecause of a transmission error).
5. Number of collisions (colls). When information is sent using a network adapter,a component of Transmission Control Protocol (TCP) is a collision detectionalgorithm. The algorithm works as follows:
1. Before sending, check that the network connection is not in use.
2. When the network connection is free, begin writing the packet onto thenetwork.
3. Check that in the very short amount of time between determining thatthe network connection was free and beginning to write the packet, noother network adapter also started to write a packet. When thishappens, it is called a network collision.
4. The adapters abort the write operation.
5. The adapters wait for a random period of time before trying again.
Collisions affect network throughput; the adapters involved are forced to spendtime waiting, and network bandwidth is wasted when the collision occurs.
A few collisions will happen in a network from time to time, and are acceptable. Ifa lot of collisions are detected, it indicates the network is overloaded.
Notes:
1. Adapters involved in a network collision can be in the same host or in differenthosts.
2. Packet numbers do not directly translate into network utilization, becausepacket sizes vary. Packet numbers are only a guide to network load.
# netstat -I css0 1input (css0) output input (Total) output
packets errs packets errs colls packets errs packets errs colls125696 0 110803 0 0 356878 0 287880 0 0
119 0 216 0 0 123 0 221 0 0117 0 222 0 0 120 0 224 0 0115 0 225 0 0 117 0 227 0 0115 0 202 0 0 117 0 204 0 0115 0 207 0 0 117 0 209 0 0116 0 201 0 0 118 0 203 0 0115 0 211 0 0 118 0 213 0 0
Chapter 10. Monitoring tools 117

10.5.1.2 Network memory buffer allocation statisticsIf memory buffer allocation requests fail, the request is lost and more memoryneeds to be allocated to the network memory pool.
Figure 83 is an example of using netstat -m to check the network memory bufferallocation statistics. Check the column failed to ensure that the communicationsubsystem has sufficient memory allocated.
Figure 83. Network memory buffer allocation statistics
# netstat -m
Kernel malloc statistics:
******* CPU 0 *******By size inuse calls failed free hiwat freed32 232 442 0 24 640 064 168 227 0 24 320 0128 113 214 0 15 160 0256 153 109491 0 327 384 2512 240 4406 0 8 40 01024 54 2200 0 2 100 02048 1 400 0 99 100 1434096 66 154 0 107 120 98192 4 7 0 0 10 016384 1 15 0 19 24 732768 1 1 0 0 2047 0
By type inuse calls failed memuse memmax mapb
Streams mblk statistic failures:0 high priority mblk failures0 medium priority mblk failures0 low priority mblk failures#
118 WebSphere V3 Performance Tuning Guide

10.6 Tuning methodology example with changing JVM parameters
The parameters listed in previous chapters provide a starting point for yourapplication and application server testing. Since your application and operatingenvironment will differ from those used for our tests the recommended approachis to run application-specific performance tests.
The following example depicts the iterative approach required to determine thethe appropriate Java heap size settings (-ms and -mx) for the Trade applicationrun on an AIX Model 43P workstation with a 200 MHz processor and 256 MB ofRAM.
10.6.1 Case 1: -mx64mAs a starting point we set the maximum heap size for the application server to 64MB (-mx64m) on the command line arguments. We did not set the minimum heapsize.
Figure 84 shows the output of vmstat at 5-second intervals (vmstat 5). Looking atthe statistics for Page and CPU we can see that the test was started at theseventh row below. This is indicated by the increase in CPU use and a drop infree memory with an attendant increase in system paging.
Figure 84. Output of vmstat (1/2) of case1 (-mx64m)
Within 20 seconds (4 records) though paging decreases for the most part, therecontinues to be some paging. At the bottom of the diagram, there is an increasein paging.
This example is for illustration of the performance tuning process and shouldnot be used for capacity planning purposes.
Note
Chapter 10. Monitoring tools 119

At the same time we can monitor the JVM heap size by using the WebSphereResource Analyzer which we can access via Tasks -> Performance -> Start ->Server Resources tab.
From there you specify the node, and server and the information, shown in Figure85, as displayed. To graph a particular resource such as JVM Memory in use,highlight the item of interest, then specify Chart -> Add Selection to Chart. Youcan also detach the Resource Analyzer task window by selecting Window ->Detach Task Window.
As can be seen, the JVM heap size has grown rapidly from 7550 KB (7.55 MB) to15,976 KB (15.97 MB) before decreasing, then cycling up and down as garbagecollection controls the size of the heap.
Figure 85. Resource Analyzer with case1 (-mx64m)
120 WebSphere V3 Performance Tuning Guide

Examining vmstat again as the run progresses and we can see that CPU use hasremained fairly constant, and that the memory use (paging) has settled down asshown in Figure 86.
Figure 86. Output of vmstat (2/2) of case1 (-mx64m)
Chapter 10. Monitoring tools 121

Turning our attention back to the WebSphere Resource Analyzer, we can see acontinuation of the same oscillation pattern in JVM heap size as garbagecollection occurs.
Note the values plotted are at the end of the Resource Analyzer polling cycle sothe JVM most likely did increase to the max of 16 MB. Use of more finite pollingwould depict a more accurate picture of JVM use, as shown in Figure 87.
Figure 87. Resource Analyzer with case1 (-mx64m)
122 WebSphere V3 Performance Tuning Guide

Of course we’re all interested in the end result and for that we turn to AKstress,which we used for generating high load, at the end of our run.
Figure 88. Output of AKstress of case1 (-mx6m)
Upon examination of the results it can be seen that we processed 12.05 requestsper second with these particular JVM settings.
AKstress Process Statistics
Uptime: 0 hours 13 minutes 50 secondsNumber of Threads: 10Pages Completed: 10000Pages To Be Completed: 10000Pages per second: 12.05Requests completed: 10000Requests per second: 12.05Failed Connections: 0Incorrect response codes: 0Content verification failed: 0Request write failures: 0Number of early closes: 0Number of early server closes: 0Number of request write failures: 0SSL handshake failures: 0
Request statistics for request /servlet/TradeServlet (Rec_Request_dHe8Ea)Successes: 10000Return Code Failures: 0Early Server Closes: 0Content Verification Failures: 0Min time (milliseconds): 0Max time (milliseconds): 13660Mean time (milliseconds): 786
akstress - execution complete
Chapter 10. Monitoring tools 123

10.6.2 Case 2: -ms32m, -mx64mFor the second run a minimum heap size of 32 MB was specified. As before themaximum heap size remained set at 64 MB. (-ms32m -mx64m). The start of therun is shown in Figure 89 with vmstat. We can see that the run started at theeighth line from the top by looking at the change in CPU use which transitionsfrom 93% idle to 35% idle to 0% idle as the test run was started. Also note that aswe increased JVM size the amount of system paging increased when comparedto the first test.
Figure 89. Output of vmstat (1/2) of case2 (-ms32m -mx64m)
124 WebSphere V3 Performance Tuning Guide

The corresponding data from the WebSphere Resource Analyzer is shown below.Since a larger JVM minimum heap size was specified, we observe a longerinterval between garbage collection cycles.
Figure 90. Resource Analyzer with case2 (-ms32m -mx64m)
Chapter 10. Monitoring tools 125

The vmstat data during the middle of the run is shown in Figure 91. CPU useremains high and some memory paging is still occurring, though not as much asin the beginning of the run, but more than occurred during the first run as shownin Figure 86 on page 121.
Figure 91. Output of vmstat (2/2) of case2 (-ms32m -mx64m)
126 WebSphere V3 Performance Tuning Guide
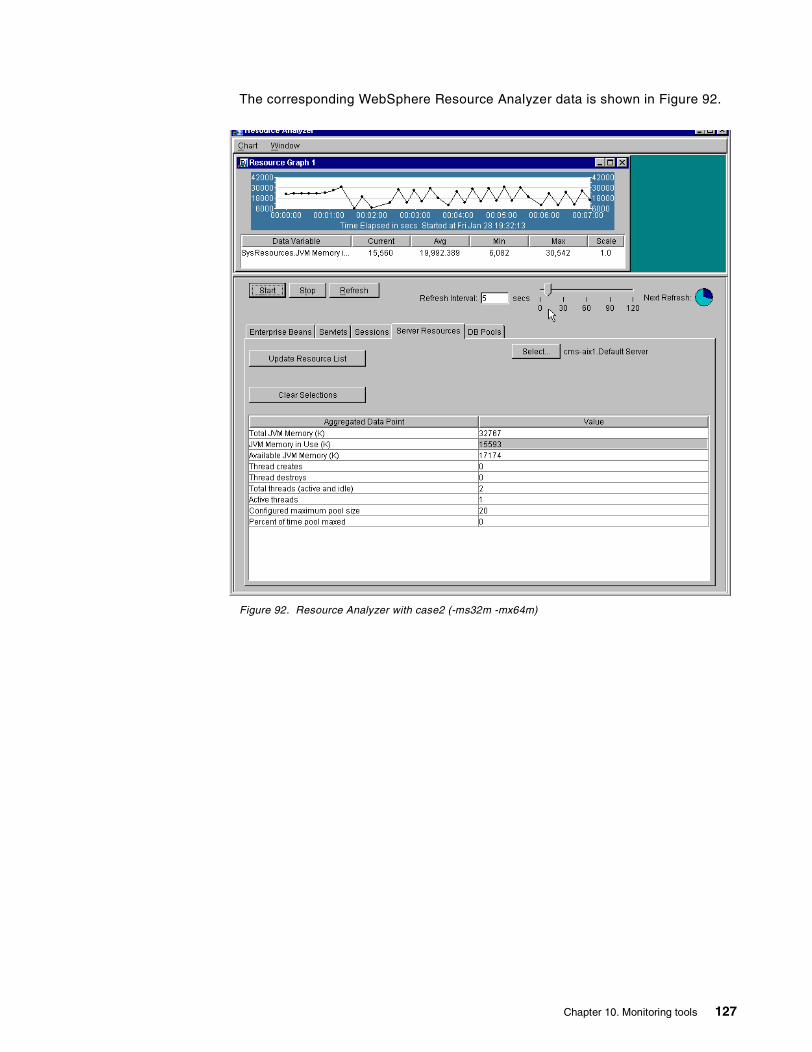
The corresponding WebSphere Resource Analyzer data is shown in Figure 92.
Figure 92. Resource Analyzer with case2 (-ms32m -mx64m)
Chapter 10. Monitoring tools 127

Finally at the end of the run we see the results from AKstress as shown in Figure93.
Figure 93. Output of AKstress of case2 (-ms32m -mx64m)
Increasing the JVM minimum heap size has resulted in a significant performanceimprovement from 12.05 requests per second to 15.38 requests per second. Thisrepresents a 27% improvement in throughput. This result is no doubt due to thedecreased amount of times that garbage collection had to run, despite theincreased memory paging we observed.
AKstress Process Statistics
Uptime: 0 hours 10 minutes 50 secondsNumber of Threads: 10Pages Completed: 10000Pages To Be Completed: 10000Pages per second: 15.38Requests completed: 10000Requests per second: 15.38Failed Connections: 0Incorrect response codes: 0Content verification failed: 0Request write failures: 0Number of early closes: 0Number of early server closes: 0Number of request write failures: 0SSL handshake failures: 0
Request statistics for request /servlet/TradeServlet (Rec_Request_dHe8Ea)Successes: 10000Return Code Failures: 0Early Server Closes: 0Content Verification Failures: 0Min time (milliseconds): 0Max time (milliseconds): 17084Mean time (milliseconds): 621
akstress - execution complete
128 WebSphere V3 Performance Tuning Guide

10.6.3 Case 3: -ms64m, -mx64mFor our third test we again increase the minimum heap size, this time to 64 MB(-ms64m) so that it equals the maximum.
The starting vmstat output is shown in Figure 94. As can be seen by examiningCPU use and paging, the test started at the seventh line from the top. While thesecond run incurred some CPU wait (far right column) as a result of the CPUwaiting for resources due to paging, the wait for this the third run is far morepronounced in both the severity and duration then was observed in the previousruns. The same can be said of paging which is far more pronounced is the thirdrun than in the second run.
.
Figure 94. Output of vmstat (1/2) of case3 (-ms64m -mx64m)
Chapter 10. Monitoring tools 129

The corresponding data from the WebSphere Resource Analyzer is illustrated inFigure 95. As can be seen, increasing the heap size results in a slow grow in theheap size without the oscillating pattern seen in the previous runs due to garbagecollection.
Figure 95. Resource Analyzer with case3 (-ms64m -mx64m)
130 WebSphere V3 Performance Tuning Guide

As the run continues we examine the output from vmstat and see that we continueto experience a great deal of CPU wait state and memory paging as shown inFigure 96, neither of which is beneficial for performance.
Figure 96. Output of vmstat (2/2) of case3 (-ms64m -mx64m)
Chapter 10. Monitoring tools 131

In fact we saw that AKstress was running so slowly, as compared to the otherruns, that we halt the run.
Figure 97. Output of AKstress of case3 (-ms64m -mx64m)
We can see that throughput has fallen off to 3.05 requests per second, sowhatever benefit we realized from garbage collection running was more thanoffset by the amount of time the system spent paging memory with thecorresponding CPU wait.
Thus we’ve determined that the optimal heap size settings for this application inconjunction with this hardware environment are a maximum heap size of 64 MB(-mx64m) and a minimum of 32 MB (-ms32m). We can use this as a starting pointfor testing the effect of other JVM settings such as -noclassgc. A similar approachis then used for other settings such as connection poolsize.
AKstress Process Statistics
Uptime: 0 hours 22 minutes 11 secondsNumber of Threads: 10Pages Completed: 4063Pages To Be Completed: 10000Pages per second: 3.05Requests completed: 4063Requests per second: 3.05Failed Connections: 0Incorrect response codes: 0Content verification failed: 0Request write failures: 0Number of early closes: 0Number of early server closes: 0Number of request write failures: 0SSL handshake failures: 0
Request statistics for request /servlet/TradeServlet (Rec_Request_dHe8Ea)Successes: 4053Return Code Failures: 0Early Server Closes: 0Content Verification Failures: 0Min time (milliseconds): 0Max time (milliseconds): 47904Mean time (milliseconds): 1511
132 WebSphere V3 Performance Tuning Guide

Chapter 11. WebSphere Application Server Site Analyzer
The WebSphere Application Server Site Analyzer, part of the WebSphere familyof products, provides basic Web site traffic measurements. Site Analyzer, at ahigh level, provides detailed analysis of Web content integrity, site performance,usage statistics, and a report writing feature to build reports from the contentintegrity and usage statistics.
You can get more information from the WebSphere site athttp://www.ibm.com/software/webservers/appserv/siteanalysis.html.
11.1 What is WebSphere Application Server Site Analyzer?
Site Analyzer provides a set of tools to measure Web site traffic by analyzingcontent, measuring usage, and reporting. It assists the user in understandingtraffic volume (hits and visits), identifying traffic sources (domains, subdomains,and referrers), and managing site integrity (link verification and siteconformance). Site Analyzer may be installed on a single machine or overmultiple machines in a client/server model.
Both administrator and non-administrator or client users need to definepreferences prior to getting started. First, each user must go through the Startupwizard, also known as General Preferences. Second, each user must create aproject to organize work. Project files are stored locally on the client machine, butlink to elements on both the local client machine and on the server machine.When you have several Web sites to analyze, you should consider creating aseparate project for each of the sites to keep your information separate. This willallow you to easily access information from different Web sites.
Certain roles and responsibilities are defined for the Site Analyzer administratorand client user as follows:
• Creating analysis (Administrator only)
• Editing an existing analysis (Administrator only)
• Deleting an analysis from the database (Administrator only)
• Running an analysis (Administrator only)
• Scheduling an analysis to run later (Administrator only)
• Creating report elements
• Creating reports
• Generating reports
WebSphere Site Analyzer comes with a set of wizards for defining reportelements and reports. Report elements are a method to operate on an analysis.Report elements consist of types (for example a browser), measures (such ashits per visit), and operations (such as sum or average). After a report element iscreated, then you can build and generate a report. Wizards provide a very userfriendly interface for understanding how your Web site is used.
In general, Site Analyzer performs the following:
© Copyright IBM Corp. 2000 133

• Analyzes Web content integrity and site performance, and provides usagestatistics.
• Supports the team environment, with its flexible client/server architecture.
• Supports teams that may be divided into administrators andnon-administrators with different levels of authority.
• Uses database technology to provide scalability and historical data for trendanalysis.
• Supports customization and configuration to suit the user environment.
• Supports remote administration and reporting via the client interface.
11.2 Why do I need WebSphere Application Server Site Analyzer?
The WebSphere Application Server Site Analyzer provides the Web site ownerwhich a rich set of tools to analyze usage and content of Web pages. SiteAnalyzer allows you to develop specific reports to provide feedback to differentgroups within your company. For example, an executive might ask the questionHow is the money that I am spending on a Web site affecting my bottom line? Or,Am I reaching my customers? Someone in sales or marketing might ask thequestion Who are my customers? Are my marketing programs effective? Or, Howeffective is the Web site content?
Site Analyzer provides the tools necessary to assist in the development,deployment, and management of a Web site. Data collected may provide differentpeople within an organization with such information as measuring and optimizingusage, or tracking the effectiveness of marketing campaigns.
Figure 98. Site Analyzer feedback loop
AnalystUses Site Analysis to trackUsage Profiling and behavioranalysis to ensure effectivecustomized, personalized,content delivery
DevelopDevelop
ManageManage
DeployDeploy
Web MasterUses Site Analysis tomeasure and optimizeusage rateUses Site Analysis for errortracking
Creative DirectorUses Site Analysis toimprove site flow afterinitial deploymentUses Site Analysis to findstructural problems
Sales/MarketingTrack effectiveness ofonline programsProspect tracking
Page DesignerUses Site Analysis tobuild the most effectivedesigns for personalizedcontent
Artist or WriterUses Site Analysis tounderstand effectiveness ofcertain link icons
134 WebSphere V3 Performance Tuning Guide

11.2.1 Features of WebSphere Application Server Site AnalyzerFeatures of the site analysis component include:
• Content and structural analysis
• Usage analysis
• Modular reporting
• Scalability and trending
• Categorical analysis
• Dynamic content analysis
• Visitor analysis
• Additional technical features
• Flexible client/server configuration
11.2.2 Content analysisContent analysis is a function of Site Analyzer, and provides information aboutthe structure of your Web site, including information about duplicate pages,unavailable resources, broken links, and content with excessive load time.Content analysis provides the following functions:
• Explores secured servers with a fast Internet friendly crawler. A crawler is aprogram that, given an anchor URL, searches the Web site collectinginformation about links, and detailed information about resources within yourWeb site. The crawler obeys the Web server robot rule specified in therobot.txt file. If the robot.txt file indicates URLs not to explore, then the contentanalysis will honor that request and explore only the areas that are notexcluded. If the Web page is password protected, then the crawler usespredefined user IDs and passwords to gain access.
• Provides domain or URL inclusion and exclusion from the detailed analysis.Users may include additional domains or URLs other than the root domain tothe analysis. Likewise, they may exclude domains or URLs.
• Collects page attributes and site structure for mapping with the Site Surveyorvisual tool. Site Surveyor maps out the results of a content analysis. With SiteSurveyor, you can view the following:
• A visual representation of your site based on links it contains
• Information about the site including the structure of the Web site
• Detailed information about resources within the Web site
• Information about the links in the Web site
• Identifies duplicate and inactive files on the Web server.
• Detects unavailable resources such as broken links and missing files.
• Identifies content with excessive load sizes or too many objects on a pageallowing the user to fine-tune the site performance.
• Identifies pages that do not conform to user-defined site policies, such asmeta tags.
• Allows users to view sites as a whole or divided into small partitions for moredetailed analysis.
Chapter 11. WebSphere Application Server Site Analyzer 135

Figure 99. Content Analysis: measuring the integrity of Web sites
11.2.3 Usage analysisUsage analysis reveals how your site is being used, including who is using it,where they enter it, and how they navigate within the site. You can view thisinformation in reports. The usage analysis gathers site information by processingyour Web server's log files. Usage analysis provides the following functions:
• Full heuristic (registration, cookie, IP, or referral-based) sessionizationprovides critical data about visits, entries, exits, etc. For example, you mightbe interested in hits per visit for different browsers.
• Supports National Center for Supercomputing Applications (NCSA)Combined, NCSA Common, and World Wide Web Consortium (W3C)Extended log file formats. The following is a list of Web servers and theirsupported log file formats:
Table 7. Site Analyzer supported log file formats
• Automatically retrieves log files witha wildcard specification from servers. Forexample, filters include eliminating internal hits, and entering part of anaddress, such as 9.19.*, to exclude anything that begins with 9.19.
• Supports multi-threaded DNS resolution with customizable expiration rate,allowing reporting by readable names rather than by IP addresses. When the
Apache Server Version 1.3.6 W3C Extended
Lotus Domino Go NCSA Common or Combined
IBM HTTP Server Version 1.3.6 W3C Extended
Microsoft Internet Information Server (IIS) Version 4.x W3C Extended
Netscape Enterprise Server Version 3.x NCSA Common or Combined
In/out linksimagesappletsconformanceformse-mailmeta tagssize
ContentAnalysis
DATAMART
http
Quality: identify broken links, pages withexcessive load sizes, pages with toomany objects
Consistency: images without text, pageswithout titles
Site Conformance: ensure pages containrequired elements
136 WebSphere V3 Performance Tuning Guide

usage analysis encounters an unrecognized IP address, it performs a DNSlook up to resolve the host name so that reports will contain the host name.
• Supports customizable analysis process using categories, allowing users toinclude new items or categories of items by patterns.
This feature is crucial for extensibility. For example, users may specify a file namepattern to indicate a new category of advertisements. Usage analysis matchesthe pattern with the hit records during analysis and treats the matches asadvertisements. This is useful, if for example the marketing group was creating anew marketing campaign associated with a Web page, and they want to capturehow effective it is by counting the visits to that page.
Figure 100. Usage Analysis: discover usage patterns
11.2.4 Visualization and reportsThe Site Analyzer provides custom reports from the results of either the contentanalysis or usage analysis.
The Site Analyzer comes with predefined custom reports. Key features andcustomization are as follows:
• Provides visualizers that allow a user to view the site structure and quicklylocate pages with problems via color schemes and icons.
• Provides on-demand searching for certain page attributes such as site policyconformance, author, expiration date, etc.
• Provides many predefined reports that are fully customizable including style,such as color and fonts to generate the report, and reporting range, such asbeginning and ending dates and time.
• Allows the users to specify the beginning and ending day of the week. Thedefault is Sunday to Saturday.
• Enables graphical 3-D charts for plotting data in a professional fashion.
• Allows users to request information in minute range (for example, last 15minutes).
UsageAnalysis
DATAMART
hitspagesbytesvisitstime
visitorreferrerresourceentry/exitagent[sub]domainIP address
ftpfile
server
NCSACombined Log Format
Common Log Format
IIS 4.x
Chapter 11. WebSphere Application Server Site Analyzer 137

• Generates static or dynamic reports. Static reports use the currently availabledata; dynamic reports delay fetching data until requested via the browser. SiteAnalyzer contains a set of servlets that dynamically compose the report on thefly using most up-to-date data. Servlets run on the Web Server machine.
• Provides leading-edge tools for a user to create additional reports with no SQLknowledge required.
11.2.5 UsabilitySite Analyzer provides key usability enhancements to assist the user inperforming Site Analyzer tasks, such as:
• InstallShield to simplify the installation process
• Wizards to guide a user through various tasks
• Features Start-Up Wizard that quickly helps users to set up and get started
• Interfaces consistent with other WebSphere user interfaces, such as IBMWebSphere Studio
Figure 101. Usage analysis
138 WebSphere V3 Performance Tuning Guide

Figure 102. Content analysis
11.2.6 TechnologySite Analyzer covers a wide range of technologies and standards. It supports:
• Site Analyzer server support on AIX, Solaris and Windows NT and clientsupport on all Windows platforms. In addition, it supports the use of HTTP logfiles from S/390 and AS/400 servers.
• Collection and storage of data in a DB2 Universal Database (UDB) includedwith the site analysis component.
• The site analysis component provides centralized task scheduling, allowing forscheduling of log file FTP, multiple analyses, and generation.
• Centralized task scheduling on the server also allowing the client to shut downwithout affecting scheduled tasks.
• Multiple sites and multiple servers.
• Administrators and clients with differing levels of authority.
Chapter 11. WebSphere Application Server Site Analyzer 139

11.2.7 Client/server configurationSite Analyzer may be installed in a stand alone client/server configuration or in amulti-machine client/server configuration. See Figure 103. The server containsthe analyzers whose responsibility is to transform the raw data into valuableinformation and store it in the database. The client interface providesadministrative, visualizing, and report-generating functions. From the client, youcan schedule analysis tasks to run at a specific time and/or time interval.
The progress status is broadcast to the interested clients and displayed asappropriate and necessary. Once the analysis is completed, you may generatereports or visualize the data. The system comes with about 30 predefinedready-to-use report elements.
The user may also install the entire system on one machine. In this case, thecommunications between the client and the server take place locally. The reportsmay be made available to other users by publishing them to a Web server usingthe provided publishing tool.
Figure 103. Site Analyzer architecture
WebServer
Log File
WASSite
AnalyzerClient
1. Reporting2. Scheduling3. Setup/Configuration4. Java Client runs onall Win 32 platforms
1. Sessionizer2. DNS3. Crawler4. Importer5. Runs natively onAIX, Solaris and NT6. Tested as midtierserver for S/390 andAS/400
Usage Analysis1. Web Server writes log file2. Log file(s) transferred via scheduled FTP toSA server3. Site Analyzer Server reads contents of log file4. Log file is sessionized5. DNS names are resolved6. Contents are imported into DB2 data store7. Reports can be created and scheduled onclient to access usage dataContent Analysis1. Content analysis created and scheduled onclient2. Crawler launched from SA server3. Results of analysis inserted into DB2 data store4. Results can be immediately viewed on client usingsite surveyor or reports can be created from the DB2database
DB2DataStore
Site AnalyzerServer
140 WebSphere V3 Performance Tuning Guide

Chapter 12. AFS performance tuning guide
AFS has provided scalable file administration and file sharing for largeenterprises for many years and now it is a part of WebSphere Performance Pack.AFS is based upon its use of a virtual namespace to make naming and logicaldirectory structures of files independent of their physical location. AFS clients andAFS servers are used to establish this virtual namespace capability. In a Website, the AFS clients can be installed on HTTP servers to reduce theadministrative effort associated with maintaining URL-to-file I/O mappingrelationships. In addition, HTTP servers that are simultaneously AFS clients cansignificantly increase the connectivity capacity to Web server content and canprovide local and geographically distributed access efficiency. Figure 104 showsthe typical configuration of AFS with WebSphere.
Figure 104. WebSphere clustering with AFS and ND
12.1 Overview
For documentary purposes, it should be noted that "File Server" refers to themachine serving files while "fileserver" refers to the individual process assignedwith accomplishing this task in concert with other AFS processes.
This chapter is intended as an augmentation to the distributed AFSdocumentation, for use by persons who are knowledgeable with respect to thesize of their cell in terms of approximate users and load conditions and wish tomonitor and possibly fine tune their File Server. The concepts covered in thischapter will provide such a user with information regarding File Serverparameters that can be used to help improve the performance of their File Servermachines as well as discussions of debugging tools that can aid in the diagnosisand treatment of less than optimal File Server performance. We will not discussthese options in absolute terms as the needs and usage of File Servers, not tomention their performance capacity, varies greatly from cell to cell and prohibits
AFSServer
ND
HTMLs, GIFs
HTTPServer
WebSphereApp Server
AFS Client
browser
browser
browser
HTTPServer
WebSphereApp Server
AFS Client
HTTPServer
WebSphereApp Server
AFS Client
Machine A
Machine B
Machine C
Machine D
Machine E
© Copyright IBM Corp. 2000 141

such a discussion. Other server processes are mentioned, but only in so far astheir action affects the action of the File Server.
File Server tuning can usually be accomplished by the addition of selectedparameters to aid the File Server in processing a user’s requests in a timelymanner. The impact of this tuning will obviously vary greatly depending on thedynamics of the cell and the situation encountered.
Scenarios are introduced in this chapter to educate the administrator in therecognition of situations where tuning of the File Server may improveperformance. These scenarios are culled from real-life customer situations, butmay not describe all aspects of the problems encountered, only those that relateto this subject. The AFS administrator should use these scenarios as aneducation tool on the road to better awareness of the general health of the FileServers in their cell and potential warning signs that intervention is needed.These scenarios are discussed in no particular order and are intended to provideAFS Administrators with a practical experience knowledge base in problems theymay encounter and the methods to employ in determining the causes andsolutions. As with any real-life scenario, your individual experiences, causes, andsolutions may differ from these. The usage of the tools that are employed in thissection are covered in the next section. Typically, the first sign that there is a FileServer tuning or overload problem comes from the users who notice poorresponse times when their clients are requesting or storing a file. We willinvestigate a few of these situations and illuminate the steps needed to identifyand correct the cause.
AFS is distributed with a host of debugging and monitoring tools that can greatlyaid the AFS administrator in File Server tuning. These tools are often used byAFS Technical Support to diagnose reported problems by customers, but canalso be effectively used by AFS administrators in an on-going basis to monitorthese systems. Familiarity with the tools and their related output should help AFSadministrators take a more proactive role in monitoring their systems.
This guide also contains information about performance improvements andparameter enhancements which have been added to the AFS 3.5 File Server.These changes are discussed in the 12.4, “Overview of AFS 3.5 File Serverchanges” on page 146, 12.5, “AFS 3.5 File Server performance improvements”on page 146, and 12.6, “AFS 3.5 File Server parameter changes” on page 151.However, only the changes from the AFS 3.4 File Server are discussed.Therefore, this entire document should be reviewed in order to gain a completepicture of the AFS 3.5 File Server.
This document is meant as a guide and will likely not touch upon all possiblescenarios that could cause problems. As such, we recommend contacting AFSTechnical Support in the event you experience problems or questions that areoutside the scope of this document and are unable to resolve on your own.
12.2 Communications with the fileserver process
Before we discuss some of the more commonly used fileserver processparameters, a discussion of the steps taken during a “conversation” between aclient and the fileserver process will help to highlight the importance of theseparameters.
142 WebSphere V3 Performance Tuning Guide

In this example, a user on a client machine makes an initial request to view theroot directory of a volume from a File Server that it hasn’t spoken to before. Wewill begin by assuming the client has already performed pathname lookups and isaware of the location, volume, vnode, and uniquifier of the directory. The clientmakes a fetchstatus RPC request to the fileserver process to gain information onthe directory itself (length, last modified, creation date, etc.). The fileserverprocess has a listener thread listening on UDP port 7000 for any traffic from theclients. This thread receives the fetchstatus request from the client andestablishes a connection with that client.
A server pool thread then looks at the request being made and makes theappropriate function calls to satisfy the request. In this example, the threadcompletes the request (by checking ACLs, obtaining the information from disk,etc.) and sends the reply back to the client. If there are no server pool threadsavailable, the listener thread will create the call structure for the request andplace it on a queue for the server pool threads to pick off when they are available.Otherwise the call is created and passed to a waiting server pool thread.
Since this is the first time this client machine has talked to this File Server, thefileserver also makes a call to the ptserver to check for any host-based ACLinformation based on the client machine’s IP address. It then makes a second callto the ptserver to check for any ACL information based on the user ID making thefetchstatus request. The ptserver responds with the groups to which the IPaddress and/or user is a member. The fileserver stores this information in aninternal structure for future comparison. The next time the fileserver hears from adifferent user on this same client, it will perform only the user ID call to theptserver since it already has the host-based ACL information stored and needsonly ACL information specific to this user. The user ID call to the ptserver is doneonce per connection with the client. This is why you need to klog to the cell againwhen your user ID ACL information changes; the klog command breaks thisconnection and establishes a new one with the fileserver process.
When a client is ready to actually fetch data for a file, it makes a fetchdata RPC tothe fileserver’s UDP port 7000 to request a copy of the file (or as much of the filethat will fit into one “chunk” as defined in the client afsd parameters). With thedefault chunksize on the client set to 64 KB, the size of the response from thefileserver to this request will be up to 64 KB depending on the size of the file. Thelistener thread receives this fetchdata request from the client and creates a callstructure for the request. It then passes this off to the next available server poolthread which compares the ACLs on the directory with those of the user stored inthe internal structure and, assuming they allow access, will send up to thedefined chunksize of data to the client.
When the fileserver sends either a file status or data back to the client, on thereturn there is an item called a callback. A callback is essentially a statement ofhow long the fileserver will remember that this user has some sort of access tothis file. The fileserver also adds to its own list the fact that this client requestedthis file and how long the fileserver has told the client the callback is good for. Ifanother user updates this file, the fileserver will look through its list of callbacksfor this FID (fileid) for the clients (other than the update user) who have callbacksto this file and will send an RPC to these clients telling them to break the callback.
As alluded to previously, there are several different “kinds” of threads in thefileserver process. The bulk of these are server pool threads that actually handle
Chapter 12. AFS performance tuning guide 143

the RPCs and perform most of the operations relating to the file or directorymanipulation. In addition to these threads, each fileserver process has 5additional threads that perform the housekeeping tasks for that process:
Listener thread: This thread reads from UDP port 7000 listening for something tohappen. When it receives a packet, it determines if there is already a running callthat it is for and if so, passes it to that receive queue or if not, it creates the callstructures for the request.
FiveMinute thread: This thread closes and reopens the log file every five minutesso that you can move it aside if desired, cleans up expired callbacks from thefileserver’s list, resets disk usage stats, along with some additional cleanup tasks.
HostCheck thread: If the fileserver has not heard from a particular client for awhile, this thread will send a check to see if the client is still alive. If it is not, thisthread will remove the data structures associated with that client.
IOMGR thread: This thread runs when the fileserver process has handled all theRPCs and is waiting for a new RPC. The listener thread has registered its interestin reading from the socket for port 7000. The IOMGR thread waits in select() fordata to read from this socket or for a signal to occur.
Signal thread: This transient thread is created by the IOMGR thread to do thework of a received signal.
12.3 Commonly used parameters
[-p (number of processes)]
This parameter sets the number of lightweight processes, or threads, that theFile Server will use to service requests. The original default values are 6threads for “small”, 9 threads for “medium”, and 12 threads for “large” (basedupon the File Server size designation). Use this option in addition to the sizeoption (it sets other parameters) if you want to increase the threadcount on afileserver process. The fileserver process will automatically default to the“medium” setting of 9 threads if no size is specified.
Prior to AFS 3.4a build 5.53, the maximum “safe” number of threads you coulduse was 24. Anything beyond that level would eventually panic the machine.Build 5.53 introduced Delta 10083 to increase the maximum thread value to59. The total max number of threads on the File Server is actually 64, but 5are used for housekeeping tasks.
It should be noted that changes in this parameter will have varying resultsdepending on such things as the machine’s speed, size, and memory andtherefore ability to make the best use of additional File Server threads. Addingmany threads to a very small machine will obviously have a negligible effect.
It should also be noted that the File Server not only services users’ store andfetch requests, but also in the course of these actions, consults with otherserver processes. Increasing the “size” of the File Server with this parameterwithout monitoring and adjusting the effect on other server processes may notresult in the desired performance gain expected.
[-spare (number of spare blocks)]
144 WebSphere V3 Performance Tuning Guide

Used to set the amount of space (in K blocks) by which users are allowed toexceed their quotas when storing in a volume. 0 indicates no grace amount.
While this parameter is not specifically a tuning parameter per se, it is useful incontrolling the overall operation of the File Server machine as full File Serverpartitions could result from incorrect settings in your environment.
[-pctspare (percentage spare)]
This parameter is similar to “-spare” in that it allows the administrator to setthe amount of space that the users of this File Server are allowed to exceedtheir quotas by when storing a volume. In this case, the “grace” amount isexpressed as a percentage of the user’s quota and is therefore variabledepending upon the individual quotas. 0 indicates no grace amount.
Again, it should be noted that while this parameter is not specifically a tuningparameter per se, it is useful in controlling the overall operation of the FileServer machine.
[-busyat (redirect clients when queue > n)]
Under extremely heavy loads, it is possible for a large number of RX FileServer calls to be queued while the data associated with those calls has beendiscarded. When these calls come to the front of the pending call queue andare scheduled, the thread waits for the rest of the data until the clientretransmits. If this occurred to a large number of server threads, a situationreferred to as “meltdown” occurs -- servers handling as few as five to ten callsper second, instead of, for example, five hundred.
With this flag, the fileserver will return VBUSY to the requesting client if thenumber of pending calls is higher than the value set by the flag.
In cells that may experience brief bursts of high activity on a semi-regularbasis, this parameter can be used to help control these situations withoutaffecting the overall function of the File Server.
[-rxpck (number of RX extra packets)]
"-rxpck N" increases the size of the File Server by about 1650 * N bytes.
This parameter controls the size of the RX packet pool. This pool is used forstoring data for calls currently being handled, pending calls, and previousreplies that are not yet complete. Using this option can increase the amount ofdata the File Server can store while processing requests, which will reduce theamount of retransmissions by the client. However, use of this parameter mustbe initiated in metered steps until the desired result is achieved. The more RXpackets, the longer the list the File Server has to process and the more pingsto clients it needs to make etc.
The current default is 200 packets. We recommend starting with a value of 400and if an AFS administrator perceives a need to increase this amount, werecommend doing so in 200 packet increments until the optimal result isachieved.
[-udpsize (size of socket buffer in bytes)]
This parameter sets the UDP buffer size. The default size is 64 KB.
Since the File Server is a single-threaded (OS-speaking) process, all packetsgo through a single UDP port (7000), whose input buffer is 64 KB (set by the
Chapter 12. AFS performance tuning guide 145

RX layer). This parameter is useful if clients are hitting the File Server withmany requests and UDP packets are subsequently being dropped. Todetermine this, the AFS administrator monitors netstat output on the FileServer machine (to be discussed later in the Tools section). This optionbecame available in the 5.24 build for the fileserver instance and the 5.26 buildfor the volserver instance.
[-nojumbo]
This option, when added to the File Server instance, turns off the File Server’sability to send “jumbograms” to the client.
Jumbograms are RX packets which are from 2 to 4 MTUs long. The MTU is thesmallest MTU of either the server or client. So, if both client and server havethe same MTU size, the RX packet will be that size. For example, if both are onFDDI then the packets will be FDDI-sized (4352), not Ethernet-sized (1500). Ifhowever, the client is on Ethernet (1500) and the server is on FDDI (4352), theRX packet will be 1500 (the smaller MTU of the two).
Jumbograms were introduced in AFS 3.4. AFS 3.3a functioned in the mannerwhich is referred to above. In other words, we would use the MTU size ofwhichever is smaller (the client or server) and not increase beyond this point(by employing jumbograms). In AFS 3.4 we start with this initial idea of settingthe MTU size based upon the smaller MTU between the two, but then we“ramp up” to RX packets that have 2 - 4 MTUs amount of data in them. Withthe “-nojumbo” option, you will revert to the 3.3a method wherein we pick thesmaller MTU of the two and stick with it for that transaction.
12.4 Overview of AFS 3.5 File Server changes
Many aspects of the 3.5 File Server have remained the same as they were in 3.4.For example, the communications process between the client and File Server, thetype and number of File Server housekeeping threads used, and the optionalparameters and switches have, for the most part, remained the same as in 3.4and are described in other sections of this document.
This addendum to the original AFS 3.4 File Server Operations Tuning andTroubleshooting Guide seeks to describe only those changes that have beenmade in the File Server functioning and available options in AFS 3.5. Please readthis entire document to fully understand the File Server options and availabletuning parameters.
The changes to the AFS 3.5 File Server can be grouped into two generalcategories: Performance Improvements and Parameter Changes, which arediscussed in the sections that follow.
12.5 AFS 3.5 File Server performance improvements
The 3.5 release of AFS includes enhancements that significantly improve thethroughput of AFS File Servers. Performance benchmarks run at IBM Transarc tocompare AFS 3.4 with AFS 3.5 indicate AFS 3.5 File Servers can process threeto four times more requests per second than AFS 3.4 File Servers. Thesechanges, made to improve the AFS 3.5 File Server performance, are describedbelow.
146 WebSphere V3 Performance Tuning Guide

12.5.1 POSIX threadsThe AFS 3.4 File Server runs with a light weight process (LWP) package thatimplements something resembling threads using setjmp and longjmp contextswitching library routines. In AFS 3.4, any thread that makes a blocking systemcall causes the other File Server threads to “sleep” while that thread waits for thekernel to complete the call. Disk I/O is a good example of a blocking system callin the File Server. So, for example, a 3.4 File Server thread that wants to write toor read from the disk is going to make a blocking system call to the kernel whichwill in turn cause the other File Server threads to sleep while waiting for thisoperation to complete. This has the negative effect of not only creating abottleneck for disk I/O, but also reducing the potential operating performance ofthe other File Server threads by causing them to “sleep” when one is blocked in asystem call.
In AFS 3.5, POSIX threads have been implemented in place of LWP. POSIXthreads are scheduled independently, so the other File Server threads keeprunning even when one of the threads is blocked in a system call. In reference tothe example cited in the preceding paragraph, we no longer have the single diskaccess I/O bottleneck seen in AFS 3.4 File Servers nor do the other threads“sleep” during this process, thus increasing the performance of the File Server. Itshould be noted, however, that any thread which is blocked while waiting for itssystem call to complete will still need to wait for a response from the kernel beforecontinuing. For example, when a thread makes a disk I/O system call, that threadmust wait for the kernel to complete the call, the speed of which will varydepending upon the speed of the disks and processor among other things.
12.5.2 RX slow startAFS 3.4 File Servers used an aggressive retransmission policy that in practiceperforms poorly on congested networks. AFS 3.5 implements slow start, fastretransmit, congestion detection, and congestion avoidance as described in RFC2001. If you would like to learn more about RFC 2001, you may obtain a copyfrom the following location:
ftp://ftp.isi.edu/in-notes/rfc2001.txt
12.5.3 File descriptor cachingThe AFS 3.4 File Server did not make use of file descriptor caching. The AFS 3.5File Server keeps a Least Recently Used (LRU) cache of file descriptors toreduce the overhead of opening and closing files between fetchdata or storedataRPCs sent by the client. This cache is hard-coded with a static size ofapproximately 2000 file descriptors.
As an example, suppose you are reading a 40 MB file. The client is going to befetching chunks of that file one at a time by sending fetchdata RPCs to the FileServer for each chunk.
When the AFS 3.4 File Server receives one of these fetchdata RPCs for, say,chunk 0, it will open the file, lseek to chunk 0, read in the data, close the file, andthen send the data to the client. It would then get the next fetchdata RPC for (inthis example), chunk 1, and again open the file, lseek to chunk 1, read in thedata, close the file, and then send the data to the client.
Chapter 12. AFS performance tuning guide 147

When the AFS 3.5 File Server receives one of these fetchdata RPCs for, say,chunk 1 of a file, it will first search an internal hash table of handles to see if it hasthis file open already. If so, it then looks at the handle to obtain the list of filedescriptor(s) open for this file. So, by saving the least recently used filedescriptors, we can avoid opening and closing frequently used files as oftenbetween these RPCs.
12.5.4 Reduced lock contentionUsing a profiling software package against the File Server binary we found andfixed several places where locks were being held longer than necessary, thusincreasing the optimization of the File Server. For example, the CreateFile routinewas holding a write lock on the parent directory while breaking callbacks, and theStoreData routine was holding a read lock on the parent directory whiletransferring data.
Further analysis of the 3.4 code also indicated that the RX code was one of thebiggest sources of lock contention. This code was reworked with RX fine grainlocking to add locks to protect individual data structures instead of one global lockfor all of RX.
12.5.5 Overload processingAFS File Servers have a busyat threshold that sets an upper limit on the numberof calls that can be queued waiting for a thread. The default is three times thenumber of RX packets, divided by two. So, for example, if you have 400 RXpackets, then the busyat threshold defaults to 600. If the number of calls waitingfor a thread exceeds the busyat threshold, then the File Server starts rejectingcalls with a VBUSY error. This error tells the client to sleep for 15 seconds and trythe call again or, if a ReadOnly exists for that volume on another File Server, theclient will instead contact the other File Server. If no ReadOnly exists on anotherFile Server, the user will see a "Waiting for busy volume" message or, if it is anapplication making the request, the application will not fail unless the VBUSYcondition exists for approximately 30 minutes.
AFS 3.4 does this check only after a call has been assigned to a server thread,not when the first packet for a new call is received. Assume for example that youcurrently have 600 calls waiting for a thread and you have the default threshold of600 for the busyat parameter. When the next call comes in, it is the 601st callwaiting for a thread. That 601st call goes through the queue of 600 calls, getsassigned to a thread, then when the thread picks it up and starts working on it, itrealizes that there are already more than the busyat threshold of calls waiting fora thread, and sends the client a VBUSY error response. In the meantime, morecalls are coming in and stacking up waiting for an available thread, thusincreasing the overall count of waiting calls. If this condition persists and morecalls are coming in than the File Server can process, the File Server can enter astate known as “meltdown”. File Server meltdown occurs when the File Servercannot keep up with the incoming call queue, and all calls get rejected withVBUSY.
AFS 3.5 fixes this by checking the number of queued calls when the first packetfor a new call is received. Only calls that would cause the call queue to overfloware rejected so the File Server can continue to process the calls it currently hasqueued and can accept new calls as it services and removes calls from thisqueue.
148 WebSphere V3 Performance Tuning Guide

The following is a graphical representation of the change made in how the FileServer handles calls that are above its busyat threshold. Assume that the “|”indicates clock time incrementing as you move down the chart and arrowsindicate the direction of data with the client on the left and the File Server on theright.
Figure 105. How 3.4 File Server handles calls
3.4 File Serverlistener thread listening for requests
Request
request (call) queued to pool for server threads
10 seconds to 3 minutes elapse(depending upon the number of calls waiting in the queue)
request assigned to server thread
rxkad auth cycle (challenge, response)Challenge
Responserequest data unmarshalled(to determine what type of RPC it is, etc).VBUSYreturned here if above busyat thresholdand the connection is dropped.
Response
Chapter 12. AFS performance tuning guide 149

Figure 106. How 3.5 File Server handles calls
12.5.6 Buffer managementAFS 3.4 File Servers will delete packets from the receive queues of calls waitingfor a server thread when the File Server runs out of RX packet buffers (asindicated by the NOBUFS field in rxdebug output – see 12.8, “Debugging toolsand example output” on page 160 for more information). If, for example, a threadis processing a call and needs more packets but the File Server is out of packets,it will find a call that has packets and is waiting for a thread and usurp some ofthose packets. Once packets have been deleted from a call's receive queue, newpackets for that call are not accepted until the call is assigned to a thread.
3.5 File Serverlistener thread listening for requests
Requestrequest (call) queued to pool for server threadsif below busyat threshold, otherwise VBUSY returned here andthe connection is dropped.
Assuming we are below the busyat threshold, 10 seconds to3 minutes elapse (depending upon the number of calls waitingin the queue)
request assigned to server thread
rxkad auth cycle (challenge, response)Challenge
Responserequest data unmarshalled(to determine what type of RPC it is, etc).
Response
The 3-minute upper boundary indicated above in both graphs assumes youhave 600 new calls (and a busyat threshold of 600). If these are all newconnections, they would all have to be authenticated, which means the FileServer would have to check with the ptserver for each one of these calls. Thisis obviously a “worst case” scenario, but the potential delay is worth noting. Ifthe 3.4 File Server is in this situation, then the 601st call coming in couldpotentially wait this long until the File Server performs the authentication checkwith the ptserver and since this is the 601st call, only then is it rejected with theVBUSY error. The connection is then dropped due to the VBUSY error, but theFile Server and ptserver processing on this call up to this point has beenwasted.
Note
150 WebSphere V3 Performance Tuning Guide

This scenario created two problems. First, the client would now need toretransmit the packets taken when the call, now without some of its packets,eventually was processed by a thread. This results in additional network traffic.Second, instead of having the full data for the thread to start working on, some orall of the packets would be missing and the thread would have to wait for them tobe retransmitted before it could start processing the call. These delays negativelyimpact the performance of the File Server and, in extreme cases, can result in aFile Server meltdown because once the File Server starts reclaiming packetsfrom receive queues, the throughput of the File Server drops significantly. Theservice time on a cleared call is longer because the File Server has to wait for theclient to resend the packets that were discarded. The File Server also hasadditional overhead because the clients do not stop retransmitting when theserver clears the receive queue.
The AFS 3.5 File Server relies on the busyat threshold to indirectly limit thenumber of packet buffers used and can also allocate packet buffers as needed sothreads no longer need to usurp packets from waiting calls when they need more.In this way, we can avoid the condition described above.
12.6 AFS 3.5 File Server parameter changes
[-p (number of processes)]
Similar to the 3.4 File Server, this parameter sets the number of threads thatthe File Server will use to service requests. However, the 3.5 File Server usesPOSIX threads in place of the lightweight process threads that wereimplemented in 3.4. The original default values are 6 threads for “small”, 9threads for “medium”, and 12 threads for “large” (based upon the File Serversize designation) and have remained unchanged at this time. Use this optionin addition to the size option (it sets other parameters) if you want to increasethe threadcount on a File Server process. The fileserver process willautomatically default to the “medium” setting of 9 threads if no size isspecified.
The maximum number of threads available in the 3.5 File Server has beenincreased from 59 (3.4a build 5.53 and later) to 123. Similar to the 3.4 FileServer, the total maximum number of threads is actually 128, but 5 arereserved for housekeeping tasks.
As in 3.4, it should be noted that changes in this parameter will have varyingresults depending on such things as the machine’s speed, size, and memoryand therefore ability to make the best use of additional File Server threads.Adding many threads to a very small machine will obviously have a negligibleeffect.
It should also be noted that the File Server not only services users’ store andfetch requests, but also in the course of these actions, consults with otherserver processes. Increasing the “size” of the fileserver process with thisparameter without monitoring and adjusting the effect on other serverprocesses may not result in the desired performance gain expected.
[-busyat (redirect clients when queue > n)]
With this flag, the fileserver will return VBUSY to the requesting client if thenumber of pending calls is higher than the value set by the flag. This flagexisted in the AFS 3.4 File Server and is unchanged in terms of syntax;
Chapter 12. AFS performance tuning guide 151

however, the point at which it is implemented has changed in AFS 3.5. Insteadof performing this check only after a call has been assigned to a thread (as isdone in AFS 3.4), the AFS 3.5 File Server checks the number of queued callswhen the first packet for a new call is received. Please review to 12.5.5,“Overload processing” on page 148 for more details on the newimplementation of this parameter.
12.7 Scenarios
12.7.1 Scenario #1Problem:
Users are complaining about poor response times or timeouts when they requestinformation from a certain File Server. Other File Servers in the cell seem to befunctioning normally with no delays in responding to users’ requests. In extremecases, the troubled File Server can move to a “meltdown” situation if diagnosisand corrective action are not taken.
Possible cause:
There may be some I/O-intensive volserver operations taking place that are notallowing the File Server to service its own requests. We refer to this situation asthe volserver being I/O bound.
What to look for:
• Several clients attempting to access files from the same File Server areexperiencing poor response times.
• The disk I/O on this File Server will be high.
• A vos status command on this File Server machine shows one (1) or more vosoperations in progress. The following vos operations can cause heavy disk I/Oactivity and potentially trigger this problem:
• vos remove
• vos backup (essentially a clone operation)
• vos release
• vos move
If the above symptoms are present, also check rxdebug output on the File Serverto see if there are RX packets backing up:
Methods of determining this vary by operating system. The AFSadministrator needs to be familiar with the steps to determine this valueon the operating systems they employ.
Note
152 WebSphere V3 Performance Tuning Guide

Figure 107. Sample output of rxdebug
If RX packets are backing up, the above-noted section of rxdebug output willindicate the amount.
What to try:
Since it appears that the volserver has forgotten how to share the disk with hisneighbors, we can tell the volserver to "sleep" for a couple seconds and let thefileserver have a chance at the disk too.
To do this, you add the hidden option -sleep x/y to the volserver process andrestart the fs instance. The x value refers to the length of time the volservershould sleep and the y value refers to the length of time it should run betweenthese sleep intervals, for example:
volserver -sleep 2/15
This means the volserver should sleep for two (2) seconds after fifteen (15)seconds of work.
# ./rxdebug -servers zeus -port 7000 -rxstatsTrying 158.98.19.134 (port 7000):Free packets: 328, packet reclaims: 91, calls: 323297, used FDs: 7not waiting for packets.
• Do not make the sleep (x) number greater than ten (10).
• Two to three (2 - 3) is usually optimal for the x value.
• The runtime (y value) should equal two or three (2 or 3) times a minute.
• If “vos status” shows a LOT of activity, you can use three or four (3 or 4) inthe x value.
• This option will NOT cause the volserver to sleep every y seconds all of thetime. It will only come into effect when one of the operations that is listedabove is taking place.
• The presence or absence of RAID has no bearing on whether you will seethis problem.
• You will need to restart the fs instance in order to pick up the sleep option.
• The use of this flag could be a potential performance hit - use it only ifneeded.
• Use this flag on a machine by machine basis - not as a cell-wide immediatesolution to one machine's problems.
Note
Chapter 12. AFS performance tuning guide 153

12.7.2 Scenario #2Problem:
Users are complaining about clients hanging when storing or fetching a fairlylarge file. The command doesn't complete, and the user gets a "communicationtimeout failure". This problem should occur on a fairly repeated basis -- not aone-time occurrence.
Possible cause:
The File Server may be attempting to send the data in jumbogram form to theclient and something between the client and the server is inhibiting this action.
What are jumbograms?
As mentioned previously, when sending data to or from a client, if the size of thedata is sufficient, we begin to "ramp up" the size of the RX packets and eventuallysend essentially very large RX packets across the wire. We are trusting that themachines and routers on the wire between this server and client will properlybreak the packets into IP fragments and reassemble them.
When this becomes a problem:
Some of these packets can be dropped if the routers are filling to capacity, or ifsome of the networks simply cannot handle fragments or are set to disallow them(“DF” flag). Aside from the explicit network restriction, what typically happens is arouter or client is collecting all of the IP fragments waiting to get them all so that itcan reassemble them and pass them to the next layer above. If it is missing oneof the pieces, this device will just continue to collect all of the other fragments andwill eventually fill up its input buffer before it can reassemble the packet.
What to look for:
Collect tcpdump data on the source and destination machines (the server andclient), however do not run tcpdump on these machines themselves -- rather, onanother machine with each of their subnets. tcpdump should be run on the piece ofwire that the host is sitting on as well as on each piece of wire between the serverand client (including the subnet the client is on). This will allow us to see ifpackets are being dropped somewhere along the way between the server and theclient.
If you are unable to obtain a tcpdump of the problem, an alternate (although lessrevealing) method would be to perform a KDUMP on the client while it has afailing call in progress. In the KDUMP output, you can get the call MTU size andthis will at least point to (or refute) the possibility of a jumbograms issue.
In the tcpdump output, look for the word “frag” and then check to see if the samefrag pieces are being retransmitted over and over again. Also, check to see if the“DF” (or equivalent) flag is set which would prevent fragmentation of thesemultiple-MTU RX packets.
An example of this problem in tcpdump output:
The following is an example of what to look for in the tcpdump output to see ifjumbograms are the problem. In this example, the File Server was attempting to
154 WebSphere V3 Performance Tuning Guide

send jumbograms. The identifier in the tcpdump output is where we see the FileServer sending 1444-byte packets and then attempting to send 1448-bytepackets which never get through. Remember that 1472 + 8 (UDP header) + 20 (IPheader) = 1500 bytes. In this example, most of the line to the left of the area ofinterest has been truncated and only the rightmost portion is included to highlightwhat we are looking for:
Figure 108. Sample output of tcpdump
From the above, there are several items to note:
• fileserver1.transarc.com.fs is the fileserver process.
• In the column that has numbers like:
1.0006
2.0007
3.0008
4.0009
5.000a
The number to the left of the decimal is the packet number. The number to theright is the packet number from the beginning of the transmission -- but it isunimportant -- focus on the one to the left of the decimal.
• In the column that has "data" or "ack", this tells you whether it is a data packetbeing sent or an acknowledgment (other values are possible and mentioned inthe Tools section of this document).
• The next column over (with "....") is a sort of “message” area. The possible“messages” are:
< fileserver1.transarc.com.fs: 1.0006 data .... 1444 (DF)< fileserver1.transarc.com.fs: 2.0007 data .A.. 1444 (DF)< fileserver1.transarc.com.fs: 3.0008 data .... 1444 (DF)< fileserver1.transarc.com.fs: 4.0009 data .A.. 1444 (DF)< fileserver1.transarc.com.fs: 5.000a data .... 1444 (DF)> fileserver1.transarc.com.fs: 2.0000 ack 2 (DF)< fileserver1.transarc.com.fs: 6.000b data .A.. 1444 (DF)< fileserver1.transarc.com.fs: 7.000c data .... 1444 (DF)< fileserver1.transarc.com.fs: 8.000d data .A.. 1444 (DF)< fileserver1.transarc.com.fs: 9.000e data .... 1448 (DF)> fileserver1.transarc.com.fs: 4.0000 ack 4 (DF)< fileserver1.transarc.com.fs: a.000f data .A.. 1448 (DF)< fileserver1.transarc.com.fs: b.0010 data .... 1448 (DF)> fileserver1.transarc.com.fs: 6.0000 ack 6 (DF)< fileserver1.transarc.com.fs: c.0011 data .A.. 1448 (DF)< fileserver1.transarc.com.fs: d.0012 data .... 1448 (DF)> fileserver1.transarc.com.fs: 8.0000 ack 8 (DF)< fileserver1.transarc.com.fs: e.0013 data .A.. 1448 (DF)< fileserver1.transarc.com.fs: f.0014 data ..L. 244 (DF)< fileserver1.transarc.com.fs: 9.0015 data .A.. 1448 (DF)< fileserver1.transarc.com.fs: a.0016 data .A.M 1448 (DF)< fileserver1.transarc.com.fs: b.0017 data .A.. 1448 (DF)< fileserver1.transarc.com.fs: c.0018 data .A.M 1448 (DF)
Chapter 12. AFS performance tuning guide 155

A = Acknowledgement requested
M = More data packets to follow
L = Last data packet in this series
• The next column tells you the size of the data. In this case, it starts out at1444, which is normal for Ethernet, and then the fileserver process tries toincrease it to 1448 (the start of jumbograms).
• The final column may or may not exist in your tcpdump trace. The “DF” means“Don't Fragment” and is set by MTU discovery.
So, with our new knowledge in hand, we see that the fileserver process firstsends packets 1 and 2 with an ACK requested on packet 2. It then sends packets3 and 4 with another ACK requested on packet 4. It then sends packet 5 and thenreceives its first ACK back from the client for packet 2 (essentially what the clienttells him is “I'm done with packet 1 and have received packet 2”). The fileserverprocess then sends packet 6 with an ACK requested, then packet 7, then packet 8is sent with an ACK requested also. The fileserver then sends packet 9, butnotice, it is being sent with 1448 bytes of data! When you add the 56 bytes for IPinformation added to the packet, this totals 1504, which is 4 bytes more than thisnetwork will accept (remember the DF flag). As you look down the rows, you'll seethat the fileserver process attempts to proceed with this larger size and continuesto attempt to send these packets to the client. In particular, notice that packets 9,a, b, c, d, etc. are being retransmitted over and over. This is also a good sign thatthe packets are being lost and RX is continuing to try to send them (RX ignoresthe error it gets from the router saying that it won't accept the packet). Thus, wehave identified that jumbograms are likely the cause of the user’s complaints.
What to try:
Add the "-nojumbo" option to the fileserver process and restart the fs instance.
Where this option exists:
• fileserver – added to the 5.00 build.
• volserver – added to the 5.00 build.
• vlserver (for vos listvldb jumbograms problems) – added in the 5.28 build.
We have already turned them off by default on the bosserver, kaserver, buserverand ptserver (added to the 5.55 build).
This command is "hidden" on the volserver and fileserver; it is visible on thevlserver.
156 WebSphere V3 Performance Tuning Guide

12.7.3 Scenario #3Problem:
Users are complaining about sluggish response times from the File Server andthe clients are showing a lot of resends (from RXDEBUG output).
Possible cause:
The UDP buffer on the File Server may be overflowing, causing dropped packetswhich have to be resent by the client.
What to look for:
Look at the output from a netstat -s command run on the File Server. Thiscommand will give you statistics for all socket connections from that machine.Look at the "udpInOverflows" (or "buffer overflows" or equivalent) value. If thisvalue is high or increasing over multiple iterations of the netstat -s command(one run before and one run after the test), then this buffer is overflowing.
What is happening:
All AFS packets are UDP packets which are sent over socket connections. Whena File Server makes a socket to send packets over, it allocates a queue (buffer)for that socket in the kernel. This queue has a default size of 64 KB (set by thekernel). When the clients send packets, they go into the queue for the socket onthe receiving end and the fileserver process picks them up from there. When a lotof clients are sending packets across to one File Server, and that process isreading packets off this queue, if the process is not able to keep up with the levelof packets coming in, this queue will eventually fill and overflow (drop packets)causing the packets to have to be resent by the clients.
What to try:
If you see the udpInOverflows (or equivalent) buffer overflows value increasingover multiple iterations of the netstat -s command, you can instruct the fileserver(or volserver) to request a larger queue (buffer) at the time of creation. This isdone with the UDPSIZE option added to either the fileserver or volserver
• RXTUNE (a.k.a. "Twiddle"), which is available from AFS technical support,is sometimes used to test for the presence of a jumbograms problem bycausing the client to inform the servers it cannot accept jumbograms(thereby effectively turning them “off” for this client). Keep in mind that thisprogram should only be run on the AFS client and will only affect the kernel.It has no effect on user-space commands such as bos, vos, kas, backup,etc.
• There is performance degradation (from optimal) when the jumbograms areturned off.
• Even if you see a lot of packets resent in the tcpdump output, that does notnecessarily mean that it is a jumbograms problem. You can use RXTUNE tohelp isolate the problem.
Note
Chapter 12. AFS performance tuning guide 157

instance. To decide what value to set this option to, first determine the maximumvalue that the particular operating system supports, and then set a larger (> 64KB) size within that boundary. You may need to adjust this several times to findthe optimal value for your machine.
What this does:
With this option set, the File Server then reads this value when it opens a socket,and it sets the queue size to this value. Currently, you can have a buffer size of upto 2 GB on Solaris 2.5. Solaris 2.6 and HP10.20 currently set the default queuesize to 1 MB. As mentioned previously, consult your operating systemdocumentation or vendor for specifics.
12.7.4 Scenario #4Problem:
Users are complaining about extremely slow response times from a particular FileServer.
Possible cause:
If the File Server is under heavy load during this time, it may be "melting down".Use the “meltdown” script shown in Figure 109 on page 161 to help make thisdetermination.
What to look for:
In the RXDEBUG output, look at the "wproc" column and the "nobufs" column. Ifthe "wproc" column is increasing in value (or spiking) and the "nobufs" value isincreasing over several iterations of the RXDEBUG, then the server may beoverloading or melting down. You will also see a high resend rate on the clientsduring this time (due to packets dropped by the fileserver).
• The UDPSIZE option is available in AFS on every platform we support.Each of these sockets has a different size value depending on the operatingsystem.
• As an example, to determine the system-wide maximum allowable socketbuffer size for Solaris or AIX:
Solaris: ndd -get /dev/udp udp_max_buf
AIX: no -o sb_max
• To set the system-wide maximum allowable socket buffer size to 1 MB:
Solaris: ndd -set /dev/udp udp_max_buf 1048576
AIX: no -o sb_max=1048576
Note
158 WebSphere V3 Performance Tuning Guide
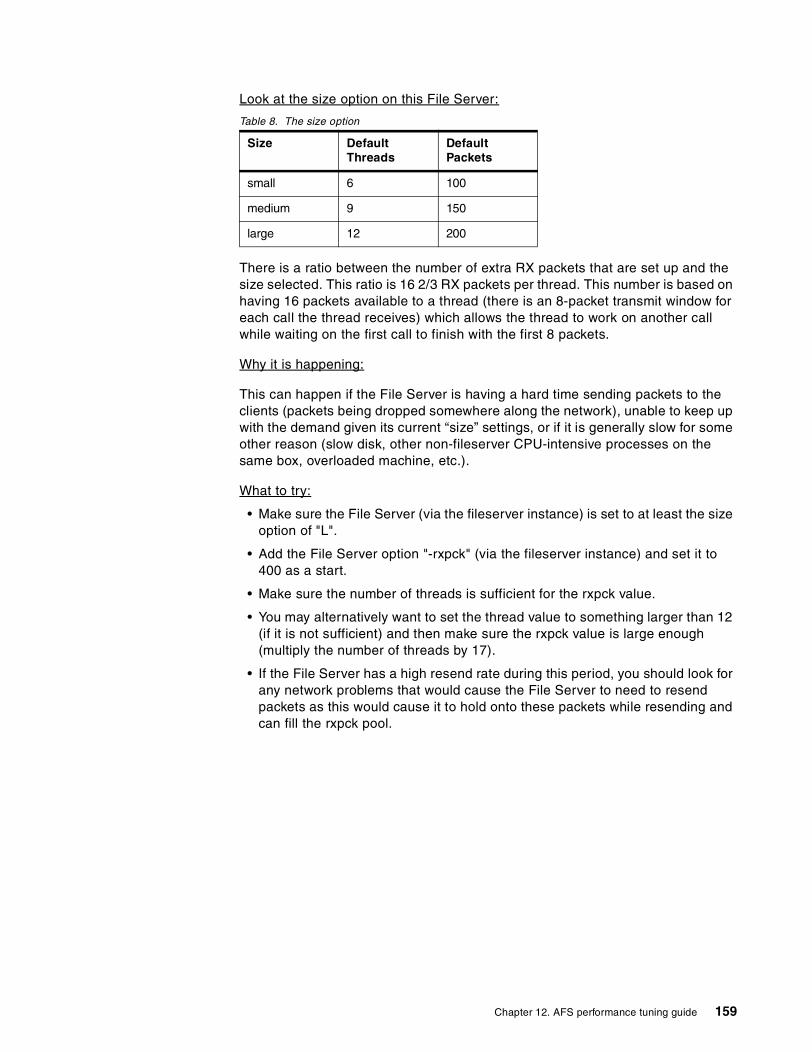
Look at the size option on this File Server:
Table 8. The size option
There is a ratio between the number of extra RX packets that are set up and thesize selected. This ratio is 16 2/3 RX packets per thread. This number is based onhaving 16 packets available to a thread (there is an 8-packet transmit window foreach call the thread receives) which allows the thread to work on another callwhile waiting on the first call to finish with the first 8 packets.
Why it is happening:
This can happen if the File Server is having a hard time sending packets to theclients (packets being dropped somewhere along the network), unable to keep upwith the demand given its current “size” settings, or if it is generally slow for someother reason (slow disk, other non-fileserver CPU-intensive processes on thesame box, overloaded machine, etc.).
What to try:
• Make sure the File Server (via the fileserver instance) is set to at least the sizeoption of "L".
• Add the File Server option "-rxpck" (via the fileserver instance) and set it to400 as a start.
• Make sure the number of threads is sufficient for the rxpck value.
• You may alternatively want to set the thread value to something larger than 12(if it is not sufficient) and then make sure the rxpck value is large enough(multiply the number of threads by 17).
• If the File Server has a high resend rate during this period, you should look forany network problems that would cause the File Server to need to resendpackets as this would cause it to hold onto these packets while resending andcan fill the rxpck pool.
Size DefaultThreads
DefaultPackets
small 6 100
medium 9 150
large 12 200
Chapter 12. AFS performance tuning guide 159

12.8 Debugging tools and example output
12.8.1 RXDEBUG incorporated in the meltdown scriptThe following is commonly (albeit somewhat incorrectly) referred to as the“meltdown script”. It utilizes the RXDEBUG diagnostic tool and formats the outputin an easy-to-read table. It is suggested that you use this script as a monitoringtool when you:
• Perceive less than optimal performance on a File Server machine
• Experience rapid cell growth in terms of users and/or activity
• Are interested whether the File Server is reaching load capacity under itscurrent configuration
The output from this script can help you determine if tuning changes are neededfor a particular File Server machine due to usage and load variants (for example,large builds), or if the machine is in the process of melting down and unable torecover.
• "-rxpck N" increases the size of the fileserver process by about 1650 * Nbytes.
• Q. When adding the "-rxpck" switch to the fileserver process, does thisindicate the absolute number of RX packets for the fileserver process, or isit added on to an existing amount determined by the fileserver size switch?In other words, does adding "-rxpck 400" to a “large” fileserver processmean that it now has space for 400 RX packets, or is it 400 + ?? RX packets(the ?? is a number initially allocated to the fileserver process by the sizeswitch).
• A. The fileserver code adds 16 2/3 packets per thread. RX itself adds 18packets for each server thread started. So, there are two things to be awareof:
1. If more threads are explicitly started in the fileserver process usingthe “-p” option, make sure that “-rxpck” is used and is at least 16 2/3times the number of threads.
2. -rxpck governs how big the RX packet pool is. Aside from the callscurrently being handled, packets are used to hold data for pendingcalls and for finishing up previous replies. Increasing this valueallows the fileserver process to hold onto data for calls not yetprocessed. This can help in meltdown or overload situations if thecurrently running threads do not have all the data they need to finishthe call. Or if there is a slow or busy network where re-sending thepackets to a busy File Server only tends to slow things down evenfurther. In any of these cases, if the “nobufs” values from RXDEBUGare non-zero and increasing, and the File Server is not slow as aresult of disk contention, increasing the number of RX packets islikely useful.
Note
160 WebSphere V3 Performance Tuning Guide

Figure 109. The meltdown script
The following is sample output during a File Server meltdown, which is aworst-case scenario wherein the File Server is unable to keep up with incomingrequests to such a point that it eventually is unable to recover at all. Notice thatthe nobufs number (a cumulative count) is increasing, the number of calls isstaying the same, data is staying the same or not growing, and wproc (waiting forprocess) is growing.
The following is sample output from a File Server that had a load spike at somepoint, but was able to recover and is now operating normally. Notice that thenobufs number is non-zero but not changing and the number of calls isincreasing, however the wproc value is 0.
#!/bin/ksh#
servername=$1
echo ""echo Server $servernameecho "wproc nobufs wpack free pack calls dataresends"while [ 1 ] ; do/usr/afsws/etc/rxdebug $servername 7000 -rxstats | \
awk ' BEGIN { wproc = 0; wpack = 0; fpack = 0; calls =0; data =0; resends = 0; nobufs = 0} \
/waiting_for_process/ {wproc++} \/wait_packet/ {wpack++} \/Free packets/ {fpack = $3; calls = $8} \/other send counters/ {data = $7; resends = $11} \/noBuffers/ {nobufs = $12} \END {printf "%5d %8d %6d %11d %7d %10d %13d\n", wproc,
nobufs, wpack, fpack, \ calls, data, resends } 'sleep 3done
# END { print " ", wproc, " ", nobufs, " ", wpack, " ",fpack, " ", calls, " ", data, " ", \ resends }
wproc nobufs wpack fpack calls data resends272 5742, 0 74, 814081, 1134776 25810,272 5920, 0 74, 814081, 1134776 25810,278 7297, 0 74, 814081, 1134776 25810,278 7578, 0 74, 814081, 1134776 25810,281 8933, 0 74, 814081, 1134776 25810,284 9242, 0 74, 814081, 1134776 25810,
wproc nobufs wpack fpack calls data resends0 5265, 0 182, 1501650, 1661183 53199,0 5265, 0 182, 1501657, 1661192 53200,0 5265, 0 184, 1501659, 1661193 53201,
Chapter 12. AFS performance tuning guide 161

12.8.2 tcpdumptcpdump is a useful tool for monitoring networks and decoding protocols when yoususpect communications-related problems between client and server. Somepossible command lines could be:
./tcpdump -w <outfile> -s 150 host <hostname> and port 7000
./tcpdump -w <outfile> -s 150 host <hostname> and host <hostname2>
./tcpdump -w <outfile> -s 150 host <hostname>
We show you the tool syntax and usage as follows:
• The <outfile> should be located in local disk space rather than AFS. This isespecially true when you are trying to isolate a communications problembetween client and server.
• The -s refers to the snap length. This allows us to pick up the first 150 bytes ofthe UDP packet.
• The port is optional, but if used will most likely be 7000 (fileserver) or 7001(client).
• tcpdump should not be run on the source or destination machines.
• tcpdump should be run on the piece of wire that the host is sitting on.
• If there are two wires between the fileserver and client, then run tcpdump onboth wires to allow us to see if packets are being dropped in between the two.
• tcpdump usually doesn't work well on a switched hub - you don't get the packetsthat are going between other machines. In those instances, you may want totry running it on the machine that you're trying to sniff. Or try "snoop" if you areworking with Solaris.
• If it's not Solaris and you're unable to obtain a tcpdump, you can alternativelyperform a kdump on the client while you have a call that's failing in progress.While this is limited information, it can sometimes point to the problem.
• If you suspect an issue involving jumbograms (for example, Scenario #2), it’sbest to not filter on the port number at all as this will filter out the fragments ofthe jumbograms.
To read the raw tcpdump output file that is created, use the same tcpdump
command with the -r switch on the outfile. You can also add filters to thiscommand to narrow the scope of the output you are studying:
./tcpdump -r <outfile>
./tcpdump -r <outfile> host <hostname> and port 7000
./tcpdump -r <outfile> host <hostname> and host <hostname2>
./tcpdump -r <outfile> host <hostname>
162 WebSphere V3 Performance Tuning Guide

Figure 110. tcpdump output
Table 9. tcpdump output descriptions
Field No. Description
1 Timestamp
2 Host name and process (in this example, .cm means cachemanager), connection ID and call number.
3 The “<” or “>” indicates the direction in which the packet istraveling.
4 Host name and port designator (in this example, fs meansfileserver), the connection ID and call number are identicalat both ends of a connection.
5 Packet sequence number on the call, and serial number.Retransmitted packets will have the same sequencenumber, but different serial numbers.
6 Holds values of “data”, “ack”, “busy”, or “abort” andindicates what this packet is.
7 Flags indicating:
C = Packet originated at the RPC’s client.
A = Acknowledgement requested.
M = More data packets to follow.
L = Last data packet in this series.
8 The size of the data in bytes.
9 This field may or may not exist in your tcpdump trace. In thisexample, the “DF” means “Don’t Fragment” and is set byMTU discovery.
11:24:12.044201 client1.transarc.com.cm.7b5de95c.0001 > fileserver1.transarc.com.fs: 1.0006 data .... 1444 (DF)11:24:12.047017 client1.transarc.com.cm.7b5de95c.0000 < fileserver1.transarc.com.fs: 2.0007 data .A.. 1444 (DF)11:24:12.047881 client1.transarc.com.cm.7b5de95c.0000 < fileserver1.transarc.com.fs: 3.0008 data .... 1444 (DF)11:24:15.045200 client1.transarc.com.cm.7b5de95c.0001 < fileserver1.transarc.com.fs: 4.0009 data .A.. 1444 (DF)11:24:18.305831 client1.transarc.com.cm.7b5de95c.0001 < fileserver1.transarc.com.fs: 5.000a data .... 1444 (DF)11:24:20.422469 client1.transarc.com.cm.7b5de95c.0001 > fileserver1.transarc.com.fs: 2.0000 ack 2 (DF)11:24:20.424691 client1.transarc.com.cm.7b5de95c.0001 < fileserver1.transarc.com.fs: 6.000b data .A.. 1444 (DF)11:24:20.426924 client1.transarc.com.cm.7b5de95c.0001 < fileserver1.transarc.com.fs: 7.000c data .... 1444 (DF)11:24:20.428027 client1.transarc.com.cm.7b5de95c.0001 < fileserver1.transarc.com.fs: 8.000d data .A.. 1444 (DF)11:24:20.429147 client1.transarc.com.cm.7b5de95c.0001 < fileserver1.transarc.com.fs: 9.000e data .... 1448 (DF)11:24:20.430624 client1.transarc.com.cm.7b5de95c.0001 > fileserver1.transarc.com.fs: 4.0000 ack 4 (DF)11:24:20.431472 client1.transarc.com.cm.7b5de95c.0001 < fileserver1.transarc.com.fs: a.000f data .A.. 1448 (DF)11:24:20.431651 client1.transarc.com.cm.7b5de95c.0001 < fileserver1.transarc.com.fs: b.0010 data .... 1448 (DF)11:24:20.431927 client1.transarc.com.cm.7b5de95c.0001 > fileserver1.transarc.com.fs: 6.0000 ack 6 (DF)11:24:20.432221 client1.transarc.com.cm.7b5de95c.0001 < fileserver1.transarc.com.fs: c.0011 data .A.. 1448 (DF)11:24:20.432687 client1.transarc.com.cm.7b5de95c.0001 < fileserver1.transarc.com.fs: d.0012 data .... 1448 (DF)11:24:20.433101 client1.transarc.com.cm.7b5de95c.0001 > fileserver1.transarc.com.fs: 8.0000 ack 8 (DF)11:24:20.433533 client1.transarc.com.cm.7b5de95c.0001 < fileserver1.transarc.com.fs: e.0013 data .A.. 1448 (DF)11:24:20.436192 client1.transarc.com.cm.7b5de95c.0001 < fileserver1.transarc.com.fs: f.0014 data ..L. 244 (DF)11:24:20.437001 client1.transarc.com.cm.7b5de95c.0001 < fileserver1.transarc.com.fs: 9.0015 data .A.. 1448 (DF)11:24:20.437443 client1.transarc.com.cm.7b5de95c.0001 < fileserver1.transarc.com.fs: a.0016 data .A.M 1448 (DF)11:24:20.439192 client1.transarc.com.cm.7b5de95c.0001 < fileserver1.transarc.com.fs: b.0017 data .A.. 1448 (DF)11:24:20.440298 client1.transarc.com.cm.7b5de95c.0001 < fileserver1.transarc.com.fs: c.0018 data .A.M 1448 (DF)
Chapter 12. AFS performance tuning guide 163

12.8.3 netstatnetstat output varies in format and field names depending upon the platform onwhich it is run. For this example, we look at the output from a SunOS 5.5machine. If we were debugging Scenario #3, we would concentrate on the UDPsection and specifically on the udpInOverflows field. The command we issue is:
./netstat -s
The following is a sample output of the command:
UDPudpInDatagrams =2954751 udpInErrors = 0udpOutDatagrams =5738548
TCPtcpRtoAlgorithm = 4 tcpRtoMin = 200tcpRtoMax = 60000 tcpMaxConn = -1tcpActiveOpens = 20974 tcpPassiveOpens = 179tcpAttemptFails = 19 tcpEstabResets = 9tcpCurrEstab = 5 tcpOutSegs =637145tcpOutDataSegs =544819 tcpOutDataBytes =200221356tcpRetransSegs = 22034 tcpRetransBytes =212746tcpOutAck = 92316 tcpOutAckDelayed = 47300tcpOutUrg = 46 tcpOutWinUpdate = 0tcpOutWinProbe = 0 tcpOutControl = 42303tcpOutRsts = 23 tcpOutFastRetrans = 14tcpInSegs =622151tcpInAckSegs =504560 tcpInAckBytes =200242345tcpInDupAck = 42609 tcpInAckUnsent = 0tcpInInorderSegs =299043 tcpInInorderBytes =38379387tcpInUnorderSegs = 0 tcpInUnorderBytes = 0tcpInDupSegs = 0 tcpInDupBytes = 0tcpInPartDupSegs = 0 tcpInPartDupBytes = 0tcpInPastWinSegs = 0 tcpInPastWinBytes = 0tcpInWinProbe = 0 tcpInWinUpdate = 0tcpInClosed = 5 tcpRttNoUpdate = 811tcpRttUpdate = 39477 tcpTimRetrans = 1248tcpTimRetransDrop = 3 tcpTimKeepalive = 450tcpTimKeepaliveProbe= 342 tcpTimKeepaliveDrop = 0
IPipForwarding = 2 ipDefaultTTL = 255ipInReceives =5457657 ipInHdrErrors = 0ipInAddrErrors = 0 ipInCksumErrs = 0ipForwDatagrams = 0 ipInForwProhibits = 0ipInUnknownProtos = 27624 ipInDiscards = 0ipInDelivers =5154339 ipOutRequests =6401650ipOutDiscards = 0 ipOutNoRoutes = 0ipReasmTimeout = 60 ipReasmReqds = 15914ipReasmOKs = 15914 ipReasmFails = 0ipReasmDuplicates = 0 ipReasmPartDups = 0ipFragOKs = 4232 ipFragFails = 0ipFragCreates = 9525 ipRoutingDiscards = 0tcpInErrs = 0 udpNoPorts =246892udpInCksumErrs = 0 udpInOverflows = 1rawipInOverflows = 0
ICMPicmpInMsgs = 1239 icmpInErrors = 0icmpInCksumErrs = 0 icmpInUnknowns = 0
164 WebSphere V3 Performance Tuning Guide

icmpInDestUnreachs = 1221 icmpInTimeExcds = 9icmpInParmProbs = 0 icmpInSrcQuenchs = 0icmpInRedirects = 0 icmpInBadRedirects = 0icmpInEchos = 7 icmpInEchoReps = 2icmpInTimestamps = 0 icmpInTimestampReps = 0icmpInAddrMasks = 0 icmpInAddrMaskReps = 0icmpInFragNeeded = 0 icmpOutMsgs = 208icmpOutDrops = 27623 icmpOutErrors = 0icmpOutDestUnreachs = 201 icmpOutTimeExcds = 0icmpOutParmProbs = 0 icmpOutSrcQuenchs = 0icmpOutRedirects = 0 icmpOutEchos = 0icmpOutEchoReps = 7 icmpOutTimestamps = 0icmpOutTimestampReps= 0 icmpOutAddrMasks = 0icmpOutAddrMaskReps = 0 icmpOutFragNeeded = 0icmpInOverflows = 0
IGMP:0 messages received0 messages received with too few bytes0 messages received with bad checksum0 membership queries received0 membership queries received with invalid field(s)0 membership reports received0 membership reports received with invalid field(s)0 membership reports received for groups to which we belong0 membership reports sent
From the above example, we see that the UDP buffer on this File Serveroverflowed once, resulting in one dropped packet which had to be resent by theclient. A higher value in this field would help point to an ongoing problem in thisarea and suggest that the udpsize option on the File Server be used.
12.9 Summary
File Server tuning is a function that we recommend be performed on a somewhatconsistent basis with a new cell and then at minimum every time the cell’s usagepatterns or machines change. There are no specific rules to follow in determiningwhen exactly this function should be performed and it is expected that the AFSadministrator is familiar with the cell and will be able to make a judgement call inthis regard.
As we have outlined in this document, the overall tuning of the File Server is atwo-step process beginning with analysis of current conditions and subsequentchanges or additions to the parameters and switches available to the fileserverinstance. This tuning can be either proactive or reactive depending upon thecurrent conditions in your cell and will employ for the most part the samedata-gathering techniques and analysis outlined here.
Use this document as a guide to help you better understand your cell and theloads placed on the File Servers within it. Please keep in mind that this documentis intended to provide guidance and as such will not necessarily solve everyproblem or need you encounter. If you experience questions or problems that thisguide does not answer, please contact AFS technical support for furtherassistance.
Chapter 12. AFS performance tuning guide 165

166 WebSphere V3 Performance Tuning Guide

Appendix A. TCP/IP overview and tuning
In this appendix, we give an overview of the TCP/IP and performance tuningpoints.
For more in depth knowledge on AIX performance tuning, we recommend thatyou read the AIX Performance Tuning Guide, SR28-5930 and RS/6000 SPSystem Performance Tuning, SG24-5340.
A.1 TCP/IP overview
Before we discuss AIX TCP/IP network tuning, we should get a generalunderstanding of how the different layers of the TCP/IP protocol stack interact.
TCP/IP consists of several communication layers. There are parameters thatimpact the different protocol layers. They can best be understood by breakingthem down into categories:
• The no parameters are the initial network options that affect TCP, UDP and IPand are independent to the adapter type.
• The MTU, or maximum transmission unit, is the largest possible packet sizethat can be sent on a specific physical medium (Ethernet, token-ring, SPswitch, and so on).
• The adapter queues specify the number of packets that can be queued on aspecific adapter while it is sending or receiving data. These are specific to anadapter even if there are other adapters of the same type.
For a review of the TCP/IP layer model and to clarify the interrelationships, let’sbreak this down further, step by step:
1. An application performs a write request. Data is copied from the application’sworking buffer to the socket send buffer.
2. The socket layer passes the data to TCP or UDP.
3. For remote networks, if the data is larger than the maximum segment size(MSS), TCP breaks the data into fragments that comply with the MSS.
4. For local networks, if the data is larger than the MTU, TCP breaks the datainto fragments that comply with the MTU.
5. UDP leaves the fragmentation to the IP layer.
6. The interface layer makes sure that no packet exceeds the MTU.
7. The packets are then placed on the adapter output queue, and transmitted tothe receiving system.
8. The receiving host places the incoming packets on the adapter’s receivequeue. They are then passed up to the IP layer.
9. The IP layer then determines if any fragmentation has taken place due to theMTU. If so, it puts the fragments back to their original form and passes thepackets to TCP or UDP.
10.TCP reassembles the original segments and puts them on the socket receivebuffer in kernel memory or UDP passes the data on to the socket receivebuffer in kernel memory.
© Copyright IBM Corp. 1999 167

11.The application’s read request causes the appropriate data to be copied fromthe socket receive buffer to the buffer in the application’s working area.
Figure 111. TCP/UDP/IP data flow
There are many parameters that can affect your network performance.
At the device driver layer you have your transmit queue size marked by theparameters xmt_que_size. You also have your receive queue size marked byrec_que_size.
At the interface layer you have enforcement of the MTU or segment size as itpertains to what type of network media is being used, Ethernet, token-ring, orothers.
At the transport layer your performance parameters are set by tcp/udpsend/recvspace.
You also have the socket layer, between the transport and application layers, theparameter sb_max, which determines the maximum amount of memory or mbufspace that can be used by TCP or UDP for socket buffers for each socket.
Lastly, the parameters listed above all impact system memory. thewall parameterdetermines the maximum amount of buffer space that can be used across theentire communication subsystems.
Now, we will discuss these in more detail.
Socket Layer(Subsyteme.g. NFS, DFS
Application
TCP orUDPLayer
IP InputQueue
SE
ND
ING
RE
CE
IVIN
G
IP Layer
DEVICEDRIVER
ADAPTERMTU
DMA
MTU
DMA
Media
IF LayerMTU Enforcement
MTU Compliance
Socket SendBuffer
Socket ReceiveBuffer
TCPUDP TCP UDP(MTU Compliance)
ReceiveQueue
TransmitQueue
mbufs
mbuf mbuf
User space
System space
DatagramsStream
SendBuffer
ReadBuffer
copy copy
168 WebSphere V3 Performance Tuning Guide

A.2 Maximum Transmission Unit (MTU)
The Maximum Transmission Unit (MTU) specifies the maximum size of packets(including all the protocol headers) that can be transmitted on a network. For anoverview see Figure 116 on page 175. All systems on the same physical networkmust have the same MTU. The MTU can be displayed using the netstat -i
command. Table 10 on page 169 gives an overview of common network adaptersand their related MTU sizes.
The MTU value can be changed per adapter using the ifconfig command or viaSMIT. Because all systems on the same physical network should have the sameMTU, any changes made should be made simultaneously. The change is effectiveacross system boots.
Table 10. Maximum Transmission Units
A.3 Adapter queue size
There is a fixed number of adapter queue slots to stage packets in each networkadapter device driver for traffic to that network. The transmit adapter queuelength specifies the maximum number of packets for the adapter. The send andreceive pools are separate buffer pools as shown in Figure 112 on page 170.
If the adapter queue size is exceeded, subsequent packets are discarded by theadapter device driver, resulting in dropped packets. This results in a transmit timeout in the TCP layer, which leads to a rollback of the TCP window and theresending of data. For UDP the result is lost packets.
Adapter queue overflows can be detected by looking at the errors logged in theadapter counters as "S/W Transmit Queue Overflows". For Ethernet, token ring,FDDI and ATM the adapter statistics can be seen by using the entstat, tokstat,fddistat and atmstat commands respectibelly.
Most communication drivers provide a set of tunable parameters to controltransmit and receive resources. These parameters typically control the transmitqueue and receive queue limits, but may also control the number and size ofbuffers or other resources. They limit the number of buffers or packets that maybe queued for transmit or limit the number of receive buffers that are available forreceiving packets. For an example see Table 11 and Table 12 on page 170. Theseparameters can be tuned to ensure enough queueing at the adapter level tohandle the peak loads generated by the system or the network.
Network Type Default MTU Maximum MTU Optimal
Ethernet 1500 1500 1500
Token Ring 1492 17284 4096
FDDI 4352 4352 4352
ATM 9180 65530 9180
Gigabit Ethernet 9000 9000
Appendix A. TCP/IP overview and tuning 169

Figure 112. Adapter queue overview
Table 11. Transmit queue size examples: MCA
Table 12. Transmit queue size examples: PCI
A.3.1 Transmit and receive queues
For transmit, the device drivers may provide a "transmit queue" limit. There maybe both hardware queue and software queue limits, depending on the driver andadapter. Some drivers have only a hardware queue, some have both hardwareand software queues. Some drivers control the hardware queue internally and
Adapter Default Range
Ethernet 512 20 - 2048
10/100 Ethernet 64 16, 32, 64, 128, 256
Token Ring 99 or 512 32 - 2048
FDDI 512 3 - 2048
ATM/155 ATM 512 0 - 2048
Adapter Default Range
Ethernet 64 16, 32, 64, 128, 256
10/100 Ethernet 256 - 512 16, 32, 64, 128, 256
Token Ring 96 - 512 32 - 2048
FDDI 30 3 - 250
155 ATM 100 0 - 4096
ADAPTER
Network
TransmitQueue
ReceiveQueue
Memory
Node
Memory
170 WebSphere V3 Performance Tuning Guide

only allow the software queue limits to be modified. Generally, the device driverwill queue a transmit packet directly to the adapter hardware queue. If the systemCPU is fast relative to the speed of the network, or on an SMP system, thesystem may produce transmit packets faster than they can be transmitted on thenetwork. This will cause the hardware queue to fill. Once the hardware queue isfull, some drivers provide a software queue and subsequent packages will bequeued to it. If the software transmit queue limit is reached, then the transmitpackets are discarded. This can affect performance because the upper levelprotocols must then retransmit the discarded packets.
A typical example would be that you set your adapter queue length to 30.Assuming that the MTU of that adapter is 1500, you have set the maximumamount of data which that adapter can hold to 45,000 bytes. Figure 113 illustratesthe different MTU ratios. If you try and stage more packets to an adapter, then thepackets that arrive when this queue is full get thrown away.
Receive queues are the same as transmit hardware queues.
Figure 113. MTU ratio
A.3.2 Adapter queue settings
To show the adapter configuration settings, you can use the lsattr command orSMIT. For example, to display the default values of the settings, you can use thecommand:
lsattr -D -l <adapter - name>
and to display the current values, you can use:
lsattr -E -l <adapter - name>
Finally, to display the range of legal values of an attribute (for example,xmt_que_size) for a given adapter (for example, Token Ring), you can use thecommand:
lsattr -R -l tok0 -a xmt_que_size
Different adapters have different names for these variables. For example, theymay be named sw_txq_size, tx_que_size, xmt_que_size to name a few for thetransmit queue parameter. The receive queue size and/or receive buffer pool
NetworkType
MaximumMTU
Ratio toEthernet
Ethernet
FDDI
TokenRing
1500
4352
17284
1
2.9
11.5
Appendix A. TCP/IP overview and tuning 171

parameters may be named rec_que_size, rx_que_size, or rv_buf4k_min, forexample.
The easiest way to change the adapter settings is by using SMIT. The othermethod is to use the chdev command.
For example, to change tx_que_size on en0 to 1024, use the following sequence ofcommands. Note that this driver only supports four different sizes, so it is betterto use SMIT to see the valid values.
ifconfig en0 detach
chdev -1 ent0 -a tx_que_size=1024
ifconfig en0 up
A.3.3 Adapter tuning recommendations
If you consistently see output errors when running the netstat -i command,increasing the size of the xmt_que_size parameter may help. Check also theadapter transmit average overflow count. As a rule of thumb, always setxmt_que_size to the maximum.
One way to tune IP to prevent exceeding the adapter queue size is to reduce theaggregate TCP window size or udp_sendspace so that it is less than the transmitqueue size times the segment size (MTU) on the network. This usually results inoptimal throughput and slightly higher system overhead for network traffic. Ifmultiple connections are sharing an adapter at the same time, the aggregate TCPwindow size across all connections should be slightly less than the transmitqueue size times the segment size for the network media type.
A.4 TCP maximum segment size (MSS)
The TCP protocol includes a mechanism for both ends of a connection tonegotiate the maximum segment size (MSS) to be used over the connection. Inother words, the MSS is the largest segment or “chunk” of data that TCP will sendto a destination. Each end uses the Options field in the TCP header to advertise aproposed MSS. The MSS that is chosen is the smaller of the values provided bythe two ends.
The purpose of this negotiation is to avoid the delays and throughput reductionscaused by fragmentation of the packets when they pass through routers orgateways and reassembly at the destination host.
The value of MSS advertised by the TCP software during connection setupdepends on whether the other end is a local system on the same physicalnetwork (that is, the systems have the same network number) or whether it is ona different, remote, network.
A.4.1 Subnetting and the subnetsarelocal
Several physical networks can be made to share the same network number bysubnetting. The easiest way to understand subnet addressing is to imagine that asite has a single class B IP network assigned to it, but has two or more physicalnetworks. Only local routers know that there are multiple physical nets and how toroute among them.
172 WebSphere V3 Performance Tuning Guide

Conceptually, adding subnets only changes the interpretation of the IP addressslightly. Instead of dividing the 32-bit IP address into a network prefix and a hostsuffix, subnetting divides the address into a network portion and a local portion.The interpretation of the network portion remains the same as for networks thatdo not use subnetting. The interpretation of the local portion is left up to the site.
The example in Figure 114 shows subnet addressing with a class B address thathas a 2-octet internet portion and 2-octet local portion. In the example one octetof the local portion identifies a physical network and the other octet identifies ahost on that network.
Figure 114. Subnet addressing
In AIX the no option subnetsarelocal specifies, on a system-wide basis, whethersubnets are to be considered local or remote networks. With subnetsarelocal=1(the default), Host A on subnet 1 considers Host B on subnet 2 to be on the samephysical network.
The consequence of this is that when Host A and Host B establish a connection,they negotiate the MSS, assuming they are on the same network. Each hostadvertises an MSS based on the MTU of its network interface. This usually leadsto an optimal MSS being chosen.
This approach has several advantages:
• It does not disable or override the TCP MSS negotiation, so that smalldifferences in the MTU between adjacent subnets can be handledappropriately.
• In order for small differences between adjacent subnets in the MTU to behandled appropriately, it does not disable or override the TCP MSSnegotiation.
Figure 116 on page 175 shows the relations between MSS and MTU. The valueof MSS is determined as follows:
1. If the destination is local, that is, if the network ID and the subnet ID of thedestination IP address are the same as the local ones, then the MSS value iscalculated based on the MTU value of the outgoing interface, as follows:
MSS = MTU - (20 + 20)if rfc1323 = 0
MSS = MTU - (20 + 20 + 12)if rfc1323 = 1
since the TCP header is 20 bytes, and the IP header is also 20 bytes long.Furthermore, enabling rfc1323 costs an additional 12 bytes.
localpart
Internetpart
physicalnetwork
hostInternet
part
Appendix A. TCP/IP overview and tuning 173

2. If the destination address is remote, that is, if the network ID of the destinationIP address is different from the local one, then TCP uses a global variable thatdetermines the MSS.
3. If the destination has the same network ID as the local one but with a differentsubnet ID, then the destination could be either local or remote. The no optionof subnetsarelocal lets you specify whether subnets on the same network arelocal or remote. If local, you would follow item (1) above. If remote, you wouldfollow item (2) above.
Since segmentation occurs at the TCP level, if the total packet is less than theMTU, then IP does not do anything to the packet other than preappend a headerand send the data to the interface layer. TCP on the receiving side willreassemble the packet in the correct sequence and deliver the data to theapplication. Figure 115 illustrates this.
Figure 115. Inter-subnet fragmentation
In this scenario, Hosts A and B would establish a connection based on a commonMTU of 4352. A packet going from A to B would be fragmented by Router 1 anddefragmented by Router 2, and the reverse would occur going from B to A.Source and destination must both consider subnets to be local.
A.4.2 TCP data flow
TCP breaks the data into smaller pieces called segments to comply with theMSS. See also Figure 116 on page 175. The resulting IP datagram is 40 or 52bytes larger: 20 bytes for the IP header and 20 bytes for the TCP header and anoptional 12 bytes for rfc1323.
When a connection is established, each end has the option of announcing thetcp_sendspace it is willing to receive depending upon its buffer space. Since themoving-window technique requires that the two systems be able to buffer thesame amount of data, the effective window size is set to the lesser value in bothdirections. The nominally available extra space for buffering output shown inFigure 117 on page 175 is never used.
Host A Host B
FDDI FDDIEthernet
MTU=4352 MTU=4352MTU=1500
Router 1 Router 2
174 WebSphere V3 Performance Tuning Guide

Figure 116. TCP data flow
Figure 117. TCP window size
In general, the larger the MSS the better, as long as it is not so large that itcauses fragmentation at the IP layer.
A.5 TCP sliding window
TCP enforces flow control of data from the sender to the receiver through amechanism referred to as sliding window. This helps ensure delivery to areceiving application. The size of the window is defined by the tcp_sendspaceand tcp_recvspace values.
The window is the maximum amount of data that a sender can send withoutreceiving any ACK segment. This obviously contributes to performanceimprovement. A receiver always advertises its window size in the TCP header ofthe ACK segments.
MTU
DATA
TCP DATATCP TCP
TCPIP IP DATATCP IP TCP
TCPIPLINK LINK IP DATATCP LINK IP TCP
MSS
MTUMTU MTU
MTU=XXX MTU=YYY
tcp_mssdflt=min(XXX,YYY)Default: 512 bytes
for addresses that match the local network mask
if (subnetsarelocal)use MTU
orif not (subnetsarelocal)
use tcp_mssdfltor
if not (tcp_pmtu_discover)probe max packet size
tcp_sendspace
Initiator
tcp_recvspace
Maximumwindowsize
Listener
tcp_recvspace tcp_sendspace
Unused
Appendix A. TCP/IP overview and tuning 175

In the example in Figure 118, the sending application is sleeping because it hasattempted to write data that would cause TCP to exceed the send socket bufferspace (that is, tcp_sendspace). The sending TCP has sent the last part of rec5,all of rec6 and rec7, and the beginning of rec8. The receiving TCP has not yetreceived the last part of rec7 or any of rec8.
Figure 118. TCP sliding window
The receiving application got rec4 and the beginning of rec5 when it last read thesocket, and it is now processing that data. When the receiving application nextreads the socket, it will receive (assuming a large enough read), the rest of rec5,rec6, and as much of rec7 and rec8 as has arrived by that time.
In the course of establishing a session, the initiator and the listener converse todetermine their respective capacities for buffering input and output data. Thesmaller of the two sizes defines the size of the effective window. As data is writtento the socket, it is moved into the sender’s buffer. When the receiver indicatesthat it has space available, the sender transmits enough data to fill that space(assuming that it has that much data). It then informs the sender that the data hasbeen successfully delivered. Only then does the sender discard the data from itsown buffer, effectively moving the window to the right by the amount of datadelivered. If the window is full because the receiving application has fallenbehind, the sending thread will be blocked.
Nowadays we have a lot of high-speed network media and memory for aworkstation. The maximum of 64 KB for a window may not be big enough for suchan advanced environment. TCP has been enhanced to support such situations byRFC 1323, TCP Extensions for High Performance.
If the rfc1323 parameter is 1, the maximum TCP window size is 4 GB (instead of64 KB). Figure 119 on page 177 illustrates this TCP enhancement.
ec5 rec6 rec7 rec8
ec5 rec6 rec
Sender TCP
Receiver TCP
rec4 r...
Receiving Appl.(processing)
Available space for thedata that is in transit
Data Stream
UnacknowledgedData
AcknowledgedData Sending Appl.
(sleeping)
Transmit Window
Receive Window
176 WebSphere V3 Performance Tuning Guide
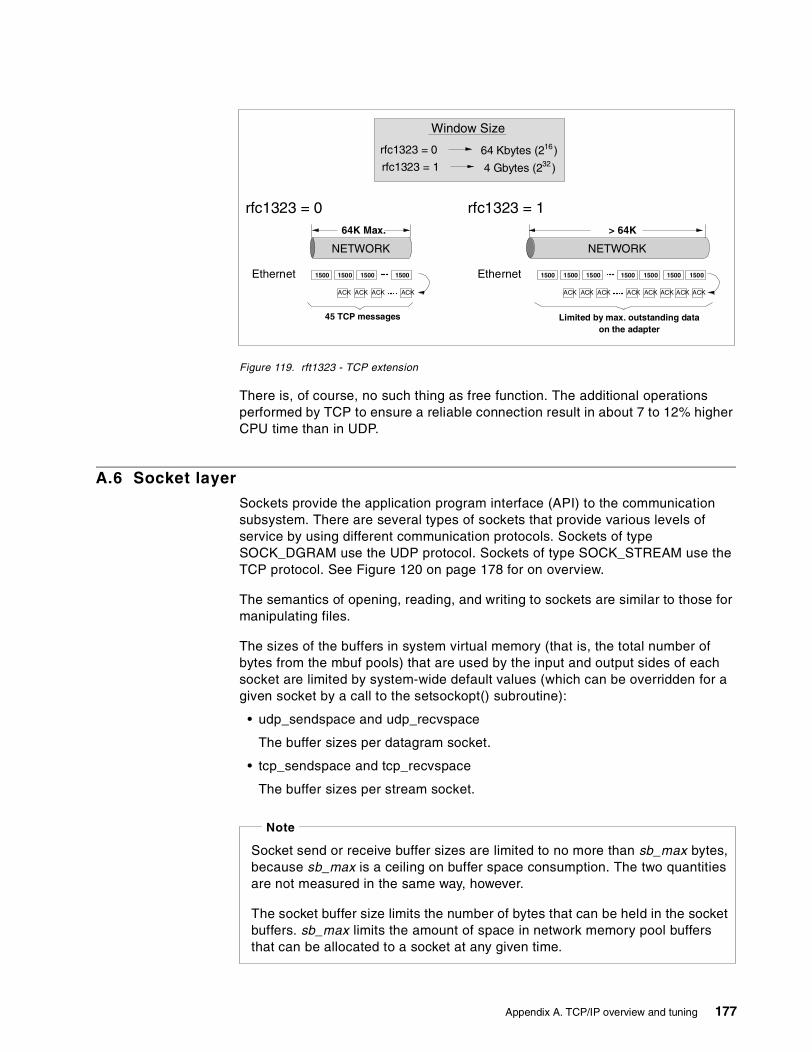
Figure 119. rft1323 - TCP extension
There is, of course, no such thing as free function. The additional operationsperformed by TCP to ensure a reliable connection result in about 7 to 12% higherCPU time than in UDP.
A.6 Socket layer
Sockets provide the application program interface (API) to the communicationsubsystem. There are several types of sockets that provide various levels ofservice by using different communication protocols. Sockets of typeSOCK_DGRAM use the UDP protocol. Sockets of type SOCK_STREAM use theTCP protocol. See Figure 120 on page 178 for on overview.
The semantics of opening, reading, and writing to sockets are similar to those formanipulating files.
The sizes of the buffers in system virtual memory (that is, the total number ofbytes from the mbuf pools) that are used by the input and output sides of eachsocket are limited by system-wide default values (which can be overridden for agiven socket by a call to the setsockopt() subroutine):
• udp_sendspace and udp_recvspace
The buffer sizes per datagram socket.
• tcp_sendspace and tcp_recvspace
The buffer sizes per stream socket.
Window Size
rfc1323 = 1 4 Gbytes (2 )32
rfc1323 = 0 64 Kbytes (2 )16
rfc1323 = 0
Ethernet
ACKACKACKACK
45 TCP messages
1500 1500 1500 1500
NETWORK
64K Max.
NETWORK
> 64K
Ethernet
ACKACKACKACK
Limited by max. outstanding dataon the adapter
1500 1500 1500 1500 1500 1500 1500
ACK ACK ACK ACK
rfc1323 = 1
Socket send or receive buffer sizes are limited to no more than sb_max bytes,because sb_max is a ceiling on buffer space consumption. The two quantitiesare not measured in the same way, however.
The socket buffer size limits the number of bytes that can be held in the socketbuffers. sb_max limits the amount of space in network memory pool buffersthat can be allocated to a socket at any given time.
Note
Appendix A. TCP/IP overview and tuning 177

Figure 120. Socket layer
A.7 Communication subsystem memory management
AIX can efficiently allocate and reclaim pinned (physical) memory within thecommunication subsystem. This is achieved through the use of mbufs andadditional buffers called clusters.
Use netstat -m to get on overview of cluster usage and to which subsystemsclusters are allocated. See Figure 121 on page 179 for an overview.
As you can see from the command output, each CPU in an SMP system has adedicated network memory pool. This is to improve performance by having poolsdedicated per CPU. This eliminates the need to look at mbuf pool access.
MTU
INTERFACELAYER
PROTOCOL LAYERS(TCP,UDP,IP,ICMP,IGMP)
SOCKETLAYER
APPLICATIONLAYER
FunctionCall
SOCKETQUEUES
PROTOCOL QUEUE(IP INPUT QUEUE)
INTERFACE QUEUES
Software Interrupt(Caused by Interface Layer)
Hardware Interrupt(Caused by Network Device)
HARDWARE LAYER
System Calls
178 WebSphere V3 Performance Tuning Guide
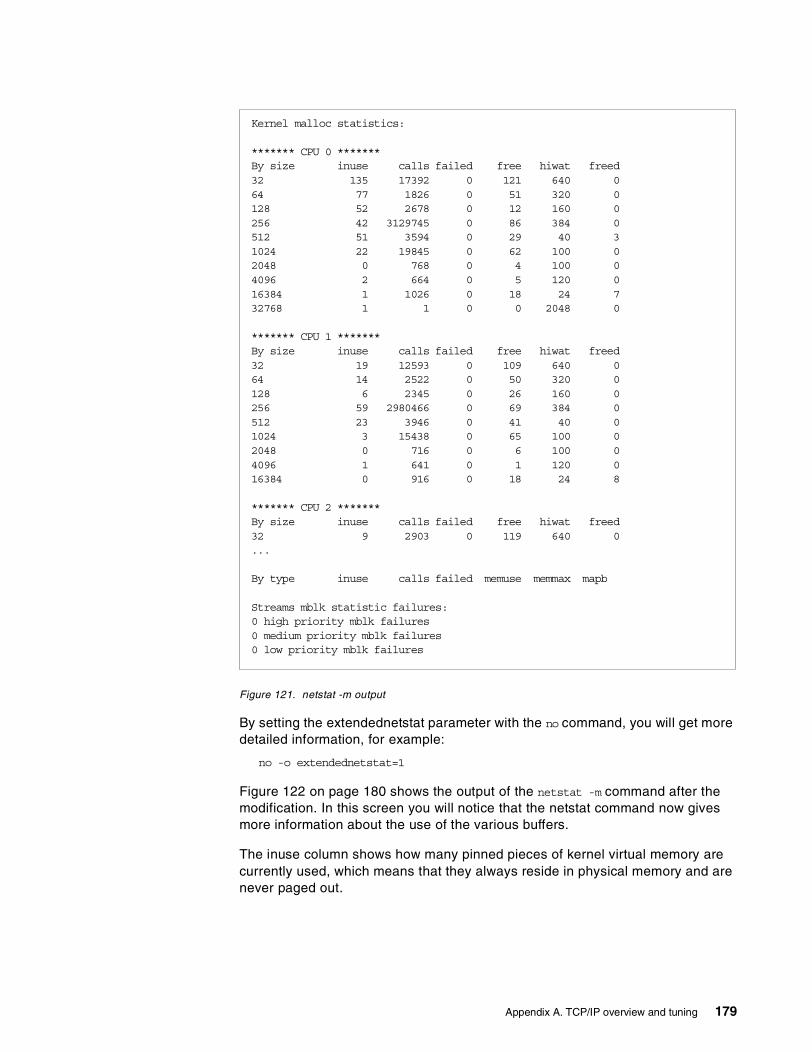
Figure 121. netstat -m output
By setting the extendednetstat parameter with the no command, you will get moredetailed information, for example:
no -o extendednetstat=1
Figure 122 on page 180 shows the output of the netstat -m command after themodification. In this screen you will notice that the netstat command now givesmore information about the use of the various buffers.
The inuse column shows how many pinned pieces of kernel virtual memory arecurrently used, which means that they always reside in physical memory and arenever paged out.
Kernel malloc statistics:
******* CPU 0 *******By size inuse calls failed free hiwat freed32 135 17392 0 121 640 064 77 1826 0 51 320 0128 52 2678 0 12 160 0256 42 3129745 0 86 384 0512 51 3594 0 29 40 31024 22 19845 0 62 100 02048 0 768 0 4 100 04096 2 664 0 5 120 016384 1 1026 0 18 24 732768 1 1 0 0 2048 0
******* CPU 1 *******By size inuse calls failed free hiwat freed32 19 12593 0 109 640 064 14 2522 0 50 320 0128 6 2345 0 26 160 0256 59 2980466 0 69 384 0512 23 3946 0 41 40 01024 3 15438 0 65 100 02048 0 716 0 6 100 04096 1 641 0 1 120 016384 0 916 0 18 24 8
******* CPU 2 *******By size inuse calls failed free hiwat freed32 9 2903 0 119 640 0...
By type inuse calls failed memuse memmax mapb
Streams mblk statistic failures:0 high priority mblk failures0 medium priority mblk failures0 low priority mblk failures
Appendix A. TCP/IP overview and tuning 179

Figure 122. netstat -m with extendednetstat=1
In addition to avoiding duplication, sharing the mbuf and cluster pools allows thevarious layers to pass pointers to one another, reducing mbuf management callsand copying of data.
The only network option used to tune the network maximum memory pool isthewall. Since the new scheme is self-tuning, there is no need to tune any otherparameter. If the system memory requirements exceed thewall, then it will start todrop packets.
Kernel malloc statistics:
******* CPU 0 *******By size inuse calls failed free hiwat freed32 135 17394 0 121 640 064 77 1827 0 51 320 0128 53 2760 0 11 160 0256 42 3130406 0 86 384 0512 51 3596 0 29 40 31024 22 19847 0 62 100 02048 0 768 0 4 100 04096 2 664 0 5 120 016384 1 1026 0 18 24 732768 1 1 0 0 2048 0
******* CPU 1 *******By size inuse calls failed free hiwat freed32 19 12598 0 109 640 064 14 2526 0 50 320 0...
By type inuse calls failed memuse memmax mapbmbuf 21 452 0 5376 10240 0socket 321 8 0 1348 1120 0pcb 728 4 0 78 128 0fragtbl 0 4 0 0 32 0...
Streams mblk statistic failures:0 high priority mblk failures0 medium priority mblk failures0 low priority mblk failures
180 WebSphere V3 Performance Tuning Guide

Figure 123. The network memory pool
A.8 Interface specific network options for AIX 4.3.3
Many AIX systems have multiple network interfaces combining traditional andhigh-speed TCP/IP interfaces on a single system. Up to Version 4.3.3, AIXprovides a single set of system-wide values, set using the no command, for thekey IP interface network tuning parameters making it impossible to tune a systemthat has widely differing network adapter interfaces.
As new high-speed (100 Mbps or more) network options became available, AIXsystem administrators learned these TCP/IP interfaces must be specially tuned toachieve good, high-speed performance.
So system administrators faced performance trade-off decisions; perhaps tuningfor one TCP/IP network interface while sacrificing performance on the other, orbalancing the two with options that were not totally suited for either interface type.Ideally, system administrators should be able to tune for each TCP/IP interfaceindividually for best performance. This feature is now included in AIX V 4.3.3.
Starting with Version 4.3.3 AIX offers a feature called Interface Specific NetworkOptions (ISNO) which allows IP network interfaces to be custom tuned for thebest performance. Values set for an individual interface take precedence over thesystem-wide values set with the network option (no) command. The feature isenabled (the default) or disabled for the whole system with the no command’suse_isno option. This single point ISNO disable option is included as a diagnostic
thewall
mbuf256 bytes
minimumcluster
32 bytes
mcluster16384 bytes
mcluster4096 bytes
Appendix A. TCP/IP overview and tuning 181

tool to eliminate potential tuning errors if the system administrator needs toisolate performance problems.
A.8.1 Implementation overview
The AIX V4.3.3 programmers and performance analysts should note that theISNO values will not show up in the socket; this means they cannot be read bygetsockopt() until after the TCP connection is made. The interface this socket willactually be using is not known until the connection is complete, so the socketreflects the system no defaults. Once the connection is accepted, ISNO valuesare put into the socket.
Five new parameters:
• rfc1323
• tcp_nodelay
• tcp_sendspace
• tcp_recvspace
• tcp_mssdflt
have been added for each supported network interface. When set for a specificinterface, these values override the corresponding no option values set for thesystem. These parameters are available for all of the mainstream TCP/IPinterfaces we checked -- token ring, FDDI, 10/100 Ethernet, and Gigabit Ethernet-- except the css# IP interface on the SP switch. As a simple workaround, SPswitch users can set the tuning options appropriate for the switch using thesystem-wide no command, then use the ISNOs to set the values needed for theother system interfaces.
A.8.2 How to use the new options
The five new ISNO parameters cannot be displayed or changed using SMIT. Hereare commands that can be used to first verify system and interface support andthen set and verify the new values.
1. Verify general system and interface support using the no and lsattr
commands.
Make sure the use_isno option is enabled using the following command or avariation:
$ no -a | grep isnouse_isno=1
Make sure the interface supports the five new ISNOs using the lsattr -El
command:
$ lsattr -E -l en0 -Hattribute value descriptionrfc1323 N/A
These options are set for the TCP/IP interface such as en0 or tr0 but not for thenetwork adapter interfaces such as ent0 or tok0.
Note
182 WebSphere V3 Performance Tuning Guide

tcp_nodelay N/Atcp_sendspace N/Atcp_recvspace N/Atcp_mssdflt N/A
2. Set the interface specific values, using either the ifconfig or chdev commands.The ifconfig command sets values temporarily so it is good for testing. Thechdev command alters the ODM, so custom values return after system reboots.
For example, to set the tcp_recvspace and tcp_sendspace to 64 KB and enabletcp_nodelay use one of the following methods:
$ ifconfig en0 tcp_recvspace 65536 tcp_sendspace 65536 tcp_nodelay 1$ chdev -l en0 -a tcp_recvspace=65536 -a tcp_sendspace=65536 -a \tcp_nodelay=1
Or, assuming the no command reports an rfc1323=1 global value, user rootcan turn rfc1323 off for all connections over en0 with the following commands:
$ ifconfig en0 rfc1323 0$ chdev -l en0 -a rfc1323=0
Verify the settings using the ifconfig or lsattr commands.
$ ifconfig en0en0:flags=e080863<UP,BROADCAST,NOTRAILERS,RUNNING,SIMPLEX,MULTICAST,GROUPRT,64BIT> inet 9.19.161.100 netmask 0xffffff00 broadcast 9.19.161.255tcp_sendspace 65536 tcp_recvspace 65536 tcp_nodelay 1 rfc1323 0$ lsattr -El en0rfc1323 0 N/A Truetcp_nodelay1 N/A Truetcp_sendspace65536 N/A Truetcp_recvspace65536 N/A Truetcp_mssdflt N/A True
A.8.3 References for the ISNO
More information about the interface specific network options (ISNO) can befound in:
• AIX Version 4.3 Differences Guide, SG24-2014
• AIX Commands Reference, available at:
http://www.austin.ibm.com.
The following is an excerpt from the ifconfig command page. Here are twoclarifications to the command page text:
1. The main purpose of RFC 1323 is to allow TCP to increase its window sizelarger than 64 KB (controlled by tcp_recvspace) for large MTU adapters.
In our simple tests, we were pleased to see that changes made via chdev werereflected in the ifconfig output. Specifically, our test machine was already setto 64 KB send and receive space, so we used ifconfig to set a 16 KB value.We ran ifconfig en0 to verify that setting. Next, we set the 64 KB value usingchdev, executed the ifconfig en0 command and discovered that the ifconfig
output reflected the new 64 KBvalue we'd just set using chdev.
Note
Appendix A. TCP/IP overview and tuning 183

Without RFC 1323, a 64K MTU adapter could only have one packetoutstanding, which results in very poor performance.
2. The tcp_sendspace option only affects send space buffering in the kernel. Thetcp_recvspace value on the receiver system is the only value that affects TCPmaximum window size.
In AIX Version 4.3.3 and later versions, the following network options, commonlyknown as ISNO (Interface Specific Network Options), can be configured on a perinterface basis as noted below.
Table 13. Network options for AIX V4.3.3
rfc1323 [0 | 1] Enables or disables TCP enhancements as specified by RFC1323, TCP Extensions for High Performance. A value of 1 specifiesthat all TCP connections using this interface will attempt tonegotiate the RFC enhancements. A value of 0 disables rfc1323 forall connections using this interface. The SOCKETS application canoverride this ISNO and global behavior on individual TCPconnections with the setsockopt subroutine.
-rfc1323 Removes the use of ISNO for rfc1323 for this network. ASOCKETS application can override the global behavior onindividual TCP connections using the setsockopt subroutine.
tcp_mssdflt Number Sets the default maximum segment size used in communicatingwith remote networks. If communicating over this interface, asocket uses Number as the value of the default maximum segmentsize.
-tcp_mssdflt Removes the use of ISNO for tcp_mssdflt. The global value,manipulated via /usr/sbin/no, is used instead.
tcp_recvspace Specifies the default socket buffer size for interface socketsreceiving data. The buffer size affects the window size used byTCP. (See the no command for more information.)
-tcp_recvspace Removes the use of ISNO for tcp_recvspace. The global value isused instead.
tcp_sendspace Specifies the default socket buffer size for interface socketssending data. The buffer size affects the window size used by TCP.(See the no command for more information.)
-tcp_sendspace Removes the use of ISNO for tcp_sendspace. The global value isused instead.
tcp_nodelay [0 | 1] Specifies that sockets using TCP over this interface follow theNagle algorithm when sending data. By default, TCP follows theNagle algorithm.
-tcp_nodelay Removes the use of ISNO for the tcp_nodelay option.
184 WebSphere V3 Performance Tuning Guide

Appendix B. Special notices
This publication is intended to help customers, business partners, and IBMemployees to do performance tuning of WebSphere V3.The information in thispublication is not intended as the specification of any programming interfaces thatare provided by WebSphere V3. See the PUBLICATIONS section of the IBMProgramming Announcement for WebSphere V3 for more information about whatpublications are considered to be product documentation.
References in this publication to IBM products, programs or services do not implythat IBM intends to make these available in all countries in which IBM operates.Any reference to an IBM product, program, or service is not intended to state orimply that only IBM's product, program, or service may be used. Any functionallyequivalent program that does not infringe any of IBM's intellectual property rightsmay be used instead of the IBM product, program or service.
Information in this book was developed in conjunction with use of the equipmentspecified, and is limited in application to those specific hardware and softwareproducts and levels.
IBM may have patents or pending patent applications covering subject matter inthis document. The furnishing of this document does not give you any license tothese patents. You can send license inquiries, in writing, to the IBM Director ofLicensing, IBM Corporation, North Castle Drive, Armonk, NY 10504-1785.
Licensees of this program who wish to have information about it for the purposeof enabling: (i) the exchange of information between independently createdprograms and other programs (including this one) and (ii) the mutual use of theinformation which has been exchanged, should contact IBM Corporation, Dept.600A, Mail Drop 1329, Somers, NY 10589 USA.
Such information may be available, subject to appropriate terms and conditions,including in some cases, payment of a fee.
The information contained in this document has not been submitted to any formalIBM test and is distributed AS IS. The information about non-IBM ("vendor")products in this manual has been supplied by the vendor and IBM assumes noresponsibility for its accuracy or completeness. The use of this information or theimplementation of any of these techniques is a customer responsibility anddepends on the customer's ability to evaluate and integrate them into thecustomer's operational environment. While each item may have been reviewed byIBM for accuracy in a specific situation, there is no guarantee that the same orsimilar results will be obtained elsewhere. Customers attempting to adapt thesetechniques to their own environments do so at their own risk.
Any pointers in this publication to external Web sites are provided forconvenience only and do not in any manner serve as an endorsement of theseWeb sites.
Any performance data contained in this document was determined in a controlledenvironment, and therefore, the results that may be obtained in other operatingenvironments may vary significantly. Users of this document should verify theapplicable data for their specific environment.
© Copyright IBM Corp. 2000 185

Reference to PTF numbers that have not been released through the normaldistribution process does not imply general availability. The purpose of includingthese reference numbers is to alert IBM customers to specific information relativeto the implementation of the PTF when it becomes available to each customeraccording to the normal IBM PTF distribution process.
The following terms are trademarks of the International Business MachinesCorporation in the United States and/or other countries:
The following terms are trademarks of other companies:
Tivoli, Manage. Anything. Anywhere.,The Power To Manage., Anything.Anywhere.,TME, NetView, Cross-Site, Tivoli Ready, Tivoli Certified, Planet Tivoli,and Tivoli Enterprise are trademarks or registered trademarks of Tivoli SystemsInc., an IBM company, in the United States, other countries, or both. In Denmark,Tivoli is a trademark licensed from Kjøbenhavns Sommer - Tivoli A/S.
C-bus is a trademark of Corollary, Inc. in the United States and/or other countries.
Java and all Java-based trademarks and logos are trademarks or registeredtrademarks of Sun Microsystems, Inc. in the United States and/or other countries.
Microsoft, Windows, Windows NT, and the Windows logo are trademarks ofMicrosoft Corporation in the United States and/or other countries.
PC Direct is a trademark of Ziff Communications Company in the United Statesand/or other countries and is used by IBM Corporation under license.
ActionMedia, LANDesk, MMX, Pentium and ProShare are trademarks of IntelCorporation in the United States and/or other countries.
UNIX is a registered trademark in the United States and other countries licensedexclusively through The Open Group.
SET, SET Secure Electronic Transaction, and the SET Logo are trademarks ownedby SET Secure Electronic Transaction LLC.
Other company, product, and service names may be trademarks or service marksof others.
AFP AIXAS/400 DB2DB2 Universal Database IBMMQSeries NetfinityRS/6000 S/390SP System/390TXSeries WebSphereWizard
186 WebSphere V3 Performance Tuning Guide

Appendix C. Related publications
The publications listed in this section are considered particularly suitable for amore detailed discussion of the topics covered in this redbook.
C.1 IBM Redbooks
For information on ordering these publications see “How to get IBM Redbooks” onpage 189.
• RS/6000 SP System Performance Tuning, SG24-5340
• AIX Version 4.3 Differences Guide, SG24-2014
• IBM HTTP Server Powered by Apache on RS/6000, SG24-5132
C.2 IBM Redbooks collections
Redbooks are also available on the following CD-ROMs. Click the CD-ROMsbutton at http://www.redbooks.ibm.com/ for information about all the CD-ROMsoffered, updates and formats.
C.3 Other resources
These publications are also relevant as further information sources:
• DB2 Universal Database V6.1 for UNIX, Windows, and OS/2 CertificationGuide, by Jonathan Cook, Robert Harbus, and Tetsuya Shirai, ISBN0-13-086755-1
• AIX Performance Tuning Guide, SR28-5930
• AIX Commands Reference, available at http://www.austin.ibm.com
• WebSphere Application Server Advanced Edition: Getting Started (shippedwith the product)
• Apache: The Definitive Guide, by Ben Laurie, Peter Laurie, and Robert Denn,ISBN 1565925289
• Apache Server Bible, by Mohammed J. Kabir, ISBN 0764532189
CD-ROM Title Collection KitNumber
System/390 Redbooks Collection SK2T-2177Networking and Systems Management Redbooks Collection SK2T-6022Transaction Processing and Data Management Redbooks Collection SK2T-8038Lotus Redbooks Collection SK2T-8039Tivoli Redbooks Collection SK2T-8044AS/400 Redbooks Collection SK2T-2849Netfinity Hardware and Software Redbooks Collection SK2T-8046RS/6000 Redbooks Collection (BkMgr Format) SK2T-8040RS/6000 Redbooks Collection (PDF Format) SK2T-8043Application Development Redbooks Collection SK2T-8037IBM Enterprise Storage and Systems Management Solutions SK3T-3694
© Copyright IBM Corp. 2000 187

C.4 Referenced Web sites
These Web sites are also relevant as further information sources:
• http://www.redbooks.ibm.com
• http://www.spec.org
• http://www.apache.org
• http://www.zeustech.net
• http://www.radview.com
• http://www.merc-int.com
• http://www.rational.com
• http://www.mindcraft.com
• http://www.ibm.com/software/webservers/appserv/siteanalysis.html
• http://www.austin.ibm.com
• http://w3.itso.ibm.com
• http://w3.ibm.com
188 WebSphere V3 Performance Tuning Guide

How to get IBM Redbooks
This section explains how both customers and IBM employees can find out about IBM Redbooks, redpieces, andCD-ROMs. A form for ordering books and CD-ROMs by fax or e-mail is also provided.
• Redbooks Web Site http://www.redbooks.ibm.com/
Search for, view, download, or order hardcopy/CD-ROM Redbooks from the Redbooks Web site. Also readredpieces and download additional materials (code samples or diskette/CD-ROM images) from this Redbookssite.
Redpieces are Redbooks in progress; not all Redbooks become redpieces and sometimes just a few chapters willbe published this way. The intent is to get the information out much quicker than the formal publishing processallows.
• E-mail Orders
Send orders by e-mail including information from the IBM Redbooks fax order form to:
• Telephone Orders
• Fax Orders
This information was current at the time of publication, but is continually subject to change. The latest informationmay be found at the Redbooks Web site.
In United StatesOutside North America
e-mail [email protected] information is in the “How to Order” section at this site:http://www.elink.ibmlink.ibm.com/pbl/pbl
United States (toll free)Canada (toll free)Outside North America
1-800-879-27551-800-IBM-4YOUCountry coordinator phone number is in the “How to Order” section atthis site:http://www.elink.ibmlink.ibm.com/pbl/pbl
United States (toll free)CanadaOutside North America
1-800-445-92691-403-267-4455Fax phone number is in the “How to Order” section at this site:http://www.elink.ibmlink.ibm.com/pbl/pbl
IBM employees may register for information on workshops, residencies, and Redbooks by accessing the IBMIntranet Web site at http://w3.itso.ibm.com/ and clicking the ITSO Mailing List button. Look in the Materialsrepository for workshops, presentations, papers, and Web pages developed and written by the ITSO technicalprofessionals; click the Additional Materials button. Employees may access MyNews at http://w3.ibm.com/ forredbook, residency, and workshop announcements.
IBM Intranet for Employees
© Copyright IBM Corp. 2000 189

IBM Redbooks fax order formPlease send me the following:
We accept American Express, Diners, Eurocard, Master Card, and Visa. Payment by credit card notavailable in all countries. Signature mandatory for credit card payment.
Title Order Number Quantity
First name Last name
Company
Address
City Postal code
Telephone number Telefax number VAT number
Invoice to customer number
Country
Credit card number
Credit card expiration date SignatureCard issued to
190 WebSphere V3 Performance Tuning Guide

Index
Aacknowledgment 155ACL 143Activations 93Active Beans 93Active Entity Beans 95Active Stateful Session Beans 95Active threads 103ActiveX 87adapter queue size 169AddModule 25admin.config 47, 58, 59adminclient 2, 29, 49, 58Administration Server 2, 58Administrative Console 2, 29administrative repository 57, 59, 71adminserver 2, 47Advanced Edition 1, 3affinity 81AfpaBindLogger 25AfpaCache 25AfpaEnable 25AfpaLogFile 25AfpaLogging 26AfpaMaxCache 26AfpaMiCache 26AfpaRevalidationTimeout 26AfpaSendServerHeader 26AFS 141AIX 9, 15, 139AKrecord 85AKstress 85, 86, 123AKtools 85allow from domain 24Allow Overflow 78Apache 21, 136Apache Bench 86Apache Software Foundation 86, 87apachectl 26APAR 25, 27applheapsz 58, 70, 71application heap size 71application server 2, 29AS/400 139asynchronous garbage collection 34atmstat 169Auto Reload 40Average Lifetime 100
BBase Memory Size 78, 82, 83BINARY 25Binary Log Format 25BLOBs 80BMP 93bosserver 156
© Copyright IBM Corp. 2000
buffer pool 67, 69buffer pool cache 70buffpage 67buserver 156
Ccache absolute limit 43cache preferred limit 42cache size 42callback 143cell 141CGI 24challenge/authentication 51chdev 19, 172chunksize 143class garbage collection 34-classgc 35CLF 25cloning 76clustering 82CMP 93command line arguments 30, 35, 45Command Log Format 25Common Object Request Broker Architecture (CORBA) 1Component Broker 1Connection Manager 1Connection Manager API 61connection pooling 61connection poolsize 132connection timeout 62container cache manager 43Container Managed Entity EJBs 12Content analysis 135cookies 82, 85, 88, 136CORBA 45CosNaming 4cpu_state 115crawler 135create() 92, 93, 94, 95
DDatabase Manager 72database server 7DataSource object 57, 61, 64, 76DB2 9DCE 45Dcom.ibm.CORBA.iiop.noLocalCopies 45Dcom.ibm.ejs.dbm.PrepStmtCacheSize 65Dcom.ibm.ejs.dbm.PrepStmtKeyCacheSize 66Default Server 35Demilitarized Zone (DMZ) 11deny from domain 24Destroys 92dft_degree 71DFT_MON_BUFPOOL 68Djava.compiler 33, 35Djavax.rmi.CORBA.UtilClass 45
191

doGet() 98Domain Name System (DNS) 4, 24, 136Don’t Fragment flag 154, 156doPost() 98
EECLF 25EJB 24, 29, 45EJB container 2, 29, 30, 41EJB server 4EJB specification 44encryption 51Enterprise beans 91Enterprise Edition 1Enterprise Java APIs 1Enterprise JavaBeans (EJB) 1, 11Entity Activations 95Entity Creates 95Entity Destroys 94Entity Instantiates 94Entity Passivations 96Entity Removes 95entstat 169ERP 88Ethernet 146, 167exclusive 44Execution Time 93Extended Common Log Format 25Extensible Markup Language (XML) 1
FFast Response Cache Accelerator (FRCA) 21, 24FDDI 146fddistat 169fetchdata 147fetchstatus 143FID 143fileserver 141, 143, 146, 156, 165firewall 11FiveMinute thread 144frcactrl 25, 26FTP 139
Ggarbage collection 30, 32, 34, 45, 120GET 23getsockopt() 182Gigabit Ethernet 182
Hhardware queue limit 170HostCheck thread 144HostnameLookups 24HP-UX 9, 158HTTP 1.0 22, 88HTTP 1.1 22, 85HTTP cookies 4HTTP server 7
httpd.conf 21, 25, 26HTTPS 49HttpSession 75, 82, 83HyperText Markup Language (HTML) 1HyperText Transfer Protocol (HTTP) 1
IIBM HTTP Server (IHS) 21, 38, 86, 136IBMSession 83idle timeout 63ifconfig 169, 183ihshttpd 25IIS 136INET Sockets 37, 38, 39inittab 25InstantDB 2, 29, 57Instantiates 92instfix 27Interface Specific Network Options 181, 184Internet Inter-ORB Protocol (IIOP) 11, 36, 38Internet service providers (ISPs) 3Intervals 77INTRA_PARALLEL 72Invalidate Time 77Invalidates 100invoker 54IOMGR thread 144ISNO 181, 184isOverflow() 83
JJava DataBase Connectivity (JDBC) 1, 12, 30Java heap size 30, 35, 45Java Interface Definition Language (JIDL) 1Java Messaging Service (JMS) 1Java Naming and Directory Interface (JNDI) 1, 4Java Remote Method Invocation over Internet Inter-ORBProtocol (RMI/IIOP) 1Java Server Pages (JSP) 1, 3, 11, 89Java Servlets 1, 11Java stack size 31, 34JAVA TCP/IP 38Java Transaction API (JTA) 1, 4Java Transaction Service (JTS) 1JavaScript 3JavaSoft 30, 31JDBC 77JDBC 2.0 61JDK 1.1.6 30, 33JDK 1.1.7 33JDK 1.1.8 30, 33JDK 1.2 30JDK 1.3 30JMeter 87JNI 82JSP 24jumbograms 146Just In Time (JIT) 30, 33JVM 2, 7, 29, 101, 119
192 WebSphere V3 Performance Tuning Guide

Kkaserver 156KDUMP 154KeepAlive 23keep-alive 85, 88KeepAliveTimeout 23klog 143
LLeast Recently Used (LRU) 147light weight process (LWP) 147, 151Lightweight Directory Access Protocol (LDAP) 1, 4, 49listen backlog 16ListenBacklog 22Listener thread 144Live Beans 93Live Entity Beans 95Live Stateful Session Beans 94Live Stateless Session Beans 94load balance 82LoadModule 25LoadRunner 88Local Pipes 37, 38locklist 72Log Limit 61Lotus Domino Go 136lsattr 19, 171lsps 109
Mmanual update 82Max Connections 38Maxappls 71MaxClients 21, 38maximum connection pool size 62, 65maximum connections 36maximum segment size 19, 167, 172Maximum Transmission Unit 169MaxKeepAliveRequests 23maxlocks 72MaxRequestsPerChild 22MaxSpareServers 22mbuf 180Mercury Interactive Corporation 88Microsoft Internet Information Server 136Mindcraft Inc. 85minimum connection pool size 62MinSpareServers 22MQSeries 1-ms 31, 32, 35, 119MSS 19, 167, 172MTU 18, 19, 146, 167, 169multirow 80-mx 31, 32, 119
NNational Center for Supercomputing Applications 136native thread stack size 31, 34
nb_max_cache 25NBC 17nbc_limit 18, 25nbc_max_cache 17, 18nbc_min_cache 25nbc_pseg 18nbc_pseg_limit 17NCSA 136ndd 158Netscape Enterprise Server 136netstat 26, 116, 146, 157, 164, 169, 178Network Buffer Cache 17, 25, 26Network Dispatcher (ND) 3, 5, 82no 15, 19, 25, 158, 173, 179, 181-noasyncgc 34nobufs 150, 158, 160-noclassgc 34, 132-nojit 33noLocalCopies 46NONE 38, 39NPAGES 67
OOLT/OLD 38OLTP 71Open Servlet Engine (OSE) 11, 36, 37, 38, 39Option A 44, 45Option C 44Oracle 2, 9, 29, 57, 80ORB 1, 30, 45, 53orphan timeout 63-oss 34, 35overflow 82
Ppackage cache size 71Pass By Value 45Passivations 93pckcachesz 71Performance Studio 87persistent connection 23persistent sessions 64, 75, 76, 101plug-in 36POSIX threads 147, 151POST 23, 24, 85PowerBuilder 87prepared SQL statements 12prepared statement 57, 64prepared statement cache 64, 65prepared statement key cache 65private segments 17PROPID 81Proxy 86proxy 45Proxy Server 82ps 110, 111ptserver 143, 150, 156PUT 23
193

Qqueue type 36, 39
RRadview 88Rational Suite Performance Studio 87rec_que_size 168, 172receive buffer 16relational database 57Remote Method Invocation (RMI) 45remove() 92, 93, 95ReqLevel 28Resource Analyzer 43, 54, 78, 83, 85, 89, 120RFC 1323 176, 183RFC 2001 147rfc1323 17, 173, 176, 182RLimitCPU 23RLimitMEM 23RLimitNPROC 24RMI/IIOP 38, 47, 49RMI/IIOP/SSL 49robot.txt 135RS/6000 S80 21RTE 88rv_buf4k_min 172RX 145rx_que_size 172rxdebug 150, 152, 158, 160RXTUNE 157
SS/390 139sar 109, 114SAS 53sb_max 15, 168, 177Secondary hash table 84Secure Association Server 53Secure Sockets Layer (SSL) 1, 49, 85, 88security 49Security Cache Timeout 52send buffer 16, 17SendBufferSize 24Serious Event listener 59Serious Event Pool Interval 60service() 98Servlet API 75Servlet Engine 29, 36, 37, 39servlet redirector 10, 11, 38Servlets Auto Reload 29Session Manager 61, 75, 76, 77session objects 75shared 44Signal thread 144Silicon Graphics 85Single Sign-On 49Site Analyzer 89, 133, 135Site Surveyor 135sliding window 175SMIT 169, 171
SMP 71, 116, 171, 178snapshot 69SOCK_DGRAM 177SOCK_STREAM 177software queue limit 170Solaris 9, 30, 31, 34, 37, 39, 139, 158somaxconn 16SP 13SP switch 167SPECweb96 19, 21-ss 34, 35SSL 24SSL V3 timeout 53Standard Edition 1, 3StartServers 22Stateful Activations 95Stateful Passivations 96Stateful Session Creates 95Stateful Session Destroys 94Stateful Session Instantiates 94Stateful Session Removes 95Stateless Session Destroys 94Stateless Session EJB 12Stateless Session Instantiates 94Static HTML 3storedata 147subnet 172subnetsarelocal 19, 172, 173subnetting 173Sun 32SunOS 164SunSoft 30, 32svmon 110, 111sw_txq_size 171System Configuration Repository 2
TTCP window 17TCP/IP 15, 167tcp_mssdflt 18, 182tcp_nodelay 182tcp_recvspace 15, 16, 175, 177, 182tcp_sendspace 15, 16, 174, 177, 182tcp_timewait 17tcpdump 154, 162thewall 15, 18, 25, 168Thread creates 103Thread destroys 103time 115Timeout 23token-ring 167tokstat 169Trade 11transport queue 29, 36transport type 36, 37, 38tx_que_size 171TXSeries 1
194 WebSphere V3 Performance Tuning Guide

UUDB 29, 58, 80, 139UDB V5.2 2, 57UDB V6.1 2, 57udp_recvspace 15, 17, 177udp_sendspace 15, 17, 172, 177udpInOverflows 157, 164UDPSIZE 157, 158UID 24UNIX 9, 47Usage analysis 136use_isno 181
VVBUSY 145, 148, 150V-CLF 25V-ECLF 25-verbosegc 32Virtual Memory Manager 107Visual Basic 87Visual C++ 87vlserver 156VMM 107vmstat 63, 78, 89, 113, 119vnode 143volserver 146, 153, 156vos 152
WW3C 136Web Application 29Web server 7Web Traffic Express 82WebLoad 88WebSphere Application Server Engine 7WebSphere Application Server V3 1WebSphere Performance Pack 3, 5, 82, 141WebSphere Studio 138WebStone 85window size 174, 175Windows NT 9, 30, 31, 33, 37, 47, 65, 139Work Load Management (WLM) 3, 4, 10World Wide Web Consortium 136wproc 158, 161WTE 82
Xxmt_que_size 168, 171, 172
195

196 WebSphere V3 Performance Tuning Guide

© Copyright IBM Corp. 2000 197
IBM Redbooks review
Your feedback is valued by the Redbook authors. In particular we are interested in situations where a Redbook"made the difference" in a task or problem you encountered. Using one of the following methods, please review theRedbook, addressing value, subject matter, structure, depth and quality as appropriate.
• Use the online Contact us review redbook form found at http://www.redbooks.ibm.com/• Fax this form to: USA International Access Code + 1 914 432 8264• Send your comments in an Internet note to [email protected]
Document NumberRedbook Title
SG24-5657-00WebSphere V3 Performance Tuning Guide
Review
What other subjects would youlike to see IBM Redbooksaddress?
Please rate your overallsatisfaction:
O Very Good O Good O Average O Poor
Please identify yourself asbelonging to one of the followinggroups:
O CustomerO Business PartnerO Solution DeveloperO IBM, Lotus or Tivoli EmployeeO None of the above
Your email address:The data you provide here may beused to provide you with informationfrom IBM or our business partnersabout our products, services oractivities.
O Please do not use the information collected here for future marketing orpromotional contacts or other communications beyond the scope of thistransaction.
Questions about IBM’s privacypolicy?
The following link explains how we protect your personal information.http://www.ibm.com/privacy/yourprivacy/

SG24-5657-00
Printed in the U.S.A.
WebSphere
V3
Perform
anceT
uningG
uideSG
24-5657-00
®


![Untitled Document [ps-2.kev009.com]ps-2.kev009.com/pccbbs/pc_servers_pdf/19k0900.pdf · • Position the template to the rack so that the edges of the template do not overlap any](https://static.fdocuments.in/doc/165x107/5b70fcc27f8b9aab548e165b/untitled-document-ps-2-ps-2-position-the-template-to-the-rack-so-that.jpg)