PROVISIONAL COAL STATISTICS Coal... · Provisional Coal Statistics 2015-16 is prepared on the basis...
83
Transcript of PROVISIONAL COAL STATISTICS Coal... · Provisional Coal Statistics 2015-16 is prepared on the basis...


PROVISIONAL COAL STATISTICS 2015-16
GOVERNMENT OF INDIA MINISTRY OF COAL
COAL CONTROLLER’S ORGANISATION KOLKATA

Provisional Coal Statistics 2015-16
is prepared on the basis of the provisional data received from source agencies
Any suggestions for improvement are most welcome
For any enquiry regarding coal statistics please write to
Coal Controller’s Organisation
1, Council House Street
Kolkata - 700 001
Tel: 91-33-2248-9616, 91-33-2248-8225, Fax: 91-33-2248-2459
E-mail: [email protected]


Team Associated with the Publication
Sri Anjani Kumar Coal Controller
Sri Sudip Kumar Ray Deputy Director General
Sri Indradeep Roy Chowdhury Deputy Director
Dr. Sujoy Majumder Officer on Special Duty
Sri Goutam Bandyopadhyay Accountant
Sri Sukumar Das Assistant
Sri Sumanta Biswas Upper Division Clerk
Miss Manashi Goswami Junior Computor Operator
Sri Sachin Kumar Lower Division Clerk
Smt. Sima Guha Ray Upper Division Clerk
**************

i
Highlights 1-3
Introductory Notes 4-12
Table No. Page No.
Chart - I to VI 13-14
1.1 All India Overall Coal Demand (BE) & Supply – Sector- wise: 2015-16 15
1.2 Supply Plan – Source wise in 2015-16 15
1.3 Indigenous Coal Supply Plan (BE) & Achievement : 2015-16 16
1.4 Balance Sheet of Availability & Supply of Raw Coal & Lignite: 2014-15 & 2015-16 17
1.5 Total Primary Supply of Coal & Lignite: 2006-07 to 2015-16 18
1.6 Inventory of Geological Reserve of Coal by Type as on 1st April 2014, 2015 & 2016 19
1.7 State-wise Inventory of Geological Reserve of Coal as on 1st April 2014, 2015 & 2016 20
1.8 State-wise Inventory of Geological Reserve of Lignite as on 1st April 2014, 2015 & 2016 21
1.9 Percentage Change in Actual Over Provisional During Last Five Years 22
Production
2.1 Trend of Production of Raw Coal and Lignite during last ten years 23
2.2 Trend of Production of Coal by type during last ten years 23
2.3 Trend of Production of Coal Products by type during last ten years 24
2.4 Monthly Production of Coal by type and Lignite during 2015-16 25
2.5 Monthly Production of Coal Products by type during 2015-16 26
2.6 Share of Raw Coal Production by States during last ten years 27-28
2.7 Share of Lignite Production by States during last ten years 29
2.8 State wise Production of Raw Coal by Type in last five years 30
2.9 State wise Production of Lignite in last five years 30
2.10 Trends of Company wise Production of Coal and Lignite in last three years 31
2.11 State wise and Company wise Production of Raw Coal by types in last three years 32
2.12 Captive Block wise Production of Raw Coal by types in last two years 33
2.13 Grade wise Production of Coking Coal by Companies in 2015-16 34

ii
Table No. Page No.
2.14 Grade wise Production of Non-Coking Coal by Companies in 2015-16 35
2.15 Trend of Production of Raw Coal from Open cast and Underground mines in last ten years
36
2.16 Company wise Production of Raw Coal from Opencast and Underground mines in last two years
37
2.17 Trend of OMS in OC & UG Mines (CIL & SCCL) during last ten years 38
2.18 Company wise Production, Manshift & OMS (CIL & SCCL) By Type of Mines during last three years
39
2.19 Company wise Over Burden Removal and Stripping Ratio in revenue mines in last three years
40
Despatches
3.1 Trend of Despatches of Raw Coal and Lignite during last ten years 41
3.2 Trend of Despatches of Coal by type during last ten years 41
3.3 Trend of Despatches of Coal Products by type during last ten years 42
3.4 Monthly Despatches of Coal by type and Lignite during 2015-16 43
3.5 Monthly Despatches of Coal Products by type during 2015-16 44
3.6 Share of Raw Coal Despatches by States during last ten years 45-46
3.7 Share of Lignite Despatches by States during last ten years 47
3.8 Trend of Despatches of Raw Coal & Lignite by Companies during last three years 48
3.9 State wise and Company wise Despatches of Raw Coal by type In last three years 49
3.10 Captive Block wise Despatch of Raw Coal by types in last two years 50
3.11 Grade wise Despatch of Coking Coal by Companies in 2015-16 51
3.12 Grade wise Despatch of Non-coking Coal by Companies in 2015-16 52
3.13 Mode wise Despatches of Raw Coal by Companies in 2015-16 ( External & Internal) 53
3.14 Company wise Off-take of Raw Coal and Lignite to Different Priority Sectors in 2015-16 54
3.15 Availability and Off-take Raw Coal by Companies during last two years 55

iii
Table No. Page No.
Pit-head Closing Stock
4.1 Trend of Pit-head Closing Stock of Raw Coal and Lignite during last ten years 56
4.2 Monthly Pit-head Closing Stock of Coal, Lignite & Various Coal Products during 2015-16 57
4.3 Trend of Pit-Head Closing Stock of Raw Coal & Lignite by Companies during last three years
58
4.4 Captive Block wise Pit Head Closing Stock of Raw Coal (Coking & Non-coking) during 2015-16
59
Import & Export
5.1 Year wise Import of Coal, Coke and Lignite to India during last ten years 60
5.2 Year wise Export Coal, Coke and Lignite from India during last ten years 60
5.3 Source Country wise Import of Coal, Coke and Lignite to India during 2015-16 61
5.4 Destination Country wise Export of Coal, Coke and Lignite from India during 2015-16 62
5.5 Port wise Import of Coal, Coke and Lignite to India during 2015-16 63
5.6 Port wise Export of Coal, Coke and Lignite from India during 2015-16 64
Captive Blocks
6.1 List of Coal Blocks Allotted/Vested or under Custodian under CM(SP) Act, 2015 65-67
6.2 Coal Blocks allotted under Auction by Competitive Bidding Rules, 2012 68
6.3 Coal Blocks not cancelled by Hon'ble Supreme Court 69
Appendix – A (Concepts, Definitions and Practices) 70-74
Annexure -I (Abbreviations) 75

1
Highlights
(A) Production
1. In the year 2015-16, production of raw coal in India was 639.234 MT against 609.179 MT in 2014-15,
showing an increase of 4.93% over the previous year whereas lignite production was 43.843 MT against
48.270 MT in the year 2014-15, showing a decrease of 9.17 % over the previous year. [Table: 2.1]
2. The contribution of public sector and private sector in production of raw coal in India in the year 2015-16 was
as follows : [Table :- 2.10]
Production of raw coal during the year 2015-16 (MT)
Sector Coking Non-coking Total coal
Public 54.662 552.016 606.678
Private 6.225 26.331 32.556
All India 60.887 578.347 639.234
3. In the year 2015-16, production of coking coal in India was 60.887 MT against 57.446 MT in the previous
year, showing a growth of 5.99 % over 2014-15. Production of non-coking coal was 578.347 MT against
551.733 MT in the year 2014-15, showing a growth of 4.82 % over 2014-15. [Table :- 2.2]
4. As public sector units, Coal India Limited contributed 536.475 MT of coal (83.92 % share) in the total coal
production of India in the year 2015-16 and SCCL contributed 60.380 MT (9.45 % share). In that year,
Neyveli Lignite Corporation Limited contributed 25.451 MT (58.05 % share) of total lignite production of the
country followed by GMDCL 6.969 MT (15.9 % share) and BLMCL 6.679 (15.23 % share). [Table :- 2.10]
5. In the private sector, Sasan Power Limited was the largest producer and produced 17.022 MT of coal
followed by TISCO which produced 6.228 MT of coal. [Table :- 2.10]
6. In the year 2015-16, production of washed coal (coking) was 6.182 MT against 6.011 MT in the previous
year, thus increased by 2.8 % over 2014-15, whereas production of middling (coking) was 5.525 MT in the
year 2015-16 against 4.721 MT in the previous year, thus increased by 17 % over 2014-15. [Table :-2.3]
7. In the year 2015-16, production of hard coke was 14.178 MT against 14.355 MT in the previous year, thus
decreased by 1.2 % over 2014-15. [Table :-2.3]
8. In the year 2015-16, Odisha registered highest coal production of 138.461 MT (21.7 % share) followed by
Chhattisgarh 130.605 MT (20.4 % share) and Jharkhand 121.067 MT (18.9 % share) and Madhya Pradesh
107.714 MT (16.9 % share). In that year total lignite production was 43.843 MT. The largest producer Tamil
Nadu produced 24.227 MT (55.3 % share), Gujarat 10.124 MT (23.1 % share) and Rajasthan 9.492 MT
(21.6 % share). [Table :- 2.6 and 2.7]
9. In the year 2015-16, highest coking coal producing state in India was Jharkhand 58.548 MT (96.16% share).
Highest non-coking coal producing state was Odisha 138.461 MT (23.94 % share) followed by Chhattisgarh
130.470 MT(22.56 % share) and Madhya Pradesh 107.505 MT (18.59 % share). [Table :- 2.11]
10. In the year 2015-16, out of total coal production of 639.234 MT, production from opencast mines was
592.822 MT (92.74 % share) and from underground mines was 46.412 MT (7.26 % share). [Table:-2.15]

2
11. In the year 2015-16, CIL produced highest quantity of coal from underground mines 33.786 MT (72.80 %
share) followed by SCCL which produced 10.653 MT (22.95 % share). [Table:-2.15]
12. In the year 2015-16, productivity (OMS) in respect of opencast mines of CIL and SCCL was 15.28 and
13.78 respectively. In respect of underground mines OMS of CIL and SCCL was 0.79 and 1.25
respectively. (OMS is the output measured in tones per unit of man-shift). [Table :- 2.17]
13. In the year 2015-16, overall stripping ratio was 2.67. Stripping Ratio is defined as the ratio of OBR to coal
produced in open cast mining. OBR means the quantity of over burden removed during the process of open
cast mining. [Table :- 2.19]
(B) Despatch
1. In the year 2015-16, despatch of indigenous raw coal was 632.169 MT against 603.772 MT during 2014-15,
showing an increase of 4.70 % over the previous year whereas, despatch of lignite was 42.212 MT against
46.954 MT in the year 2014-15, showing a decrease of 10.10 % over the previous year. [Table :-3.1]
2. In the year 2015-16, despatch of coking coal was 59.213 MT against 56.438 MT in the year 2014-15,
showing an increase of 4.92 % over the previous year. [Table :-3.2]
3. Despatch of non-coking coal was 572.956 MT in the year 2015-16 against 547.334 MT in the year 2014-15,
showing an increase of 4.68 % over the previous year. [Table :-3.2]
4. In the year 2015-16, despatch of washed coal (coking) was 6.067 MT against 6.080 MT in 2014-15,
showing a decrease of 0.21 % over the previous year. Despatch of middling (coking) was 5.734 MT in the
year 2015-16 against 5.012 MT in the year 2014-15, showing an increase of 14.41 % over the previous
year. [Table :-3.3]
5. Despatch of hard coke was 13.548 MT in the year 2015-16 against 13.954 MT in the year 2014-15, thus
showing a decrease of 2.91 % over the previous year. [Table :- 3.3]
6. The contribution of public sector and private sector in despatch of raw coal in the year 2015-16 was as
follows: [Table :- 3.8]
Despatch of Raw Coal during the year 2015-16 (MT)
Sector Coking Non-coking Total
Public 52.988 547.042 600.030
Private 6.225 25.914 32.139
All India 59.213 572.956 632.169
7. As public sector units, Coal India Limited contributed 532.101 MT of coal (84.17 % share) in the total coal
despatch of India in the year 2015-16 and SCCL contributed 58.238 MT (9.21 % share). In that year, total
despatch of lignite was 42.212 MT. As the largest supplier of lignite, NLC (Neyveli Lignite Corporation Ltd.)
despatched 23.717 MT (56.19 % share) followed by GMDCL 6.969 MT (16.51 % share) and BLMCL 6.563
MT (15.55 % share). [Table :- 3.8]
8. Out of total despatch of coal by private sector, Sasan Power Limited had the largest share of 16.842 MT
followed by TISCO 6.233 MT. [Table :- 3.8]
9. In the year 2015-16, largest despatch of coal was from Odisha 140.639 MT (22.25 % share) followed by
Chhattisgarh 132.040 MT (20.89 % share) and Jharkhand 118.072 MT (18.68 % share). Largest despatch

3
of lignite was from Tamil Nadu 22.493 MT (53.29 % share) followed by Gujarat 10.136 MT (24.01 % share)
and Rajasthan 9.583 MT (22.70 % share). [Table :- 3.6 and 3.7]
10. In the year 2015-16, sector wise despatch of coal was mainly to Power (Utility) 445.979 MT, Power
(Captive) 62.267 MT, Steel 12.373 MT, Cement 8.926 MT and Sponge Iron 7.763 MT [Table :- 3.14]
11. In the year 2015-16, coal was mainly despatched by Rail 314.189 MT (49.70 %) followed by road 171.97
MT (27.20 %) and MGR 98.170 MT (15.53 %). [Table :- 3.13]
(C) Pit Head Closing Stock
1. Pit-head closing stock of raw coal as on 31-03-2016 was 64.793 MT against 59.389 MT as on 31-03-2015
(increased by 9.10 % over the previous year). In case of lignite it was 4.809 MT as on 31-03-2016 against
3.176 MT as on 31-03-2015 (increased by 6.91 % over the previous year. [Table :-4.1]
2. Out of total closing stock of 64.793 MT as on 31-03-2016, public sector accounted for 64.208 MT ( 99.10 %
share). [Table :-4.3]
(D) Import and Export
1. In the year 2015-16, import of coking coal was 43.506 MT against 43.715 MT in the year 2014-15, thus
decreased by 0.47 % over the previous year. In that year, import of non-coking coal was 156.378 MT
against 174.068 MT in 2014-15, thus decreased by 10.16 % over the year 2014-15. [Table :-5.1]
2. The countries from where coal was mainly imported were Indonesia (96.190 MT), Australia (47.557 MT)
and South Africa (36.080 MT). [Table 5.3]
3. In the year 2015-16, coal was mainly imported through Paradip (15.901 MT), Gangavaram (15.162 MT),
Mundra (13.632 MT), Vishakhapatnam (12.977 MT), Krishnapatnam (12.505 MT), Kandla (12.057 MT),
Dhamra (11.511 MT), and Marmagoa (11.022 MT) sea ports. [Table 5.5]
3. Export of coal in the year 2015-16 was 1.250 MT against 1.238 MT in 2014-15, thus there was a marginal
change . [Table :-5.2]
4. In the year 2015-16, coal was mainly exported to Bangladesh (0.611 MT) and Nepal (0.440MT). Main ports
for coal export were Borsorah (0.384 MT) and Panitanki (0.293 MT). [Table 5.4 and 5.6]
(E) Captive Coal Block
In the year 2014-15, by order of Hon’ble Supreme Court of India, allocation of 204 coal blocks were
cancelled except Moher, Moher Amlori, Tasra, Pakri-Barwadi Coal Block and 10 UMPP Coal Blocks. As per
Coal Mines (Special Provisions) Act, 2015, allocation of Schedule-I coal mines started by way of Public
Auction or on the basis of Competitive Bids for Tariff. As on 31.03.2016 reallocation (either vested or
allotted) were done in respect of 71 coal blocks. Out these 71 coal blocks, 08 blocks were producing coal,
02 more blocks given to CIL as Custodian have started production. Moher, Moher Amlori was already
continuing production. In 2015-16, production from those Captive Coal Blocks was 31.101 MT.
(F) Geological Coal Reserve
As per Geological Survey of India, geological resources of coal in India as on 01-04-2016 was 308.802
Billion Tonnes/ BT. The geological resources of coking coal (prime, medium and semi-coking) was 34.403
Billion Tonnes and non-coking coal was 274.398 Billion Tonnes. .
Total coal extracted since 1950 up to 2015-16 is around 13783.957 Million Tonnes.
4
Introductory Note
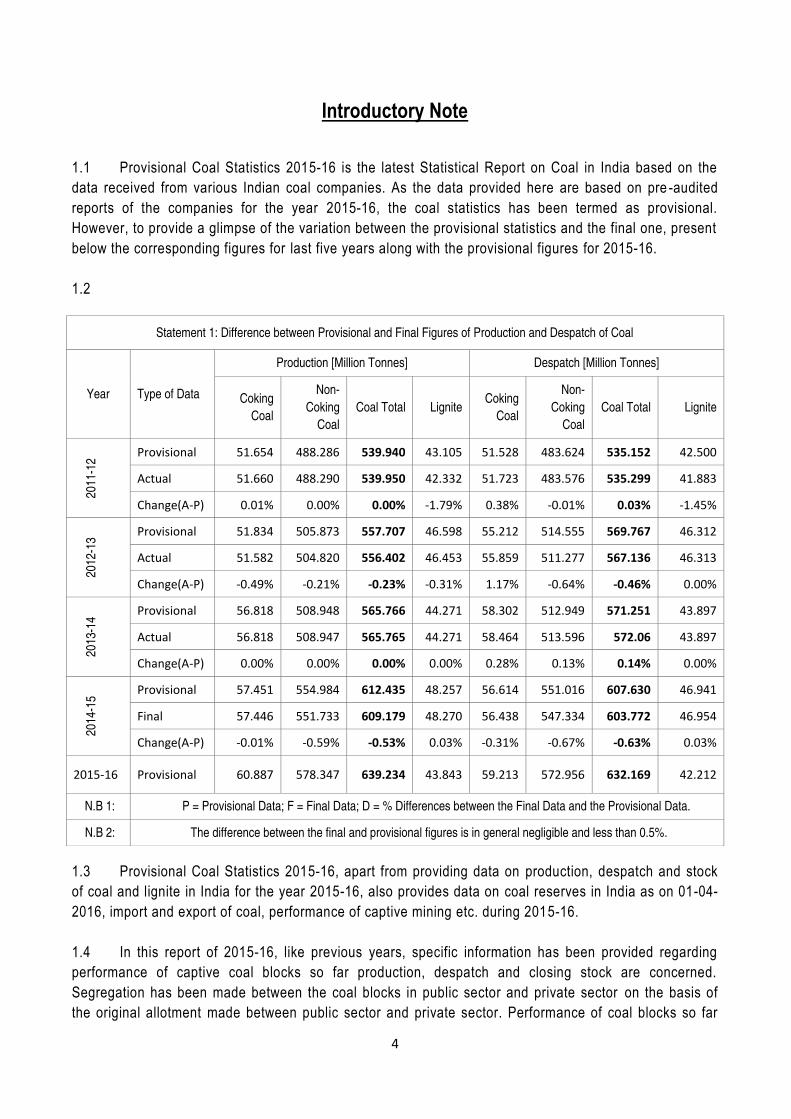
1.1 Provisional Coal Statistics 2015-16 is the latest Statistical Report on Coal in India based on the
data received from various Indian coal companies. As the data provided here are based on pre -audited
reports of the companies for the year 2015-16, the coal statistics has been termed as provisional.
However, to provide a glimpse of the variation between the provisional statistics and the final one, present
below the corresponding figures for last five years along with the provisional figures for 2015-16.
1.2
1.3 Provisional Coal Statistics 2015-16, apart from providing data on production, despatch and stock
of coal and lignite in India for the year 2015-16, also provides data on coal reserves in India as on 01-04-
2016, import and export of coal, performance of captive mining etc. during 2015-16.
1.4 In this report of 2015-16, like previous years, specific information has been provided regarding
performance of captive coal blocks so far production, despatch and closing stock are concerned.
Segregation has been made between the coal blocks in public sector and private sector on the basis of
the original allotment made between public sector and private sector. Performance of coal blocks so far
Statement 1: Difference between Provisional and Final Figures of Production and Despatch of Coal
Year Type of Data
Production [Million Tonnes] Despatch [Million Tonnes]
Coking
Coal
Non-
Coking
Coal
Coal Total Lignite Coking
Coal
Non-
Coking
Coal
Coal Total Lignite
2011
-12
Provisional 51.654 488.286 539.940 43.105 51.528 483.624 535.152 42.500
Actual 51.660 488.290 539.950 42.332 51.723 483.576 535.299 41.883
Change(A-P) 0.01% 0.00% 0.00% -1.79% 0.38% -0.01% 0.03% -1.45%
2012
-13
Provisional 51.834 505.873 557.707 46.598 55.212 514.555 569.767 46.312
Actual 51.582 504.820 556.402 46.453 55.859 511.277 567.136 46.313
Change(A-P) -0.49% -0.21% -0.23% -0.31% 1.17% -0.64% -0.46% 0.00%
2013
-14
Provisional 56.818 508.948 565.766 44.271 58.302 512.949 571.251 43.897
Actual 56.818 508.947 565.765 44.271 58.464 513.596 572.06 43.897
Change(A-P) 0.00% 0.00% 0.00% 0.00% 0.28% 0.13% 0.14% 0.00%
2014
-15
Provisional 57.451 554.984 612.435 48.257 56.614 551.016 607.630 46.941
Final 57.446 551.733 609.179 48.270 56.438 547.334 603.772 46.954
Change(A-P) -0.01% -0.59% -0.53% 0.03% -0.31% -0.67% -0.63% 0.03%
2015-16 Provisional 60.887 578.347 639.234 43.843 59.213 572.956 632.169 42.212
N.B 1: P = Provisional Data; F = Final Data; D = % Differences between the Final Data and the Provisional Data.
N.B 2: The difference between the final and provisional figures is in general negligible and less than 0.5%.

5
production, despatch and closing stock is concerned is shown in the corresponding tables of this
publication.
1.5 As the purpose of the publication of the Provisional Coal Statistics 2015-16 is to provide quick
results to all stakeholders, users, planners, etc., a detailed analysis like the one attempted in the Coal
Directory has not been preferred here. Therefore, the report contains only an Introductory Note followed
by Tables and Charts depicting various aspects of Coal Statistics.
Indian Coal and Lignite Deposits
1.6 The Indian coal deposits are primarily concentrated in the Gondwana sediments (Upper Paleozoic
to Mesozoic systems) located in the Eastern and Central parts of Peninsular India and also in parts of
North Eastern Regions viz., Sikkim, Assam and Arunachal Pradesh. The coal is of bituminous to sub -
bituminous rank and is restricted to the sediments of Permian age. Indian lignite deposits are in the
Tertiary sediments in the Southern & Western parts of the peninsular shield, particularly in Tamil Nadu,
Pondicherry, Gujarat, Rajasthan and Jammu & Kashmir. It is also available, in minor quantity, in Kerala &
West Bengal. As per Geological Survey of India, the reserve position for coal as well as lignite for last
three years has been as follows:
Statement 2: Inventory of Geological Reserve of Coal and Lignite in India
Name of the Mineral
As on Reserve (Mill. Tonnes)
Proved Indicated Inferred Total
(1) (2) (3) (4) (5) (6)
Coal
01/04/2014 1,25,909 1,42,506 33,148 3,01,564
01/04/2015 1,31,614 1,43,241 31,739 3,06,596
01/04/2016 1,38,087 1,39,151 31,563 3,08,802
Lignite
01/04/2014 6180.90 26282.67 10783.11 43,246.68
01/04/2015 6182.41 26281.58 11650.25 44,114.24
01/04/2016 6182.41 26372.70 12039.42 44,594.53
The distribution of the coal and lignite reserves over the regions/states and by type in India and other
details may be seen from Table 1.6, 1.7 and 1.8.
Production of Coal and Lignite in India
1.7 In the year 2015-16, coal production in
India reached 639.234 MT and registered a growth
of 4.93 % over the last year. During this period
production of lignite reached 43.843 MT registering
a decline 9.17% over the last year. Statement 3(A)
shows production of coal in 2015-16 in India by
Public and Private Sectors.
Statement 3(A): Coal Production in India by Company
Company Coal Production (2015-16) [MT]
Coking Non-coking Total
CIL 53.701 482.774 536.475
SCCL - 60.380 60.380
Other Public 0.961 8.862 9.823
Total Public 54.662 552.016 606.678
Total Private 6.225 26.331 32.556
ALL INDIA 60.887 578.347 639.234

6
1.8 It can be seen that Coal India Limited alone
accounted for 83.92% of coal production in the
country and share of SCCL was 9.45%. Share of
public sector was 94.91% and that of private sector
was 5.09%. Performance of subsidiary companies
of Coal India Limited may be seen from statement
3(B). From statement 3(A) and 3(B) it can be seen
that the major contributors in all India coal
production were MCL (21.57%), SECL (21.22%)
and NCL (12.55%). These three subsidiary
companies of CIL collectively accounted for 55.34%
of total coal production at all India level and
65.95% of production by CIL group.
Statement 3(B): Coal Production in India by CIL Subsidiary wise coal production
Company Coal Production (2015-16) [MT]
Coking Non-coking Total
ECL 0.012 40.196 40.208
BCCL 32.648 3.213 35.861
CCL 20.697 40.627 61.324
NCL 0 80.224 80.224
WCL 0.209 44.606 44.815
SECL 0.135 135.521 135.656
MCL 0 137.901 137.901
NEC 0 0.486 0.486
CIL 53.701 482.774 536.475
1.9 From the Statement 3(A) it can also be
seen that by type of coal, major contribution in total
coal production was of non-coking coal (90.48%).
Statement 4 shows that during the period 2015-16,
almost total coking coal of the country was
produced in the state of Jharkhand which
accounted for 96.16% of the total coking coal
production.
1.10 From Table 2.2 it can be seen that in the
year 2015-16, production of coking coal registered
an increase of 5.99% over the previous year
whereas the corresponding increase in the case of
non-coking coal was 4.82%.
1.11 Statement 4 shows coal production in India
during 2015-16 by states. It may be observed that
the three major states were Odisha (21.7%),
Chhattisgarh (20.04%), Jharkhand (18.9%) and
Madhya Pradesh (16.9%). These four states
together contributed about 77.9% of the total coal
production in the country.
Statement 4: Coal Production in India by State
States Coal Production (2015-16) [MT]
Coking Non
Coking Total
Arunachal Pradesh
0 0
Assam 0.486 0.486
Chhattisgarh 0.135 130.470 130.605
Jammu & Kashmir 0.015 0.015
Jharkhand 58.548 62.519 121.067
Madhya Pradesh 0.209 107.505 107.714
Maharashtra 38.351 38.351
Meghalaya 3.715 3.715
Odisha 138.461 138.461
Telangana 60.380 60.380
Uttar Pradesh 12.689 12.689
West Bengal 1.995 23.756 25.751
All India 60.887 578.347 639.234
1.12 Considering coal production from the
technology point of view then it can be seen from
Table 2.15 that in the year 2015-16, production
from opencast mining system accounted for 92.74%
of the total coal production and the rest 7.26% was
from underground mining system. It is interesting to
note that the share of OC mining in total coal
production has been steadily increasing over time
and in the last ten years it has increased from
86.61% in 2006-07 to 92.74% in 2015-16.
1.13 It can be seen from Table 2.3 that
production of coal products increased from 46.123
MT in the year 2014-15, 43.004 MT in the year
2015-16. Out of total production of coal products in
2015-16, production of washed coal (coking) was
6.182 MT and washed coal (non-coking) was 17.119
MT.
1.14 Table 2.13 and 2.14 show details of coal
production by type (coking and non-coking) and grade of
coal by each company for the year 2015-16.
1.15 Stripping Ratio defined as the ratio of OBR
(over burden removal) to coal produced in open
cast mining has been of interest to the researchers

7
and planners. From Table 2.19 it can be seen that
in the year 2015-16, the stripping ratio at all India
level was 2.67. The corresponding figure for the
year 2014-15 was 2.33. Stripping ratio of CIL for
2015-16 was 2.27. In the year 2015-16, stripping
ratio for the public sector as a whole was 2.62 and
for the private sector was 3.79. In case of CIL
companies, MCL reported the lowest stripping ratio
of 0.72 against coal production of 136.789 MT
whereas NEC reported the highest stripping ratio of
15.12 against coal production of 0.483 MT. BCCL
reported the second highest stripping ratio of 4.36
against production of 34.054 MT.
1.16 Output per man shift (OMS) is one of the
measures of efficiency in coal production.
Statement 5 shows OMS in respect of type of
mines i.e. OC and UG for the year 2015-16 and the
last year for two major players in the public sectors
namely CIL and SCCL. From Table 2.17 it can be
seen that for CIL OMS for open cast mining has
shown an increasing trend in last ten years which
has increased from 7.51 in 2005-06 to 13.06 in
2014-15. The corresponding increase in case of
SCCL has been from 9.60 in 2005-06 to 12.14 in
2014-15. Further details on the issue can be seen
from the table 2.18.
Statement 5: OMS (Tonnes) in OC & UG Mines In 2014-15 and 2015-16 ( CIL & SCCL )
Type of Mining Company Year
2014-15 2015-16
OC CIL 14.63 15.28
SCCL 12.14 13.78
UG CIL 0.78 0.79
SCCL 1.10 1.25
Overall CIL 6.50 7.11
SCCL 4.20 4.20
1.17 In Table 2.1 it is shown that production of
lignite in the year 2015-16 was 43.843 MT
whereas it was 48.270 MT in 2014-15, thus in the
year 2015-16 production of lignite declined by
9.17% over the previous year. It can also be seen
that while coal production registered an increase of
48.37% in the year 2015-16 in comparison to the
year 2006-07, the corresponding increase in lignite
production was 40.14%. Statement 6 shows
production of lignite by different companies in
2014-15 and 2015-16. In case of lignite in the year
2015-16, three major producing companies with
share in total production were NLC (58.05%),
GMDCL (15.9%) and BLMCL (15.23%). In the year
2015-16, there was significant drop in production of
GMDCL over the year 2014-15.
Statement 6: Lignite Production (MT) in India
by Company in 2014-15 and 2015-16
Company 2014-15 2015-16
NLC 26.543 25.451
GMDCL 8.713 6.969
GIPCL 3.404 3.063
RSMML 1.405 0.972
GHCL 0.200 0.092
VS LPPL 1.005 0.617
BLMCL 7.000 6.679
ALL INDIA 48.270 43.843
Despatch
1.18 Despatch of raw coal in the year 2015-16
was 632.169 MT against 603.772 MT in the year
2014-15, thus resulting a growth of 4.70% over the
previous year.
1.19 Statement 7 shows the despatch of coal by
different companies in the year 2014-15. It can be
seen that Coal India Limited alone accounted for
84.17 % of overall coal despatch in the country,
while share of SCCL in coal despatch was 9.21%.
The contribution of the private sector was 5.08%. In
the CIL group of companies, share of MCL in all
India coal despatch was 22.18%, SECL 21.61%
and NCL 12.42%. These three subsidiary
companies of CIL collectively accounted for 56.21%
of raw coal despatch in all India level.

8
Statement 7: Coal Despatch in India by company- 2015-16
Company Coal Despatch (2015-16) [MT]
Coking Non-coking Total
ECL 0.017 38.362 38.379
BCCL 32.914 3.250 36.164
CCL 18.799 40.783 59.582
NCL - 78.532 78.532
WCL 0.200 42.106 42.306
SECL 0.108 136.474 136.582
MCL - 140.214 140.214
NEC - 0.342 0.342
CIL 52.038 480.063 532.101
SCCL - 58.238 58.238
Other Public 0.950 11.537 12.487
Total Public 52.988 547.042 600.030
Total Private 6.225 25.914 32.139
ALL INDIA 5.921 572.956 632.169
1.20 Statement 8 shows details of off-take of
raw coal in India in the year 2015-16 by different
sectors of economy. Analysis of total off-take by
different sector shows that power sector accounted
for 80.35% of total raw coal off-take further details
on the issue is shown in Table 3.14.
Statement 8: Off-take of Raw Coal in India in 2015-16 by Sector
Sector Off-take [MT]
Power (Utility) 445.979
Power (Captive) 62.267
Steel 12.373
Steel (Boilers) 0.573
Cement 8.926
Fertilizers 2.295
Sponge Iron 7.763
Other basic-Metal 0.440
Chemical 0.331
Pulp & Paper 1.201
Textiles & Rayons 0.268
Bricks 0.077
Others 89.676
Total Despatches 632.169
Colliery Own Consumption 0.335
Total off-take 632.504
1.21 Table 3.11 and 3.12 show details of coal
despatch by type of coal (coking and non-coking) and
grade of coal by each company during the year 2015-
16.
1.22 From Statement 9 it can be seen that
despatch as well as off-take of lignite during 2015-
16 was 42.212 MT. Like coal, lignite was mainly
despatched to power sector and share was 88.94%
of total off-take. Besides this lignite was
despatched to textiles & rayons, pulp & paper,
cement etc. as shown in the statement.
Statement 9: Off-take (MT) of Lignite by Sector in India - 2015-16
Sector Off-take (2015-16) [MT]
Power (Utility) 21.954
Power (Captive) 15.588
Cement 0.248
Chemical 0.269
Pulp & Paper 0.437
Textiles & Rayons 1.728
Bricks 0.393
Others 1.592
Fertilisers 0.003
Total Off-take 42.212
Pit Head Closing Stock
1.23 A complete understanding of production
and despatch of coal requires a discussion on the
pit-head closing stock. It is to be noted that
whenever we talk about pit-head closing stock of
coal we refer to raw coal. From Statement 10 it can
be seen that the pit-head closing stock as on 31-03-
2016 of coal and lignite was 64.793 MT and 4.809
MT respectively.
1.24 Statement 10 provides trend for last ten
years for pit head closing stock of coal and lignite.
It can be seen that in case of coal pit-head closing
stock has been increasing over the years from the
year 2006-07 till 2011-12, however, for the year
2012-13 and 2013-14, it showed decreasing trend.
Thereafter it again showed increasing trend. In
case of lignite, closing stock has been showing
upward trend since the year 2010-11.

9
1.25
1.26 Statement 11 shows pit head closing stock
of coal, of company wise for the year 2014-15 and
2015-16. It can be seen that in 2014-15, CIL
registered an increase of 9.86 % in its Pit head
closing stock of coal in comparison with figure of
2013-14. In the CIL Group, there was significant decline
in closing stock in case of NCL and MCL and marginally
in case of WCL other companies showed increase in
closing stock over the year 2013-14. While SCCL
showed a marginal decrease in closing stock there was
significant decrease in case of private sector. Further
details on this aspect may be seen from Tables 4.1 to
4.3.
Statement 11: Company wise Pit Head Closing Stock (MT) of Coal in India
Company As on
31-03-2015 31-03-2016
(1) (2) (3)
COAL :
ECL 3.451 5.055
BCCL 4.362 4.015
CCL 9.718 11.460
NCL 4.898 6.590
WCL 5.501 8.007
SECL 12.816 11.876
MCL 12.530 10.194
NEC 0.215 0.359
CIL 53.491 57.556
Statement 11: Company wise Pit Head Closing Stock (MT) of Coal in India
Company As on
31-03-2015 31-03-2016
(1) (2) (3)
SCCL 5.348 6.460
Others Public
0.262 0.196
Total Public 59.101 64.212
Total Private
0.297 0.581
ALL INDIA 59.398 64.793
LIGNITE :
Statement 12: Company wise Pit Head Closing Stock (MT) of Lignite in India
NLC 2.842 4.573
GIPCL 0 0
GMDCL 0 0
GHCL 0.023 0.011
RSMML 0 0
VSPPL 0.233 0.031
BLMCL 0.078 0.194
TOTAL 3.176 4.809
Import & Export
1.27 In spite of sufficient coal reserve, we have
not been able to meet our demand from our own
production. Moreover, the supply of high quality
coal (low-ash coal) in the country has been limited.
Therefore, to bridge the demand and supply gap as
well as to provide high quality coal for use in
various industries the country has no option but to
resort to import of coal, especially low-ash coal.
1.28 As per our Import Policy 1993-94, coal has
been put under Open General License (OGL) and
therefore consumers are free to import coal based
on their requirement. Superior quality non-coking
coal is imported mainly by coast-based power
plants and other industrial users viz., paper,
sponge iron, cements and captive power plants, on
consideration of transport logistics, commercial
prudence, export entitlements and inadequate
availability of such superior coal from indigenous
sources.
Statement 10: Pit Head Closing Stock of Coal and Lignite in India in last ten years.
Year Pit Head Closing Stock [MT]
Raw Coal Lignite
2006-07 44.348 1.002
2007-08 46.779 0.328
2008-09 47.317 0.903
2009-10 64.863 0.565
2010-11 72.192 0.610
2011-12 74.040 1.051
2012-13 63.049 1.493
2013-14 55.514 1.860
2014-15 59.389 3.176
2015-16 64.793 4.809

10
1.29 In the year 2015-16, import of raw coal of
the country was 199.884 MT (in value 845035
Million Rupees) against import of 217.783 MT (in
value 1045066 Million Rupees) in 2014-15. Thus in
the year 2015-16, import of coal (in quantity)
decreased by 8.22% during the year 2015-16 over
the previous year. The share of coking and non-
coking coal is given in statement 13.
Statement 13: Import of Coal to India in 2015-16
Type of Coal Quantity [MT] Value [Rs. Million]
Coking 43.506 276630
Non-Coking 156.378 568405
Total 199.884 845035
It can be seen that the share of coking coal in the
total quantity was 21.77% which in value terms
accounted for 32.74 %.
1.30 Statement 14 shows source country wise
import of coal in India in 2015-16. It can be seen
that Indonesia with 48.12% share [96.190 MT]
remained the leading supplier followed by Australia
23.79% [47.557 MT] and South Africa 18.05%
[36.080 MT]. These three countries together
accounted for 89.97% of the total import to India
during the year 2015-16.
Statement 14: Source Country-Wise Import
of Coal to India during 2015-16
Country Quantity [MT] Share
Indonesia 96.190 48.12 %
Australia 47.557 23.79 %
South Africa 36.080 18.05 %
USA 5.744 2.87 %
Russia 3.822 1.91 %
Mozambique 2.665 1.33 %
Canada 1.552 0.78 %
Others 6.274 3.14 %
Total 199.884 100.00%
1.31 The break-up of source country wise Import
for coking and non-coking coal is given in
statement 15 and statement 16 respectively.
Statement 15: Source Country-Wise Import of Coking Coal to India during 2015-16
Country Quantity [MT] % Share
Australia 37.974 87.28 %
Canada 1.355 3.11 %
Mozambique 1.855 4.26 %
USA 1.161 2.67 %
New Zealand 0.620 1.43 %
Others 0.541 1.24 %
Total 43.506 100 %
Statement 16: Source Country-Wise Import of Non-
Coking Coal to India during 2015-16
Country Quantity [MT] Share
Indonesia 96.041 61.42%
South Africa 35.817 22.90%
Australia 9.583 6.13%
USA 4.582 2.93%
Others 10.355 6.62%
Total 156.378 100%
1.32 To comprehend the requirement of coal in
real term, the planning commission of India has
been estimating demand for each year in advance.
However, the actual supply (Despatch + Import –
Export) has been showing variance from these
estimates. Against the estimated demand of coking
coal and non-coking coal the actual despatch,
import and export of coking coal and non-coking
coal during the last five years are given in
Statement 17 and 18 respectively.
Statement 17: Demand*, Despatch, Import and
Export of Coking Coal of India [MT]
Year Demand* Despatch Import Export
2011-12 46.670 51.723 31.801 0.097
2012-13 52.300 55.859 35.557 0.056
2013-14 53.980 58.464 36.872 0.008
2014-15 55.460 56.438 43.715 0.042
2015-16 77.000 59.213 43.506 0.064

11
Statement 18: Demand*, Despatch, Import and
Export
of Non-coking Coal of India [MT]
Year Demand* Despatch Import Export
2011-12 649.360 483.576 71.052 1.917
2012-13 720.540 511.277 110.228 2.387
2013-14 715.710 513.596 129.985 2.180
2014-15 731.570 547.334 174.068 1.196
2015-16 833.000 572.956 156.378 1.186
*Source: Annual Plan, MOC
1.33 Export of Coal: Although, there was short
supply of coal in India compared to its demand and
it had to resort to import of coal, India exported
some quantity of coal to its neighboring countries
during the year 2015-16 (Statement 19). It can be
seen from the statement that the total export was
1.250 MT. Export to Bangladesh was 0.611 MT
(48.88 %) followed by Nepal 0.440 MT (35.20 %)
and United Arab Emirates 0.067 MT (5.36 %).
Statement 19: Export of Coal by India to different
countries during 2015-16
Country Quantity [MT] % Share
Bangladesh PR 0.611 48.88
Nepal 0.440 35.20
United Arab Emts 0.067 5.36
Bhutan 0.066 5.28
Iran 0.064 5.12
Others 0.002 0.14
Total 1.250 100
1.34 The break-up of country wise Export for
coking and non-coking coal is given in Statement
20 and 21 respectively.
Statement 20: Export of Coking Coal from India to
different countries during 2015-16
Country Quantity [MT] % Share
Iran 0.064 100
Total 0.064 100
Statement 21: Export of Non-coking Coal from India to
different countries during 2015-16
Country Quantity [MT] Share
Bangladesh PR 0.611 51.52%
Nepal 0.440 37.10%
United Arab Emts 0.067 5.65%
Bhutan 0.066 5.55%
Others 0.002 0.17%
Total 1.186 100%
Captive Coal Blocks
1.35 The policy of the allotment of Captive Coal
Blocks was adopted by the Government of India in the
year 1993 and as per this policy by the end of 2013-14,
out of total allocated 218 coal blocks, 80 coal blocks
were de-allocated. Thus at the end of 2013-14, 138 coal
blocks and 28 lignite blocks remained allocated under
the category of Captive Coal Block. During the year
2014-15 by virtue of judgment dated 25.08.2014 read
with the order dated 24.09.2014 of the Hon’ble Supreme
Court of India, out of 218 captive coal blocks, allocation
of 204 coal blocks were cancelled except allocation of
12 coal blocks for UMPPs and one coal block each
allocated to NTPC and SAIL.
1.36 Further, allocation of four coal blocks for
UMPPs, namely, Chhatrasal coal block cancelled on
07.05.2015 and Meenakshi, Meenakshi B and Dip side
of Meenakshi blocks of UMPP cancelled on
15.12.2015. As such as on date 10 coal blocks
allocated through earlier dispensations stand allocated.
1.37 Subsequent to the order of the Hon’ble
Supreme Court of India, 42 nos. of producing coal
blocks [Schedule II coal mines as per the Coal Mines
(Special Provisions) Ordinance, 2014 replaced by the
Coal Mines (Special Provision) Act, 2015] were allowed
to produce coal up to 31.03.2015. Thus total number of
blocks stand allocated from 25.09.2014 to 31.03.2015
was 52 [42 + 10 earlier coal blocks]
.
1.38 As per Coal Mines (Special Provisions) Act,
2015, allocation of Schedule-I coal mines started by way
of Public Auction or on the basis of Competitive Bids for
Tariff. Up to 31.03.2016 re-allocation (either vested or

12
allotted) was done in respect of 71 coal blocks. 07 nos.
of coal blocks have been given to Coal India Limited and
01 block has been given to OCL Iron & Steel Ltd as
Custodian, but only 02 blocks (Gare Palma IV/2 & 3)
have started production.
1.39 In 2015-16, Moher, Moher Amlori block which
was not cancelled continued production, 08 coal blocks
vested/allotted started production and 02 blocks under
custodian of CIL also started production. From these 12
coal blocks, the production of coal is 31.101 MT in 2015-
16.
1.40 Under the “Auction by Competitive Bidding
Rules, 2012”, 10 regionally explored coal blocks have
been allotted to Central/State Government companies.
In addition, 04 regionally explored lignite blocks have
also been allotted to Government companies of
Government of Gujarat.
1.41 Therefore, as on 31.03.2016, numbers of coal
blocks stand exist as 99 (vested/allotted -71 +
Custodian – 08 + Under Auction by Competitive Bidding
Rules, 2012 – 10 and blocks not cancelled – 10)

050
100150200250300350400450500550600650
2006-07 2007-08 2008-09 2009-10 2010-11 2011-12 2012-13 2013-14 2014-15 2015-16(P)
Qua
ntity
(M
ill. T
onne
s)
Chart-II : RAW COAL PRODUCTION, DESPATCHES & STOCK LAST TEN YEARS
Production Despatches Cl. Stock
0
10
20
30
40
50
2006-07 2007-08 2008-09 2009-10 2010-11 2011-12 2012-13 2013-14 2014-15 2015-16(P)
Qua
ntity
(M
ill. T
onne
s)
Chart-III : LIGNITE PRODUCTION, DESPATCHES & STOCK LAST TEN YEARS
Production Despatches Cl. Stock
0
10
20
30
40
50
60
70
80
Apr-15 May-15 Jun-15 Jul-15 Aug-15 Sep-15 Oct-15 Nov-15 Dec-15 Jan-16 Feb-16 Mar-16
Qua
ntity
(M
ill.T
onne
s )
Chart-I : MONTH-WISE RAW COAL PRODUCTION, DESPATCHES & STOCK
IN INDIA, 2015-16
Production
Despatches
Closing Stock
13

0102030405060708090
100110120130140150
Qua
ntity
(M
ill. T
onne
s)
Companies
Chart -IV : Sectorwise Despatches of Raw Coal from different companies in 2015-16
Power (Utility) Power (Captive)
Steel Cement
Fertilisers Sponge Iron
Pulp & Paper Bricks
Other Colliery Consumption
17.8
77
22.0
29
21.0
80
24.6
90
19.4
84
31.8
01
35.5
57
36.8
72
43.7
15
43.5
06
25.2
04
27.7
65
37.9
23
48.5
65
49.4
34 71
.052
110.
228 129.
985
174.
068
156.
378
4.68
6
4.24
8
1.88
1
2.35
5
1.49
0
2.36
5
3.08
1
4.17
1
3.29
4
3.06
8 0
20
40
60
80
100
120
140
160
180
200
2006-07 2007-08 2008-09 2009-10 2010-11 2011-12 2012-13 2013-14 2014-15 2015-16
Qua
ntity
(M
ill. T
onne
s)
Chart - V : Import of Coal (Coking and Non-coking) and Coke during last Ten Years
Coking Coal Non-Coking Coal Coke
0.10
7
0.03
6
0.10
9
0.27
0
0.11
1
0.09
7
0.05
6
0.00
8
0.04
2
0.06
4
1.44
7
1.59
1
1.54
6
2.18
0
1.76
4
1.91
7 2.38
7
2.18
0
1.19
6
1.18
6
0.07
6
0.09
7
1.33
8
0.12
9
0.72
9
0.61
3
1.20
1
0.15
4
0.10
2
0.10
3
0
1
2
3
4
2006-07 2007-08 2008-09 2009-10 2010-11 2011-12 2012-13 2013-14 2014-15 2015-16
Qua
ntity
(M
ill. T
onne
s)
Chart - VI : Export of Coal (Coking and Non-coking) and Coke during last Ten Years
Coking Coal Non-Coking Coal Coke
14

Table 1.1: All India Coal Demand (BE) and Supply - Sectorwise: 2015-16
Indigenous Import Total
I. Coking Coal
1Steel / Coke Oven/ Private
CokeriesN.A. 12.95 12.95 -
2 Import N.A. 43.51 43.51 -
Sub Total (Raw Coal) 77.00 12.95 43.51 56.45 73.3%
II. Non Coking Coal
3 Power (Utilities) 604.00 445.98 445.98 73.8%
4 Power (Captive) [CPP]* 69.00 64.56 64.56 93.6%
5 Sponge Iron 34.00 7.76 7.76 22.8%
6 Cement 38.00 8.93 8.93 23.5%
7 Others 88.00 91.99 91.99 104.5%
8 Coll. Consumption 0.34 0.34 -
Sub-total (Raw Coal) 833.00 619.56 156.38 775.94 93.1%
III. Total Raw Coal Offtake 910.00 632.50 199.88 832.39 91.5%
Note:
1 Sectorwise Demand as per Annual Plan of Min. of Coal, GOI.
2 Import of Coal (Provisional) for the year 2015-16 (Source DGCIS)
* CPP includes despatch to Fertilizer Sector.
Table 1.2: Supply Plan of Indigenous Coal - Sourcewise in 2015-16
(Quantity in MillionTonnes)
Source of SupplySupply Plan
(BE)
Actual
supplyAchievement
1 ECL 42.13 38.606 91.6%
2 BCCL 38.85 36.213 93.2%
3 CCL 60.60 59.583 98.3%
4 NCL 78.10 78.532 100.6%
5 WCL 45.10 42.310 93.8%
6 SECL 137.00 136.596 99.7%
7 MCL 150.00 140.219 93.5%
8 NEC 1.22 0.342 28.0%
9 Total CIL 553.00 532.401 96.3%
10 SCCL 56.00 58.272 104.1%
11 Others 94.00 41.831 44.5%
All India Indigenous Coal Supply 703.00 632.504 90.0%
Total Coal Supply / Availabilty BE (2015-16) Actual Achievement
a. Demand 910.00 832.39 91.5%
b. Indegenous Supply 703.00 632.50 90.0%
c. Materialisation through Import 207.00 199.88 96.6%
d. Total Supply/ Availabilty 910.00 832.39 91.5%
e. Overall Demand - Supply Gap 0 78
Demand & Supply Plan is as per Annual Plan 2015-16 of MOC and Actual is from Sectorwise Off-take table.
(Quantity in MillionTonnes)
SectorDemand
( BE )
Actual SupplyAchievement
15

Table 1.3: Indigenous Coal Supply Plan (BE) & Achievement : 2015-16
(Quantity in MillionTonnes)
CIL SCCL Others Total CIL SCCL Others Total CIL SCCL Others Total
I. Coking Coal
1 Steel (Indigenious) 6.72 0.00 13.87 20.59 5.911 0.117 6.918 12.946 88% 50% 63%
2 Private Cokeries/
Sub Total (R/C) 6.72 0.00 13.87 20.59 5.911 0.117 6.918 12.946 88% 50% 63%
II. Non Coking Coal
3 Power (Utilities) 430.00 36.00 6.28 472.28 398.201 47.563 0.215 445.979 93% 132% 3% 94%
4 Power (Captive) CPP)# 36.18 4.20 38.15 78.53 33.872 2.110 28.580 64.562 94% 50% 75% 82%
5 Sponge Iron/ CDI 9.77 0.62 6.92 17.31 7.537 0.098 0.128 7.763 77% 16% 2% 45%
6 Cement 6.65 7.50 0.04 14.19 5.226 3.668 0.032 8.926 79% 49% 80% 63%
7 Others 60.32 7.60 28.71 96.63 81.354 4.682 5.957 91.993 135% 62% 21% 95%
8 Coll. Consumption 0.37 0.08 0.00 0.45 0.300 0.034 0.001 0.335 81% 43% 74%
Sub-total (R/C) 543.29 56.00 80.10 679.39 526.490 58.155 34.913 619.558 97% 104% 44% 91%
III. Total Raw Coal 550.01 56.00 93.97 699.98 532.401 58.272 41.831 632.504 97% 104% 45% 90%
$ Based on Annual Plan 2015-16 of MOC.
# CPP Includes Despatch to Fertilizer Sector.
SectorBE (2015-16) $ Actual Achievement ( %)
16

TABLE 1.4 : BALANCE SHEET OF AVAILABILITY AND SUPPLY OF RAW COAL & LIGNITE DURING 2014-15 & 2015-16
(Quantity in Million Tonnes)
2014-15 2015-16Supply
(within India)
(A) Production
Coking Coal 57.446 60.887
Non-coking Coal 551.733 578.347
Lignite 48.270 43.843 Steel & Washery 12.522 0.023 43.715 56.260 12.946 0.000 43.506 56.452
Total 657.449 683.077 Power (Utility+Captive) 497.701 39.473 N.A. 537.174 508.246 37.809 N.A. 546.055
(B) Change of Vendible Stock (Closing - 0pening) Cement 11.357 1.274 N.A. 12.631 8.926 0.248 N.A. 9.174
Coking Coal 0.552 1.759 Textile 0.415 2.887 3.302 0.268 1.728 1.996
Non-coking Coal 3.323 3.645 Sponge Iron 17.766 17.766 7.763 7.763
Lignite 1.316 1.633 Fertilizer & Chem. 2.293 0.379 2.672 2.626 0.272 2.898
Total Change (Cl - Op) 5.191 7.037 Paper 1.648 0.650 2.298 1.201 0.437 1.638
(C) Import Brick 0.091 0.671 0.762 0.077 0.393 0.470
Coking Coal 43.715 43.506 Others 59.979 1.597 156.378 217.954 90.116 1.325 156.378 247.819
Non-coking Coal 156.378 156.378 Colliery Consmn. 0.576 0.576 0.335 0.335
Total Raw Coal 200.094 199.884 Total Off-take 604.348 46.954 200.094 851.396 632.504 42.212 199.884 874.600
(D) Export 1.238 1.250
Statistical Difference -0.282 0.074
851.113 874.675 Total Supply 851.113 874.675
Total
(E) Total
Availability
2015-16
Raw Coal LigniteImporte
d CoalTotal
Note: It is assumed that there is no change in industrial stock. Washed coal has been converted into raw coal equivalent. In Coal Directory
closing balance of a year is taken as openibg balance of next year. However it is noted that there is a significant change between closing stock of
last year and opening stock of this year. This resulted an increase (in absolute terms) in Statistical difference.
Raw Coal LigniteImported
Coal
2014-15
Sectors
Availability
(within India)
17

TABLE-1.5 : TOTAL PRIMARY SUPPLY (TPS) OF COAL & LIGNITE : 2006-07 to 2015-16 (Mill Tonnes)
Year Fuel type Production Imports Exports Net ImportOpening
Stock
Closing
Stock
Stock
ChangeT P S
(1) (2) (3) (4) (5) (6) (7) (8) (9) (10)
Coal 430.832 43.081 1.554 41.527 34.334 44.348 -10.014 462.345
Lignite 31.285 0.000 0.525 1.002 -0.477 30.808
Total 462.117 43.081 1.554 41.527 34.859 45.350 -10.491 493.153
Coal 457.082 49.794 1.627 48.167 44.348 46.779 -2.431 502.818
Lignite 33.980 0.000 1.002 0.328 0.674 34.654
Total 491.062 49.794 1.627 48.167 45.350 47.107 -1.757 537.472
Coal 492.757 59.003 1.655 57.348 46.779 47.317 -0.538 549.567
Lignite 32.421 0.000 0.328 0.903 -0.575 31.846
Total 525.178 59.003 1.655 57.348 47.107 48.220 -1.113 581.413
Coal 532.042 73.255 2.454 70.801 47.317 64.863 -17.546 585.297
Lignite 34.071 0.903 0.565 0.338 34.409
Total 566.113 73.255 2.454 70.801 48.220 65.428 -17.208 619.706
Coal 532.694 68.918 4.409 64.509 64.863 72.192 -7.329 589.874
Lignite 37.733 0.565 0.610 -0.045 37.688
Total 570.427 68.918 4.409 64.509 65.428 72.802 -7.374 627.562
Coal 539.950 102.853 2.014 100.839 72.192 74.040 1.848 642.637
Lignite 42.332 0.610 1.051 0.441 42.773
Total 582.282 102.853 2.014 100.839 72.802 75.091 2.289 685.410
Coal 556.402 145.785 2.443 143.342 74.040 63.049 -10.991 688.753
Lignite 46.453 0.001 0.069 -0.068 1.051 1.493 0.442 46.827
Total 602.855 145.786 2.512 143.274 75.091 64.542 -10.549 735.580
Coal 565.766 168.439 2.153 166.286 63.049 55.178 -7.871 724.181
Lignite 44.271 0.001 0.002 -0.001 1.493 1.860 0.367 44.637
Total 610.037 168.440 2.155 166.285 64.542 57.038 -7.504 768.818
Coal 612.435 212.103 1.238 210.865 55.178 59.389 4.211 827.511
Lignite 48.257 0.001 0.003 -0.002 1.860 3.176 1.316 49.571
Total 660.692 212.104 1.241 210.863 57.038 62.565 5.527 877.082
Coal 639.234 199.884 1.250 198.635 59.389 64.793 5.404 843.273
Lignite 43.843 0.001 0.001 0.001 3.176 4.809 1.633 45.477
Total 683.077 199.885 1.250 198.635 62.565 69.602 7.037 888.749
Note: Total Primary Supply is estimated as sum of indegenous production, Net Import & Stock Change.
For simplicity, only stock change of pit head stock is taken.
2010-11
2011-12
2012-13
2013-14
2014-15
2015-16
2006-07
2007-08
2008-09
2009-10
18

TABLE - 1.6: INVENTORY OF GEOLOGICAL RESERVE OF COAL BY TYPE AS ON 1st
APRIL 2014, 2015 & 2016
Proved Indicated Inferred Total
(1) (2) (3) (4) (5) (6)
Prime Coking 01/04/2014 4,614 699 0.00 5,313
01/04/2015 4,614 699 0.00 5,313
01/04/2016 4,614 699 0.00 5,313
Medium Coking 01/04/2014 13,303 11,867 1,879 27,049
01/04/2015 13,389 12,114 1,879 27,382
01/04/2016 13,389 12,114 1,879 27,382
Blendable / Semi Coking 01/04/2014 482 1,004 222 1,708
01/04/2015 482 1,004 222 1,708
01/04/2016 482 1,004 222 1,708
Non Coking (Including 01/04/2014 1,07,509 1,28,937 31,047 2,67,494
High Sulphur ) 01/04/2015 1,13,129 1,29,425 29,638 2,72,192
01/04/2016 1,19,602 1,25,335 29,462 2,74,398
Total 01/04/2014 * 1,25,909 1,42,506 33,148 3,01,564
01/04/2015 * 1,31,614 1,43,241 31,739 3,06,596
01/04/2016 * 1,38,087 1,39,151 31,563 3,08,802
* Including Sikkim
Source: Geological Survey of India
Type of Coal As onReserve (Quantity in Million Tonnes)
Prime Coking
3.34%
Medium Coking
9.70%
Semi Coking
0.35%
Non Coking
86.61%
DISTRIBUTION OF PROVED RESERVE OF COAL
IN INDIA AS ON 01/04/2016
19

TABLE - 1.7: STATEWISE INVENTORY OF GEOLOGICAL RESOURCES OF COAL AS ON 1st APRIL 2014, 2015 & 2016
(Quantity in Million Tonnes)
Proved Indicated Inferred Total Proved Indicated Inferred Total
(1) (2) (3) (4) (5) (6) (1) (2) (3) (4) (5) (6)
GONDAWANA COALFIELDS TERTIARY COAL FIELDS
ASSAM 1/4/2014 0 4 0 4 ARUNACHAL 1/4/2014 31 40 19 90
1/4/2015 0 4 0 4 PRADESH 1/4/2015 31 40 19 90
1/4/2016 0 14 0 14 1/4/2016 31 40 19 90
ANDHRA PRADESH 1/4/2014 9,729 9,670 3,068 22,468 ASSAM 1/4/2014 465 43 3 511
1/4/2015 0 1,149 432 1,581 1/4/2015 465 43 3 511
1/4/2016 0 1,149 432 1,581 1/4/2016 465 43 3 511
JHARKHAND 1/4/2014 41,377 32,780 6,559 80,716 MEGHALAYA 1/4/2014 89 17 471 576
1/4/2015 41,463 33,026 6,559 81,049 1/4/2015 89 17 471 576
1/4/2016 42,323 32,301 6,548 81,172 1/4/2016 89 17 471 576
BIHAR 1/4/2014 0 0 160 160 NAGALAND 1/4/2014 9 0 307 315
1/4/2015 0 0 160 160 1/4/2015 9 0 307 315
1/4/2016 0 0 160 160 1/4/2016 9 0 307 315
MADHYA PRADESH 1/4/2014 10,411 12,382 2,879 25,673 TERTIARY 1/4/2014 594 99 799 1,493
1/4/2015 10,411 12,784 3,341 26,536 Coalfields 1/4/2015 594 99 799 1,493
1/4/2016 10,918 12,696 3,293 26,907 1/4/2016 594 99 799 1,493
CHHATTISGARH 1/4/2014 16,052 33,253 3,228 52,533 INDIA 1/4/2014 1,25,909 1,42,506 33,148 3,01,564
1/4/2015 18,237 34,390 2,285 54,912 1/4/2015 1,38,087 1,39,151 31,563 3,08,801
1/4/2016 19,136 34,614 2,287 56,036 1/4/2016 1,38,087 1,39,151 31,564 3,08,802
MAHARASHTRA 1/4/2014 5,667 3,186 2,110 10,964 Singrimari coalfield of Assam (Non-Coking) is included in
1/4/2015 5,953 3,190 2,110 11,253 Gondawana coalfield, not considered in Tertiary coalfields.
1/4/2016 6,208 3,151 2,077 11,436
ODISHA 1/4/2014 27,791 37,873 9,408 75,073
1/4/2015 30,747 36,545 8,507 75,799
1/4/2016 34,295 33,284 8,318 75,896
SIKKIM 1/4/2014 0 58 43 101
1/4/2015 0 58 43 101
1/4/2016 0 58 43 101
UTTAR PRADESH 1/4/2014 884 178 0 1,062
1/4/2015 884 178 0 1,062
1/4/2016 884 178 0 1,062
TELANGANA 1/4/2015 9,807 9957 3029 22,792
1/4/2016 10,128 8,586 2,700 21,415
WEST BENGAL 1/4/2014 13,403 13,022 4,893 31,318
1/4/2015 12,864 12,588 4,739 30,190
1/4/2016 13,602 13,021 4,907 31,529
GONDAWANA 1/4/2014 1,25,315 1,42,407 32,350 3,00,072
1/4/2015 1,37,493 1,39,052 30,764 3,07,310
1/4/2016 1,37,493 1,39,052 30,764 3,07,309
Source: Geological Survey of India Data may not add up to respective total due to rounding off.
State As onResources
State As onResources
20

Proved Indicated Inferred Total
(2) (1) (3) (4) (5) (6)
Gujarat 01/04/2014 1278.65 283.70 1159.70 2722.05
01/04/2015 1278.65 283.70 1159.70 2722.05
01/04/2016 1278.65 283.70 1159.70 2722.05
J & K 01/04/2014 0.00 20.25 7.30 27.55
01/04/2015 0.00 20.25 7.30 27.55
01/04/2016 0.00 20.25 7.30 27.55
Kerala 01/04/2014 0.00 0.00 9.65 9.65
01/04/2015 0.00 0.00 9.65 9.65
01/04/2016 0.00 0.00 9.65 9.65
Pondicherry 01/04/2014 0.00 405.61 11.00 416.61
01/04/2015 0.00 405.61 11.00 416.61
01/04/2016 0.00 405.61 11.00 416.61
Rajasthan 01/04/2014 1167.02 2671.93 1881.39 5720.35
01/04/2015 1168.53 2670.84 1887.34 5726.71
01/04/2016 1168.53 2670.84 1896.60 5735.97
Tamilnadu 01/04/2014 3735.23 22900.05 7712.43 34347.71
01/04/2015 3735.23 22900.05 8573.62 35208.90
01/04/2016 3735.23 22991.17 8953.53 35679.93
West Bengal 01/04/2014 0.00 1.13 1.64 2.77
01/04/2015 0.00 1.13 1.64 2.77
01/04/2016 0.00 1.13 1.64 2.77
All India 01/04/2014 6180.90 26282.67 10783.11 43246.68
01/04/2015 6182.41 26281.58 11650.25 44114.24
01/04/2016 6182.41 26372.70 12039.42 44594.53
Note: Figures compiled by Neyveli Lignite Corporation Ltd.
TABLE - 1.8 : STATEWISE INVENTORY OF GEOLOGICAL RESERVE OF LIGNITE
AS ON 1st APRIL 2014, 2015 & 2016
State As onResources (Quantiry in Million Tonnes)
21
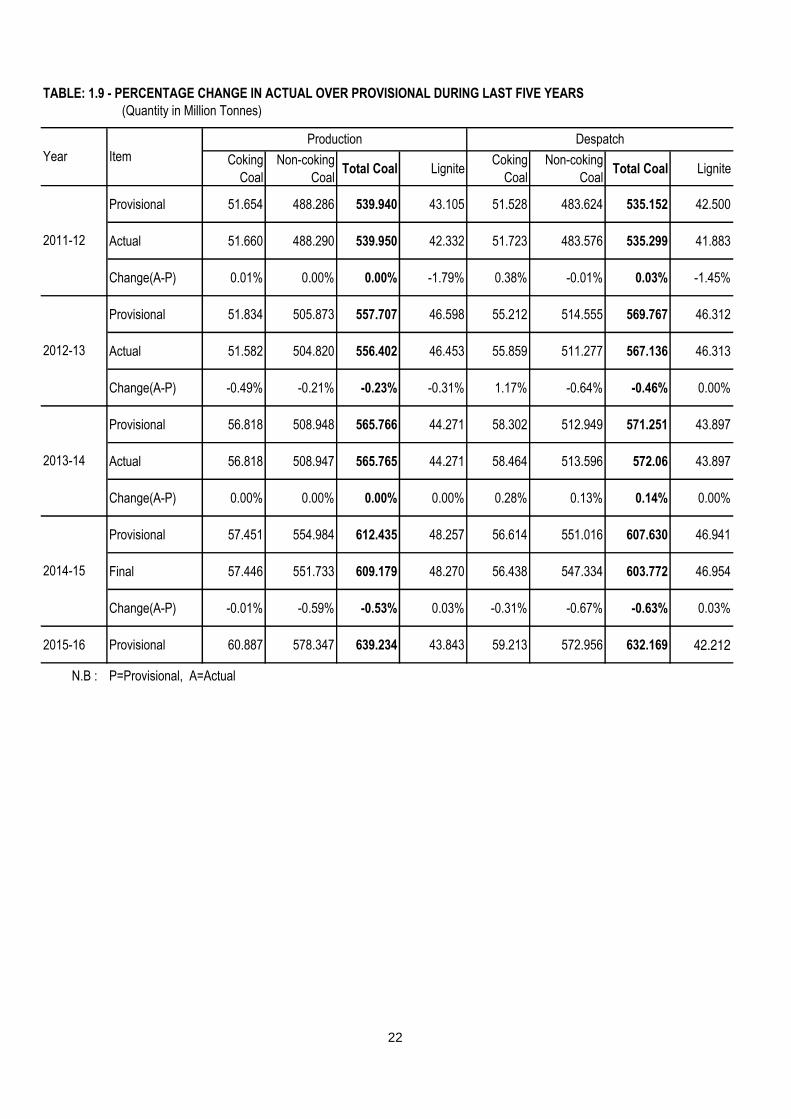
TABLE: 1.9 - PERCENTAGE CHANGE IN ACTUAL OVER PROVISIONAL DURING LAST FIVE YEARS
(Quantity in Million Tonnes)
Coking
Coal
Non-coking
CoalTotal Coal Lignite
Coking
Coal
Non-coking
CoalTotal Coal Lignite
Provisional 51.654 488.286 539.940 43.105 51.528 483.624 535.152 42.500
Actual 51.660 488.290 539.950 42.332 51.723 483.576 535.299 41.883
Change(A-P) 0.01% 0.00% 0.00% -1.79% 0.38% -0.01% 0.03% -1.45%
Provisional 51.834 505.873 557.707 46.598 55.212 514.555 569.767 46.312
Actual 51.582 504.820 556.402 46.453 55.859 511.277 567.136 46.313
Change(A-P) -0.49% -0.21% -0.23% -0.31% 1.17% -0.64% -0.46% 0.00%
Provisional 56.818 508.948 565.766 44.271 58.302 512.949 571.251 43.897
Actual 56.818 508.947 565.765 44.271 58.464 513.596 572.06 43.897
Change(A-P) 0.00% 0.00% 0.00% 0.00% 0.28% 0.13% 0.14% 0.00%
Provisional 57.451 554.984 612.435 48.257 56.614 551.016 607.630 46.941
Final 57.446 551.733 609.179 48.270 56.438 547.334 603.772 46.954
Change(A-P) -0.01% -0.59% -0.53% 0.03% -0.31% -0.67% -0.63% 0.03%
2015-16 Provisional 60.887 578.347 639.234 43.843 59.213 572.956 632.169 42.212
N.B : P=Provisional, A=Actual
2014-15
2011-12
Item
2013-14
2012-13
Year
Production Despatch
22

TABLE - 2.1: TRENDS OF PRODUCTION OF COAL AND LIGNITE DURING LAST TEN YEARS
(Quantity in Million Tonnes)
Production Growth (%) ProductionGrowth
(%)Production Growth (%)
(1) (2) (3) (4) (5) (6) (7)
2006-07 430.832 5.85 31.285 3.50 462.117 5.68
2007-08 457.082 6.09 33.980 8.61 491.062 6.26
2008-09 492.757 7.80 32.421 4.59 525.178 6.95
2009-10 532.042 7.97 34.071 5.09 566.113 7.79
2010-11 532.694 0.12 37.733 10.75 570.427 0.76
2011-12 539.950 1.36 42.332 12.19 582.282 2.08
2012-13 556.402 3.05 46.453 9.73 602.855 3.53
2013-14 565.765 1.68 44.271 -4.70 610.036 1.19
2014-15 609.179 7.67 48.270 9.03 657.449 7.77
2015-16 639.234 4.93 43.843 -9.17 683.077 3.90
TABLE - 2.2 : TRENDS OF PRODUCTION OF COAL BY TYPE DURING LAST TEN YEARS
(Quantity in Million Tonnes)
Production Growth Production Growth Production Growth Production Growth
(1) (2) (3) (4) (5) (6) (7) (8) (9)
2006-07 17.231 0.63 32.097 1.86 398.735 6.18 430.832 5.85
2007-08 18.065 4.84 34.455 7.35 422.627 5.99 457.082 6.09
2008-09 17.301 -4.20 33.809 1.00 457.948 8.40 492.757 7.84
2009-10 17.731 2.49 44.413 31.36 487.629 6.48 532.042 7.97
2010-11 17.695 -0.20 49.547 11.56 483.147 -0.92 532.694 0.12
2011-12 16.239 -8.23 51.660 4.26 488.290 1.06 539.950 1.36
2012-13 14.547 -10.42 51.582 -0.15 504.820 3.39 556.402 3.05
2013-14 15.114 3.90 56.818 10.15 508.947 0.82 565.765 1.68
2014-15 13.784 -8.80 57.446 1.11 551.733 8.41 609.179 7.67
2015-16 14.842 7.68 60.887 5.99 578.347 4.82 639.234 4.93
Note: Growth of year is calculated as percentage of increase or decrease (-) over last year
Raw CoalYear
Raw Coal LigniteYear
Total Solid Fossil Fuel
Metallurgical Coal Total Coking Coal Non Coking Coal
23

TABLE - 2.3 : TREND OF PRODUCTION OF COAL PRODUCTS BY TYPE DURING LAST TEN YEARS
(Million Tonnes) (Quantity in Million Tonnes)
Production Growth Production Growth Production Growth Production Growth Production Growth
(1) (2) (3) (4) (5) (6) (7) (8) (9) (10) (11)
2006-07 7.025 -16.1 12.688 1.1 5.876 5.3 2.858 2.3 12.566 -5.9
2007-08 7.171 2.1 12.686 0.0 6.150 4.7 3.276 14.6 12.542 -0.2
2008-09 7.181 0.1 13.550 6.8 5.294 -13.9 3.264 -0.4 12.619 0.6
2009-10 6.547 -8.8 13.963 3.0 4.642 -12.3 3.264 0.0 12.663 0.3
2010-11 6.955 6.2 14.531 4.1 4.643 0.0 3.589 10.0 12.880 1.7
2011-12 6.496 -6.6 15.437 6.2 3.674 -20.9 3.669 2.2 14.330 11.3
2012-13 6.550 0.8 14.190 -8.1 5.464 48.7 3.825 4.3 11.694 -18.4
2013-14 6.614 1.0 15.699 10.6 4.913 -10.1 3.926 2.6 12.606 7.8
2014-15 6.011 -9.1 17.294 10.2 4.721 -3.9 3.742 -4.7 14.355 13.9
2015-16 6.182 2.8 17.119 -1.0 5.525 17.0 0 * - 14.178 -1.2
Note:
1. All the above figures of Washed Coal & Middling relate to coal companies (private& public). Washeries not
owned by coal companies are not included here.
2. Hard Coke data relate to steel plants only. Private sector are not covered as data are not readily available.
* JSPL & SEML Companies (sources of Middlings Non-coking) are ceased to exist any more.
Hard Coke
Year
Washed Coal
(Coking)
Washed Coal (Non-
Coking)
Middlings
(Coking)
Middlings
(Non-Coking)
24

TABLE 2.4: MONTHLY PRODUCTION OF DIFFERENT TYPES OF RAW COAL AND LIGNITE IN 2015-16
(Quantity in Million Tonnes)
Prdn Growth* Share** Prdn Growth* Share** Prdn Growth* Share** Prdn Growth* Share**
(1) (2) (3) (4) (5) (6) (7) (8) (9) (10) (11) (12) (13)
2015-16
Apr-15 4.616 -1.1 7.6 44.022 7.9 7.6 48.638 7.0 7.6 2.927 -24.6 6.7
May-15 4.546 -5.9 7.5 44.993 11.0 7.8 49.539 9.2 7.7 3.554 -24.6 8.1
Jun-15 4.388 2.0 7.2 42.297 7.9 7.3 46.685 7.3 7.3 3.484 -18.2 7.9
1st Quarter 13.550 -1.8 22.3 131.312 8.9 22.7 144.862 7.8 22.7 9.965 -22.5 22.7
Jul-15 4.155 6.5 6.8 38.036 0.0 6.6 42.191 0.6 6.6 3.077 -0.5 7.0
Aug-15 4.264 3.2 7.0 39.431 0.7 6.8 43.695 1.0 6.8 3.393 -2.0 7.7
Sep-15 4.365 6.0 7.2 40.691 2.4 7.0 45.056 2.8 7.0 3.114 6.5 7.1
2nd Quarter 12.784 5.2 21.0 118.158 1.1 20.4 130.942 1.5 20.5 9.584 1.1 21.9
Oct-15 4.759 4.5 7.8 47.349 5.5 8.2 52.108 5.4 8.2 3.679 25.2 8.4
Nov-15 5.266 9.0 8.6 51.598 4.3 8.9 56.864 4.8 8.9 2.327 -30.7 5.3
Dec-15 5.831 16.2 9.6 55.656 4.5 9.6 61.487 5.5 9.6 3.052 -26.0 7.0
3rd Quarter 15.856 10.1 26.0 154.603 4.8 26.7 170.459 5.2 26.7 9.058 -13.1 20.7
Jan-16 5.890 13.6 9.7 56.860 8.3 9.8 62.750 8.8 9.8 4.434 -3.4 10.1
Feb-16 6.065 11.8 10.0 54.192 3.3 9.4 60.257 4.1 9.4 5.068 7.6 11.6
Mar-16 6.742 4.0 11.1 63.222 2.4 10.9 69.964 2.5 10.9 5.734 -7.8 13.1
4th Quarter 18.697 9.4 30.7 174.274 4.6 30.1 192.971 5.0 30.2 15.236 -1.8 34.8
2015-16 60.887 6.0 106.0 578.347 4.8 104.8 639.234 4.9 104.9 43.843 -9.2 90.8
Note: (1) *Growth (%) is calculated over similar period of last year.
(2) **Share (%) is caculated as ratio to yearly production. Cont….
MONTHCoking Coal Non-coking Coal Raw Coal Lignite
25

TABLE 2.5: MONTHLY PRODUCTION OF DIFFERENT TYPES OF COAL PRODUCTS IN 2015-16
Prdn Growth* Share** Prdn Growth* Share** Prdn Growth* Share** Prdn Growth* Share** Prdn Growth* Share**
(1) (2) (3) (4) (5) (6) (7) (8) (9) (10) (11) (12) (13) (14) (15) (16)
2015-16
Apr-15 0.492 -6.5 8.0 1.049 1.5 6.1 0.427 23.8 7.7 0.000 0.0 0.0 1.225 8.8 8.6
May-15 0.508 4.3 8.2 1.156 -10.4 6.8 0.377 15.6 6.8 0.000 0.0 0.0 1.257 3.4 8.9
Jun-15 0.487 1.2 7.9 1.248 -9.2 7.3 0.438 26.6 7.9 0.000 0.0 0.0 1.217 8.7 8.6
1st Quarter 1.487 -0.5 24.1 3.453 -6.7 20.2 1.242 22.1 22.5 0.000 0.0 0.0 3.699 6.8 26.1
Jul-15 0.507 5.8 8.2 1.142 -22.9 6.7 0.456 18.4 8.3 0.000 0.0 0.0 1.244 4.7 8.8
Aug-15 0.488 10.2 7.9 1.141 -12.5 6.7 0.406 9.1 7.3 0.000 0.0 0.0 1.246 3.3 8.8
Sep-15 0.527 -0.4 8.5 1.509 10.5 8.8 0.378 -2.1 6.8 0.000 0.0 0.0 1.169 -3.1 8.2
2nd Quarter 1.522 4.9 24.6 3.792 -8.6 22.2 1.240 8.5 22.4 0.000 0.0 0.0 3.659 1.6 25.8
Oct-15 0.506 0.6 8.2 1.440 -6.3 8.4 0.502 27.4 9.1 0.000 0.0 0.0 1.136 0.8 8.0
Nov-15 0.525 3.1 8.5 1.546 4.6 9.0 0.483 15.3 8.7 0.000 0.0 0.0 1.181 4.0 8.3
Dec-15 0.577 9.3 9.3 1.640 -4.5 9.6 0.540 26.2 9.8 0.000 0.0 0.0 1.124 -9.1 7.9
3rd Quarter 1.608 4.4 26.0 4.626 -2.2 27.0 1.525 22.9 27.6 0.000 0.0 0.0 3.441 -1.7 24.3
Jan-16 0.551 -0.5 8.9 1.901 12.6 11.1 0.531 22.9 9.6 0.000 0.0 0.0 1.188 -7.3 8.4
Feb-16 0.513 3.6 8.3 1.514 3.8 8.8 0.454 16.1 8.2 0.000 0.0 0.0 1.015 -13.1 7.2
Mar-16 0.501 -6.5 8.1 1.833 16.9 10.7 0.533 1.3 9.6 0.000 0.0 0.0 1.176 -8.1 8.3
4th Quarter 1.565 -1.3 25.3 5.248 11.3 30.7 1.518 12.5 27.5 0.000 0.0 0.0 3.379 -9.4 23.8
2015-16 6.182 1.8 101.8 17.119 -1.0 99.0 5.525 16.3 116.3 0.000 0.0 0.0 14.178 -0.8 99.2
Note: (1) *Growth (%) is calculated over similar period of last year.
(2) **Share (%) is caculated as ratio to yearly production.
(3) All the above figures of Washed Coal & Middling relate to coal companies (private& public). Washeries not owned by coal
companies are not included here.
(4) Hard Coke data relate to steel plants only.
# JSPL & SEML Companies (sources of Middlings Non-coking) are ceased to exist any more.
MONTHWashed Coal(Coking) Washed Coal(N-coking) Middlings(coking) Middlings(N-coking) # Hard Coke
(Quantity in Million Tonnes)
26

TABLE 2.6 : SHARE OF RAW COAL PRODUCTION BY STATES IN LAST TEN YEARS
(Quantity in Million Tonnes)
Quantity Share (%) Growth (%) Quantity Share (%) Growth (%) Quantity Share (%) Growth (%)
(1) (2) (3) (4) (5) (6) (7) (8) (9) (10)
2006-07 1.050 0.2 -4.6 83.241 19.3 9.0
2007-08 0.079 0.0 0.0 1.101 0.2 4.9 90.172 19.7 8.3
2008-09 0.142 0.0 79.7 1.009 0.2 -8.4 101.922 20.7 13.0
2009-10 0.251 0.0 76.8 1.113 0.2 10.3 109.953 20.7 7.9
2010-11 0.299 0.1 19.1 1.101 0.2 -1.1 113.825 21.4 3.5
2011-12 0.221 0.0 -26.1 0.602 0.1 -45.3 113.958 21.1 0.1
2012-13 0.073 0.0 -67.0 0.605 0.1 0.5 117.830 21.2 3.4
2013-14 0.000 0.0 - 0.664 0.1 9.8 127.095 22.5 7.9
2014-15 0.000 0.0 - 0.779 0.1 17.3 134.764 22.1 6.0
2015-16 0.000 0.0 - 0.486 0.1 -37.6 130.605 20.4 -3.1
Quantity Share (%) Growth (%) Quantity Share (%) Growth (%) Quantity Share (%) Growth (%)
(11) (12) (13) (14) (15) (16) (17) (18) (19) (20)
2006-07 0.016 0.0 -15.8 88.764 20.6 3.9 59.726 13.9 7.5
2007-08 0.017 0.0 6.3 90.895 19.9 2.4 67.841 14.8 13.6
2008-09 0.011 0.0 -35.3 96.272 19.5 5.9 71.325 14.5 5.1
2009-10 0.023 0.0 109.1 105.917 19.9 10.0 74.074 13.9 3.9
2010-11 0.023 0.0 0.0 108.949 20.5 2.9 71.104 13.3 -4.0
2011-12 0.020 0.0 -13.0 109.566 20.3 0.6 71.123 13.2 0.0
2012-13 0.019 0.0 -5.0 111.274 20.0 1.6 75.948 13.6 6.8
2013-14 0.019 0.0 0.0 113.091 20.0 1.6 75.590 13.4 -0.5
2014-15 0.013 0.0 -31.6 124.143 20.4 9.8 87.609 14.4 15.9
2015-16 0.015 0.0 15.4 121.067 18.9 -2.5 107.714 16.9 22.9
Quantity Share (%) Growth (%) Quantity Share (%) Growth (%) Quantity Share (%) Growth (%)
(21) (22) (23) (24) (25) (26) (27) (28) (29) (30)
2006-07 36.215 8.4 0.3 5.787 1.3 3.8 81.160 18.8 15.1
2007-08 36.403 8.0 0.5 6.541 1.4 11.5 89.482 19.6 10.3
2008-09 38.705 7.9 6.3 5.489 1.1 -19.2 98.402 20.0 10.0
2009-10 41.005 7.7 5.9 5.767 1.1 4.8 105.476 19.9 7.2
2010-11 39.336 7.4 -4.1 6.974 1.3 17.3 102.565 19.3 -2.8
2011-12 39.159 7.3 -0.4 7.206 1.3 3.2 105.476 19.5 2.8
2012-13 39.134 7.0 -0.1 5.640 1.0 -27.8 110.132 19.8 4.4
2013-14 37.223 6.6 -4.9 5.732 1.0 1.6 112.917 20.0 2.5
2014-15 38.257 6.3 2.8 2.524 0.4 -127.1 123.627 20.3 9.5
2015-16 38.351 6.0 0.2 3.715 0.6 32.1 138.461 21.7 12.0
Note: The State of Chhattisgarh is curved out of the state of Madhya Pradesh w.e.f 1st November 2000.
Note: The State of Jharkhand is curved out of the state of Bihar w.e.f 15th Nov.2000.
Contd……
YearState: Arunachal Pradesh State: Assam State: Chhattisgarh
Year State: Jammu & Kashmir State: Jharkhand State: Madhya Pradesh
YearState: Maharashtra State: Meghalaya State: Odisha
27

TABLE 2.6 : SHARE OF RAW COAL PRODUCTION BY STATES IN LAST TEN YEARS
(Quantity in Million Tonnes)
Quantity Share (%) Growth (%) Quantity Share (%) Growth (%) Quantity Share (%) Growth (%)
(31) (32) (33) (34) (35) (36) (37) (38) (39) (40)
2006-07 37.707 8.8 4.3 12.228 2.8 -22.2 24.938 5.8 1.9
2007-08 40.604 8.9 7.7 11.426 2.5 -6.6 22.521 4.9 -9.7
2008-09 44.546 9.0 9.7 12.029 2.4 5.3 22.905 4.6 1.7
2009-10 50.429 9.5 13.2 13.968 2.6 16.1 23.133 4.4 1.0
2010-11 51.333 9.6 1.8 15.526 2.9 11.2 21.659 4.1 -6.4
2011-12 52.211 9.7 1.7 16.178 3.0 4.2 24.230 4.5 11.9
2012-13 53.190 9.6 1.9 16.090 2.9 -0.5 26.467 4.8 9.2
2013-14 50.469 8.9 -5.1 14.721 2.6 -8.5 28.244 5.0 6.7
2014-15 52.536 8.6 4.1 14.957 2.5 1.6 29.970 4.9 6.1
2015-16 60.380 9.4 14.9 12.689 2.0 -15.2 25.751 4.0 -14.1
Quantity Growth (%)
(41) (42) (43)
2006-07 430.832 5.8
2007-08 457.082 6.1
2008-09 492.757 7.8
2009-10 531.109 7.8
2010-11 532.694 0.3
2011-12 539.950 1.4
2012-13 556.402 3.0
2013-14 565.765 1.7
2014-15 609.179 7.7
2015-16 639.234 4.9
Note: The State of Telangana is curved out of the state of Andhra Pradesh w.e.f 2014-15
YearState: Telangana State: Uttar Pradesh State: West Bengal
YearALL INDIA
28

TABLE 2.7 : SHARE OF LIGNITE PRODUCTION BY STATES IN LAST TEN YEARS
(Quantity in Million Tonnes)
Quantity Share (%) Growth (%) Quantity Share (%) Growth (%) Quantity Share (%) Growth (%)
(1) (2) (3) (4) (5) (6) (7) (8) (9) (10)
2006-07 21.014 67.2 2.8 9.808 31.4 9.7 0.463 1.5 -32.6
2007-08 21.586 63.5 2.7 11.788 34.7 20.2 0.606 1.8 30.9
2008-09 21.308 65.7 -1.3 10.114 31.2 -14.2 0.999 3.1 64.9
2009-10 22.338 65.6 4.8 10.526 30.9 4.1 1.207 3.5 20.8
2010-11 23.144 61.3 3.6 13.064 34.6 24.1 1.525 4.0 26.3
2011-12 24.590 58.1 6.2 14.779 34.9 13.1 2.963 7.0 94.3
2012-13 24.844 53.5 1.0 14.528 31.3 -1.7 7.081 15.2 139.0
2013-14 25.056 56.6 0.9 11.588 26.2 -20.2 7.627 17.2 7.7
2014-15 25.190 52.2 0.5 12.317 25.5 6.3 10.763 22.3 41.1
2015-16 24.227 55.3 -3.8 10.124 23.1 -17.8 9.492 21.6 -11.8
Quantity Growth (%)
(11) (12) (13)
2006-07 31.285 4.1
2007-08 33.980 8.6
2008-09 32.421 -4.6
2009-10 34.071 5.1
2010-11 37.733 10.7
2011-12 42.332 12.2
2012-13 46.453 9.7
2013-14 44.271 -4.7
2014-15 48.270 9.0
2015-16 43.843 -9.2
State: Rajasthan
YearALL INDIA
YearState: Tamilnadu State: Gujarat
29

TABLE 2.8 : STATEWISE PRODUCTION OF RAW COAL BY TYPES IN LAST FIVE YEARS
( Quantity in Million Tonnes )
State 2011-12 2012-13 2013-14 2014-15 2015-16
(1) (2) (3) (4) (5) (6)
COKING
Chhattisgarh 0.189 0.157 0.125 0.126 0.135
Jharkhand 51.108 51.065 55.088 56.430 58.548
Madhya Pradesh 0.319 0.330 0.249 0.310 0.209
West Bengal 0.044 0.030 1.356 0.580 1.995
Total Coking 51.660 51.582 56.818 57.446 60.887
NON-COKING
Arunachal Pradesh 0.221 0.073 0.000 0.000 0.000
Assam 0.602 0.605 0.664 0.779 0.486
Chhattisgarh 113.769 117.673 126.970 134.638 130.470
Jammu & Kashmir 0.020 0.019 0.019 0.013 0.015
Jharkhand 58.458 60.209 58.003 67.713 62.519
Madhya Pradesh 70.804 75.618 75.341 87.299 107.505
Maharashtra 39.159 39.134 37.223 38.257 38.351
Meghalaya 7.206 5.640 5.732 2.524 3.715
Odisha 105.476 110.132 112.917 123.627 138.461
Telangana 52.211 53.190 50.469 52.536 60.380
Uttar Pradesh 16.178 16.090 14.721 14.957 12.689
West Bengal 24.186 26.437 26.888 29.390 23.756
Total Non-Coking 488.290 504.820 508.947 551.733 578.347
TABLE 2.9 : STATEWISE PRODUCTION OF LIGNITE IN LAST FIVE YEARS
( Quantity in Million Tonnes )
State 2011-12 2012-13 2013-14 2014-15 2015-16
(1) (2) (3) (4) (5) (6)
Gujarat 14.779 14.528 11.588 12.317 10.124
Rajasthan 2.963 7.081 7.627 10.763 9.492
Tamilnadu 24.590 24.844 25.056 25.190 24.227
TOTAL 42.332 46.453 44.271 48.270 43.843
30

TABLE 2.10 : TRENDS OF COMPANY WISE PRODUCTION OF COAL & LIGNITE DURING LAST THREE YEARS
[Quantity in Milllion Tonnes]
Coking Non-coking Total Coking Non-coking Total Coking Non-coking Total
(1) (2) (3) (4) (5) (6) (7) (8) (9) (10)
ECL 0.048 35.999 36.047 0.034 39.972 40.006 0.012 40.196 40.208
BCCL 30.055 2.557 32.612 30.770 3.742 34.512 32.648 3.213 35.861
CCL 18.441 31.581 50.022 19.326 36.326 55.652 20.697 40.627 61.324
NCL 68.639 68.639 72.484 72.484 80.224 80.224
WCL 0.249 39.480 39.729 0.310 40.837 41.147 0.209 44.606 44.815
SECL 0.125 124.136 124.261 0.126 128.149 128.275 0.135 135.521 135.656
MCL 110.439 110.439 121.379 121.379 137.901 137.901
NEC 0.664 0.664 0.779 0.779 0.486 0.486
CIL 48.918 413.495 462.413 50.566 443.668 494.234 53.701 482.774 536.475
SCCL 50.469 50.469 52.536 52.536 60.380 60.380
JKML 0.019 0.019 0.013 0.013 0.015 0.015
JSMDCL 0.000 0.415 0.415 0.190 0.190
DVC 0.054 0.054 0.066 0.066 0.403 0.403
IISCO 0.541 0.081 0.622 0.420 0.206 0.626 0.558 0.169 0.727
SAIL 0.044 0.025 0.069 0.024 0.001 0.025 0.000
RRVUNL 1.197 1.197 3.443 3.443 6.210 6.210
SECL(GP-IV/2&3) 2.278 2.278
DVC EMTA 1.519 1.519 1.001 1.001
APMDTCL 0.000 0.000
WBPDCL 2.606 2.606 6.221 6.221
WBMDTCL 0.726 0.726 1.041 1.041
PSEB/PANEM 5.879 5.879 3.433 3.433
KECML 2.502 2.502 2.478 2.478
MPSMCL 0.005 0.005 1.500 1.500
Total Public 49.503 478.577 528.080 51.010 516.022 567.032 54.662 552.016 606.678
TISCO 6.905 0.067 6.972 6.027 0.016 6.043 6.225 0.003 6.228
Meghalaya 5.732 5.732 2.524 2.524 3.715 3.715
HIL 2.478 2.478 2.248 2.248 0.069 0.069
SIL 0.148 0.148 0.196 0.196 0.165 0.165
SPL 1.695 1.695 9.406 9.406 17.022 17.022
GMR 0.560 0.560
BALCO 0.120 0.120
CESC 1.877 1.877
JPVL 2.800 2.800
ICML 2.708 2.708 3.449 3.449
JSPL 5.999 5.999 5.989 5.989
MIEL 0.919 0.919 1.000 1.000
BLA 0.300 0.300 0.300 0.300
PIL 1.000 1.000 1.000 1.000
JNL 0.446 0.446 0.703 0.703
JPL 6.226 6.226 6.248 6.248
ESCL 0.410 0.051 0.461 0.409 0.024 0.433
UML 0.762 0.762 0.790 0.790
SEML 1.165 1.165 1.189 1.189
BSIL 0.081 0.081 0.031 0.031
TUML/SVSL 0.317 0.317 0.198 0.198
SOVA 0.276 0.276 0.400 0.400
Total Private 7.315 30.370 37.685 6.436 35.711 42.147 6.225 26.331 32.556
ALL INDIA 56.818 508.947 565.765 57.446 551.733 609.179 60.887 578.347 639.234
LIGNITE
NLC 26.609 26.543 25.451
GMDCL 8.398 8.713 6.969
GIPCL 3.006 3.404 3.063
RSMML 1.428 1.405 0.972
GHCL 0.190 0.200 0.092
VSLPPL 0.890 1.005 0.617
BLMCL 3.750 7.000 6.679
ALL INDIA 44.271 48.270 43.843
COAL & LIGNITE 610.036 657.449 683.077
Company2013-14 2014-15 2015-16
31

TABLE 2.11: STATEWISE AND COMPANYWISE PRODUCTION OF RAW COAL BY TYPES IN LAST THREE YEARS
[ Quantity in Million Tonnes ]
Coking N-Coking Total Coking N-Coking Total Coking N-Coking Total(1) (2) (3) (4) (5) (6) (7) (8) (9) (10) (11)
Arunachal Pradesh APMDTCL 0.000 0.000 0 0 0 0
Assam NEC 0.664 0.664 0.779 0.779 0.486 0.486
Chhattisgarh SECL 0.125 110.018 110.143 0.126 115.066 115.192 0.135 121.793 121.928
Chhattisgarh RRVUNL 1.197 1.197 3.443 3.443 6.210 6.210
Chhattisgarh SECL(GP-IV/2&3) 2.278 2.278
Chhattisgarh HIL 0.069 0.069
Chhattisgarh BALCO 0.120 0.120
Chhattisgarh JSPL 5.999 5.999 5.989 5.989
Chhattisgarh MIEL 0.919 0.919 1.000 1.000
Chhattisgarh PIL 1.000 1.000 1.000 1.000
Chhattisgarh JPL 6.226 6.226 6.248 6.248
Chhattisgarh JNL 0.446 0.446 0.703 0.703
Chhattisgarh SEML 1.165 1.165 1.189 1.189
Chhattisgarh TOTAL 0.125 126.970 127.095 0.126 134.638 134.764 0.135 130.470 130.605
Jammu & Kashmir JKML 0.019 0.019 0.013 0.013 0.015 0.015
Jharkhand ECL 0.038 17.133 17.171 0.030 19.372 19.402 0.012 19.035 19.047
Jharkhand BCCL 28.709 2.356 31.065 30.194 3.270 33.464 30.653 2.650 33.303
Jharkhand CCL 18.441 31.581 50.022 19.326 36.326 55.652 20.697 40.627 61.324
Jharkhand JSMDCL 0 0 0.415 0.415 0.190 0.190
Jharkhand DVC 0.054 0.054 0.066 0.066 0.403 0.403
Jharkhand IISCOCJ 0.541 0.541 0.420 0.420 0.572 0.572
Jharkhand TISCO 6.905 0.067 6.972 6.027 0.016 6.043 6.225 0.003 6.228
Jharkhand PSEB/PANEM 5.879 5.879 3.433 3.433
Jharkhand UML 0.762 0.762 0.790 0.790
Jharkhand ESCL 0.410 0.051 0.461 0.409 0.024 0.433
Jharkhand SAIL 0.044 0.025 0.069 0.024 0.001 0.025
Jharkhand WBPDCL 0.095 0.095 4.000 4.000
Jharkhand TOTAL 55.088 58.003 113.091 56.430 67.713 124.143 58.562 62.505 121.067
Madhya Pradesh NCL 53.918 53.918 57.527 57.527 67.535 67.535
Madhya Pradesh WCL 0.249 5.305 5.554 0.310 5.483 5.793 0.209 6.420 6.629
Madhya Pradesh SECL 14.118 14.118 13.083 13.083 13.728 13.728
Madhya Pradesh SPL 1.695 1.695 9.406 9.406 17.022 17.022
Madhya Pradesh JPVL 2.800 2.800
Madhya Pradesh BLA 0.300 0.300 0.300 0.300
Madhya Pradesh MPSMCL 0.005 0.005 1.500 1.500
Madhya Pradesh TOTAL 0.249 75.341 75.590 0.310 87.299 87.609 0.209 107.505 107.714
Maharashtra WCL 34.175 34.175 35.354 35.354 38.186 38.186
Maharashtra SIL 0.148 0.148 0.196 0.196 0.165 0.165
Maharashtra BSIL 0.081 0.081 0.031 0.031
Maharashtra KECML 2.502 2.502 2.478 2.478
Maharashtra TUML/SVSL 0.317 0.317 0.198 0.198
Maharashtra TOTAL 0.000 37.223 37.223 0 38.257 38.257 0 38.351 38.351
Meghalaya MEG 5.732 5.732 2.524 2.524 3.715 3.715
Odisha MCL 110.439 110.439 121.379 121.379 137.901 137.901
Odisha GMR 0.560 0.560
Odisha HIL 2.478 2.478 2.248 2.248
Odisha TOTAL 112.917 112.917 123.627 123.627 138.461 138.461
Telangana SCCL 50.469 50.469 52.536 52.536 60.380 60.380
Uttar Pradesh NCL 14.721 14.721 14.957 14.957 12.689 12.689
West Bengal ECL 0.010 18.866 18.876 0.004 20.600 20.604 21.161 21.161
West Bengal BCCL 1.346 0.201 1.547 0.576 0.472 1.048 1.995 0.563 2.558
West Bengal IISCOR 0.081 0.081 0.206 0.206 0.155 0.155
West Bengal CESC 1.877 1.877
West Bengal ICML 2.708 2.708 3.449 3.449
West Bengal WBPDCL 2.511 2.511 2.221 2.221
West Bengal DVC EMTA 1.519 1.519 1.001 1.001
West Bengal WBMDTCL 0.726 0.726 1.041 1.041
West Bengal SOVA 0.276 0.276 0.400 0.400
West Bengal TOTAL 1.356 26.888 28.244 0.580 29.390 29.970 1.995 23.756 25.751
Total Public 49.503 478.577 528.080 51.010 516.022 567.032 54.662 552.016 606.678
Total Private 7.315 30.370 37.685 6.436 35.711 42.147 6.225 26.331 32.556
All India 56.818 508.947 565.765 57.446 551.733 609.179 60.887 578.347 639.234
TOTAL
2015-20162013-2014 2014-2015STATES COMPANY
32

TABLE 2.12 : CAPTIVE BLOCK WISE PRODUCTION OF RAW COAL DURING LAST TWO YEARS
(Quantity in Million Tonnes)
Coking
Coal
Non
Coking
Coal
Total
Coal
Coking
Coal
Non
Coking
Coal
Total
Coal
Gare Palma IV/2&3 SECL(GP-IV/2&3) Chhittsgarh 2.278 2.278
Parsa E & Kanta Basan RRUVNL Chhittsgarh 3.443 3.443 6.210 6.210
Amelia North MPSMCL Madhya Pradesh 1.500 1.500
Baranj I-IV, Kiloni,Manora Deep KECML Maharashtra 2.478 2.478
Barjora North DVCEMTA West Bengal 1.001 1.001
Barjore WBPDCL West Bengal 0.210 0.210
Gangaramchak & Bhadulia WBPDCL West Bengal 0.206 0.206
Namchik Namphuk APMDTCL Arunachal Pradesh
Pachwara Central PSEB Jharkhand 3.433 3.433
Panchwara North WBPDCL Jharkhand 4.000 4.000
Tara East & West WBPDCL West Bengal 1.805 1.805
Tasra SAIL/IISCO Jharkhand 0.024 0.001 0.025
Trans Damodar WBMDTCL West Bengal 1.041 1.041
Total Public 0.024 19.118 19.142 0.000 8.488 8.488
Amelia North JPVL Madhya Pradesh 2.800 2.800
Belgaon SIL Maharashtra 0.196 0.196 0.165 0.165
Chotia BALCO Chhittsgarh 0.120 0.120
Gare Palma IV/4 & 5 HIL Chhittsgarh 0.069 0.069
Moher & Moher Amlori Extn SPL Madhya Pradesh 9.406 9.406 17.022 17.022
Sarshatali CESC West Bengal 1.877 1.877
Talabira I GMR Odisha 0.560 0.560
Ardhagram SOVA West Bengal 0.400 0.400
Chotia PIL Chhittsgarh 1.000 1.000
Gare Palma IV/1 JSPL Chhittsgarh 5.989 5.989
Gare Palma IV/2&3 JPL Chhittsgarh 6.248 6.248
Gare Palma IV/4 JNL Chhittsgarh 0.703 0.703
Gare Palma IV/5 MIEL Chhittsgarh 1.000 1.000
Gare Palma IV/7 SEML Chhittsgarh 1.189 1.189
Gotitoria E & W BLA Madhya Pradesh 0.300 0.300
Kathautia UML Jharkhand 0.790 0.790
Marki Mangli I BSIL Maharashtra 0.031 0.031
Marki Mangli II-IV TUML-SVSL Maharashtra 0.198 0.198
Parbatpur Central ESCL Jharkhand 0.409 0.024 0.433
Sarshatali ICML West Bengal 3.449 3.449
Talabira I HIL Odisha 2.248 2.248
Total Private 0.409 33.171 33.580 0.000 22.613 22.613
Grand Total 0.433 52.289 52.722 0.000 31.101 31.101
2014-15 2015-16
Block Company State
33
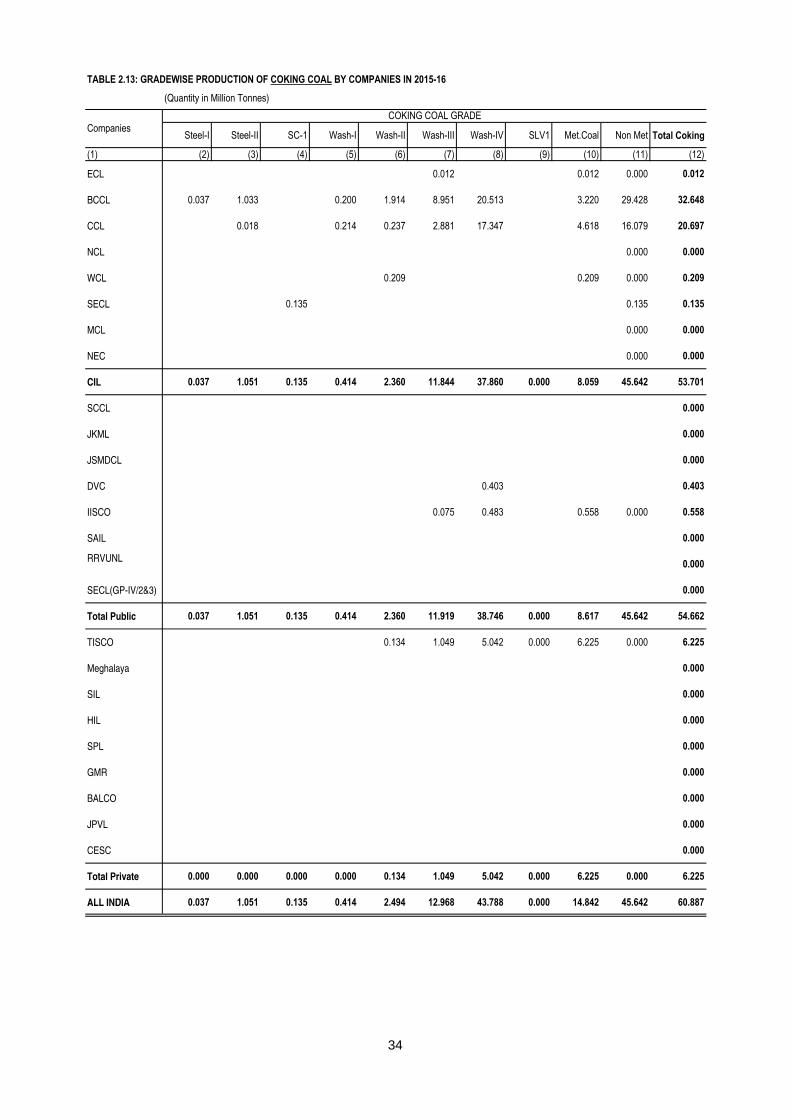
TABLE 2.13: GRADEWISE PRODUCTION OF COKING COAL BY COMPANIES IN 2015-16
(Quantity in Million Tonnes)
Steel-I Steel-II SC-1 Wash-I Wash-II Wash-III Wash-IV SLV1 Met.Coal Non Met Total Coking
(1) (2) (3) (4) (5) (6) (7) (8) (9) (10) (11) (12)
ECL 0.012 0.012 0.000 0.012
BCCL 0.037 1.033 0.200 1.914 8.951 20.513 3.220 29.428 32.648
CCL 0.018 0.214 0.237 2.881 17.347 4.618 16.079 20.697
NCL 0.000 0.000
WCL 0.209 0.209 0.000 0.209
SECL 0.135 0.135 0.135
MCL 0.000 0.000
NEC 0.000 0.000
CIL 0.037 1.051 0.135 0.414 2.360 11.844 37.860 0.000 8.059 45.642 53.701
SCCL 0.000
JKML 0.000
JSMDCL 0.000
DVC 0.403 0.403
IISCO 0.075 0.483 0.558 0.000 0.558
SAIL 0.000
RRVUNL0.000
SECL(GP-IV/2&3) 0.000
Total Public 0.037 1.051 0.135 0.414 2.360 11.919 38.746 0.000 8.617 45.642 54.662
TISCO 0.134 1.049 5.042 0.000 6.225 0.000 6.225
Meghalaya 0.000
SIL 0.000
HIL 0.000
SPL 0.000
GMR 0.000
BALCO 0.000
JPVL 0.000
CESC 0.000
Total Private 0.000 0.000 0.000 0.000 0.134 1.049 5.042 0.000 6.225 0.000 6.225
ALL INDIA 0.037 1.051 0.135 0.414 2.494 12.968 43.788 0.000 14.842 45.642 60.887
Companies
COKING COAL GRADE
34

TABLE 2.14: GRADEWISE PRODUCTION OF NON COKING COAL BY COMPANIES IN 2015-16
(Quantity in Million Tonnes)
1 2 3 4 5 6 7 8 9 10 11 12 13 14 15 16 17 UNGTotal N-
coking(1) (2) (3) (4) (5) (6) (7) (8) (9) (10) (11) (12) (13) (14) (15) (16) (17) (18) (19) (20) (21)
ECL 0.095 1.346 14.104 5.146 1.346 2.609 0.149 15.401 40.196 40.208
BCCL 0.309 0.360 0.075 1.136 1.219 0.001 0.113 3.213 35.861
CCL 0.032 2.239 0.983 0.895 3.877 11.707 12.951 5.981 1.962 40.627 61.324
NCL 0.503 0.212 17.838 11.404 48.950 1.317 80.224 80.224
WCL 0.016 0.354 1.208 2.706 9.905 26.565 3.852 44.606 44.815
SECL 3.533 3.003 7.124 8.103 4.384 1.034 1.021 1.722 94.779 10.818 135.521 135.656
MCL 0.073 0.130 0.920 0.001 11.737 75.265 49.775 137.901 137.901
NEC 0.118 0.247 0.121 0.486 0.486
CIL 0.118 0.342 5.188 17.636 15.514 12.988 29.651 26.500 40.326 67.476 112.497 89.362 65.176 0.000 0.000 0.000 0.000 0.000 482.774 536.475
SCCL 0.786 9.386 2.384 8.235 4.642 17.725 1.022 12.272 2.844 0.418 0.653 0.013 60.380 60.380
JKML 0.015 0.015 0.015
JSMDCL 0.190 0.190 0.190
DVC 0.000 0.403
IISCO 0.029 0.140 0.169 0.727
SAIL 0.000 0.000
RRVUNL6.210 6.210 6.210
SECL(GP-IV/2&3) 1.049 1.229 2.278 2.278
Total Public 0.118 0.342 5.188 17.665 16.300 13.128 39.037 28.884 48.561 72.118 136.432 90.574 77.448 1.049 4.073 0.418 0.668 0.013 552.016 606.678
TISCO 0.003 0.003 6.228
Meghalaya 3.715 3.715 3.715
SIL 0.165 0.165 0.165
HIL 0.045 0.023 0.001 0.069 0.069
SPL 10.693 6.329 17.022 17.022
GMR 0.170 0.390 0.560 0.560
BALCO 0.120 0.120 0.120
JPVL 2.800 2.800 2.800
CESC 1.877 1.877 1.877
Total Private 3.715 0.000 0.000 0.000 0.000 0.000 0.000 0.165 0.120 10.738 11.029 0.003 0.171 0.390 0.000 0.000 0.000 0.000 26.331 32.556
ALL INDIA 3.833 0.342 5.188 17.665 16.300 13.128 39.037 29.049 48.681 82.856 147.461 90.577 77.619 1.439 4.073 0.418 0.668 0.013 578.347 639.234
Companies
NON-COKING COAL GRADETotal
Coal
35

TABLE 2.15: TRENDS OF PRODUCTION OF RAW COAL FROM OPENCAST AND UNDERGROUND MINES IN LAST TEN YEARS
CIL SCCL All India CIL SCCL All India
(1) (2) (3) (4) (5) (6) (7) (8) (9) (10) (11) (12) (13)
2006-07 317.591 25.831 373.134 86.61 7.82 43.322 11.876 57.698 13.39 -5.36 430.832 5.85
2007-08 335.918 27.959 398.182 87.11 6.71 43.541 12.645 58.900 12.89 2.08 457.082 6.09
2008-09 359.771 32.459 433.785 88.03 8.94 43.959 12.087 58.972 11.97 0.12 492.757 7.80
2009-10 387.997 38.460 473.519 89.00 9.16 43.262 11.969 58.523 11.00 -0.76 532.042 7.97
2010-11 391.303 39.705 477.839 89.70 0.91 40.018 11.628 54.855 10.30 -6.27 532.694 0.12
2011-12 397.445 41.573 487.993 90.38 2.12 38.393 10.638 51.957 9.62 -5.28 539.950 1.36
2012-13 414.423 41.593 504.195 90.62 3.32 37.777 11.597 52.207 9.38 0.48 556.402 3.05
2013-14 426.300 39.921 516.116 91.22 2.36 36.113 10.548 49.649 8.78 -4.90 565.765 1.68
2014-15 459.191 42.333 563.970 92.09 9.27 35.043 10.203 48.465 7.91 -2.38 612.435 8.25
2015-16 502.689 49.727 592.822 92.74 5.12 33.786 10.653 46.412 7.26 -4.24 639.234 4.38
( Quantity in Million Tonnes )
YEAR
Open Cast Under Ground All India Raw Coal
Production OC
Share
(%) in All
India
Total
OC
Growth
(%) ( All
India )
Production UG Share
(%) in All
India Total
UG
Growth
(%) ( All
India )
Production Growth (%)
317.591 335.918 359.771 387.997 391.303 397.445 414.423 426.300
459.191 502.689
43.3
22
43.5
41
43.9
59
43.2
62
40.0
18
38.3
93
37.7
77
36.1
13
35.0
43
33.7
86
0
100
200
300
400
500
600
2006-07 2007-08 2008-09 2009-10 2010-11 2011-12 2012-13 2013-14 2014-15 2015-16
Pro
duct
ion
(Mill
. Ton
nes)
Production by Type of Mines - CIL
Open Cast Under Ground
86.61 87.11 88.03 89.00 89.70 90.38 90.62 91.22 92.09 92.74
13.3
9
12.8
9
11.9
7
11.0
0
10.3
0
9.62
9.38
8.78
7.91
7.26
0
20
40
60
80
100
120
2006-07 2007-08 2008-09 2009-10 2010-11 2011-12 2012-13 2013-14 2014-15 2015-16
Percentage Distribution of Production by Type of Mines - INDIA
Open Cast Under Ground
25.831 27.959 32.459
38.460 39.705 41.573 41.593 39.921 42.333
49.727
11.8
76
12.6
45
12.0
87
11.9
69
11.6
28
10.6
38
11.5
97
10.5
48
10.2
03
10.6
53
0
10
20
30
40
50
60
2006-07 2007-08 2008-09 2009-10 2010-11 2011-12 2012-13 2013-14 2014-15 2015-16
Pro
duct
ion
(Mill
. Ton
nes)
Production by Type of Mines - SCCL
Open Cast Under Ground
36

( Quantity in Million Tonnes )
QuantityShare
(%)
Growth
(%) Quantity Share (%)
Growth
(%) Quantity
Share
(%)
Growth
(%) Quantity Share (%)
Growth
(%)
(1) (8) (9) (10) (11) (12) (13) (8) (9) (10) (11) (12) (13)
ECL 32.714 81.77 12.13 7.292 18.23 6.13 32.879 81.77 0.50 7.329 18.23 0.51
BCCL 32.483 94.12 8.61 2.029 5.88 -24.96 34.054 94.96 4.84 1.807 5.04 -10.94
CCL 54.811 98.49 11.71 0.841 1.51 -12.03 60.476 98.62 10.34 0.848 1.38 0.83
NCL 72.484 100.00 5.60 80.224 100.00 10.68
WCL 33.581 81.61 4.94 7.566 18.39 -2.12 37.635 83.98 12.07 7.180 16.02 -5.10
SECL 112.239 87.50 4.07 16.036 12.50 -2.31 120.149 88.57 7.05 15.507 11.43 -3.30
MCL 120.103 98.95 10.18 1.276 1.05 -10.96 136.789 99.19 13.89 1.112 0.81 -12.85
NEC 0.776 99.61 17.40 0.003 0.39 0.00 0.483 99.38 -37.76 0.003 0.62 0.00
CIL 459.191 92.91 7.72 35.043 7.09 -2.96 502.689 93.70 9.47 33.786 6.30 -3.59
SCCL 42.333 80.58 6.04 10.203 19.42 -3.27 49.727 82.36 17.47 10.653 17.64 4.41
JKML 0.013 100.00 0.015 100.00
DVC 0.066 100.00 22.22 0.403 100.00 510.61
IISCO 0.360 57.51 -16.86 0.266 42.49 40.74 0.459 63.14 27.50 0.268 36.86 0.75
SAIL 0.025 100.00 -63.77
JSMDCL 0.415 100.00 0.190 100.00
RRVUNL 3.443 100.00 187.64 6.210 100.00 80.37
SECL(GP-IV/2&3) 2.278 100.00
DVCEMTA 1.001 100.00 -34.10
APMDTCL
WBMDTCL 1.041 100.00 43.39
WBPDCL 6.221 100.00 138.72
PSEB-PANEM 3.433 100.00 -41.61
KECML 2.478 100.00 -0.96
MPSMCL 1.500 100.00 29900
PUBLIC 521.507 91.97 8.37 45.525 8.03 -2.87 561.956 92.63 7.76 44.722 7.37 -1.76
TISCO 4.715 78.02 -15.86 1.328 21.98 -2.92 4.772 76.62 1.21 1.456 23.38 9.64
Meghalaya 2.524 100.00 -55.97 3.715 100.00 47.19
HIL 0.069 100.00
SIL 0.196 100.00 0.165 100.00 -15.82
SPL 17.022 100.00
GMR 0.560 100.00
BALCO 0.120 100.00
CESC 1.877 100.00
JPVL 2.800 100.00
ICML 3.449 100.00 27.36
JSPL 5.989 100.00 -0.17
HIL 2.248 100.00 -9.28
MIEL 1.000 100.00
BLA 0.300 100.00 0.00
PIL 1.000 100.00 0.00
JNL 0.342 48.65 106.02 0.361 51.35 28.93
JPL 6.248 100.00 0.35
ESCL 0.331 76.44 -16.41 0.102 23.56 56.92
UML 0.790 100.00 3.67
SEML 1.189 100.00 2.06
BSIL 0.031 100.00 -61.73
TUML-SVSL 0.198 100.00 -37.54
SPL 9.406 100.00 454.93
SOVA 0.400 100.00 44.93
PRIVATE 39.160 92.91 12.19 2.987 7.09 7.45 30.866 94.81 -21.18 1.690 5.19 -43.42
All India 560.667 92.04 8.63 48.512 7.96 -2.29 592.822 92.74 5.74 46.412 7.26 -4.33
Note: For Meghalaya it has been assumed that the coal is being mined by open cast method.
TABLE 2.16 : COMPANY WISE PRODUCTION OF RAW COAL FROM OPENCAST AND UNDER GROUND MINES IN TWO YEARS
Y E A R 2015 - 2016
OPENCAST UNDER GROUNDOPENCAST UNDER GROUND
Y E A R 2014 - 2015
COMPANIES
37

TABLE 2.17: TRENDS OF OMS IN OC & UG MINES ( CIL & SCCL ) DURING LAST TEN YEARS
( Quantity in Million Tonnes )
CIL SCCL CIL SCCL CIL SCCL
(1) (2) (3) (4) (5) (6) (7)
2006-07 8.00 9.50 0.71 0.90 3.54 1.91
2007-08 8.60 10.76 0.73 1.02 3.79 2.10
2008-09 8.95 10.60 0.76 1.05 4.09 3.01
2009-10 9.48 10.71 0.78 1.08 4.48 3.36
2010-11 10.06 11.98 0.77 1.10 4.74 3.59
2011-12 10.40 13.26 0.75 1.10 4.92 3.94
2012-13 11.68 11.87 0.77 1.13 5.32 3.14
2013-14 13.16 11.10 0.76 1.12 5.79 3.86
2014-15 14.63 12.14 0.78 1.10 6.50 4.20
2015-16 15.28 13.78 0.79 1.25 7.11 4.20
YearOMS ( OPEN CAST ) OMS ( UNDER GROUND ) OMS ( OVERALL )
0
2
4
6
8
10
12
14
16
18
2006-07 2007-08 2008-09 2009-10 2010-11 2011-12 2012-13 2013-14 2014-15 2015-16
Trend of OMS - CIL [in Tonnes]
Opencast
Overall
Underground
0
2
4
6
8
10
12
14
16
2006-07 2007-08 2008-09 2009-10 2010-11 2011-12 2012-13 2013-14 2014-15 2015-16
Trend of OMS - SCCL [in Tonnes]
Opencast
Overall
Underground
38
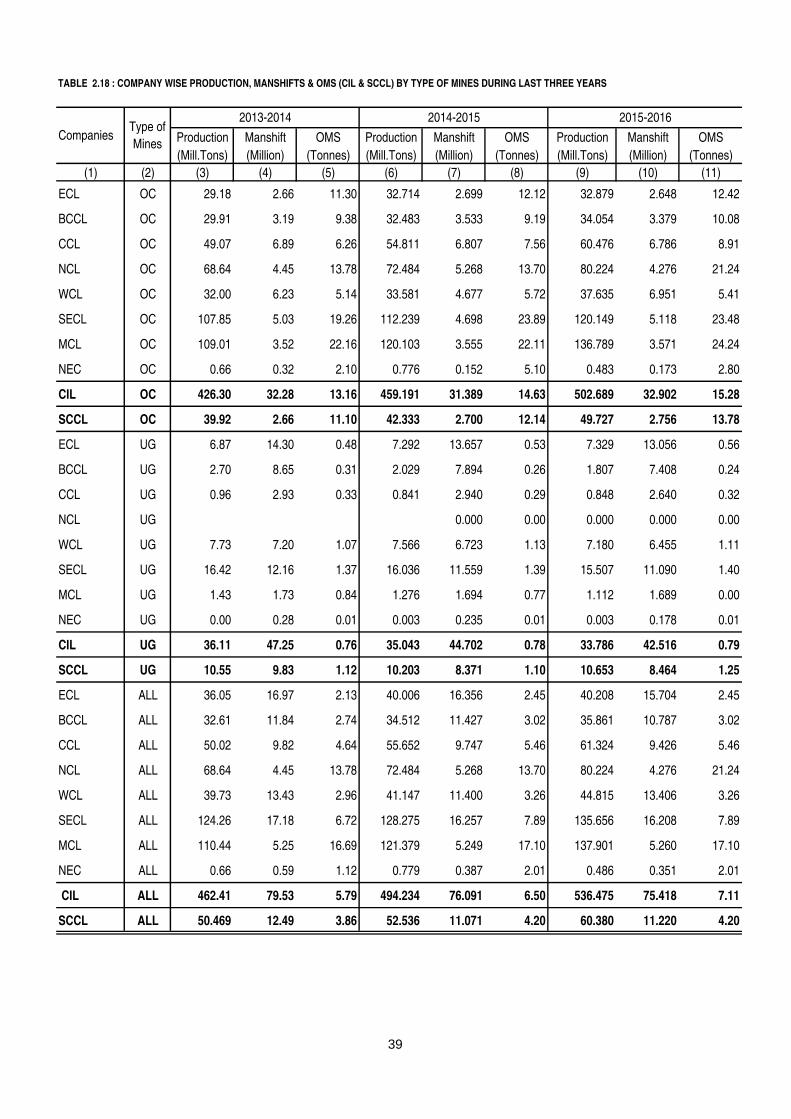
TABLE 2.18 : COMPANY WISE PRODUCTION, MANSHIFTS & OMS (CIL & SCCL) BY TYPE OF MINES DURING LAST THREE YEARS
Production Manshift OMS Production Manshift OMS Production Manshift OMS
(Mill.Tons) (Million) (Tonnes) (Mill.Tons) (Million) (Tonnes) (Mill.Tons) (Million) (Tonnes)
(1) (2) (3) (4) (5) (6) (7) (8) (9) (10) (11)
ECL OC 29.18 2.66 11.30 32.714 2.699 12.12 32.879 2.648 12.42
BCCL OC 29.91 3.19 9.38 32.483 3.533 9.19 34.054 3.379 10.08
CCL OC 49.07 6.89 6.26 54.811 6.807 7.56 60.476 6.786 8.91
NCL OC 68.64 4.45 13.78 72.484 5.268 13.70 80.224 4.276 21.24
WCL OC 32.00 6.23 5.14 33.581 4.677 5.72 37.635 6.951 5.41
SECL OC 107.85 5.03 19.26 112.239 4.698 23.89 120.149 5.118 23.48
MCL OC 109.01 3.52 22.16 120.103 3.555 22.11 136.789 3.571 24.24
NEC OC 0.66 0.32 2.10 0.776 0.152 5.10 0.483 0.173 2.80
CIL OC 426.30 32.28 13.16 459.191 31.389 14.63 502.689 32.902 15.28
SCCL OC 39.92 2.66 11.10 42.333 2.700 12.14 49.727 2.756 13.78
ECL UG 6.87 14.30 0.48 7.292 13.657 0.53 7.329 13.056 0.56
BCCL UG 2.70 8.65 0.31 2.029 7.894 0.26 1.807 7.408 0.24
CCL UG 0.96 2.93 0.33 0.841 2.940 0.29 0.848 2.640 0.32
NCL UG 0.000 0.00 0.000 0.000 0.00
WCL UG 7.73 7.20 1.07 7.566 6.723 1.13 7.180 6.455 1.11
SECL UG 16.42 12.16 1.37 16.036 11.559 1.39 15.507 11.090 1.40
MCL UG 1.43 1.73 0.84 1.276 1.694 0.77 1.112 1.689 0.00
NEC UG 0.00 0.28 0.01 0.003 0.235 0.01 0.003 0.178 0.01
CIL UG 36.11 47.25 0.76 35.043 44.702 0.78 33.786 42.516 0.79
SCCL UG 10.55 9.83 1.12 10.203 8.371 1.10 10.653 8.464 1.25
ECL ALL 36.05 16.97 2.13 40.006 16.356 2.45 40.208 15.704 2.45
BCCL ALL 32.61 11.84 2.74 34.512 11.427 3.02 35.861 10.787 3.02
CCL ALL 50.02 9.82 4.64 55.652 9.747 5.46 61.324 9.426 5.46
NCL ALL 68.64 4.45 13.78 72.484 5.268 13.70 80.224 4.276 21.24
WCL ALL 39.73 13.43 2.96 41.147 11.400 3.26 44.815 13.406 3.26
SECL ALL 124.26 17.18 6.72 128.275 16.257 7.89 135.656 16.208 7.89
MCL ALL 110.44 5.25 16.69 121.379 5.249 17.10 137.901 5.260 17.10
NEC ALL 0.66 0.59 1.12 0.779 0.387 2.01 0.486 0.351 2.01
CIL ALL 462.41 79.53 5.79 494.234 76.091 6.50 536.475 75.418 7.11
SCCL ALL 50.469 12.49 3.86 52.536 11.071 4.20 60.380 11.220 4.20
2015-20162013-2014 2014-2015
CompaniesType of
Mines
39
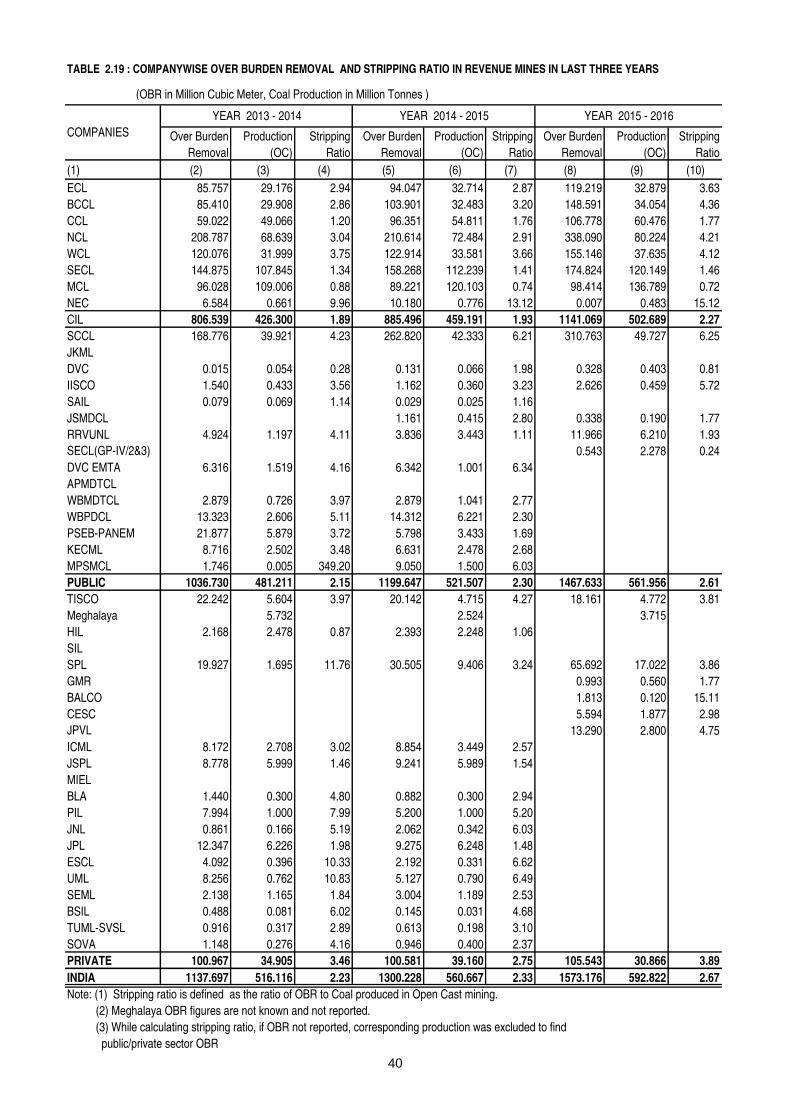
(OBR in Million Cubic Meter, Coal Production in Million Tonnes )
Over Burden Production Stripping Over Burden Production Stripping Over Burden Production Stripping
Removal (OC) Ratio Removal (OC) Ratio Removal (OC) Ratio
(1) (2) (3) (4) (5) (6) (7) (8) (9) (10)
ECL 85.757 29.176 2.94 94.047 32.714 2.87 119.219 32.879 3.63
BCCL 85.410 29.908 2.86 103.901 32.483 3.20 148.591 34.054 4.36
CCL 59.022 49.066 1.20 96.351 54.811 1.76 106.778 60.476 1.77
NCL 208.787 68.639 3.04 210.614 72.484 2.91 338.090 80.224 4.21
WCL 120.076 31.999 3.75 122.914 33.581 3.66 155.146 37.635 4.12
SECL 144.875 107.845 1.34 158.268 112.239 1.41 174.824 120.149 1.46
MCL 96.028 109.006 0.88 89.221 120.103 0.74 98.414 136.789 0.72
NEC 6.584 0.661 9.96 10.180 0.776 13.12 0.007 0.483 15.12
CIL 806.539 426.300 1.89 885.496 459.191 1.93 1141.069 502.689 2.27
SCCL 168.776 39.921 4.23 262.820 42.333 6.21 310.763 49.727 6.25
JKML
DVC 0.015 0.054 0.28 0.131 0.066 1.98 0.328 0.403 0.81
IISCO 1.540 0.433 3.56 1.162 0.360 3.23 2.626 0.459 5.72
SAIL 0.079 0.069 1.14 0.029 0.025 1.16
JSMDCL 1.161 0.415 2.80 0.338 0.190 1.77
RRVUNL 4.924 1.197 4.11 3.836 3.443 1.11 11.966 6.210 1.93
SECL(GP-IV/2&3) 0.543 2.278 0.24
DVC EMTA 6.316 1.519 4.16 6.342 1.001 6.34
APMDTCL
WBMDTCL 2.879 0.726 3.97 2.879 1.041 2.77
WBPDCL 13.323 2.606 5.11 14.312 6.221 2.30
PSEB-PANEM 21.877 5.879 3.72 5.798 3.433 1.69
KECML 8.716 2.502 3.48 6.631 2.478 2.68
MPSMCL 1.746 0.005 349.20 9.050 1.500 6.03
PUBLIC 1036.730 481.211 2.15 1199.647 521.507 2.30 1467.633 561.956 2.61
TISCO 22.242 5.604 3.97 20.142 4.715 4.27 18.161 4.772 3.81
Meghalaya 5.732 2.524 3.715
HIL 2.168 2.478 0.87 2.393 2.248 1.06
SIL
SPL 19.927 1.695 11.76 30.505 9.406 3.24 65.692 17.022 3.86
GMR 0.993 0.560 1.77
BALCO 1.813 0.120 15.11
CESC 5.594 1.877 2.98
JPVL 13.290 2.800 4.75
ICML 8.172 2.708 3.02 8.854 3.449 2.57
JSPL 8.778 5.999 1.46 9.241 5.989 1.54
MIEL
BLA 1.440 0.300 4.80 0.882 0.300 2.94
PIL 7.994 1.000 7.99 5.200 1.000 5.20
JNL 0.861 0.166 5.19 2.062 0.342 6.03
JPL 12.347 6.226 1.98 9.275 6.248 1.48
ESCL 4.092 0.396 10.33 2.192 0.331 6.62
UML 8.256 0.762 10.83 5.127 0.790 6.49
SEML 2.138 1.165 1.84 3.004 1.189 2.53
BSIL 0.488 0.081 6.02 0.145 0.031 4.68
TUML-SVSL 0.916 0.317 2.89 0.613 0.198 3.10
SOVA 1.148 0.276 4.16 0.946 0.400 2.37
PRIVATE 100.967 34.905 3.46 100.581 39.160 2.75 105.543 30.866 3.89
INDIA 1137.697 516.116 2.23 1300.228 560.667 2.33 1573.176 592.822 2.67
Note: (1) Stripping ratio is defined as the ratio of OBR to Coal produced in Open Cast mining.
(2) Meghalaya OBR figures are not known and not reported.
(3) While calculating stripping ratio, if OBR not reported, corresponding production was excluded to find
public/private sector OBR
YEAR 2015 - 2016YEAR 2013 - 2014 YEAR 2014 - 2015
TABLE 2.19 : COMPANYWISE OVER BURDEN REMOVAL AND STRIPPING RATIO IN REVENUE MINES IN LAST THREE YEARS
COMPANIES
40

TABLE 3.1: TREND OF DESPATCHES OF COAL AND LIGNITE DURING LAST TEN YEARS
( Quantity in Million Tonnes )
DespatchesGrowth
(%)Despatches
Growth
(%)Despatches
Growth
(%)
(1) (2) (3) (4) (5) (6) (7)
2006-07 419.800 6.12 30.797 1.51 450.597 5.79
2007-08 453.567 8.04 34.657 12.53 488.224 8.35
2008-09 489.172 7.85 31.793 -8.26 520.965 6.71
2009-10 513.792 5.03 34.430 8.29 548.222 5.23
2010-11 523.465 1.88 37.685 9.45 561.150 2.36
2011-12 535.299 2.26 41.883 11.14 577.182 2.86
2012-13 567.136 5.95 46.313 10.58 613.449 6.28
2013-14 572.060 0.87 43.897 -5.22 615.957 0.41
2014-15 603.772 5.54 46.954 6.96 650.726 5.64
2015-16 632.169 4.70 42.212 -10.10 674.381 3.64
TABLE 3.2 : TRENDS OF DESPATCHES OF COAL BY TYPE DURING LAST TEN YEARS
( Quantity in Million Tonnes )
DespatchesGrowth
(%)Despatches
Growth
(%)Despatches
Growth
(%)Despatches
Growth
(%)
(1) (2) (3) (4) (5) (6) (7) (8) (9)
2006-07 16.334 -0.98 31.927 4.55 387.873 6.25 419.800 6.12
2007-08 16.438 0.64 33.543 5.06 420.024 8.29 453.567 8.04
2008-09 15.061 -8.38 35.724 6.50 453.448 7.96 489.172 7.85
2009-10 15.173 0.74 42.469 18.88 471.323 3.94 513.792 5.03
2010-11 16.075 5.94 48.950 15.26 474.515 0.68 523.465 1.88
2011-12 15.903 -1.07 51.723 5.66 483.576 1.91 535.299 2.26
2012-13 14.799 -6.94 55.859 8.00 511.277 5.73 567.136 5.95
2013-14 15.236 2.95 58.464 4.66 513.596 0.45 572.060 0.87
2014-15 13.264 -12.94 56.438 -3.47 547.334 6.57 603.772 5.54
2015-16 13.960 5.25 59.213 4.92 572.956 4.68 632.169 4.70
Raw Coal
Year
Raw Coal Lignite Total solid fossil fuel
Year
Metallurgical Coal Total Coking Coal Non Coking Coal
41

TABLE 3.3: TREND OF DESPATCHES OF DIFFERENT TYPES OF COAL PRODUCTS IN LAST TEN YEARS
( Quantity in Million Tonnes )
Despatches Growth Despatches Growth Despatches Growth Despatches Growth Despatches Growth
(1) (2) (3) (4) (5) (6) (7) (8) (9) (10) (11)
2006-07 7.104 -14.89 12.633 2.52 5.758 7.65 2.244 19.23 12.739 -2.23
2007-08 7.206 1.44 12.821 1.49 6.536 13.51 2.466 9.89 12.774 0.27
2008-09 7.226 0.28 13.445 4.87 5.361 -17.98 4.018 62.94 12.465 -2.42
2009-10 6.518 -9.80 13.981 3.99 4.711 -12.12 3.726 -7.27 12.361 -0.83
2010-11 6.854 5.15 14.537 3.98 4.504 -4.39 3.790 1.72 12.546 1.50
2011-12 6.532 -4.70 15.751 8.35 3.802 -15.59 3.545 -6.46 12.340 -1.64
2012-13 6.614 1.26 14.237 -9.61 5.403 42.11 5.184 46.23 12.429 0.72
2013-14 6.645 0.47 15.454 8.55 4.894 -9.42 3.854 -25.66 12.707 2.24
2014-15 6.080 -8.50 16.998 9.99 5.012 2.41 4.493 16.58 13.954 9.81
2015-16 6.067 -0.21 17.545 3.22 5.734 14.41 0* - 13.548 -2.91
Note: 1. All the above figures of Washed Coal & Middling relate to coal companies (private& public).
Private Washeries are not included here.
2. Data of Hard Coke relate to steel plants only. Private sector are not covered as not readily available.
* JSPL & SEML Companies (sources of Middlings Non-coking) are ceased to exist any more.
Hard cokeYear
Washed Coal (Coking)Washed Coal
(Non-Coking)
Middlings
(Coking)
Middlings
(Non-Coking)
42

TABLE 3.4: MONTHLY DESPATCHES OF DIFFERENT TYPES RAW COAL AND LIGNITE AND COAL PRODUCTS IN 2015-16
(Quantity in Million Tonnes)
Desp.Growth
%
Share
%Desp.
Growth
%
Share
%Desp.
Growth
%
Share
%Desp.
Growth
%
Share
%
(1) (2) (3) (4) (5) (6) (7) (8) (9) (10) (11) (12) (13)
Apr-15 4.843 -5.0 8.18 45.589 1.3 7.96 50.432 0.7 7.98 4.107 -10.7 9.73
May-15 4.909 -6.4 8.29 47.242 5.4 8.25 52.151 4.2 8.25 4.053 -13.7 9.60
Jun-15 4.531 -4.4 7.65 45.031 5.7 7.86 49.562 4.7 7.84 3.515 -11.7 8.33
1st Quarter 14.283 -5.3 24.12 137.862 4.1 24.06 152.145 3.2 24.07 11.675 -12.1 27.66
Jul-15 4.521 3.0 7.64 44.277 2.9 7.73 48.798 2.9 7.72 3.249 -11.0 7.70
Aug-15 4.678 2.6 7.90 43.656 4.5 7.62 48.334 4.3 7.65 3.267 -7.0 7.74
Sep-15 4.726 9.6 7.98 43.448 9.2 7.58 48.174 9.2 7.62 3.165 -1.0 7.50
2nd Quarter 13.925 5.0 23.52 131.381 5.4 22.93 145.306 5.4 22.99 9.681 -6.6 22.93
Oct-15 4.843 11.4 8.18 47.942 8.9 8.37 52.785 9.2 8.35 3.234 3.9 7.66
Nov-15 4.879 9.2 8.24 49.511 6.2 8.64 54.390 6.5 8.60 2.581 -23.8 6.11
Dec-15 5.154 14.1 8.70 51.719 2.7 9.03 56.873 3.7 9.00 3.216 -17.7 7.62
3rd Quarter 14.876 11.6 25.12 149.172 5.8 26.04 164.048 6.3 25.95 9.031 -13.3 21.39
Jan-16 5.211 14.2 8.80 52.507 5.7 9.16 57.718 6.4 9.13 3.981 -6.0 9.43
Feb-16 5.213 8.8 8.80 48.615 2.4 8.48 53.828 3.0 8.51 3.677 -12.8 8.71
Mar-16 5.705 5.5 9.63 53.419 2.3 9.32 59.124 2.6 9.35 4.167 -6.4 9.87
4th Quarter 16.129 9.3 27.24 154.541 3.5 26.97 170.670 4.0 27.00 11.825 -8.4 28.01
Yr. 2015-16 59.213 4.9 100.00 572.956 4.7 100.00 632.169 4.7 100.00 42.212 -10.1 100.00
Note: (1) *Growth (%) is calculated over similar period of last year.
(2) **Share (%) is caculated as ratio to yearly production. Contd….
Month
Coking Coal Non Coking Coal Raw Coal Lignite
43
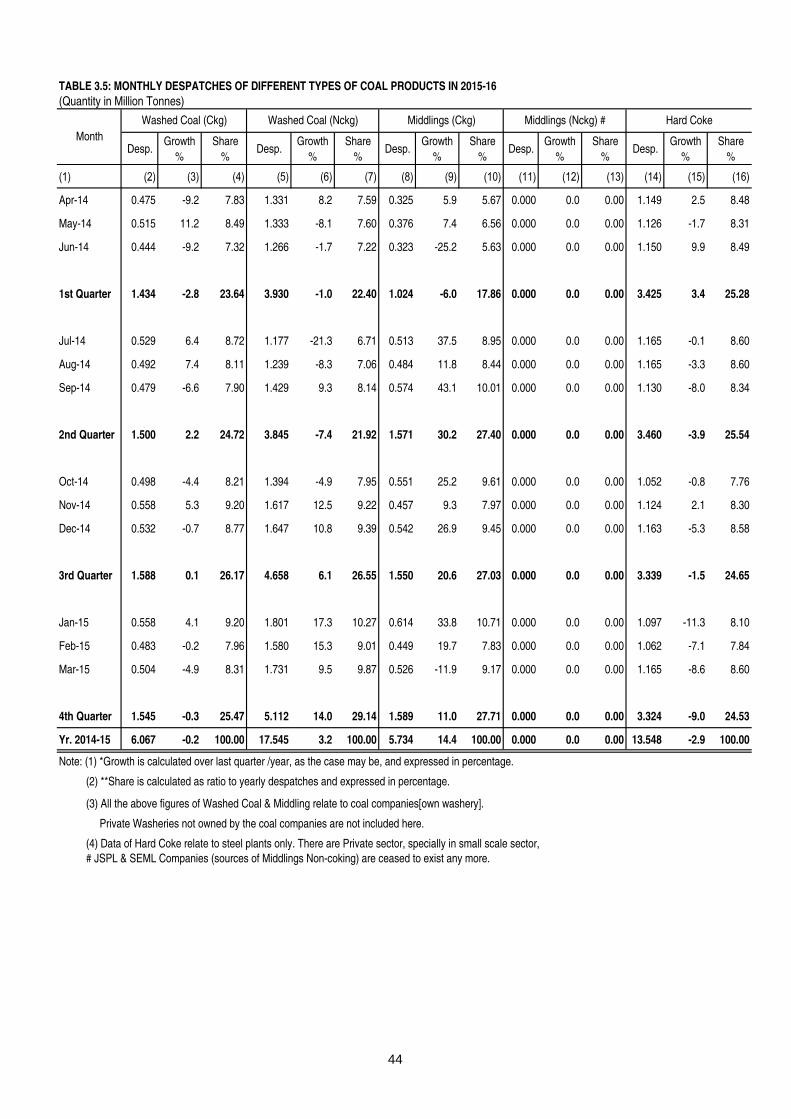
TABLE 3.5: MONTHLY DESPATCHES OF DIFFERENT TYPES OF COAL PRODUCTS IN 2015-16
(Quantity in Million Tonnes)
Desp.Growth
%
Share
%Desp.
Growth
%
Share
%Desp.
Growth
%
Share
%Desp.
Growth
%
Share
%Desp.
Growth
%
Share
%
(1) (2) (3) (4) (5) (6) (7) (8) (9) (10) (11) (12) (13) (14) (15) (16)
Apr-14 0.475 -9.2 7.83 1.331 8.2 7.59 0.325 5.9 5.67 0.000 0.0 0.00 1.149 2.5 8.48
May-14 0.515 11.2 8.49 1.333 -8.1 7.60 0.376 7.4 6.56 0.000 0.0 0.00 1.126 -1.7 8.31
Jun-14 0.444 -9.2 7.32 1.266 -1.7 7.22 0.323 -25.2 5.63 0.000 0.0 0.00 1.150 9.9 8.49
1st Quarter 1.434 -2.8 23.64 3.930 -1.0 22.40 1.024 -6.0 17.86 0.000 0.0 0.00 3.425 3.4 25.28
Jul-14 0.529 6.4 8.72 1.177 -21.3 6.71 0.513 37.5 8.95 0.000 0.0 0.00 1.165 -0.1 8.60
Aug-14 0.492 7.4 8.11 1.239 -8.3 7.06 0.484 11.8 8.44 0.000 0.0 0.00 1.165 -3.3 8.60
Sep-14 0.479 -6.6 7.90 1.429 9.3 8.14 0.574 43.1 10.01 0.000 0.0 0.00 1.130 -8.0 8.34
2nd Quarter 1.500 2.2 24.72 3.845 -7.4 21.92 1.571 30.2 27.40 0.000 0.0 0.00 3.460 -3.9 25.54
Oct-14 0.498 -4.4 8.21 1.394 -4.9 7.95 0.551 25.2 9.61 0.000 0.0 0.00 1.052 -0.8 7.76
Nov-14 0.558 5.3 9.20 1.617 12.5 9.22 0.457 9.3 7.97 0.000 0.0 0.00 1.124 2.1 8.30
Dec-14 0.532 -0.7 8.77 1.647 10.8 9.39 0.542 26.9 9.45 0.000 0.0 0.00 1.163 -5.3 8.58
3rd Quarter 1.588 0.1 26.17 4.658 6.1 26.55 1.550 20.6 27.03 0.000 0.0 0.00 3.339 -1.5 24.65
Jan-15 0.558 4.1 9.20 1.801 17.3 10.27 0.614 33.8 10.71 0.000 0.0 0.00 1.097 -11.3 8.10
Feb-15 0.483 -0.2 7.96 1.580 15.3 9.01 0.449 19.7 7.83 0.000 0.0 0.00 1.062 -7.1 7.84
Mar-15 0.504 -4.9 8.31 1.731 9.5 9.87 0.526 -11.9 9.17 0.000 0.0 0.00 1.165 -8.6 8.60
4th Quarter 1.545 -0.3 25.47 5.112 14.0 29.14 1.589 11.0 27.71 0.000 0.0 0.00 3.324 -9.0 24.53
Yr. 2014-15 6.067 -0.2 100.00 17.545 3.2 100.00 5.734 14.4 100.00 0.000 0.0 0.00 13.548 -2.9 100.00
Note: (1) *Growth is calculated over last quarter /year, as the case may be, and expressed in percentage.
(2) **Share is calculated as ratio to yearly despatches and expressed in percentage.
(3) All the above figures of Washed Coal & Middling relate to coal companies[own washery].
Private Washeries not owned by the coal companies are not included here.
(4) Data of Hard Coke relate to steel plants only. There are Private sector, specially in small scale sector,
# JSPL & SEML Companies (sources of Middlings Non-coking) are ceased to exist any more.
Washed Coal (Ckg) Washed Coal (Nckg) Middlings (Ckg) Middlings (Nckg) # Hard Coke
Month
44
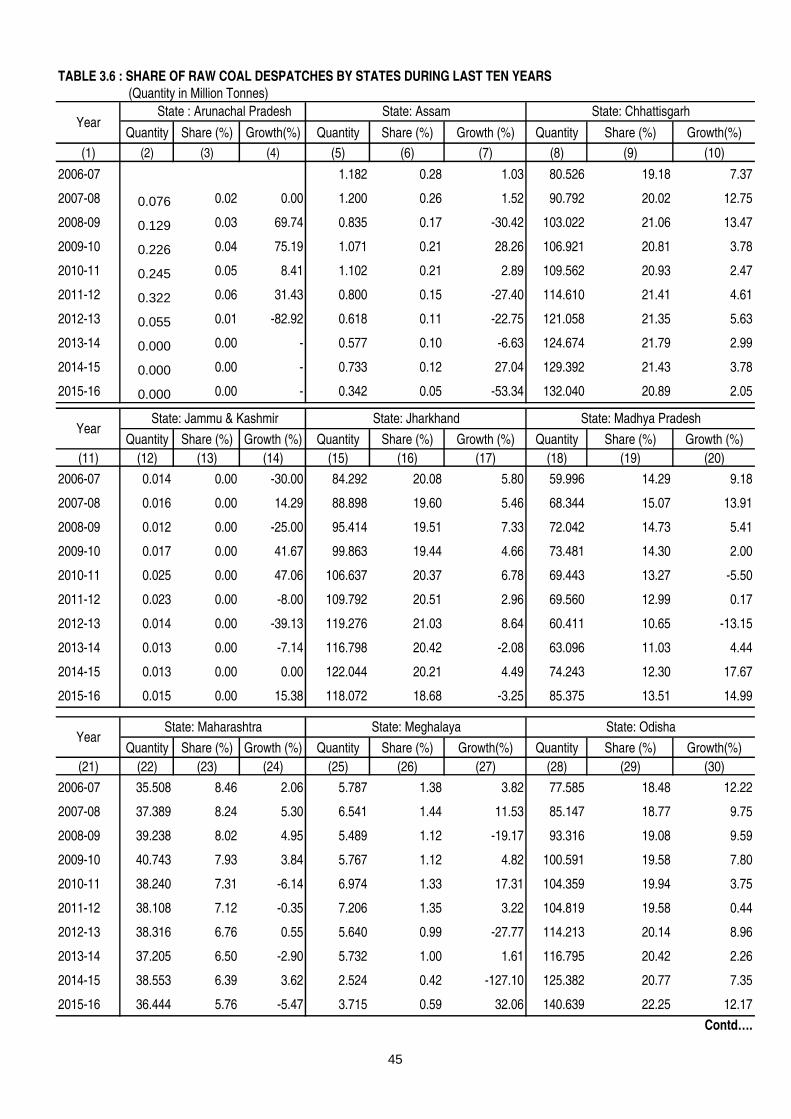
TABLE 3.6 : SHARE OF RAW COAL DESPATCHES BY STATES DURING LAST TEN YEARS
(Quantity in Million Tonnes)
Quantity Share (%) Growth(%) Quantity Share (%) Growth (%) Quantity Share (%) Growth(%)
(1) (2) (3) (4) (5) (6) (7) (8) (9) (10)
2006-07 1.182 0.28 1.03 80.526 19.18 7.37
2007-08 0.076 0.02 0.00 1.200 0.26 1.52 90.792 20.02 12.75
2008-09 0.129 0.03 69.74 0.835 0.17 -30.42 103.022 21.06 13.47
2009-10 0.226 0.04 75.19 1.071 0.21 28.26 106.921 20.81 3.78
2010-11 0.245 0.05 8.41 1.102 0.21 2.89 109.562 20.93 2.47
2011-12 0.322 0.06 31.43 0.800 0.15 -27.40 114.610 21.41 4.61
2012-13 0.055 0.01 -82.92 0.618 0.11 -22.75 121.058 21.35 5.63
2013-14 0.000 0.00 - 0.577 0.10 -6.63 124.674 21.79 2.99
2014-15 0.000 0.00 - 0.733 0.12 27.04 129.392 21.43 3.78
2015-16 0.000 0.00 - 0.342 0.05 -53.34 132.040 20.89 2.05
Quantity Share (%) Growth (%) Quantity Share (%) Growth (%) Quantity Share (%) Growth (%)
(11) (12) (13) (14) (15) (16) (17) (18) (19) (20)
2006-07 0.014 0.00 -30.00 84.292 20.08 5.80 59.996 14.29 9.18
2007-08 0.016 0.00 14.29 88.898 19.60 5.46 68.344 15.07 13.91
2008-09 0.012 0.00 -25.00 95.414 19.51 7.33 72.042 14.73 5.41
2009-10 0.017 0.00 41.67 99.863 19.44 4.66 73.481 14.30 2.00
2010-11 0.025 0.00 47.06 106.637 20.37 6.78 69.443 13.27 -5.50
2011-12 0.023 0.00 -8.00 109.792 20.51 2.96 69.560 12.99 0.17
2012-13 0.014 0.00 -39.13 119.276 21.03 8.64 60.411 10.65 -13.15
2013-14 0.013 0.00 -7.14 116.798 20.42 -2.08 63.096 11.03 4.44
2014-15 0.013 0.00 0.00 122.044 20.21 4.49 74.243 12.30 17.67
2015-16 0.015 0.00 15.38 118.072 18.68 -3.25 85.375 13.51 14.99
Quantity Share (%) Growth (%) Quantity Share (%) Growth(%) Quantity Share (%) Growth(%)
(21) (22) (23) (24) (25) (26) (27) (28) (29) (30)
2006-07 35.508 8.46 2.06 5.787 1.38 3.82 77.585 18.48 12.22
2007-08 37.389 8.24 5.30 6.541 1.44 11.53 85.147 18.77 9.75
2008-09 39.238 8.02 4.95 5.489 1.12 -19.17 93.316 19.08 9.59
2009-10 40.743 7.93 3.84 5.767 1.12 4.82 100.591 19.58 7.80
2010-11 38.240 7.31 -6.14 6.974 1.33 17.31 104.359 19.94 3.75
2011-12 38.108 7.12 -0.35 7.206 1.35 3.22 104.819 19.58 0.44
2012-13 38.316 6.76 0.55 5.640 0.99 -27.77 114.213 20.14 8.96
2013-14 37.205 6.50 -2.90 5.732 1.00 1.61 116.795 20.42 2.26
2014-15 38.553 6.39 3.62 2.524 0.42 -127.10 125.382 20.77 7.35
2015-16 36.444 5.76 -5.47 3.715 0.59 32.06 140.639 22.25 12.17
Contd….
Year State : Arunachal Pradesh State: Assam State: Chhattisgarh
Year State: Jammu & Kashmir State: Jharkhand State: Madhya Pradesh
YearState: Maharashtra State: Meghalaya State: Odisha
45

TABLE 3.6 : SHARE OF RAW COAL DESPATCHES BY STATES DURING LAST TEN YEARS
(Quantity in Million Tonnes)
Quantity Share (%) Growth (%) Quantity Share (%) Growth(%) Quantity Share (%) Growth(%)
(31) (32) (33) (34) (35) (36) (37) (38) (39) (40)
2006-07 37.487 8.93 6.13 12.393 2.95 -21.83 25.030 5.96 3.80
2007-08 41.793 9.21 11.49 11.216 2.47 -9.50 22.155 4.88 -11.49
2008-09 44.410 9.08 6.26 12.448 2.54 10.98 22.817 4.66 2.99
2009-10 49.266 9.59 10.93 13.587 2.64 9.15 22.259 4.33 -2.45
2010-11 50.046 9.56 1.58 15.393 2.94 13.29 21.439 4.10 -3.68
2011-12 51.389 9.60 2.68 15.467 2.89 0.48 23.203 4.33 8.23
2012-13 52.025 9.17 1.24 28.824 5.08 86.36 26.686 4.71 15.01
2013-14 47.892 8.37 -7.94 30.807 5.39 6.88 28.471 4.98 6.69
2014-15 52.662 8.72 9.96 29.021 4.81 -5.80 29.205 4.84 2.58
2015-16 58.238 9.21 10.59 31.815 5.03 9.63 25.474 4.03 -12.78
Quantity Growth(%)
(41) (42) (43)
2006-07 419.800 13.01
2007-08 453.567 8.04
2008-09 489.172 7.85
2009-10 513.792 5.03
2010-11 523.465 1.88
2011-12 535.299 2.26
2012-13 567.136 5.95
2013-14 572.060 0.87
2014-15 603.772 5.54
2015-16 632.169 4.70
Note: The State of Telangana is curved out of the state of Andhra Pradesh w.e.f 2014-15
YearState: Telangana State: Uttar Pradesh State: West Bengal
YearAll India
46

TABLE 3.7 : SHARE OF LIGNITE DESPATCHES BY STATES DURING LAST TEN YEARS
( Million Tonnes) (Quantity in Million Tonnes)
Quantity Share (%) Growth (%) Quantity Share (%) Growth (%)
(1) (2) (3) (4) (5) (6) (7)
2006-07 20.511 66.60 -0.19 9.819 31.88 7.77
2007-08 22.259 64.23 8.52 11.792 34.02 20.09
2008-09 20.748 65.26 -6.79 10.046 31.60 -14.81
2009-10 22.812 66.26 9.95 10.411 30.24 3.63
2010-11 23.081 61.25 1.18 13.079 34.71 25.63
2011-12 24.472 58.43 6.03 14.448 34.50 10.47
2012-13 24.312 52.49 -0.65 14.670 31.68 1.54
2013-14 24.438 55.67 0.52 11.831 26.95 -19.35
2014-15 24.088 51.30 -1.43 12.362 26.33 4.49
2015-16 22.493 53.29 -6.62 10.136 24.01 -18.01
Quantity Share (%) Growth (%) Quantity Growth (%)
(8) (9) (10) (11) (12) (13)
2006-07 0.467 1.52 -31.02 30.797 1.51
2007-08 0.606 1.75 29.76 34.657 12.53
2008-09 0.999 3.14 64.85 31.793 -8.26
2009-10 1.207 3.51 20.82 34.430 8.29
2010-11 1.525 4.05 26.35 37.685 9.45
2011-12 2.963 7.07 94.30 41.883 11.14
2012-13 7.331 15.83 147.42 46.313 10.58
2013-14 7.628 17.38 4.05 43.897 -5.22
2014-15 10.504 22.37 37.70 46.954 6.96
2015-16 9.583 22.70 -8.77 42.212 -10.10
YearState: Tamilnadu State: Gujarat
YearState: Rajasthan ALL INDIA
47

TABLE 3.8 : TRENDS OF COMPANY WISE DESPATCHES OF COAL & LIGNITE DURING LAST THREE YEARS (Quantity in Million Tonnes)
Coking N-Coking Total Coking N-Coking Total Coking N-Coking Total
(1) (8) (9) (10) (8) (9) (10) (8) (9) (10)
ECL 0.045 35.929 35.974 0.036 38.184 38.220 0.017 38.362 38.379
BCCL 31.496 2.562 34.058 30.093 3.514 33.607 32.914 3.250 36.164
CCL 18.679 33.442 52.121 19.359 35.978 55.337 18.799 40.783 59.582
NCL 0.000 71.892 71.892 0.000 73.518 73.518 0.000 78.532 78.532
WCL 0.268 39.671 39.939 0.232 41.008 41.240 0.200 42.106 42.306
SECL 0.123 121.890 122.013 0.125 123.084 123.209 0.108 136.474 136.582
MCL 114.342 114.342 122.996 122.996 140.214 140.214
NEC 0.577 0.577 0.733 0.733 0.342 0.342
CIL 50.611 420.305 470.916 49.845 439.015 488.860 52.038 480.063 532.101
SCCL 47.892 47.892 52.662 52.662 58.238 58.238
JKML 0.013 0.013 0.013 0.013 0.015 0.015
JSMDCL 0.000 0.408 0.408 0.197 0.197
DVC 0.045 0.045 0.055 0.055 0.392 0.392
IISCO 0.541 0.081 0.622 0.420 0.199 0.619 0.558 0.167 0.725
SAIL 0.044 0.031 0.075 0.024 0.001 0.025 0.000
RRVUNL 1.197 1.197 3.443 3.443 6.210 6.210
SECL(GP-IV/2&3) 2.152 2.152
DVC EMTA 1.523 1.523 1.006 1.006
APMDTCL
WBPDCL 2.610 2.610 6.248 6.248
PSEB-PANEM 5.852 5.852 3.454 3.454
KECML 2.472 2.472 2.413 2.413
WBMDTCL 0.734 0.734 1.111 1.111
MPSMCL 0.000 1.505 1.505
Total Public 51.196 482.755 533.951 50.289 511.533 561.822 52.988 547.042 600.030
TISCO 6.902 0.067 6.969 6.037 0.024 6.061 6.225 0.008 6.233
MEGHALAYA 5.732 5.732 2.524 2.524 3.715 3.715
HIL 0.012 0.012
SIL 0.159 0.159 0.196 0.196 0.163 0.163
SPL 1.845 1.845 9.261 9.261 16.842 16.842
GMR 0.425 0.425
BALCO 0.079 0.079
CESC 1.874 1.874
JPVL 2.796 2.796
ICML 3.278 3.278 3.771 3.771
JSPL 5.999 5.999 5.989 5.989
MIEL 0.905 0.905 1.022 1.022
HIL 2.453 2.453 2.386 2.386
BLA 0.300 0.300 0.300 0.300
PIL 1.000 1.000 1.000 1.000
JNL 0.394 0.394 0.777 0.777
JPL 6.223 6.223 5.726 5.726
ESCL 0.366 0.004 0.370 0.112 0.021 0.133
UML 0.759 0.759 0.794 0.794
SEML 1.117 1.117 1.266 1.266
BSIL 0.027 0.027 0.136 0.136
TUML/SVSL 0.300 0.300 0.208 0.208
SOVA 0.279 0.279 0.400 0.400
Total Private 7.268 30.841 38.109 6.149 35.801 41.950 6.225 25.914 32.139
ALL INDIA 58.464 513.596 572.060 56.438 547.334 603.772 59.213 572.956 632.169
LIGNITE :
NLC 25.991 25.441 23.717
GMDCL 8.398 8.713 6.969
GIPCL 3.249 3.456 3.063
RSMML 1.428 1.405 0.972
GHCL 0.190 0.193 0.104
VSLPPL 0.839 0.823 0.824
BLMCL 3.802 6.923 6.563
ALL INDIA 43.897 46.954 42.212
COAL & LIGNITE 615.957 650.726 674.381
2015-16Company
2013-14 2014-15
48

TABLE 3.9 : STATEWISE AND COMPANYWISE DESPATCHES OF RAW COAL BY TYPE IN LAST THREE YEARS
(Quantity in Million Tonnes)
Coking N-Coking Total Coking N-Coking Total Coking N-Coking Total
(1) (2) (3) (4) (5) (6) (7) (8) (9) (10) (11)
Arunachal Pradesh APMDTCL 0.000 0.000
Assam NEC 0.577 0.577 0.733 0.733 0.342 0.342
Chhattisgarh SECL 0.123 107.716 107.839 0.125 110.044 110.169 0.108 123.479 123.587
Chhattisgarh SECL(GP-IV/2&3) 0.000 0.000 2.152 2.152
Chhattisgarh HIL 0.000 0.000 0.012 0.012
Chhattisgarh RRVUNL 1.197 1.197 3.443 3.443 6.210 6.210
Chhattisgarh BALCO 0.079 0.079
Chhattisgarh JSPL 5.999 5.999 5.989 5.989
Chhattisgarh MIEL 0.905 0.905 1.022 1.022
Chhattisgarh PIL 1.000 1.000 1.000 1.000
Chhattisgarh JNL 0.394 0.394 0.777 0.777
Chhattisgarh JPL 6.223 6.223 5.726 5.726
Chhattisgarh SEML 1.117 1.117 1.266 1.266
Chhattisgarh TOTAL 0.123 124.551 124.674 0.125 129.267 129.392 0.108 131.932 132.040
Jammu & Kashmir JKML 0.013 0.013 0.013 0.013 0.015 0.015
Jharkhand ECL 0.038 17.301 17.339 0.029 18.646 18.675 0.017 17.450 17.467
Jharkhand BCCL 30.257 2.388 32.645 29.551 3.124 32.675 30.908 2.721 33.629
Jharkhand CCL 18.679 33.442 52.121 19.359 35.978 55.337 18.799 40.783 59.582
Jharkhand JSMDCL 0.000 0.408 0.408 0.197 0.197
Jharkhand DVC 0.045 0.045 0.055 0.055 0.392 0.392
Jharkhand IISCO 0.541 0.541 0.420 0.420 0.558 0.014 0.572
Jharkhand SAIL 0.044 0.031 0.075 0.024 0.001 0.025 0.000
Jharkhand TISCO 6.902 0.067 6.969 6.037 0.024 6.061 6.225 0.008 6.233
Jharkhand PSEB-PANEM 5.852 5.852 3.454 3.454
Jharkhand UML 0.759 0.759 0.794 0.794
Jharkhand WBPDCL 0.082 0.082 4.007 4.007
Jharkhand ESCL 0.366 0.004 0.370 0.112 0.021 0.133
Jharkhand TOTAL 56.827 59.971 116.798 55.532 66.512 122.044 56.899 61.173 118.072
Madhya Pradesh NCL 41.085 41.085 44.497 44.497 46.717 46.717
Madhya Pradesh WCL 0.268 5.424 5.692 0.232 5.408 5.640 0.200 5.825 6.025
Madhya Pradesh SECL 14.174 14.174 13.040 13.040 12.995 12.995
Madhya Pradesh JPVL 2.796 2.796
Madhya Pradesh SPL 1.845 1.845 9.261 9.261 16.842 16.842
Madhya Pradesh MPSMCL 0.000 1.505 1.505
Madhya Pradesh BLA 0.300 0.300 0.300 0.300
Madhya Pradesh TOTAL 0.268 62.828 63.096 0.232 74.011 74.243 0.200 85.175 85.375
Maharashtra WCL 34.247 34.247 35.600 35.600 36.281 36.281
Maharashtra SIL 0.159 0.159 0.196 0.196 0.163 0.163
Maharashtra KECML 2.472 2.472 2.413 2.413
Maharashtra BSIL 0.027 0.027 0.136 0.136
Maharashtra TUML-SVSL 0.300 0.300 0.208 0.208
Maharashtra TOTAL 0.000 37.205 37.205 0.000 38.553 38.553 0.000 36.444 36.444
Meghalaya MEGHALAYA 5.732 5.732 2.524 2.524 3.715 3.715
Odisha MCL 114.342 114.342 122.996 122.996 140.214 140.214
Odisha HIL 2.453 2.453 2.386 2.386
Odisha GMR 0.000 0.000 0.425 0.425
Odisha TOTAL 116.795 116.795 125.382 125.382 140.639 140.639
Telangana SCCL 47.892 47.892 52.662 52.662 58.238 58.238
Uttar Pradesh NCL 30.807 30.807 29.021 29.021 31.815 31.815
West Bengal ECL 0.007 18.628 18.635 0.007 19.538 19.545 20.912 20.912
West Bengal BCCL 1.239 0.174 1.413 0.542 0.390 0.932 2.006 0.529 2.535
West Bengal IISCO 0.081 0.081 0.199 0.199 0.153 0.153
West Bengal CESC 0.000 0.000 1.874 1.874
West Bengal WBPDCL 2.528 2.528 2.241 2.241
West Bengal ICML 3.278 3.278 3.771 3.771
West Bengal DVCEMTA 1.523 1.523 1.006 1.006
West Bengal WBMDTCL 0.734 0.734 1.111 1.111
West Bengal SOVA 0.279 0.279 0.400 0.400
West Bengal TOTAL 1.246 27.225 28.471 0.549 28.656 29.205 2.006 23.468 25.474
Total Public 51.562 477.207 528.769 50.401 508.400 558.801 52.988 547.042 600.030
Total Private 6.902 36.389 43.291 6.037 38.934 44.971 6.225 25.914 32.139
All India 58.464 513.596 572.060 56.438 547.334 603.772 59.213 572.956 632.169
2013-14 2014-15 2015-16States Company
49

TABLE 3.10 : CAPTIVE BLOCK WISE DESPATCH OF RAW COAL DURING LAST TWO YEARS
(Quantity in Million Tonnes)
Coking
Coal
Non
Coking
Coal
Total
Coal
Coking
Coal
Non
Coking
Coal
Total
Coal
Tasra SAIL/IISCO Jharkhand 0.024 0.001 0.025 0.000
Parsa East & Kanta Basan RRVUNL Chhittsgarh 3.443 3.443 6.210 6.210
Gare Palma IV/2&3 SECL(GP-IV/2&3) Chhittsgarh 2.152 2.152
Amelia North MPSMCL Madhya Pradesh 1.505 1.505
Baranj I-IV, Kiloni,Manora Deep KECML Maharashtra 2.413 2.413
Barjora North DVCEMTA West Bengal 1.006 1.006
Barjore WBPDCL West Bengal 0.214 0.214
Gangaramchak & Bhadulia WBPDCL West Bengal 0.209 0.209
Namchik Namphuk APMDTCL Arunachal Pradesh
Pachwara Central PSEB-PANEM Jharkhand 3.454 3.454
Panchwara North WBPDCL Jharkhand 4.007 4.007
Tara East & West WBPDCL West Bengal 1.818 1.818
Trans Damodar WBMDTCL West Bengal 1.111 1.111
Total Public 0.000 19.180 19.180 0.000 8.362 8.362
Talabira I GMR Odisha 0.425 0.425
Sarshatali CESC West Bengal 1.874 1.874
Moher & Moher Amlori Extn SPL Madhya Pradesh 9.261 9.261 16.842 16.842
Gare Palma IV/4 & 5 HIL Chhittsgarh 0.012 0.012
Chotia BALCO Chhittsgarh 0.079 0.079
Belgaon SIL Maharashtra 0.196 0.196 0.163 0.163
Amelia North JPVL Madhya Pradesh 2.796 2.796
Ardhagram SOVA West Bengal 0.400 0.400
Chotia PIL Chhittsgarh 1.000 1.000
Gare Palma IV/1 JSPL Chhittsgarh 5.989 5.989
Gare Palma IV/2&3 JPL Chhittsgarh 5.726 5.726
Gare Palma IV/4 JNL Chhittsgarh 0.777 0.777
Gare Palma IV/5 MIEL Chhittsgarh 1.022 1.022
Gare Palma IV/7 SEML Chhittsgarh 1.266 1.266
Gotitoria East & West BLA Madhya Pradesh 0.300 0.300
Kathautia UML Jharkhand 0.794 0.794
Marki Mangli I BSIL Maharashtra 0.136 0.136
Marki Mangli II-III TUML-SVSL Maharashtra 0.208 0.208
Parbatpur Central ESCL Jharkhand 0.112 0.021 0.133
Sarshatali ICML West Bengal 3.771 3.771
Talabira I HIL Odisha 2.386 2.386
Total Private 0.112 33.253 33.365 0.000 22.191 22.191
Grand Total 0.112 52.433 52.545 0.000 30.553 30.553
2015-16
Block Company State
2014-15
50

TABLE 3.11: GRADEWISE DESPATCH OF COKING COAL BY COMPANIES IN 2015-16
(Quantity in Million Tonnes)
Steel-I Steel-II SC-1 Wash-I Wash-II Wash-III Wash-IV SLV1 Met Coal Non MetTotal
Coking
(1) (2) (3) (4) (5) (6) (7) (8) (9) (10) (11) (12)
ECL 0.017 0.017
BCCL 0.029 1.035 0.198 1.605 9.838 20.209 32.914
CCL 18.799 18.799
NCL 0.000 0.000
WCL 0.200 0.200
SECL 0.108 0.108 0.108
MCL 0.000 0.000
NEC 0.000 0.000
CIL 0.029 1.035 0.108 0.198 1.805 28.654 20.209 0.000 0.000 52.038 52.038
SCCL 0.000
JKML 0.000
JSMDCL 0.000
DVC 0.392 0.392
IISCO 0.075 0.483 0.558 0.000 0.558
SAIL 0.000 0.000
RRVUNL 0.000
SECL
(GP-IV/2&3)0.000
Total Public 0.029 1.035 0.108 0.198 1.805 28.729 21.084 0.000 0.558 52.038 52.988
TISCO 0.134 1.049 5.042 0.000 6.225 0.000 6.225
Meghalaya 0.000
SIL 0.000
HIL 0.000
SPL 0.000
GMR 0.000
BALCO 0.000
JPVL 0.000
CESC 0.000
Total Private 0.000 0.000 0.000 0.000 0.134 1.049 5.042 0.000 6.225 0.000 6.225
ALL INDIA 0.029 1.035 0.108 0.198 1.939 29.778 26.126 0.000 6.783 52.038 59.213
Companies
COKING COAL GRADE
51

TABLE 3.12: GRADEWISE DESPATCH OF NON COKING COAL BY COMPANIES IN 2015-16
(Quantity in Million Tonnes)
1 2 3 4 5 6 7 8 9 10 11 12 13 14 15 16 17 UNG
Total
Non
Coking
(1) (2) (3) (4) (5) (6) (7) (8) (9) (10) (11) (12) (13) (14) (15) (16) (17) (18) (19) (20) (21)
ECL 0.094 1.310 14.124 4.920 1.408 2.334 0.184 13.988 38.362 38.379
BCCL 0.211 0.359 0.077 1.374 1.119 0.110 3.250 36.164
CCL 0.044 0.138 2.545 18.225 11.080 5.314 3.437 40.783 59.582
NCL 0.503 0.212 17.482 11.687 46.909 1.739 78.532 78.532
WCL 0.016 0.334 1.201 2.695 9.155 25.747 2.958 42.106 42.306
SECL 2.688 3.573 6.260 6.198 4.659 1.161 1.447 2.325 97.444 10.719 136.474 136.582
MCL 0.105 0.153 0.311 2.096 13.209 79.664 44.676 140.214 140.214
NEC 0.053 0.230 0.059 0.342 0.342
CIL 0.053 0.324 4.209 18.175 12.337 12.938 46.514 22.340 27.615 54.288 121.733 97.436 62.101 0.000 0.000 0.000 0.000 0.000 480.063 532.101
SCCL 0.712 10.694 1.163 9.528 8.761 12.409 11.022 1.401 1.734 0.631 0.183 58.238 58.238
JKML 0.015 0.015 0.015
JSMDCL 0.197 0.197 0.197
DVC 0.000 0.392
IISCO 0.029 0.138 0.167 0.725
SAIL 0.000 0.000
RRVUNL 6.210 6.210 6.210
SECL
(GP-IV/2&3)1.049 1.103 2.152 2.152
Total Public 0.053 0.324 4.209 18.204 13.049 13.076 57.208 23.503 37.143 63.049 140.352 97.633 73.123 2.450 2.837 0.000 0.646 0.183 547.042 600.030
TISCO 0.008 0.008 6.233
Meghalaya 3.715 3.715 3.715
SIL 0.163 0.163 0.163
HIL 0.012 0.012 0.012
SPL 16.842 16.842 16.842
GMR 0.059 0.366 0.425 0.425
BALCO 0.079 0.079 0.079
JPVL 2.796 2.796 2.796
CESC 1.874 1.874 1.874
Total Private 3.715 0.000 0.000 0.000 0.000 0.000 0.000 0.163 0.079 16.854 4.670 0.008 0.059 0.366 0.000 0.000 0.000 0.000 25.914 32.139
ALL INDIA 3.768 0.324 4.209 18.204 13.049 13.076 57.208 23.666 37.222 79.903 145.022 97.641 73.182 2.816 2.837 0.000 0.646 0.183 572.956 632.169
Companies
NON-COKING COAL GRADE
Total
Coal
52

TABLE 3.13: MODEWISE COMPANYWISE DESPATCHES OF RAW COAL IN 2015-16 ( External & Internal )
(Quantity of Million Tonnes)
Rail Road MGR Rope Belt OtherTotal
ExternalRail Road MGR Rope Belt Other
Total
Internal
Total
Despatch
(1) (2) (3) (4) (5) (6) (7) (8) (9) (10) (11) (12) (13) (14) (15) (16)
ECL 26.444 1.679 10.256 38.379 0.000 38.379
BCCL 27.560 6.193 33.753 1.049 1.362 2.411 36.164
CCL 26.771 19.725 46.496 13.086 13.086 59.582
NCL 27.857 6.799 38.751 1.840 75.247 3.285 3.285 78.532
WCL 27.140 11.860 0.255 1.968 0.929 42.152 0.154 0.154 42.306
SECL 46.876 54.798 25.066 7.136 2.706 136.582 0.000 136.582
MCL 89.080 34.515 15.231 1.388 140.214 0.000 140.214
NEC 0.274 0.068 0.342 0.000 0.342
CIL 272.002 135.637 89.559 1.968 11.293 2.706 513.165 1.049 17.733 0.000 0.000 0.000 0.154 18.936 532.101
SCCL 38.179 8.999 8.611 0.459 1.990 58.238 0.000 58.238
JKML 0.015 0.015 0.000 0.015
JSMDCL 0.197 0.197 0.000 0.197
DVC 0.392 0.392 0.000 0.392
IISCO 0.167 0.167 0.302 0.065 0.191 0.558 0.725
SAIL 0.000 0.000 0.000 0.000 0.000
RRUVNL 0.000 6.210 6.210 6.210
SECL(GP-IV/2&3) 2.152 2.152 0.000 2.152
PUBLIC 310.181 147.559 98.170 2.427 11.293 4.696 574.326 1.049 18.035 0.000 0.065 0.191 6.364 25.704 600.030
TISCO 0.000 0.271 0.222 5.740 6.233 6.233
MEG 3.715 3.715 0.000 3.715
CESC 0.115 0.115 1.759 1.759 1.874
HIL 0.012 0.012 0.000 0.012
GMR 0.425 0.425 0.000 0.425
BALCO 0.079 0.079 0.000 0.079
SIL 0.163 0.163 0.000 0.163
JPVL 2.796 2.796 0.000 2.796
SPL 0.000 16.842 16.842 0.000 16.842
PRIVATE 2.959 4.346 0.000 0.000 16.842 0.000 24.147 0.000 2.030 0.000 0.222 5.740 0.000 7.992 32.139
GRAND TOTAL 313.140 151.905 98.170 2.427 28.135 4.696 598.473 1.049 20.065 0.000 0.287 5.931 6.364 33.696 632.169
Company
YEAR 2015-16 (External) YEAR 2015 - 16 (Internal)
53

TABLE 3.14: COMPANYWISE OFF-TAKE OF RAW COAL & LIGNITE TO DIFFERENT PRIORITY SECTORS DURING 2015-16
(Quantity of Million Tonnes)
Company
Pow
er (
Util
ity)
Pow
er (
Cap
tive)
Ste
el
Ste
el (
Boi
lers
)
Cem
ent
Fer
tilis
ers
Spo
nge
Iron
Oth
er b
asic
-
Met
al (
Alu
min
ium
etc)
Che
mic
al
Pul
p &
Pap
er
Tex
tiles
&
Ray
ons
Bric
ks
Oth
er
To
tal
Des
pat
ches
Col
liery
Con
sum
ptio
n
To
tal O
ffta
ke
(1) (2) (3) (4) (5) (6) (7) (8) (9) (10) (11) (12) (13) (14) (15) (16) (17)
COAL :
ECL 35.775 0.090 0.204 0.088 0.063 0.017 0.044 0.003 0.014 2.081 38.379 0.227 38.606
BCCL 28.993 0.000 0.907 1.031 5.233 36.164 0.049 36.213
CCL 33.517 1.845 4.276 0.239 0.593 0.018 19.094 59.582 0.001 59.583
NCL 69.549 3.929 0.208 0.102 0.246 4.498 78.532 78.532
WCL 31.791 1.958 0.200 1.709 0.329 0.071 0.380 0.075 5.793 42.306 0.004 42.310
SECL 105.403 5.288 0.108 0.216 2.959 1.021 3.284 0.000 0.162 0.042 18.099 136.582 0.014 136.596
MCL 93.173 18.292 0.240 0.004 3.166 25.339 140.214 0.005 140.219
NEC 0.000 0.175 0.022 0.037 0.108 0.342 0.342
CIL 398.201 31.577 5.491 0.420 5.226 2.295 7.537 0.246 0.106 0.623 0.120 0.014 80.245 532.101 0.300 532.401
SCCL 47.563 2.110 0.117 3.668 0.098 0.194 0.225 0.578 0.147 0.014 3.524 58.238 0.034 58.272
JKML 0.002 0.001 0.012 0.015 0.015
JSMDCL 0.100 0.030 0.030 0.037 0.197 0.197
DVC 0.392 0.392 0.392
IISCO 0.558 0.153 0.014 0.725 0.725
SAIL 0.000 0.000 0.000 0.000
RRVUNL 6.210 6.210 6.210
SECL(GP-IV/2&3) 2.152 2.152 2.152
PUBLIC 445.864 40.289 6.166 0.573 8.926 2.295 7.665 0.440 0.331 1.201 0.268 0.077 85.935 600.030 0.334 600.364
TISCO 6.207 0.026 6.233 0.001 6.234
MEG 3.715 3.715 3.715
CESC 0.115 1.759 1.874 1.874
HIL 0.012 0.012 0.012
GMR 0.425 0.425 0.425
BALCO 0.079 0.079 0.079
SIL 0.065 0.098 0.163 0.163
JPVL 2.796 2.796 2.796
SPL 16.842 16.842 16.842
PRIVATE 0.115 21.978 6.207 0.000 0.000 0.000 0.098 0.000 0.000 0.000 0.000 0.000 3.741 32.139 0.001 32.140
GRAND TOTAL 445.979 62.267 12.373 0.573 8.926 2.295 7.763 0.440 0.331 1.201 0.268 0.077 89.676 632.169 0.335 632.504
LIGNITE:
GIPCL 3.063 3.063 3.063
GMDCL 3.124 0.113 0.003 0.267 0.384 1.723 0.384 0.971 6.969 6.969
GHCL 0.104 0.104 0.104
NLCL 21.954 1.627 0.000 0.048 0.002 0.053 0.001 0.009 0.023 23.717 23.717
RSMML 0.000 0.283 0.087 0.000 0.000 0.004 0.598 0.972 0.972
VSLPPL 0.824 0.824 0.824
BLMCL 6.563 6.563 6.563
TOTAL 21.954 15.588 0.000 0.000 0.248 0.003 0.000 0.000 0.269 0.437 1.728 0.393 1.592 42.212 0.000 42.212
54

TABLE 3.15 : AVAILABILITY AND OFF-TAKE OF INDIAN RAW COAL BY COMPANIES DURING 2014-15 & 2015-16
(Quantity in Million Tonnes)
(1) (2) (3) (4) (5) (6) (7) (8) (9) (10) (11) (12) (13) (14) (15)
CIL 48.683 494.234 542.917 488.860 0.512 489.372 53.491 53.491 536.475 589.966 532.101 0.300 532.401 57.556
SCCL 5.548 52.536 58.084 52.662 0.063 52.725 5.348 5.348 60.380 65.728 58.238 0.034 58.272 6.460
JKML 0.013 0.013 0.026 0.013 0.013 0.013 0.013 0.015 0.028 0.015 0.015 0.013
JSMDCL 0.000 0.415 0 0.408 0 0.007 0.007 0.190 0 0.197 0 0.000
DVC 0.020 0.066 0.086 0.055 0.055 0.030 0.030 0.403 0.433 0.392 0.392 0.041
IISCO 0.009 0.626 0.635 0.619 0.619 0.013 0.013 0.727 0.740 0.725 0.725 0.012
SAIL 0.000 0.025 0.025 0.025 0.025 0.000 0.000 0.000 0.000 0.000 0.000 0.000
RRVUNL 0.000 3.443 3.443 3.443 3.443 0.000 0.000 6.210 6.210 6.210 6.210 0.000
SECL(GP-IV/2&3) 2.278 2.278 2.152 2.152 0.126
DVC EMTA 0.005 1.001 1.006 1.006 1.006 0.000
APMDTCL 0.000 0.000 0.000 0.000 0.000 0.000
WBPDCL 0.034 6.221 6.255 6.248 6.248 0.008
WBMDTCL 0.077 1.041 1.118 1.111 1.111 0.007
PSEB-PANEM 0.110 3.433 3.543 3.454 3.454 0.089
KECML 2.478 2.478 2.413 2.413 0.095
MPSMCL 1.500 1.500 1.505 1.505 0.000
PUBLIC 54.499 567.032 621.531 561.822 0.575 562.397 59.101 58.902 606.678 665.580 600.030 0.334 600.364 64.208
TISCO 0.017 6.043 6.060 6.061 0.001 6.062 0.012 0.012 6.228 6.240 6.233 0.001 6.234 0.007
Meghalaya 2.524 2.524 2.524 2.524 0.000 0.000 3.715 3.715 3.715 3.715 0.000
HIL 0.144 2.248 2.392 2.386 2.386 0.008 0.008 0.069 0.077 0.012 0.012 0.057
SIL 0.009 0.196 0.205 0.196 0.196 0.009 0.009 0.165 0.174 0.163 0.163 0.011
SPL 0.000 9.406 9.406 9.261 9.261 0.145 0.145 17.022 17.167 16.842 16.842 0.326
GMR 0.560 0.560 0.425 0.425 0.136
BALCO 0.120 0.120 0.079 0.079 0.041
CESC 1.877 1.877 1.874 1.874 0.003
JPVL 2.800 2.800 2.796 2.796 0.004
ICML 0.278 3.449 3.727 3.771 3.771 0.000
JSPL 0.010 5.989 5.999 5.989 5.989 0.010
MIEL 0.022 1.000 1.022 1.022 1.022 0.000
BLA 0.000 0.300 0.300 0.300 0.300 0.000
PIL 0.001 1.000 1.001 1.000 1.000 0.000
JNL 0.076 0.703 0.779 0.777 0.777 0.002
JPL 0.005 6.248 6.253 5.726 5.726 0.000
ESCL 0.157 0.433 0.590 0.133 0.133 0.037
UML 0.004 0.790 0.794 0.794 0.794 0.000
SEML 0.131 1.189 1.320 1.266 1.266 0.054
BSIL 0.109 0.031 0.140 0.136 0.136 0.004
TUML-SVSL 0.017 0.198 0.215 0.208 0.208 0.007
SOVA 0.000 0.400 0.400 0.400 0.400 0.000
PRIVATE 0.980 42.147 43.127 41.950 0.001 41.951 0.288 0.174 32.556 32.730 32.139 0.001 32.140 0.585
INDIA 55.514 609.179 664.658 603.772 0.576 604.348 59.389 59.389 639.234 698.310 632.169 0.335 632.504 64.793
Company
2014-15
A V A I L A B I L I T Y O F F - T A K E
Clo
sing
Sto
ck
Col
liery
Con
sum
ptio
nOpe
ning
Sto
ck
Pro
duct
ion
To
tal
Des
patc
hes
Col
liery
Con
sum
ptio
n To
tal
To
tal
2015-16
A V A I L A B I L I T Y O F F - T A K E
Clo
sing
Sto
ck
Ope
ning
Sto
ck
Pro
duct
ion
To
tal
Des
patc
hes
55
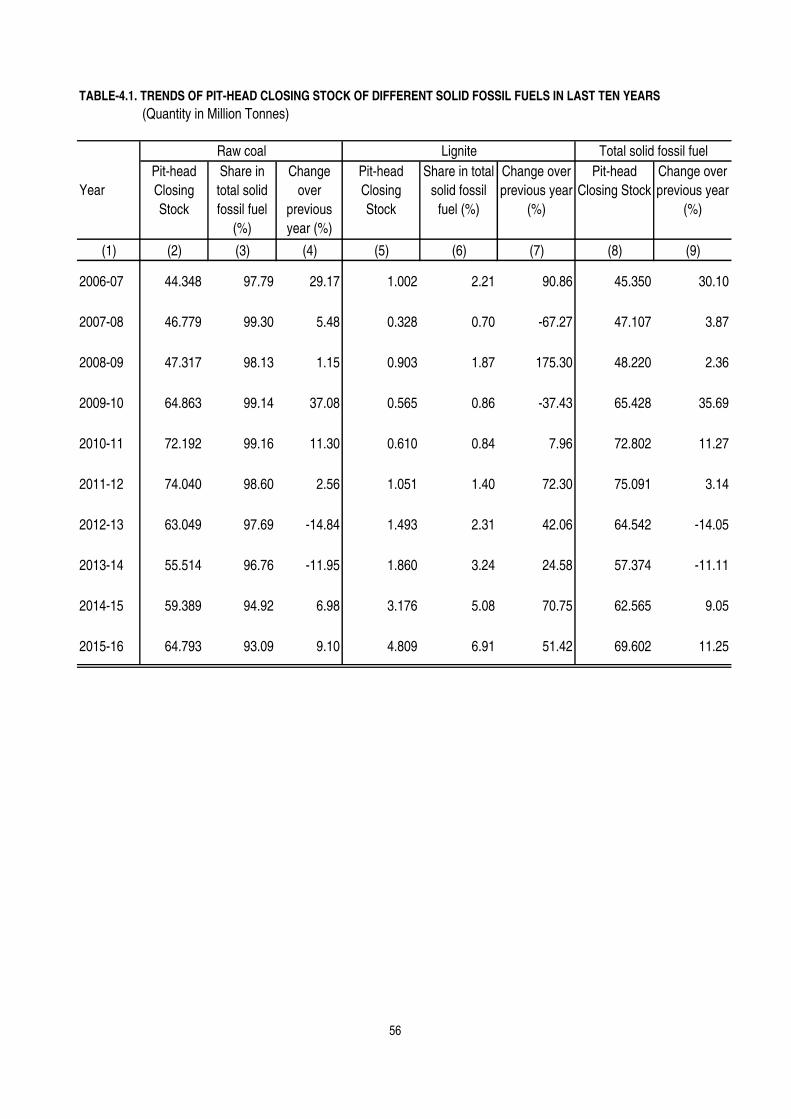
(Quantity in Million Tonnes)
Pit-head
Closing
Stock
Share in
total solid
fossil fuel
(%)
Change
over
previous
year (%)
Pit-head
Closing
Stock
Share in total
solid fossil
fuel (%)
Change over
previous year
(%)
Pit-head
Closing Stock
Change over
previous year
(%)
(1) (2) (3) (4) (5) (6) (7) (8) (9)
2006-07 44.348 97.79 29.17 1.002 2.21 90.86 45.350 30.10
2007-08 46.779 99.30 5.48 0.328 0.70 -67.27 47.107 3.87
2008-09 47.317 98.13 1.15 0.903 1.87 175.30 48.220 2.36
2009-10 64.863 99.14 37.08 0.565 0.86 -37.43 65.428 35.69
2010-11 72.192 99.16 11.30 0.610 0.84 7.96 72.802 11.27
2011-12 74.040 98.60 2.56 1.051 1.40 72.30 75.091 3.14
2012-13 63.049 97.69 -14.84 1.493 2.31 42.06 64.542 -14.05
2013-14 55.514 96.76 -11.95 1.860 3.24 24.58 57.374 -11.11
2014-15 59.389 94.92 6.98 3.176 5.08 70.75 62.565 9.05
2015-16 64.793 93.09 9.10 4.809 6.91 51.42 69.602 11.25
TABLE-4.1. TRENDS OF PIT-HEAD CLOSING STOCK OF DIFFERENT SOLID FOSSIL FUELS IN LAST TEN YEARS
Year
Raw coal Lignite Total solid fossil fuel
56

TABLE-4.2 : MONTHLY PIT-HEAD CLOSING STOCK OF COAL, LIGNITE AND VARIOUS COAL PRODUCTS IN 2015-16
(Quantity in Million Tonnes)
Month Raw Coal Lignite
Washed
Coal
(Coking)
Washed
Coal (Non-
Coking)
Middlings
(Coking)
# Middlings
(Non-
Coking)
Hard Coke
(1) (2) (3) (4) (5) (6) (7) (8)
Apr-15 56.766 1.993 0.206 0.545 0.686 0.000 0.050
May-15 53.952 1.496 0.199 0.558 0.633 0.000 0.073
Jun-15 50.887 1.464 0.268 0.785 0.778 0.000 0.063
1st Quarter 50.887 4.953 0.268 0.785 0.778 0.000 0.063
Jul-15 43.929 1.290 0.186 0.827 0.703 0.000 0.052
Aug-15 39.306 1.417 0.181 0.936 0.626 0.000 0.074
Sep-15 36.014 1.366 0.252 0.788 0.410 0.000 0.046
2nd Quarter 36.014 4.073 0.252 0.788 0.410 0.000 0.046
Oct-15 36.138 1.810 0.257 0.910 0.494 0.000 0.067
Nov-15 38.464 1.553 0.188 0.729 0.571 0.000 0.071
Dec-15 41.876 1.388 0.254 0.913 0.574 0.000 0.100
3rd Quarter 41.876 4.751 0.254 0.913 0.574 0.000 0.100
Jan-16 47.759 1.843 0.225 1.051 0.513 0.000 0.151
Feb-16 53.142 3.241 0.250 1.018 0.563 0.000 0.147
Mar-16 64.793 4.809 0.222 0.995 0.542 0.000 0.125
4th Quarter 64.793 9.893 0.222 0.995 0.542 0.000 0.125
# JSPL & SEML Companies (sources of Middlings Non-coking) are ceased to exist any more.
57

TABLE-4.3 : TRENDS OF PIT-HEAD CLOSING STOCK OF RAW COAL AND LIGNITE BY COMPANIES IN LAST THREE YEARS (Quantity in Million Tonnes)
Quantity % of All India Quantity % of All India Quantity % of All India(1) (2) (3) (4) (5) (6) (7)
COAL :ECL 1.913 3.45 3.451 5.81 5.055 7.80BCCL 3.576 6.44 4.362 7.34 4.015 6.20CCL 9.405 16.94 9.718 16.36 11.460 17.69NCL 6.107 11.00 4.898 8.25 6.590 10.17WCL 5.600 10.09 5.501 9.26 8.007 12.36SECL 7.764 13.99 12.816 21.58 11.876 18.33MCL 14.149 25.49 12.530 21.10 10.194 15.73NEC 0.169 0.30 0.215 0.36 0.359 0.55CIL 48.683 87.69 53.491 90.07 57.556 88.83SCCL 5.548 9.99 5.348 9.01 6.460 9.97JKML 0.013 0.02 0.013 0.02 0.013 0.02JSMDCL 0.000 0.00 0.007 0.01 0.000 0.00DVC 0.020 0.04 0.030 0.05 0.041 0.06IISCO 0.009 0.02 0.013 0.02 0.012 0.02SAIL 0.000 0.00 0.000 0.00 0.000 0.00RRVUNLSECL(GP-IV/2&3) 0.126 0.19DVC EMTA 0.005 0.01 0.000 0.00APMDTCL 0.000 0.00 0.000 0.00WBPDCL 0.034 0.06 0.008 0.01PSEB-PANEM 0.110 0.20 0.089 0.15KECML 0.030 0.05 0.095 0.16WBMDTCL 0.077 0.14 0.007 0.01MPSMCL 0.005 0.01 0.000 0.00PUBLIC 54.534 98.23 59.101 99.52 64.208 99.10TISCO 0.017 0.03 0.012 0.02 0.007 0.01Meghalaya 0.000 0.00 0.000 0.00 0.000 0.00HIL 0.144 0.26 0.008 0.01 0.057 0.09SIL 0.009 0.02 0.009 0.02 0.011 0.02SPL 0.000 0.00 0.145 0.24 0.326 0.50GMR 0.136 0.21BALCO 0.041 0.06CESC 0.003 0.00JPVL 0.004 0.01ICML 0.278 0.50 0.000 0.00JSPL 0.010 0.02 0.010 0.02MIEL 0.022 0.04 0.000 0.00BLA 0.000 0.00 0.000 0.00PIL 0.001 0.00 0.000 0.00JNL 0.076 0.14 0.002 0.00JPL 0.005 0.01 0.000 0.00ESCL 0.157 0.28 0.037 0.06UML 0.004 0.01 0.000 0.00SEML 0.131 0.24 0.054 0.09BSIL 0.109 0.20 0.004 0.01TUML/SVSL 0.017 0.03 0.007 0.01SOVA 0.000 0.00 0.000 0.00PRIVATE 0.980 1.77 0.288 0.48 0.585 0.90ALL INDIA 55.514 100.00 59.389 100.00 64.793 100.00LIGNITE :NLC 1.739 93.49 2.842 89.48 4.573 95.09GMDCLGIPCL 0.053 2.85GHCL 0.016 0.86 0.023 0.72 0.011 0.23RSMMLVSLPPL 0.051 0.233 0.031BLMCL 0.001 0.05 0.078 2.46 0.194 4.03ALL INDIA 1.860 97.26 3.176 92.66 4.809 99.36
COAL & LIGNITE 57.374 62.565 69.602
2013-14 2014-15 2015-16Company
58

TABLE - 4.4 : CAPTIVE BLOCK WISE CLOSING STOCK OF RAW COAL DURING LAST TWO YEARS
(Quantity in Million Tonnes)
Coking
Coal
Non
Coking
Coal
Total
Coal
Coking
Coal
Non
Coking
Coal
Total
Coal
(1) (2) (3) (4) (5) (6) (7) (8) (9)
Gare Palma IV/2&3 SECL(GP-IV/2&3) Chhittsgarh 0.126 0.126
Parsa East & Kanta Basan RRUVNL Chhittsgarh 0.000
Tasra SAIL/IISCO Jharkhand 0.000
Amelia North MPSMCL Madhya Pradesh 0.000
Baranj I-IV, Kiloni,Manora Deep KECML Maharashtra 0.095 0.095
Barjora North DVCEMTA West Bengal 0.000
Barjore WBPDCL West Bengal 0.001 0.001
Gangaramchak & Bhadulia WBPDCL West Bengal 0.000
Namchik Namphuk APMDTCL Arunachal Pradesh 0.000
Panchwara North WBPDCL Jharkhand 0.007 0.007
Panchwara North PSEB-PANEM Jharkhand 0.089 0.089
Tara East & West WBPDCL West Bengal 0.000
Trans Damodar WBMDTCL West Bengal 0.000
Total Public 0.000 0.192 0.192 0.000 0.126 0.126
Belgaon SIL Maharashtra 0.009 0.009 0.011 0.011
Chotia BALCO Chhittsgarh 0.041 0.041
Gare Palma IV/4 & 5 HIL Chhittsgarh 0.057 0.057
Moher & Moher Amlori Extn SPL Madhya Pradesh 0.145 0.145 0.326 0.326
Sarshatali CESC West Bengal 0.003 0.003
Amelia North JPVL Madhya Pradesh 0.004 0.004
Talabira I GMR Odisha 0.136 0.136
Ardhagram SOVA West Bengal 0.000
Chotia PIL Chhittsgarh 0.000
Gare Palma IV/1 JSPL Chhittsgarh 0.010 0.010
Gare Palma IV/2&3 JPL Chhittsgarh 0.000
Gare Palma IV/4 JNL Chhittsgarh 0.002 0.002
Gare Palma IV/5 MIEL Chhittsgarh 0.000
Gare Palma IV/7 SEML Chhittsgarh 0.054 0.054
Gotitoria East & West BLA Madhya Pradesh 0.000
Kathautia UML Jharkhand 0.000
Marki Mangli I BSIL Maharashtra 0.004 0.004
Marki Mangli II-III TUML-SVSL Maharashtra 0.007 0.007
Parbatpur Central ESCL Jharkhand 0.041 0.066 0.107
Sarshatali ICML West Bengal 0.000
Talabira I HIL Odisha 0.009 0.009
Total Private 0.041 0.306 0.347 0.000 0.578 0.578
Grand Total 0.041 0.498 0.539 0.000 0.704 0.704
Block Company State
2014-15 2015-16
59

TABLE - 5.1 : YEAR WISE IMPORT OF COAL, COKE AND LIGNITE TO INDIA DURING LAST TEN YEARS
(Quantity in Million Tonne & Value in Million Rs.)
Quantity Value Quantity Value Quantity Value Quantity Value Quantity Value
(1) (2) (3) (4) (5) (6) (7) (8) (9) (10) (11)
2006-07 17.877 101806 25.204 65080 43.081 166886 4.686 40211
2007-08 22.029 121025 27.765 86358 49.794 207384 4.248 51231
2008-09 21.080 226140 37.923 187268 59.003 413408 1.881 46051
2009-10 24.690 201311 48.565 190489 73.255 391800 2.355 33311
2010-11 19.484 208621 49.434 206875 68.918 415496 1.490 31204
2011-12 31.801 424692 71.052 363683 102.853 788376 2.365 47585
2012-13 35.557 378398 110.228 490057 145.785 868455 3.081 56919 0.001 10
2013-14 36.872 348319 129.985 574973 166.857 923292 4.171 67995 0.001 24
2014-15 43.715 337656 174.068 707411 217.783 1045066 3.294 43806 0.001 17
2015-16 43.506 276630 156.378 568405 199.884 845035 3.068 32632 0.001 15
TABLE - 5.2 : YEAR WISE EXPORT OFCOAL, COKE AND LIGNITE FROM INDIA DURING LAST TEN YEARS
(Quantity in Million Tonne & Value in Million Rs. )
Quantity Value Quantity Value Quantity Value Quantity Value Quantity Value
(1) (2) (3) (4) (5) (6) (7) (8) (9) (10) (11)
2006-07 0.107 222 1.447 2915 1.554 3137 0.076 323
2007-08 0.036 84 1.591 2684 1.627 2768 0.097 987
2008-09 0.109 245 1.546 3240 1.655 3485 1.338 7246
2009-10 0.270 696 2.180 4347 2.450 5042 0.129 2080
2010-11 0.111 265 1.764 4544 1.875 4809 0.729 11647
2011-12 0.097 287 1.917 5525 2.014 5900 0.613 11525
2012-13 0.056 302 2.387 8349 2.443 8651 1.201 6017 0.069 360
2013-14 0.008 35 2.180 10805 2.188 10840 0.154 1521 0.002 61
2014-15 0.042 413 1.196 6784 1.238 7197 0.102 1140 0.003 40
2015-16 0.064 650 1.186 7084 1.250 7734 0.103 1176 0.001 9
Note: Source: DGCI & S , KOLKATA
(1) Coke also includes soft coke, retort carbon which are negligible
(2) Some figures may not match with DGCI&S publication due to subsequent corrections and roundings.
(3) Coking coal, appeared to be exported from Meghalaya, should be treated as non coking coal for accounting purpose.
(4) Export data for 2009-10 and 2010-11 are revised.
YearCoking Coal Non Coking Coal Total Coal
Coke & Others
Coal ProductsLignite
YearCoking Coal Non Coking Coal Total Coal
Coke & Others
Coal ProductsLignite
60

TABLE 5.3 : SOURCE COUNTRY-WISE IMPORT OF COAL, COKE AND LIGNITE TO INDIA DURING 2015-16
( Quantity in Million Tonnes & Value in Million Rs. )
Quantity Value Quantity Value Quantity Value Quantity Value Quantity Value
(1) (2) (3) (4) (5) (6) (7) (8) (9) (10) (11)
Afghanistan 0.000 0 0.000 0
Australia 37.974 241186 9.583 46640 47.557 287826 0.193 2100
Austria 0.000 0 0.000 0
Baharain Is 0.017 69 0.017 69
Bhutan 0.005 18 0.005 18
Canada 1.355 8396 0.197 934 1.552 9330
Chile 0.773 2174 0.773 2174
China P Rp 0.480 1775 0.480 1775 2.155 21977 0.0009 10
Colombia 0.000 9 0.000 9 0.062 796
Denmark 0.000 0 0.000 2
Estonia 0.000 0 0
Germany 0.000 1 0.000 1 0
Iceland 0.039 152 0.039 152
Indonesia 0.149 848 96.041 315364 96.190 316213
Iran 0.000 0 0.000 0
Ireland 0.000 0 0.000 1
Japan 0.000 0 0.176 1904
Latvia 0.002 22 0.002 22 0.006 68
Lithuania 0.000 0 0.000 9
Mauritius 0.000 0 0.000 0
Moldova 0.070 240 0.070 240
Mozambique 1.855 11010 0.809 2759 2.665 13769
Netherland 0.000 3 0.000 3
New Zealand 0.620 4118 0.061 258 0.681 4376
Oman 0.110 562 0.110 562 0.046 654
Poland 0.000 0 0.353 4234
Russia 0.004 31 3.818 20169 3.822 20200 0.072 857
Saudi Arab 0.008 24 0.008 24 0.002 11
Singapore 0.020 48 0.020 48
South Africa 0.264 1719 35.817 137618 36.080 139337
Spain 0.109 703 0.109 703
Thailand 0.000 2 0.000 2
U Arab Emts 0.012 94 0.012 94
U K 0.002 37 0.006 55 0.008 92 0.000 7
U S A 1.161 8488 4.582 23912 5.744 32399 0.0001 5
Ukraine 0.054 334 0.054 334 0.001 11
Vietnam Soc Rep 0.034 463 0.034 463
Unspecified 3.851 14800 3.851 14800
TOTAL 43.506 276630 156.378 568405 199.884 845035 3.068 32632 0.0010 15
Source: DGCI & S , KOLKATA
CountryCoking Coal Non Coking Coal Total Coal
Coke & Others
Coal ProductsLignite
61

TABLE 5.4 : DESTINATION COUNTRY-WISE EXPORT OF COAL, COKE AND LIGNITE TO INDIA DURING 2015-16
( Quantity in Million Tonnes & Value in Million Rs. )
Quantity Value Quantity Value Quantity Value Quantity Value Quantity Value
(1) (2) (3) (4) (5) (6) (7) (8) (9) (10) (11)
Baharain Is 0.000 0 0.000 0
Bangladesh Pr 0.000 0 0.611 3285 0.611 3285 0.001 9
Belgium 0.000 0 0.000 0
Bhutan 0.066 500 0.066 500 0.022 419 0.0002 3
China P Rp 0.000 0 0.033 322
Egypt A Rp 0.000 0 0.000 1
Ethiopia 0.000 0 0.000 0
Germany 0.000 0 0.000 0 0.000 0
Greece 0.000 0 0.000 0
Indonesia 0.000 0 0.000 1
Iran 0.064 650 0.064 650
Jordan 0.000 0 0.000 0 0.000 3
Madagascar 0.000 3 0.000 3
Malaysia 0.000 2 0.000 2 0.000 1
Mauritius 0.000 0 0.000 0
Nepal 0.000 1 0.440 3045 0.440 3046 0.037 257 0.0001 1
Nigeria 0.000 0 0.000 0 0.000 2
Oman 0.000 0 0.000 0 0.001 16
Pakistan Ir 0.000 0 0.005 78 0.0001 2
Qatar 0.000 0 0.000 0
Saudi Arab 0.000 1 0.000 1 0.001 23
South Africa 0.000 0 0.000 8
Sri Lanka Dsr 0.000 0 0.000 10 0.0001 1
Sudan 0.000 0 0.000 1
Tanzania Rep 0.000 0 0.000 2
U Arab Emts 0.067 230 0.067 230 0.001 22 0.0001 1
U K 0.001 13 0.001 13
U S A 0.000 0 0.000 0
Unspecified 0.001 3 0.001 3 0.000 0
TOTAL 0.064 650 1.186 7084 1.250 7734 0.103 1176 0.0005 9
Source: DGCI & S , KOLKATA
CountryCoking Coal Non Coking Coal Total Coal
Coke & Others
Coal ProductsLignite
62

TABLE 5.5 : PORT WISE IMPORT OF COAL, COKE & LIGNITE TO INDIA DURING 2015-16
( Quantity in Million Tonnes & Value in Million Rs. )
Quantity Value Quantity Value Quantity Value Quantity Value Quantity Value
(1) (2) (3) (4) (5) (6) (7) (8) (9) (10) (11)
Alibag 0.596 3886 3.660 10795 4.256 14681 0.04601 654Appiic Multi Prod Sez Vizag Dc 0.048 162 0.048 162 0.03660 345Attariroad,Amritsar 0.000 0 0.000 0Bedi Sea 3.828 11750 3.828 11750Bhavnagar 1.152 3784 1.152 3784Bhuj 0.410 1175 0.410 1175Chennai Air 0 0.000 0Chennai Sea 0.001 32 4.527 13088 4.528 13120 0.00051 8 0.00080 8Cochin Sea 0.088 385 0.088 385 0.00042 6Dehej Sea 10.359 38042 10.359 38042Delhi Air 0.000 0 0.000 0Dhamra(Chandbali) 6.469 40674 5.041 19805 11.511 60479Dharmatar Sea 0.593 3817 0.486 2092 1.079 5909Ennore Sea 0.075 430 5.832 26746 5.908 27176Gangavaram Port 5.709 35943 9.453 31683 15.162 67626Hazira Port, Surat 2.529 9006 2.529 9006Hetero Infra Sez Nakkapalli Ap 0.012 20 0.012 20Icd Bhusawal 0.000 0 0.00594 64Icd Garhiharsaru 0.000 0 0Icd Patli 0.000 0 0.00007 1Jabilant Infra Ltd Kandla 0.017 54 0.017 54Jaigad 0.035 204 0.063 284 0.098 488 0.00571 98Kakinada Sea 2.454 7798 2.454 7798Kandla Sea 0.379 2792 11.678 44642 12.057 47434 0.07268 770Karikal 0.476 3000 3.397 12227 3.873 15227Kattupalli Port/ Tiruvallur 0.000 1 0.000 1Kiadb Textile Sez Karnataka 0.074 252 0.074 252Kolkata Sea 5.389 34800 4.727 20623 10.117 55423 0.57056 6081 0.00008 1Krishnapatnam 3.137 19997 9.369 33407 12.505 53404 0.07447 664Magdalla Port Sea 0.883 5421 4.606 17362 5.489 22782 1.12067 12516Marmagoa Sea 5.829 37470 5.193 24584 11.022 62054 0.03150 397Muldwarka 0.031 131 0.031 131Mumbai Air 0.000 1 0.000 1 0 0.00000 1Mumbai Sea 4.410 17189 4.410 17189Mundra 1.100 7170 12.532 45254 13.632 52424 0.00003 1 0.00003 0Naliya, Bhuj 0.585 1656 0.585 1656Navlakhi 6.061 20361 6.061 20361Newmangalore Sea 0.049 353 5.500 22657 5.549 23010 0.34019 3355Nhava Sheva Sea 0.003 83 0.003 83 0.00064 13 0.00014 4Okha 0.235 1430 0.491 1862 0.726 3291Old Mundra 1.155 3853 1.155 3853Opgs Gandhidham 0.603 1420 0.603 1420Panaji 0.158 872 0.012 50 0.169 922Paradip Sea 7.320 46143 8.582 30300 15.901 76444 0.48115 4865Parri Infra Co Pvt Ltd 0.089 278 0.089 278Pipavab(Vicyor) 0.044 323 0.576 2289 0.620 2613Porbandar 0.323 1174 0.323 1174Ramki Pharma City (India) Pvt 0.012 23 0.012 23Revdanda 0.647 1996 0.647 1996Sez Dahej 0.014 46 0.014 46Sez Mundra 9.340 31079 9.340 31079Sez Wardha Power Ltd. Warora 0.025 97 0.025 97Sikka 0.159 731 0.159 731Tuticorin Sea 8.275 30432 8.275 30432 0.00309 55Visakhapatnam Sea 5.028 31873 7.949 25506 12.977 57379 0.27806 2737Unspecified 0.001 171 0.001 171
TOTAL 43.506 276630 156.378 568405 199.884 845035 3.06828 32632 0.00105 15
Source: DGCI & S , KOLKATA
PortCoking Coal Non Coking Coal Total Coal
Coke & Others
Coal ProductsLignite
63

TABLE 5.6 : PORT WISE EXPORT OF COAL, COKE & LIGNITE TO INDIA DURING 2015-16
( Quantity in Million Tonnes & Value in Million Rs. )
Quantity Value Quantity Value Quantity Value Quantity Value Quantity Value
(1) (2) (3) (4) (5) (6) (7) (8) (9) (10) (11)
Bairgania 0.001 4 0.001 4
Bangalore Airport 0.000 0 0
Barhni 0.001 8 0.001 8 0.017 122
Borsorah 0.384 2046 0.384 2046
Cfs Patparganj 0.000 0 0.000 0
Chasuapara 0.134 723 0.134 723
Chengrabandha Rly.Station 0.001 7 0.001 7
Chennai Sea 0.000 3 0.000 3 0.000 0 0.0000 0
Cochin Sea 0.000 0 0.000 0
Dalu 0.002 14 0.002 14
Delhi (Icd) 0.000 1 0.000 1
Gouriphanta 0.014 88 0.014 88
Hatisar (Deosiri) 0.003 34 0.003 34
Hili (West) 0.003 19 0.003 19
Icd Hyderabad 0.000 0 0.000 0
Icd Kanakpura 0.000 0 0.000 0
Icd Nagpur 0.000 2 0.000 2 0.000 0
Icd Sabarmati 0.000 0 0.000 0 0.000 0
Jaigaon 0.063 466 0.063 466 0.022 419 0.0002 3
Jogbani 0.001 9 0.001 9 0.001 7 0.0000 0
Joynagar 0.000 1 0.000 1
Kolkata Air 0 0.000 0
Kolkata Sea 0.000 0 0.000 9
Kotwaligate (Mohedipur) 0.000 0 0.000 0
L C S Khunwa 0.003 20 0.003 20
Magdalla Port Sea 0.067 230 0.067 230
Mahendraganj 0.000 0 0.000 0 0.000 1
Mankachar 0.000 1 0.000 1
Marmagoa Sea 0.000 0 0.000 4
Mumbai Air 0 0.000 0
Mundra 0.064 650 0.000 1 0.064 651 0.009 150 0.0000 0
Nautanwa (Sonauli) 0.000 0 0.079 562 0.079 562 0.007 46
Nepalganj 0.038 285 0.038 285 0.001 10
Newmangalore Sea 0.000 0 0.033 322
Nhava Sheva Sea 0.001 13 0.001 13 0.000 3 0.0001 4
Panitanki 0.000 1 0.293 2001 0.293 2002 0.009 52 0.0001 1
Petrapole Land 0.000 0 0.000 0 0.000 3
Pipavab(Vicyor) 0.000 0 0.000 2
Raxaul Land 0.008 53 0.008 53 0.003 20
Sutarkandi 0.086 478 0.086 478
Toothibari, Maharajganj 0.002 14 0.002 14
Visakhapatnam Sea 0.000 0 0.000 5
Unspecified 0.000 0
TOTAL 0.064 650 1.186 7084 1.250 7734 0.103 1176 0.0005 9
Source: DGCI & S , KOLKATA
PortCoking Coal Non Coking Coal Total Coal
Coke & Others
Coal ProductsLignite
64
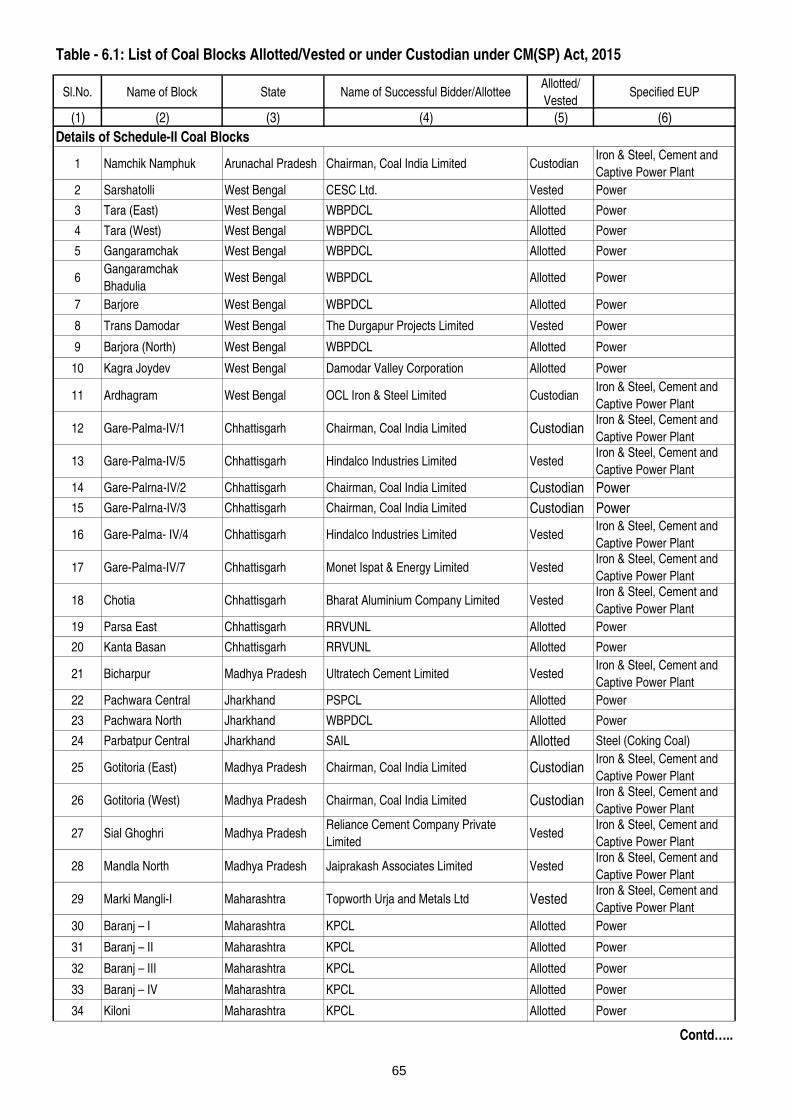
Table - 6.1: List of Coal Blocks Allotted/Vested or under Custodian under CM(SP) Act, 2015
Sl.No. Name of Block State Name of Successful Bidder/AllotteeAllotted/
VestedSpecified EUP
(1) (2) (3) (4) (5) (6)
Details of Schedule-II Coal Blocks
1 Namchik Namphuk Arunachal Pradesh Chairman, Coal India Limited CustodianIron & Steel, Cement and
Captive Power Plant
2 Sarshatolli West Bengal CESC Ltd. Vested Power
3 Tara (East) West Bengal WBPDCL Allotted Power
4 Tara (West) West Bengal WBPDCL Allotted Power
5 Gangaramchak West Bengal WBPDCL Allotted Power
6Gangaramchak
Bhadulia West Bengal WBPDCL Allotted Power
7 Barjore West Bengal WBPDCL Allotted Power
8 Trans Damodar West Bengal The Durgapur Projects Limited Vested Power
9 Barjora (North) West Bengal WBPDCL Allotted Power
10 Kagra Joydev West Bengal Damodar Valley Corporation Allotted Power
11 Ardhagram West Bengal OCL Iron & Steel Limited CustodianIron & Steel, Cement and
Captive Power Plant
12 Gare-Palma-IV/1 Chhattisgarh Chairman, Coal India Limited CustodianIron & Steel, Cement and
Captive Power Plant
13 Gare-Palma-IV/5 Chhattisgarh Hindalco Industries Limited VestedIron & Steel, Cement and
Captive Power Plant
14 Gare-Palrna-IV/2 Chhattisgarh Chairman, Coal India Limited Custodian Power
15 Gare-Palrna-IV/3 Chhattisgarh Chairman, Coal India Limited Custodian Power
16 Gare-Palma- IV/4 Chhattisgarh Hindalco Industries Limited VestedIron & Steel, Cement and
Captive Power Plant
17 Gare-Palma-IV/7 Chhattisgarh Monet Ispat & Energy Limited VestedIron & Steel, Cement and
Captive Power Plant
18 Chotia Chhattisgarh Bharat Aluminium Company Limited VestedIron & Steel, Cement and
Captive Power Plant
19 Parsa East Chhattisgarh RRVUNL Allotted Power
20 Kanta Basan Chhattisgarh RRVUNL Allotted Power
21 Bicharpur Madhya Pradesh Ultratech Cement Limited VestedIron & Steel, Cement and
Captive Power Plant
22 Pachwara Central Jharkhand PSPCL Allotted Power
23 Pachwara North Jharkhand WBPDCL Allotted Power
24 Parbatpur Central Jharkhand SAIL Allotted Steel (Coking Coal)
25 Gotitoria (East) Madhya Pradesh Chairman, Coal India Limited CustodianIron & Steel, Cement and
Captive Power Plant
26 Gotitoria (West) Madhya Pradesh Chairman, Coal India Limited CustodianIron & Steel, Cement and
Captive Power Plant
27 Sial Ghoghri Madhya PradeshReliance Cement Company Private
LimitedVested
Iron & Steel, Cement and
Captive Power Plant
28 Mandla North Madhya Pradesh Jaiprakash Associates Limited VestedIron & Steel, Cement and
Captive Power Plant
29 Marki Mangli-I Maharashtra Topworth Urja and Metals Ltd VestedIron & Steel, Cement and
Captive Power Plant
30 Baranj – I Maharashtra KPCL Allotted Power
31 Baranj – II Maharashtra KPCL Allotted Power
32 Baranj – III Maharashtra KPCL Allotted Power
33 Baranj – IV Maharashtra KPCL Allotted Power
34 Kiloni Maharashtra KPCL Allotted Power
Contd…..
65

Table - 6.1: List of Coal Blocks Allotted/Vested or under Custodian under CM(SP) Act, 2015
Sl.No. Name of Block State Name of Successful Bidder/AllotteeAllotted/
VestedSpecified EUP
(1) (2) (3) (4) (5) (6)
35 Manora Deep Maharashtra KPCL Allotted Power
36 Belgaon Maharashtra Sunflag Iron & Steel Company Limited VestedIron & Steel, Cement and
Captive Power Plant
37 Marki Mangli-II Maharashtra Chairman, Coal India Limited Custodian
38 Marki Mangli-III Maharashtra B.S.Ispat Limited VestedIron & Steel, Cement and
Captive Power Plant
39 Tokisud North Jharkhand Essar Power M.P. Limited Vested Power
40 Kathautia Jharkhand Hindalco Industries Limited VestedIron & Steel, Cement and
Captive Power Plant
41 Amelia (North) Madhya Pradesh Jaiprakash Power Ventures Limited Vested Power
42 Talabira-I Orissa GMR Chhattisgarh Energy Limited Vested Power
Details of Schedule-III Coal Blocks
1 Jitpur Jharkhand Adani Power Limited Vested Power
2 Sitanala Jharkhand Steel Authority of India Limited Allotted Steel (Coking coal)
3 Tadicherla-I TelanganaTelangana State Power Generation
Corporation LimitedAllotted Power
4 Gare Palma IV/8 Chhattisgarh Ambuja Cements Limited VestedIron & Steel, Cement and
Captive Power Plant
5 Talaipali Chhattisgarh NTPC Limited Allotted Power
6 Gare Palma Sector-III ChhattisgarhMaharashtra State Power Generation
Company LimitedAllotted Power
7 Parsa ChhattisgarhRajasthan Rajya Vidyut Utpadan Nigam
LimitedAllotted Power
8 Gare Pelma Sector II ChhattisgarhMaharashtra State Power Generation
Company LimitedAllotted Power
9 Moitra Jharkhand JSW Steel Limited VestedIron & Steel, Cement and
Captive Power Plant
10 Brinda Jharkhand Usha Martin Limited VestedIron & Steel, Cement and
Captive Power Plant
11 Sasai Jharkhand Usha Martin Limited VestedIron & Steel, Cement and
Captive Power Plant
12 Meral Jharkhand Trimula Industries Limited VestedIron & Steel, Cement and
Captive Power Plant
13 Lohari Jharkhand Araanya Mines Private Limited VestedIron & Steel, Cement and
Captive Power Plant
14 Dumri Jharkhand Hindalco Industries Limited VestedIron & Steel, Cement and
Captive Power Plant
15 Ganeshpur Jharkhand GMR Chhattisgarh Energy Limited Vested Power
16 Badam JharkhandBihar State Power Generation Company
LimitedAllotted Power
17 Kerandari Jharkhand NTPC Limited Allotted Power
18 Chatti Bariatu Jharkhand NTPC Limited Allotted Power
19 Chhati Bariatu South Jharkhand NTPC Limited Allotted Power
20 Utkal-C Orissa Monet Power Company Limited Vested Power
21 Dulunga Orissa NTPC Limited Allotted Power
22 Manoharpur Orissa Odisha Coal and Power Limited Allotted Power
23 Utkal 'E' Orissa NALCO Allotted
24 Utkal-D Orissa NALCO Allotted
25 Dipside Manoharpur Orissa Odisha Coal and Power Limited Allotted Power
Contd…..
66
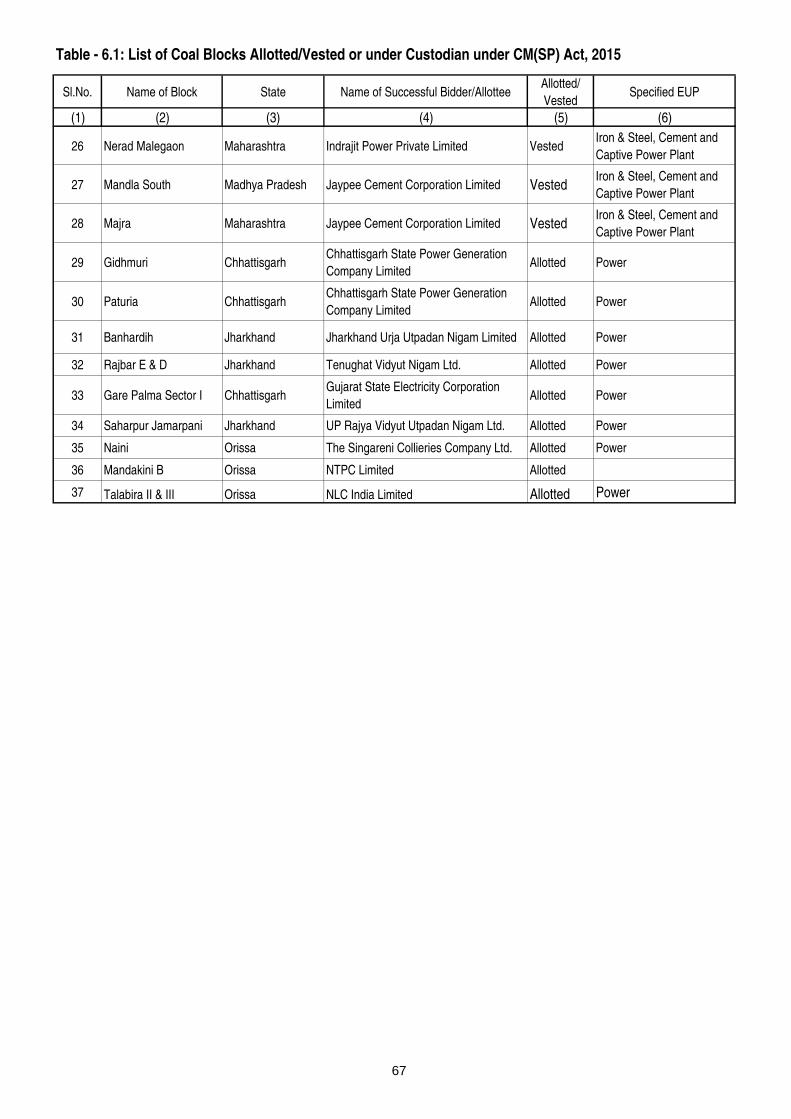
Table - 6.1: List of Coal Blocks Allotted/Vested or under Custodian under CM(SP) Act, 2015
Sl.No. Name of Block State Name of Successful Bidder/AllotteeAllotted/
VestedSpecified EUP
(1) (2) (3) (4) (5) (6)
26 Nerad Malegaon Maharashtra Indrajit Power Private Limited VestedIron & Steel, Cement and
Captive Power Plant
27 Mandla South Madhya Pradesh Jaypee Cement Corporation Limited VestedIron & Steel, Cement and
Captive Power Plant
28 Majra Maharashtra Jaypee Cement Corporation Limited VestedIron & Steel, Cement and
Captive Power Plant
29 Gidhmuri ChhattisgarhChhattisgarh State Power Generation
Company LimitedAllotted Power
30 Paturia ChhattisgarhChhattisgarh State Power Generation
Company LimitedAllotted Power
31 Banhardih Jharkhand Jharkhand Urja Utpadan Nigam Limited Allotted Power
32 Rajbar E & D Jharkhand Tenughat Vidyut Nigam Ltd. Allotted Power
33 Gare Palma Sector I ChhattisgarhGujarat State Electricity Corporation
LimitedAllotted Power
34 Saharpur Jamarpani Jharkhand UP Rajya Vidyut Utpadan Nigam Ltd. Allotted Power
35 Naini Orissa The Singareni Collieries Company Ltd. Allotted Power
36 Mandakini B Orissa NTPC Limited Allotted
37 Talabira II & III Orissa NLC India Limited Allotted Power
67

Table - 6.2 : Coal Blocks allotted under Auction by Competitive Bidding Rules, 2012
Sl.No. Name of Block State Name of Successful Bidder/AllotteeAllotted/
Vested
Specified
EUP
(1) (2) (3) (4) (5) (6)
1 Kente Extn. Rajasthan Rajya Vidyut Utpadan Nigam Ltd. Allotted Power
2 Tentuloi Odisha Thermal Power Corpn. Ltd. Allotted Power
3 Gondbahera-Ujheni Madhya Pradesh Power Generation Corpn. Ltd. Allotted Power
4 Kudanali-LuburiNTPC Ltd. & CPSU & Jammu & Kashmir State
Power Development Corpn. Ltd.Allotted Power
5 Banai NTPC Ltd. Allotted Power
6 Bhalumuda NTPC Ltd. Allotted Power
7 Sarapal-Nuapara Orissa Andhra Pradesh Power Generation Corpn. Ltd. Allotted Power
8 ChandrabilaTamil Nadu Generation & Distribution
Corporation Ltd.Allotted Power
9 MahajanwadiMaharashtra State Power Generation
Corporation Ltd.Allotted Power
10 Kalyanpur-Badalpara Haryana Power Generation Corporation Ltd. Allotted Power
68

Table - 6.3: Coal Blocks not cancelled by Hon'ble Supreme Court
Sl.No. Name of Block State Name of Successful Bidder/Allottee Specified EUP
(1) (2) (3) (4) (5)
1 Pakri-Barwadih Jharkhand NTPC Power
2 Tasra Jharkhand Steel Authority of India Ltd. Steel
3-4Moher, Moher-Amlori
ExtnMaharashtra
Power Finance Corporation (Sasan
UMPP)UMPP
5 Kerandari BC JharkhandPower Finance Corporation Talaiy
UMPP JharkhandUMPP
6 Bhivkund Maharashtra MAHAGENCO UMPP
7 Mourya Jharkhand Karanpura Energy Ltd. UMPP
8 Pindrakhi Chhattisgarh Akaltara Power Ltd. UMPP
9 Puta Parogia Chhattisgarh Akaltara Power Ltd. UMPP
10 Bankui OrissaSakshigopal Integrated Power
Company LtdUMPP
69

70
Appendix - A
Concepts, Definitions and Practices
1. Coal: Coal is a combustible sedimentary rock
formed from ancient vegetation which has been
consolidated between other rock strata and
transformed by the combined effects of
microbial action, pressure and heat over a
considerable time period. This process is
commonly called ‘coalification’. Coal occurs as
layers or seams, ranging in thickness from
millimeters to many tens of metres. It is
composed mostly of carbon (50–98 per cent),
hydrogen (3–13 per cent) and oxygen, and
smaller amounts of nitrogen, sulphur and other
elements. It also contains water and particles of
other inorganic matter. When burnt, coal
releases energy as heat which has a variety of
uses.
2. Classification of Coal
2.1 Coal refers to a whole range of combustible
sedimentary rock materials spanning a
continuous quality scale. For convenience, this
continuous series is often divided into two main
categories, namely Hard Coal and Brown
Coal. These are further divided into two
subcategories as given below.
Hard Coal
Anthracite
Bituminous coal
Coking coal
Other bituminous coal
Brown coal
Sub-bituminous coal
Lignite
2.2 In practice, hard coal is calculated as the
sum of anthracite and bituminous coals.
Anthracite is a high-rank, hard coal used mainly
for industrial and residential heat raising.
Bituminous coal is a medium-rank coal used for
gasification, industrial coking and heat raising
and residential heat raising. Bituminous coal
that can be used in the production of a coke
capable of supporting a blast furnace charge is
known as coking coal. Other bituminous coal,
not included under coking coal, is also
commonly known as thermal coal. This also
includes recovered slurries, middling and other
low-grade, higher-rank coal products not
further classified by type.
2.3 Classifying different types of coal into
practical categories for use at an international
level is difficult because divisions between coal
categories vary between classification systems,
both national and international, based on
calorific value, volatile matter content, fixed
carbon content, caking and coking properties,
or some combination of two or more of these
criteria.
2.4 Although the relative value of the coals
within a particular category depends on the
degree of dilution by moisture and ash and
contamination by sulphur, chlorine,
phosphorous and certain trace elements, these
factors do not affect the divisions between
categories.
2.5 The International Coal Classification of the
Economic Commission for Europe (UNECE)
recognizes two broad categories of coal:
i) Hard coal – Coal of gross calorific value
not less than 5700 kcal/kg (23.9 GJ/t) on an
ash-free but moist basis and with a mean
random reflectance of vitrinite of at least 0.6.
ii) Brown coal - Non-agglomerating coal with

71
a gross calorific value less than 5700 kcal/kg
(23.9 GJ/t) containing more than 31% volatile
matter on a dry mineral matter free basis.
2.6 It should be stressed that the above
classification system is based on the inherent
qualities of the coal in question and not on the
final use of the coal. In this way the
classification system attempts to be objective
and simple to apply.
3. Classification of Coal in India
3.1 In India coal is broadly classified into two
types – Coking and Non-Coking. The former
constitute only a small part of the total coal
resources of the country. These two are further
subdivided as follows on the basis of certain
physical and chemical parameter as per the
requirement of the industry.
3.2 Coking Coal: Coking coal, when heated in
the absence of air, form coherent beads, free
from volatiles, with strong and porous mass,
called coke. Coking coal has coking properties
and is mainly used in steel making and
metallurgical industries.
3.3 Semi Coking Coal: Semi Coking Coal,
when heated in the absence of air, form
coherent beads not strong enough to be directly
fed into the blast furnace. Such coal is blended
with coking coal in adequate proportion to
make coke. Clearly, Semi Coking Coal has
comparatively less coking properties than
coking coal. It is mainly used as blendable coal
in steel making, merchant coke manufacturing
and other metallurgical industries.
3.4 Non-Coking Coal: Non-Coking Coal does
not have coking properties and is mainly used
for power generation. It is also used for
cement, fertilizer, glass, ceramic, paper,
chemical and brick manufacturing, and for other
heating purposes.
3.5 Washed Coal: Processing of coal through
water separation mechanism to improve the
quality of coal by removing denser material
(rocks) and high ash produces washed coal
which has less ash, higher moisture, better
sizing, better consistency, less abrasive, etc.
The washed coking coal is used in
manufacturing of hard coke for steel making.
Washed non-coking coal is used mainly for
power generation but is also used by cement,
sponge iron and other industrial plants.
3.6 Middlings and Rejects: In the process of
coal washing, apart from Clean Coal we also get
two by-products, namely, Middlings and
Rejects. Clean coal has low density whereas
rejects have high density. Middlings have
intermediate density. Rejects contain high ash,
mineral impurities, fraction of raw coal feed,
etc. and are used for Fluidized Bed Combustion
(FBC) Boilers for power generation, road
repairs, briquette (domestic fuel) making, land
filling, etc. Middlings are fraction of raw coal
feed having values of classificatory parameters
between that of clan coals and rejects. It is
used for power generation. It is also used by
domestic fuel plants, brick manufacturing units,
cement plants, industrial plants, etc.
3.7 Hard Coke: Solid product obtained from
carbonaisation of coal, used mainly in the iron &
steel industry.
4. Categorisation of Coal in India
4.1 In India, coking coal has been categorized
or graded on the basis of ash content as per
following scheme:
Grade Ash Content
Steel Gr I Ash content < 15%
Steel Gr II 15%< = Ash content <18%
Washery Gr.I 18%< = Ash content <21%
Washery Gr.II 21%< = Ash content < 24%
Washery Gr. III 24%< = Ash content < 28%
Washery Gr. IV 28%< = Ash content < 35%

72
4.2 In India, semi coking coal has been
categorized or graded on the basis of ash and
moisture content as per following scheme:
Grade Ash + Moisture content
Semi coking Gr. I less than 19%
Semi coking Gr.
II
Between 19% and
24%
4.3 In India, non-coking coal had been
categorized or graded on the basis of Useful
Heat Value (UHV) as per following scheme:
Grade Useful Heat Value
A UHV.> 6200 kCal/Kg
B 6200 >=UHV(KCal/Kg)>5600
C 5600 >=UHV(KCal/Kg)>4940
D 4940 >=UHV(KCal/Kg)>4200
E 4200 >=UHV(KCal/Kg)>3360
F 3360 >=UHV(KCal/Kg)>2400
G 2400 >=UHV(KCal/Kg)>1300
N.B 1: "Useful heat value" is defined as:
UHV = 8900- 138 (A + M)
Where UHV = Useful heat value in kCal/kg,
A = Ash content (%), M = Moisture content (%).
N.B 2: In the case of coal having moisture less
than 2 percent and volatile content less than 19
percent the useful heat value shall be the value
arrived as above reduced by 150 kilo calories
per kilogram for each 1 percent reduction in
volatile content below 19 percent fraction pro-
rata.
N.B 3: Both moisture and ash is determined
after equilibrating at 60 percent relative
humidity and 40 degree C temperature.
N.B 4: Ash percentage of coking coals and hard
coke shall be determined after air drying as per
IS1350 -1959. If the moisture so determined is
more than 2 per cent, the determination shall
be after equilibrating at 60 percent relative
humidity at 40 degree C temperature as per IS :
1350 - 1959.
4.4 In order to adopt the best international
practices, India decided to switch over from the
grading based on Useful Heat Value (UHV) to
the grading based on Gross Calorific Value
(GCV) and therefore on 16.01.2011 the Ministry
of Coal notified the switch over. As per the new
system, following nomenclature has been
introduced for gradation of non-coking coal.
Grades GCV Range (Kcal/Kg)
G1 GCV exceeding 7000
G2 GCV between 6701 and
7000
G3 GCV between 6401 and
6700
G4 GCV between 6101 and
6400
G5 GCV between 5801 and
6100
G6 GCV between 5501 and
5800
G7 GCV between 5201 and
5500
G8 GCV between 4901 and
5200
G9 GCV between 4601 and
4900
G10 GCV between 4301 and
4600
G11 GCV between 4001 and
4300
G12 GCV between 3700 and
4000
G13 GCV between 3400 and
3700
G14 GCV between 3101 and
3400
G15 GCV between 2801 and
3100
G16 GCV between 2501 and
2800
G17 GCV between 2201 and
2500

73
4.5 Based on the GCV ranges of proposed
gradation and erstwhile gradation, a
concordance table is generated for better
understanding. However, it may be noted that
this concordance does not depict exact one-to-
one relation between the two systems.
Table 5: Concordance Table
Old Grading based on UHV
New Grading based on GCV
A
G1
G2
G3
B G4
G5
C G6
D G7
G8
E G9
G10
F G11
G12
G G13
G14
Non-coking Coal Ungraded
G15
G16
G17
5 Some General Concepts
5.1 Run-of-mine (ROM) coal: The coal
delivered from the mine to the Coal Preparation
Plant (CPP) is called run-of-mine (ROM) coal.
This is the raw material for the CPP and
consists of coal, rocks, middlings, minerals and
contamination. Contamination is usually
introduced by the mining process and may
include machine parts, used consumables and
parts of ground engaging tools. ROM coal can
have a large variability of moisture and particle
size.
5.2 Opencast Mining: Open-pit mining, open-
cut mining or opencast mining is a surface
mining technique of extracting rock or minerals
from the earth by their removal from an
open pit or borrow. This form of mining differs
from extractive methods that require tunneling
into the earth such as long wall mining. Open-
pit mines are used when deposits of
commercially useful minerals or rock are found
near the surface; that is, where the
overburden (surface material covering the
valuable deposit) is relatively thin or the
material of interest is structurally unsuitable for
tunneling (as would be the case for sand,
cinder, and gravel). For minerals that occur
deep below the surface - where the overburden
is thick or the mineral occurs as veins in hard
rock - underground mining methods extract the
valued material.
5.3 Underground Mining of Coal: It refers to
a group of underground mining techniques such
as Longwall Mining, Room-And-Pillar Mining,
etc. used to extract coal from sedimentary
("soft") rocks in which the overlying rock is left
in place, and the mineral(coal) is removed
through shafts or tunnels.
5.4 Despatch and Off-take: The term
"Despatches" (say, of raw coal) is used in this
compilation to mean all the despatches to
different sectors but exclude collieries' own
consumption (boiler coal used in collieries and
supply to employee). On the other hand "Off-
take" means total quantity of raw coal lifted for
consumption and naturally includes colliery
consumption. Therefore,
Off-take = Despatches + Colliery Consumption
5.5 Change of Stock: Change of Stock means
the difference between opening and closing
stock of an item.
5.6 Pit-Head Stock: The term "Pit-head
Closing Stock" of raw coal is used in this
compilation to mean all the raw coal stock at
pit- head of collieries.
5.7 Pit-head Value: Pit-head Value of coal is
the value of coal at pit-head of the colliery. It is
computed on the basis of basic price and

74
therefore it does not involve any cost of
loading, transportation from pit-head, Cess,
Royalty, Sales tax, Stowing Excise Duty etc.
This approach is followed by all non-captive
coal companies, viz., CIL Subsidiaries, Singareni
Collieries Companies Ltd. (SCCL), Jharkhand
State Mineral Development Corporation Ltd.
(JSMDCL) and Jammu & Kashmir Mineral Ltd.
(JKML).
5.7.1 In case of captive collieries, pit-head
value of coal depends upon their accounting
policy. If the costing of coal is done on no-
profit-no-loss basis then pit-head value is
calculated accordingly. This practice is found to
be followed in captive collieries of public sector
units.
5.7.2 On the other hand, if the captive colliery
is treated as independent commercial unit then
pit-head value is calculated on the basis of unit
value of realisation, which includes cost price
and profit/loss per unit but excludes any
transportation cost from pit-head, Cess,
Royalty, Sales tax, Stowing Excise Duty etc.
This is particularly followed in private captive
colliery which is in contract to supply coal to
any priority sector for which captive colliery is
permitted (Steel, Iron, Power, Cement, etc.).
5.7.3 Even there are private sector collieries
being managed by the parent company
engaged in manufacturing of Steel and Iron,
Power, Cement for which captive collieries are
allowed. Due to non-availability of value figures
from these companies, pit-head value of coal is
determined on the basis of nearest Coal India
Subsidiary price rate considering comparable
grade and location. Though this may not be a
correct price and would not depict a true
picture, yet we use it because this is one of the
acceptable estimates.
5.7.4 While using value data it is to be kept in
mind that these data are useful for macro-level
study or trend study. However, the quality of
coal has been deteriorating over the years,
quite inversely proportional to the open cast
production share in the total production. Thus
the comparison of unit value over the years
would not reflect correct picture of inflation
until this deteriorating effect of quality is not
considered and that effect is removed.
5.7.5 It may be concluded that, in India, unit
value (Rs.) of coal in terms per kilo calorie
useful heat value has been increasing more
rapidly than being exhibited by simple unit
value comparison over the years.
6. Commodity Classification
6.1 For export import data, the 8-digit codes of
Indian Trade Classification (based on
Harmonised Coding System) have been adopted
by DGCI&S in classifying the various grades of
coal and coal products. For Coking coal the only
8-digit code is “27011910” and all other codes
of coal are taken as non-coking coal (Mainly
pertains to remaining part of 2701, some parts
of 2702 & 2703). Similarly all items in 2704
group have been taken under coke. The effect
of retort carbon is negligible and included under
coke.

COAL COMPANIES:
ECL Eastern Coalfields Limited (Coal India Ltd. Subsidiary) -Public
BCCL Bharat Coking Coal Limited (Coal India Ltd. Subsidiary) - Public
CCL Central Coalfields Limited (Coal India Ltd. Subsidiary) - Public
NCL Northern Coalfields Limited (Coal India Ltd. Subsidiary) - Public
WCL Western Coalfields Limited (Coal India Ltd. Subsidiary) - Public
SECL South Eastern Coalfields Limited (Coal India Ltd. Subsidiary) - Public
MCL Mahanadi Coalfields Limited (Coal India Ltd. Subsidiary) - Public
NEC North Eastern Coalfields (Coal India Ltd. Subsidiary) - Public
SCCL Singareni Collieries Company Limited - Public
JKML Jammu & Kashmir Minerals Limited - Public
JSMDCL Jharkhand State Mineral Development Corporation Limited - Public
DVC Damodar Valley Corporation - Public
DVC EMTA DVC Emta Coal Mines Limited - Public
IISCO Indian Iron & Steel Company Limited - Public
SAIL Steel Authority of India Limited - Public
APMDTCL Arunachal Pradesh Mineral Development & Trading Corp. Ltd. - Public
WBPDCL West Bengal Power Development Corporation Limited - Public
RRVUNL Rajasthan Rajya Viddyut Unnayan Nigam Limited - Public
KECML Karnataka Emta Coal Mines Limited - Public
WBMDTCL West Bengal Mineral Deveplopment and Trading Corpopration Limited - Public
PSEB/PANEM Panjab State Electricity Board/Panem Coal Mines Limited - Public
MPSMCL Madhya Pradesh State Mineral Corporation Limited - Public
SECL(GP-IV/2&3) South Eastern Coalfields Limited (Gare Palma IV/2 &3) - Public
ICML Integrated Coal Mining Limited - Private
JSPL Jindal Steel & Power Limited - Private
TISCO Tata Iron & Steel Company Limited - Private
HIL Hindalco Industries Limited - Private
BLA BLA Industries Limited - Private
MIEL Monnet Ispat & Energy Limited - Private
PIL Prakash Industries Limited - Private
JNL Jayswal Neco Limited - Private
JPL Jindal Power Open Cast Coal Mine - Private
SIL Sunflag Iron & Steel Company Limited - Private
ESCL Electro Steel Casting Limited - Private
UML Usha Martin Limited - Private
SEML Sarda Energy & Minarals Limited - Private
BSIL B. S. Ispat Limited - Private
TUML Topworth Urja and Minerals Limited - Private
SPL Sasan Power Limted - Private
SOVA Sova Ispat Limited - Private
JPVL Jaiprakash Power Ventures Limited - Private
GMR GMR Chhattisgarh Energy Limited - Private
BALCO Bharat Aluminium Company Limited - Private
CESC Calcutta Electric Supply Corporation Limited - Private
LIGNITE COMPANIES:
NLC Neyveli Lignite Corporation Limited - Public
GIPCL Gujarat Industries Power Company Limited - Public
GMDCL Gujarat Mineral Development Corporation Limited - Public
GHCL Gujarat Heavy Chemical Limited - Private
RSMML Rajasthan State Mines and Mineral Limited - Public
VS LIGNITE V. S Lignite Power Limited - Private
BLMCL Barmer Lignite Mining Company Limited - Private
O.C. OPEN CAST
U.G. UNDER GROUND
OBR Over Burden Removal
ABBREVIATIONS
75