2016 CMS Statistics - Home - Centers for Medicare ... · 2016 CMS Statistics. ... DME Durable...
58
3 5 9 7 2 0 1 4 6 8 U.S. DEPARTMENT OF HEALTH AND HUMAN SERVICES 2016 CMS Statistics
Transcript of 2016 CMS Statistics - Home - Centers for Medicare ... · 2016 CMS Statistics. ... DME Durable...

3 5 9 7 2 0 1 4 6 8
U.S. DEPARTMENT OF
HEALTH AND HUMAN SERVICES
2016 CMS
Statistics

Centers for Medicare & Medicaid Services
U.S. Department of Health & Human Services
Press inquiries should be directed to the CMS Media
Relations Group, (202) 690-6145 or [email protected]
This report is published online at:
https://www.cms.gov/Research-Statistics-Data-and-Systems/Statistics-Trends-and-Reports/CMS-Statistics-Reference-Booklet/index.html
Office of Enterprise Data and Analytics

i
Preface
Page
I. Populations 1
II. Providers/Suppliers 15
III. Expenditures 21
IV. Utilization 31
V. Administrative/Operating 39
Reference 45
This reference booklet provides summary
information about health expenditures and
Centers for Medicare & Medicaid Services
(CMS) programs. The information presented
was the most current available at the time of
publication and may not always reflect changes
due to recent legislation. Similar reported
statistics may differ because of differences in
sources and/or methodology.
The data are organized as follows:
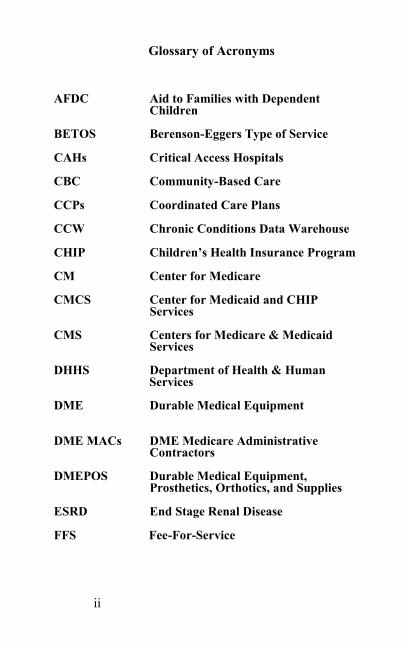
Glossary of Acronyms
AFDC Aid to Families with Dependent Children BETOS Berenson-Eggers Type of Service
CAHs Critical Access Hospitals
CBC Community-Based Care
CCPs Coordinated Care Plans
CCW Chronic Conditions Data Warehouse
CHIP Children’s Health Insurance Program
CM Center for Medicare
CMCS Center for Medicaid and CHIP Services CMS Centers for Medicare & Medicaid Services DHHS Department of Health & Human Services DME Durable Medical Equipment
DME MACs DME Medicare Administrative Contractors DMEPOS Durable Medical Equipment, Prosthetics, Orthotics, and Supplies
ESRD End Stage Renal Disease
FFS Fee-For-Service
ii

Glossary of Acronyms (continued)
GDP Gross Domestic Product
HCPP Health Care Prepayment Plan
HI Hospital Insurance (Part A)
HIT Health Information Technology
HMO Health Maintenance Organization
ICF/IID Intermediate Care Facility for Individuals with Intellectual Disabilities ICF-MR Intermediate Care Facility for Mentally Retarded IPAB Independent Payment Advisory Board MA Medicare Advantage MACs Medicare Administrative Contractors MA-PD Medicare Advantage Prescription Drug Plan MIF Medicare Improvement Fund MSA Medical Savings Account
MSIS Medicaid Statistical Information System
NF Nursing Facility NHE National Health Expenditures OACT Office of the Actuary
iii
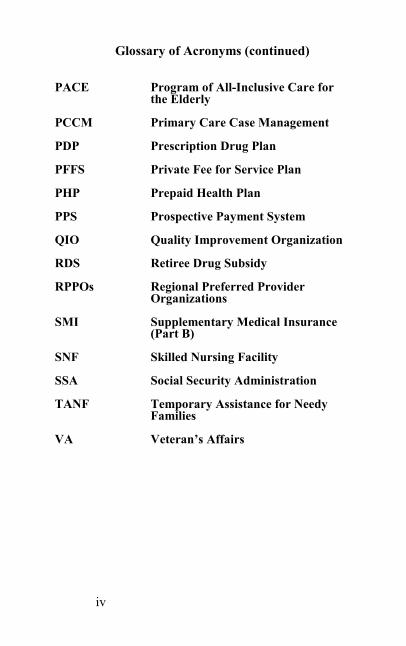
Glossary of Acronyms (continued)
PACE Program of All-Inclusive Care for the Elderly PCCM Primary Care Case Management PDP Prescription Drug Plan PFFS Private Fee for Service Plan PHP Prepaid Health Plan PPS Prospective Payment System QIO Quality Improvement Organization RDS Retiree Drug Subsidy RPPOs Regional Preferred Provider Organizations SMI Supplementary Medical Insurance (Part B) SNF Skilled Nursing Facility SSA Social Security Administration TANF Temporary Assistance for Needy Families VA Veteran’s Affairs
iv
Populations
Information about persons covered by
Medicare, Medicaid, or CHIP
For Medicare, statistics are based on persons enrolled for
coverage. Original Medicare enrollees are also referred
to as fee-for-service enrollees. Historically, for Medicaid,
recipient (beneficiary) counts were used as a surrogate for
persons eligible for coverage, as well as for persons
utilizing services. Current data systems now allow the
reporting of total eligibles for Medicaid and for
Children’s Health Insurance Program (CHIP). Statistics
are available by major program categories, by
demographic and geographic variables, and as
proportions of the U.S. population. Utilization data
organized by persons served may be found in the
Utilization section.
1
2
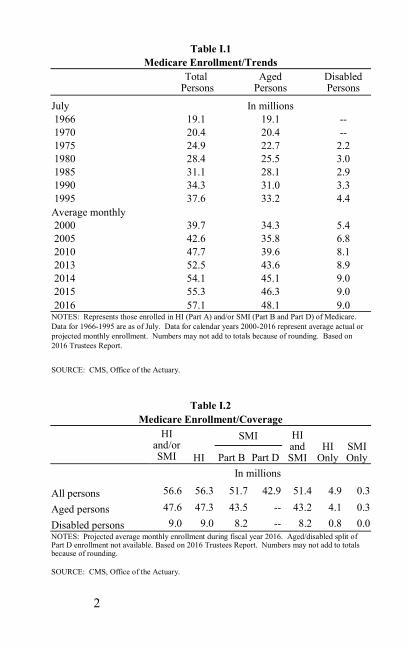
Table I.1
Medicare Enrollment/Trends
Total
Persons Aged
Persons Disabled Persons
July In millions 1966 19.1 19.1 --
1970 20.4 20.4 --
1975 24.9 22.7 2.2
1980 28.4 25.5 3.0
1985 31.1 28.1 2.9
1990 34.3 31.0 3.3
1995 37.6 33.2 4.4
Average monthly
2000 39.7 34.3 5.4
2005 42.6 35.8 6.8
2010 47.7 39.6 8.1
2013 52.5 43.6 8.9
2014 54.1 45.1 9.0
2015 55.3 46.3 9.0
2016 57.1 48.1 9.0 NOTES: Represents those enrolled in HI (Part A) and/or SMI (Part B and Part D) of Medicare.
Data for 1966-1995 are as of July. Data for calendar years 2000-2016 represent average actual or
projected monthly enrollment. Numbers may not add to totals because of rounding. Based on
2016 Trustees Report.
SOURCE: CMS, Office of the Actuary.
Table I.2
Medicare Enrollment/Coverage
HI
and/or SMI HI
SMI HI and SMI
HI Only
SMI Only Part B Part D
In millions
All persons 56.6 56.3 51.7 42.9 51.4 4.9 0.3
Aged persons 47.6 47.3 43.5 -- 43.2 4.1 0.3
Disabled persons 9.0 9.0 8.2 -- 8.2 0.8 0.0
NOTES: Projected average monthly enrollment during fiscal year 2016. Aged/disabled split of Part D enrollment not available. Based on 2016 Trustees Report. Numbers may not add to totals because of rounding.
SOURCE: CMS, Office of the Actuary.

3
Table I.3
Medicare Enrollment/Demographics
Total Male Female
In thousands All persons 55,584 25,276 30,308
Aged 46,728 20,716 26,012
65-74 years 26,209 12,338 13,871
75-84 years 13,975 6,117 7,858
85 years and over 6,543 2,261 4,283
Disabled 8,856 4,560 4,297
Under 45 years 1,902 1,024 878
45-54 years 2,420 1,233 1,187
55-64 years 4,534 2,303 2,231
Non-Hispanic White 41,726 18,932 22,794
Black (or African-American) 5,759 2,484 3,274
All Other 7,458 3,441 4,017
Am. Indian/Alaska Native 250 112 139
Asian/Pacific Islander 1,720 770 950
Hispanic 5,017 2,329 2,688
Other 471 230 240
Unknown Race 642 419 223 NOTES: Person-year enrollee counts for 2015. Numbers may not add to totals because of round-
ing. Race information is based on Research Triangle Institute (RTI) race codes.
SOURCE: CMS, Office of Enterprise Data and Analytics.
Table I.4
Medicare Part D Enrollment/Demographics
Total Male Female
In thousands All persons 39,509 16,773 22,736
Aged
65-74 years 17,657 7,646 10,011
75-84 years 10,405 4,305 6,100
85 years and over 4,689 1,475 3,214
Disabled
Under 45 years 1,551 813 738
45-54 years 1,865 931 934
55-64 years 3,343 1,603 1,740 NOTES: Person-year enrollee counts for 2015 as reported in the CMS Chronic Conditions Data
Warehouse. Numbers may not add to totals because of rounding.
SOURCE: CMS, Office of Enterprise Data and Analytics.

4
Table I.5
Medicare ESRD Enrollment/Trends
HI and/or SMI HI SMI
In thousands Year
1985 110.0 109.1 106.5
1990 172.1 170.6 163.7
1995 255.7 253.6 243.8
2000 290.9 290.4 272.8
2005 369.9 369.8 351.6
2010 427.5 427.3 405.6
2015 507.6 504.1 483.3
NOTES: Data as of July 1 for years 1985-2010. Enrollee counts for 2015 are determined using a
person-year methodology.
SOURCE: CMS, Office of Enterprise Data and Analytics.
Table I.6
Medicare ESRD Enrollment/Demographics
Number of Enrollees
(in thousands)
All persons 557.5
Age
Under 35 years 23.7
35-44 years 40.2
45-64 years 213.5
65 years and over 280.1
Sex
Male 318.5
Female 239.0
Race
Non-Hispanic White 232.4
Black (or African-American) 187.9
Other 132.5
Unknown 4.7
NOTES: CMS Chronic Conditions Data Warehouse. Represents persons with ESRD ever enrolled during calendar year 2015.
SOURCE: CMS, Office of Enterprise Data and Analytics.

5
Table I.7
Medicare Advantage, Cost, PACE, Demo, & Prescription Drug
Number of Contracts
MA only Drug Plan Total
(Enrollees in thousands)
Total prepaid1 694 2,034 16,571 18,604
Local CCPs 464 1,430 14,510 15,940
PFFS 7 79 149 228
1876 Cost 16 340 280 619
1833 Cost (HCPP) 9 60 -- 60
PACE 122 -- 37 37
Other plans2 76 124 1,595 1,719
Total PDPs1 72 -- 24,988 24,988
Total 766 2,034 41,559 43,592 1Totals include beneficiaries enrolled in employer/union-only group plans (contracts with "800
series" plan IDs). Where a beneficiary is enrolled in both an 1876 cost or PFFS plan and a PDP
plan, both enrollments are reflected in these counts. 2Includes MSA, Medicare-Medicaid Plans, and
RPPOs.
NOTE: Data as of November 2016.
SOURCE: CMS, Center for Medicare.
Table I.8
Medicare Enrollment/CMS Region
Resident U.S. Population1
Medicare Enrollees2
Enrollees as
Percent of Population
In thousands All regions 321,419 54,348 16.9
Boston 14,728 2,760 18.7
New York 28,754 4,844 16.8
Philadelphia 30,654 5,506 18.0
Atlanta 64,302 11,896 18.5
Chicago 52,277 9,240 17.7
Dallas 41,114 6,081 14.8
Kansas City 14,015 2,512 17.9
Denver 11,687 1,704 14.6
San Francisco 50,295 7,491 14.9
Seattle 13,593 2,314 17.0 1Preliminary annual estimate July 1, 2015 resident population. 2Medicare enrollment data for 2015 are determined using a person-year methodology. Excludes beneficiaries living in territories, possessions, foreign countries or with residence unknown. NOTES: Resident population is a provisional estimate based on 50 States and the District of Columbia. Numbers may not add to totals because of rounding. For regional breakouts, see Reference section. SOURCES: CMS, Office of Enterprise Data and Analytics; U.S. Bureau of the Census, Population Estimates Branch.

6
Table I.9
Medicare Enrollment by Health Delivery/CMS Region
Total Enrollees
Original Medicare Enrollees
MA and Other Health Plan Enrollees
In thousands All regions 55,584 37,786 17,799
Boston 2,760 2,163 596
New York 5,621 3,577 2,044
Philadelphia 5,506 4,007 1,499
Atlanta 11,896 8,051 3,845
Chicago 9,240 6,065 3,176
Dallas 6,081 4,308 1,773
Kansas City 2,512 1,991 520
Denver 1,704 1,204 500
San Francisco 7,512 4,458 3,054
Seattle 2,314 1,528 786 NOTES: Person-year enrollee counts for 2015. Numbers may not add because of rounding.
Foreign residents and unknowns are not included in the regions, but included in the total figure.
SOURCE: CMS, Office of Enterprise Data and Analytics.
Table I.9a Medicare Enrollment by Health Delivery/Demographics
Total
Original Medicare
MA and Other Health Plans
In thousands All persons 55,584 37,786 17,799
Aged 46,728 31,324 15,404
65-74 years 26,209 17,720 8,489
75-84 years 13,975 9,040 4,935
85 years and over 6,543 4,564 1,980
Disabled 8,856 6,462 2,395
Under 45 years 1,902 1,542 359
45-54 years 2,420 1,808 613
55-64 years 4,534 3,111 1,423
Male 25,276 17,557 7,719
Female 30,308 20,229 10,079
Non-Hispanic White 41,726 29,359 12,367
Black (or African-American) 5,759 3,708 2,051
All Other 7,458 4,228 3,229
Am. Indian/Alaska Native 250 215 36
Asian/Pacific Islander 1,720 1,082 638
Hispanic 5,017 2,616 2,400
Other 471 315 156
Unknown Race 642 490 151
NOTES: Person-year enrollee counts for 2015. Numbers may not add to totals because of rounding. Race information based on Research Triangle Institute race codes.
SOURCE: CMS, Office of Enterprise Data and Analytics.

7
Table I.10
Medicare Part D Enrollment by CMS Region
Total Medicare
Enrollees
Total Part D Enrollees
% of Total Enrollees
In thousands All regions1 55,584 39,509 71.1
Boston 2,760 1,920 69.6
New York 5,621 4,187 74.5
Philadelphia 5,506 3,738 67.9
Atlanta 11,896 8,601 72.3
Chicago 9,240 6,780 73.4
Dallas 6,081 4,173 68.6
Kansas City 2,512 1,821 72.5
Denver 1,704 1,162 68.2
San Francisco 7,512 5,605 74.6
Seattle 2,314 1,509 65.2 1Foreign residents and unknowns are not included in the regions but are included in the total figure.
NOTE: Data for calendar year 2015 as reported in the CMS Chronic Conditions Data Warehouse. SOURCE: CMS, Office of Enterprise Data and Analytics.
Table I.11
Medicare Part D Enrollment by Plan Type/CMS Region
Total Part D
Enrollees
Total PDP Enrollees
Total MA-PD
Enrollees
In thousands
All regions1 39,509 24,101 15,408
Boston 1,920 1,371 549
New York 4,187 2,294 1,893
Philadelphia 3,738 2,494 1,244
Atlanta 8,601 5,033 3,568
Chicago 6,780 4,602 2,178
Dallas 4,173 2,692 1,480
Kansas City 1,821 1,357 464
Denver 1,162 726 436
San Francisco 5,605 2,703 2,902
Seattle 1,509 819 691 1Foreign residents and unknowns are not included in the regions but are included in the total figure.
NOTE: Data for calendar year 2015 as reported in the CMS Chronic Conditions Data Warehouse.
SOURCE: CMS, Office of Enterprise Data and Analytics.

8
Table I.12
Medicare Part D and RDS Enrollment/CMS Region
Total Part D and RDS Enrollees
Total Part D
Enrollees
Total RDS Enrollees
In thousands
All regions1 41,764 39,509 2,255
Boston 2,102 1,920 182
New York 4,452 4,187 265
Philadelphia 3,963 3,738 225
Atlanta 8,996 8,601 396
Chicago 7,206 6,780 426
Dallas 4,416 4,173 243
Kansas City 1,884 1,821 63
Denver 1,207 1,162 45
San Francisco 5,862 5,605 256
Seattle 1,660 1,509 150 1 Foreign residents and unknowns are not included in the regions but are included in the total figure.
NOTES: Data for calendar year 2015 as reported in the CMS Chronic Conditions Data Warehouse. Numbers may not add to totals because of rounding. SOURCE: CMS, Office of Enterprise Data and Analytics.
Table I.13
Projected Population1
2010 2020 2040 2060 2080 2100
In millions
Total 315 342 396 437 481 526
Under 20 86 87 99 107 115 125
20-64 188 199 215 236 257 277
65 years and over 41 56 82 94 108 124 1 As of July 1.
NOTE: Numbers may not add to totals because of rounding.
SOURCE: Social Security Administration, Office of the Chief Actuary, based on the 2016 Trustees Report Intermediate Alternative.

9
Table I.14
Period Life Expectancy at Age 65,
Historical and Projected
Male
Female
Year In years
1965 12.9 16.3
1980 14.0 18.4
1990 15.1 19.1
2000 15.9 19.0
2010 17.6 20.2
20201 18.6 21.0
20301 19.3 21.6
20401 19.9 22.2
20501 20.5 22.7
20601 21.1 23.2
20701 21.6 23.7
20801 22.1 24.1
20901 22.6 24.6
21001 23.0 25.0 1 Projected.
SOURCE: Social Security Administration, Office of the Chief Actuary, based on the 2016 Trustees Report Intermediate Alternative.
10
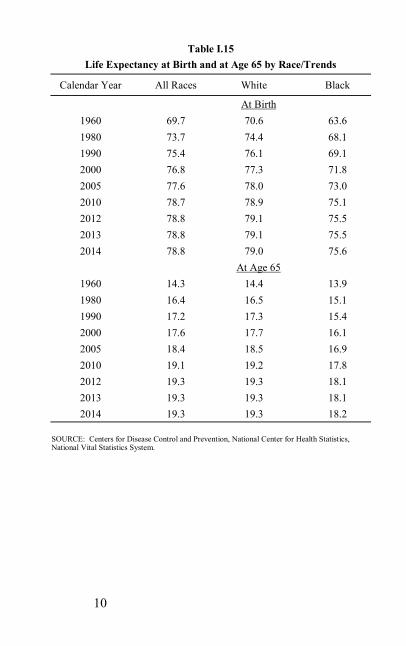
Table I.15
Life Expectancy at Birth and at Age 65 by Race/Trends
Calendar Year All Races White Black
At Birth
1960 69.7 70.6 63.6
1980 73.7 74.4 68.1
1990 75.4 76.1 69.1
2000 76.8 77.3 71.8
2005 77.6 78.0 73.0
2010 78.7 78.9 75.1
2012 78.8 79.1 75.5
2013 78.8 79.1 75.5
2014 78.8 79.0 75.6
At Age 65
1960 14.3 14.4 13.9
1980 16.4 16.5 15.1
1990 17.2 17.3 15.4
2000 17.6 17.7 16.1
2005 18.4 18.5 16.9
2010 19.1 19.2 17.8
2012 19.3 19.3 18.1
2013 19.3 19.3 18.1
2014 19.3 19.3 18.2
SOURCE: Centers for Disease Control and Prevention, National Center for Health Statistics, National Vital Statistics System.

11
Table I.16
Medicaid and CHIP Enrollment
Fiscal Year
1995 2000 2005 2010 2015 2016
Average monthly enrollment in millions
Total 34.2 34.5 46.5 53.5 68.5 70.9
Age 65 years and over 3.7 3.7 4.6 4.8 5.5 5.7
Blind/Disabled 5.8 6.7 8.1 9.3 10.5 10.6
Children 16.5 16.2 22.3 26.4 28.0 28.0
Adults 6.7 6.9 10.6 13.1 15.4 15.5
Expansion Adults NA NA NA NA 9.1 11.2
Other Title XIX1 0.6 NA NA NA NA NA
Territories 0.8 0.9 1.0 1.0 1.5 1.4
CHIP NA 2.0 5.9 5.4 5.9 6.5
1In 1997, the Other Title XIX category was dropped and the enrollees therein were subsumed in the remaining categories.
NOTES: Aged and Blind/Disabled eligibility groups include Qualified Medicare Beneficiaries (QMB) and Specified Low-Income Medicare Beneficiaries (SLMB). Children and Adult groups include both AFDC/TANF and poverty-related recipients who are not disabled. Medicaid enrollment excludes Medicaid expansion and CHIP programs. CHIP numbers include adults covered under waivers. Medicaid and CHIP figures for FY 2015-2016 are estimates from the Midsession Review of the President's FY 2017 budget. Enrollment for Territories for FY 2000 and later is estimated. Numbers may not add to totals because of rounding.
SOURCES: CMS, Office of the Actuary, and the Center for Medicaid and CHIP Services.
12
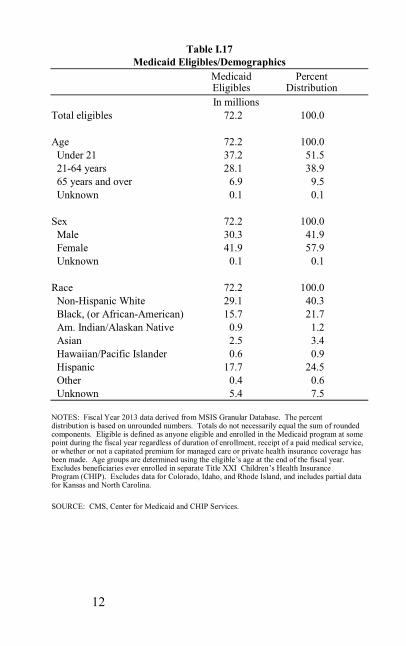
Table I.17
Medicaid Eligibles/Demographics
Medicaid Eligibles
Percent
Distribution
In millions
Total eligibles 72.2 100.0
Age 72.2 100.0
Under 21 37.2 51.5
21-64 years 28.1 38.9
65 years and over 6.9 9.5
Unknown 0.1 0.1
Sex 72.2 100.0
Male 30.3 41.9
Female 41.9 57.9
Unknown 0.1 0.1
Race 72.2 100.0
Non-Hispanic White 29.1 40.3
Black, (or African-American) 15.7 21.7
Am. Indian/Alaskan Native 0.9 1.2
Asian 2.5 3.4
Hawaiian/Pacific Islander 0.6 0.9
Hispanic 17.7 24.5
Other 0.4 0.6
Unknown 5.4 7.5
NOTES: Fiscal Year 2013 data derived from MSIS Granular Database. The percent distribution is based on unrounded numbers. Totals do not necessarily equal the sum of rounded components. Eligible is defined as anyone eligible and enrolled in the Medicaid program at some point during the fiscal year regardless of duration of enrollment, receipt of a paid medical service, or whether or not a capitated premium for managed care or private health insurance coverage has been made. Age groups are determined using the eligible’s age at the end of the fiscal year. Excludes beneficiaries ever enrolled in separate Title XXI Children’s Health Insurance Program (CHIP). Excludes data for Colorado, Idaho, and Rhode Island, and includes partial data for Kansas and North Carolina.
SOURCE: CMS, Center for Medicaid and CHIP Services.

13
Table I.18
Medicaid Eligibles/CMS Region
Resident U.S. Population1
Medicaid Enrollment2
Enrollment as
Percent of Population
In thousands
All regions 316,205 72,228 22.8
Boston 14,635 3,212 21.9
New York 28,573 7,671 26.8
Philadelphia 30,403 5,948 19.6
Atlanta 62,892 13,776 21.9
Chicago 52,079 11,995 23.0
Dallas 39,996 9,195 23.0
Kansas City 13,896 2,532 18.2
Denver 11,336 838 7.4
San Francisco 49,153 14,807 30.1
Seattle 13,243 2,252 17.0 1Estimated July 1, 2013 population. 2Persons ever enrolled in Medicaid during fiscal year 2013.
NOTES: Numbers may not add to totals because of rounding. Excludes data for Colorado, Idaho, and Rhode Island, and includes partial data for Kansas and North Carolina. Excludes enrollees ever enrolled in separate Title XXI Children's Health Insurance Program (CHIP).
SOURCES: CMS, Center for Medicaid and CHIP Services; U.S. Department of Commerce, Bureau of the Census.
Table I.19
Medicaid Beneficiaries/Part B State Buy-Ins for Medicare
1975 1980 2000 1 2015 1
Type of Beneficiary In thousands
All buy-ins 2,846 2,954 5,549 9,518
Aged 2,483 2,449 3,632 5,513
Disabled 363 504 1,917 4,005
Percent of Part B enrollees
All buy-ins 12.0 10.9 14.9 18.4
Aged 11.4 10.0 11.1 12.7
Disabled 18.7 18.9 40.2 48.4 1Beneficiaries in person years.
NOTES: Represent beneficiaries for whom the State paid the Medicare Part B premium during the year. Numbers may not add to totals because of rounding. Includes outlying areas, foreign coun-tries, and unknown.
SOURCE: CMS, Office of Enterprise Data and Analytics.

14

Providers/Suppliers
Information about institutions, agencies,
or professionals who provide health care
services, and individuals or organizations
who furnish health care equipment or
supplies
These data are distributed by major provider/supplier
categories, by geographic region, and by type of
program participation. Utilization data organized by
type of provider/supplier may be found in the
Utilization section.
15

16
Table II.1
Inpatient Hospitals/Trends
1990 2000 2010 2015
Total hospitals 6,522 5,985 6,169 6,140
Beds in thousands 1,105 991 928 932
Beds per 1,000 enrollees1 32.8 25.3 19.6 16.9
Short-stay 5,549 4,900 3,566 3,436
Beds in thousands 970 873 785 784
Beds per 1,000 enrollees1 28.8 22.3 16.6 14.2
Critical access hospitals NA NA 1,325 1,336
Beds in thousands --- --- 30 31
Beds per 1,000 enrollees1 --- --- 0.6 0.6
Other non-short-stay 973 1,085 1,278 1,368
Beds in thousands 135 118 113 117
Beds per 1,000 enrollees1 4.0 3.0 2.4 2.1 1Based on number of total HI enrollees as of July 1 for years 1990, 2000, and 2010. Based on person-year HI enrollee count for 2015.
NOTES: Facility data are as of December 31 and essentially represent those facilities eligible to participate at the start of the next calendar year. Facilities certified for Medicare are deemed to meet Medicaid standards.
SOURCE: CMS, Office of Enterprise Data and Analytics.
Table II.2
Inpatient Hospitals/CMS Region
Short-stay and CAH hospitals
Beds per 1,000
enrollees
Non Short-stay hospitals
Beds per 1,000
enrollees
All regions 4,772 14.7 1,368 2.1
Boston 175 11.5 65 3.5
New York 302 15.8 73 2.0
Philadelphia 358 13.0 133 2.4
Atlanta 878 15.1 251 1.7
Chicago 847 16.0 211 1.8
Dallas 758 17.4 362 3.8
Kansas City 453 18.4 64 1.8
Denver 314 15.6 50 2.5
San Francisco 477 12.9 132 1.5
Seattle 210 10.4 27 1.3 NOTES: Critical Access Hospitals have been grouped with short stay. Facility data as of Decem-ber 31, 2015. Rates based on person-year hospital insurance enrollee count for 2015.
SOURCE: CMS, Office of Enterprise Data and Analytics.
17
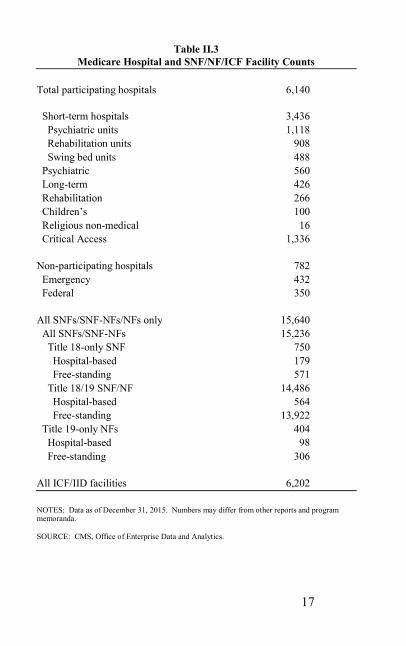
Table II.3
Medicare Hospital and SNF/NF/ICF Facility Counts
Total participating hospitals 6,140
Short-term hospitals 3,436
Psychiatric units 1,118
Rehabilitation units 908
Swing bed units 488
Psychiatric 560
Long-term 426
Rehabilitation 266
Children’s 100
Religious non-medical 16
Critical Access 1,336
Non-participating hospitals 782
Emergency 432
Federal 350
All SNFs/SNF-NFs/NFs only 15,640
All SNFs/SNF-NFs 15,236
Title 18-only SNF 750
Hospital-based 179
Free-standing 571
Title 18/19 SNF/NF 14,486
Hospital-based 564
Free-standing 13,922
Title 19-only NFs 404
Hospital-based 98
Free-standing 306
All ICF/IID facilities 6,202
NOTES: Data as of December 31, 2015. Numbers may differ from other reports and program memoranda.
SOURCE: CMS, Office of Enterprise Data and Analytics.

18
Table II.4
Long-Term Facilities/CMS Region
Title XVIII and XVIII/XIX SNFs
Nursing Facilities
ICF/IIDs
All regions 1 15,236 404 6,202
Boston 933 8 117
New York 995 2 508
Philadelphia 1,365 38 381
Atlanta 2,651 43 699
Chicago 3,391 68 1,375
Dallas 2,059 44 1,546
Kansas City 1,409 102 195
Denver 589 35 113
San Francisco 1,407 48 1,189
Seattle 437 16 79 1 Includes outlying areas.
NOTE: Data as of December 2015.
SOURCE: CMS, Office of Enterprise Data and Analytics.
Table II.5
Other Medicare Providers and Suppliers/Trends
1980 1990 2010 2015
Home health agencies 2,924 5,661 10,914 12,149
Independent and Clinical Lab
Improvement Act Facilities NA 4,828 224,679 252,044
End stage renal disease facilities 999 1,987 5,631 6,558
Outpatient physical therapy
and/or speech pathology 419 1,144 2,536 2,130
Portable X-ray 216 435 561 499
Rural health clinics 391 517 3,845 4,104
Comprehensive outpatient
rehabilitation facilities NA 184 354 207
Ambulatory surgical centers NA 1,165 5,316 5,470
Hospices NA 772 3,509 4,302 NOTES: Facility data for 1980 are as of July 1. Facility data for 1990, 2010, and 2015 are as of December 31.
SOURCE: CMS, Office of Enterprise Data and Analytics.
19
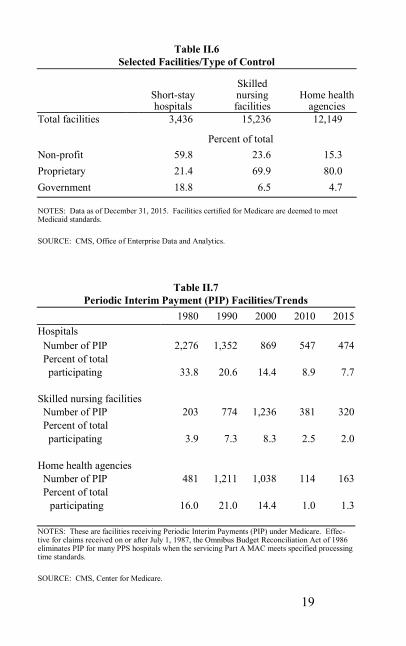
Table II.6
Selected Facilities/Type of Control
Short-stay hospitals
Skilled nursing facilities
Home health agencies
Total facilities 3,436 15,236 12,149
Percent of total
Non-profit 59.8 23.6 15.3
Proprietary 21.4 69.9 80.0
Government 18.8 6.5 4.7
NOTES: Data as of December 31, 2015. Facilities certified for Medicare are deemed to meet Medicaid standards.
SOURCE: CMS, Office of Enterprise Data and Analytics.
Table II.7
Periodic Interim Payment (PIP) Facilities/Trends
1980 1990 2000 2010 2015
Hospitals
Number of PIP 2,276 1,352 869 547 474
Percent of total
participating 33.8 20.6 14.4 8.9 7.7
Skilled nursing facilities
Number of PIP 203 774 1,236 381 320
Percent of total
participating 3.9 7.3 8.3 2.5 2.0
Home health agencies
Number of PIP 481 1,211 1,038 114 163
Percent of total participating 16.0 21.0 14.4 1.0 1.3
NOTES: These are facilities receiving Periodic Interim Payments (PIP) under Medicare. Effec-tive for claims received on or after July 1, 1987, the Omnibus Budget Reconciliation Act of 1986 eliminates PIP for many PPS hospitals when the servicing Part A MAC meets specified processing time standards.
SOURCE: CMS, Center for Medicare.

20
Table II.8
Medicare Non-Institutional Providers by Specialty1
Count
Total Providers 1,209,667
Primary Care 224,187
Surgical Specialties 108,784
Medical Specialties 144,942
Anesthesiology 40,993
Obstetrics/Gynecology 34,640
Radiology 37,038
Emergency Medicine 45,595
Non-Physician Practitioners 360,558
Limited Licensed Practitioners 104,681
All Other Providers 130,768
1 Providers utilized by Original Medicare beneficiaries for all Part B non-institutional provider services. Providers may be counted in more than one specialty classification, but are reported as a single provider in the "Total Providers" count.
NOTE: Data for calendar year 2015, as reported on the Original Medicare claims.
SOURCE: CMS, Office of Enterprise Data and Analytics.
Table II.9
Medicare DMEPOS Providers by Specialty1
Count
Total DMEPOS Providers 86,313
Pharmacy 50,124
Medical Supply Company 10,613
Optometry 5,871
Podiatry 5,380
Individual Certified Prosthetist/Orthotist 2,514
Optician 2,161
All Other DMEPOS Providers 9,951
1Providers utilized by Original Medicare beneficiaries for all Part B non-institutional DMEPOS services. Providers may be counted in more than one specialty classification, but are reported as a single provider in the "Total DMEPOS Providers" count.
NOTE: Data for calendar year 2015, as reported on the Original Medicare claims.
SOURCE: CMS, Office of Enterprise Data and Analytics.

Expenditures
Information about spending for health
care services by Medicare, Medicaid,
CHIP, and for the Nation as a whole
Health care spending at the aggregate levels is
distributed by source of funds, types of service,
geographic area, and broad beneficiary or eligibility
categories. Direct out-of-pocket, other private, and
non-CMS-related expenditures are also covered in
this section. Expenditures on a per-unit-of-service
level are covered in the Utilization section.
21

22
Table III.1
CMS and Total Federal Outlays
Fiscal year
2014 Fiscal year
2015
$ in billions
Gross domestic product (current dollars) $17,244.0 $17,803.4
Total Federal outlays1 3,506.1 3,688.3
Percent of gross domestic product 20.3% 20.7%
Dept. of Health and Human Services1 936.0 1,027.5
Percent of Federal Budget 26.7% 27.9%
CMS Budget (Federal Outlays)
Medicare benefit payments 591.3 615.6
SMI transfer to Medicaid2 0.7 0.7
Medicaid benefit payments 301.5 332.9
Medicaid State and local admin. 15.2 17.6
Medicaid offsets3 -0.7 -0.7
Children's Health Ins. Prog. 9.0 9.1
CMS program management 3.6 4.3
Other Medicare admin. expenses4 2.0 2.1
State Eligibility Determinations, for Part D 0.0 0.0
Quality Improvement Organizations5 0.5 0.6
Health Care Fraud and Abuse Control 1.4 1.6
State Grants and Demonstrations6 0.5 0.6
User Fees and Reimbursables 0.5 1.6
Total CMS outlays (unadjusted) 910.3 968.4
Offsetting receipts7 -94.5 -94.2
Total net CMS outlays 815.8 874.2
Percent of Federal budget 23.3% 23.7% 1Net of offsetting receipts. 2SMI transfers to Medicaid for Medicare Part B premium assistance ( $688 million in FY 2014 and $749 million in FY 2015). 3SMI transfers for low-income premium assistance. 4Medicare administrative expenses of the Social Security Administration and other Federal agen-cies. 5Formerly peer review organizations (PROs). 6Includes grants and demonstrations for various free-standing programs, such as the Ticket to Work and Work Incentives Improvement Act (P.L. 106-170), emergency health services for undocument-ed aliens (P.L.108-173), and Medicaid's Money Follows the Person Rebalancing Demonstration (P.L. 109-171). 7Almost entirely Medicare premiums. Also includes offsetting collections for user fee and reim-bursable activities, as well as refunds to the trust funds.
SOURCE: CMS, Office of Financial Management.

23
Table III.2
Program Expenditures/Trends
Total Medicare1 Medicaid2 CHIP3
$ in billions
Fiscal year
1980 $60.8 $35.0 $25.8 --
1990 182.2 109.7 72.5 --
2000 428.7 219.0 208.0 $1.7
2010 940.9 525.6 403.9 11.4
2015 1,198.9 632.9 552.3 13.7
1Medicare amounts reflect gross outlays (i.e., not net of offsetting receipts). These amounts include: outlays for benefits, administration, Health Care Fraud and Abuse Control (HCFAC) activities, Quality Improvement Organizations (QIOs), the SMI transfer to Medicaid for Medicare Part B premium assistance for low-income Medicare beneficiaries and, since FY 2004, the admin-istrative and benefit costs of the Transitional Assistance and Part D Drug benefits under the Medicare Modernization Act of 2003.
2The Medicaid amounts include total computable outlays (Federal and State shares) for benefits and administration, the Federal and State shares of the cost of Medicaid survey/certification and State Medicaid fraud control units, and outlays for the Vaccines for Children program. These amounts do not include the SMI transfer to Medicaid for Medicare Part B premium assistance for low-income beneficiaries, nor do they include the Medicare Part D compensation to States for low-income eligibility determinations in the Part D Drug program.
3The CHIP amounts reflect both Federal and State shares of Title XXI outlays. Please note that CHIP-related Medicaid began to be financed under Title XXI in 2001.
NOTE: Numbers may not add to totals because of rounding.
SOURCE: CMS, Office of Financial Management.

24
Table III.3
Annual Benefit Outlays by Program
1967 1980 2010 2015
Amounts in billions
CMS program outlays $5.1 $57.8 $915 $1,181
Federal outlays NA 47.2 793 973
Medicare1 3.2 33.9 518 615
HI 2.5 23.8 250 275
SMI 0.7 10.1 209 265
Prescription (Part D) NA NA 59 75
Medicaid2 1.9 23.9 386 552
Federal share NA 13.2 266 348
CHIP3 NA NA 11 14
Federal share NA NA 8 10
1The Medicare benefit amounts reflect gross outlays (i.e., not net of offsetting premiums). These amounts exclude outlays for the SMI transfer to Medicaid for premium assistance and the Quality Improvement Organizations (QIOs).
2The Medicaid amounts include total computable outlays (Federal and State shares) for Medicaid benefits and outlays for the Vaccines for Children program.
3The CHIP amounts reflect both Federal and State shares of Title XXI outlays as reported by the States on line 4 of the CMS-21. Please note that CHIP-related Medicaid expansions began to be financed under CHIP (Title XXI) in FY 2001.
NOTES: Fiscal year data. Numbers may not add to totals because of rounding.
SOURCE: CMS, Office of Financial Management.
25
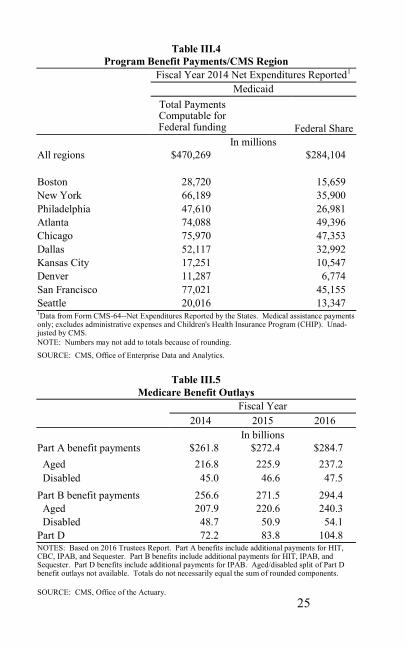
Table III.4
Program Benefit Payments/CMS Region
Fiscal Year 2014 Net Expenditures Reported1
Medicaid
Total Payments Computable for Federal funding
Federal Share
In millions
All regions $470,269 $284,104
Boston 28,720 15,659
New York 66,189 35,900
Philadelphia 47,610 26,981
Atlanta 74,088 49,396
Chicago 75,970 47,353
Dallas 52,117 32,992
Kansas City 17,251 10,547
Denver 11,287 6,774
San Francisco 77,021 45,155
Seattle 20,016 13,347 1Data from Form CMS-64--Net Expenditures Reported by the States. Medical assistance payments only; excludes administrative expenses and Children's Health Insurance Program (CHIP). Unad-justed by CMS.
NOTE: Numbers may not add to totals because of rounding.
SOURCE: CMS, Office of Enterprise Data and Analytics.
Table III.5
Medicare Benefit Outlays
Fiscal Year
2014 2015 2016
In billions
Part A benefit payments $261.8 $272.4 $284.7
Aged 216.8 225.9 237.2
Disabled 45.0 46.6 47.5
Part B benefit payments 256.6 271.5 294.4
Aged 207.9 220.6 240.3
Disabled 48.7 50.9 54.1
Part D 72.2 83.8 104.8 NOTES: Based on 2016 Trustees Report. Part A benefits include additional payments for HIT, CBC, IPAB, and Sequester. Part B benefits include additional payments for HIT, IPAB, and Sequester. Part D benefits include additional payments for IPAB. Aged/disabled split of Part D benefit outlays not available. Totals do not necessarily equal the sum of rounded components.
SOURCE: CMS, Office of the Actuary.

26
Table III.6
Medicare/Type of Benefit
Fiscal Year 2016 Benefit
Payments1 in millions
Percent
Distribution
Total Part A2,3 $284,748 100.0
Inpatient hospital 139,140 48.9
Skilled nursing facility 31,332 11.0
Home health agency4 6,787 2.4
Hospice 16,717 5.9
Managed care 90,772 31.9
Total Part B3,5 294,371 100.0
Physician/other suppliers6 70,516 24.0
DME 6,701 2.3
Other carrier 21,903 7.4
Outpatient hospital 45,446 15.4
Home health agency4 11,222 3.8
Other intermediary 20,305 6.9
Laboratory 9,054 3.1
Managed care 109,224 37.1
Total Part D7 104,786 100.0 1Includes the effects of regulatory items and recent legislation but not proposed law. 2Includes HIT,
CBC, IPAB, and Sequester expenditures. 3Excludes QIO expenditures. 4Distribution of home
health benefits between the trust funds estimated based on outlays reported to date by the Treasury. 5Includes HIT, IPAB, and Sequester expenditures. 6Includes payments made for HIT. 7Includes
payments made for IPAB and Sequester.
NOTES: Based on 2016 Trustees Report. Benefits by type of service are estimated and are subject to change. Totals do not necessarily equal the sum of rounded components.
SOURCE: CMS, Office of the Actuary.
Table III.7
National Health Care/Trends
Calendar Year
1990 2000 2014
National total in billions $721.4 $1,369.7 $3,031.3
Percent of GDP 12.1 13.3 17.5
Per capita amount $2,843 $4,857 $9,523
Sponsor Percent of total
Private Business 23.6 24.5 20.0
Household 36.2 32.4 27.8
Other Private Revenues 7.8 7.6 7.3
Governments 32.3 35.5 44.8
Federal government 17.2 19.0 27.8
State and local government 15.1 16.5 17.0 NOTE: Numbers may not add to totals because of rounding.
SOURCES: CMS, Office of the Actuary; U.S. Department of Commerce, Bureau of Economic Analysis; and U.S. Bureau of the Census.

27
Table III.8
Medicaid/Type of Service
Fiscal Year
2012 2013 2014
In billions
Total medical assistance payments1 $408.8 $433.1 $470.3
Percent of Total
Inpatient services 14.5 14.5 12.1
General hospitals 13.7 13.7 11.6
Mental hospitals 0.8 0.8 0.5
Nursing facility services 12.3 11.7 10.6
ICF/IID services 3.3 2.8 2.2
Community-based long term care svs.2 13.5 13.0 11.9
Prescribed drugs3 2.1 1.5 1.7
Physician and other practitioner services 3.6 3.3 3.6
Dental services 1.1 0.9 0.8
Outpatient hospital services 3.8 3.9 3.4
Clinic services4 2.6 2.4 2.2
Laboratory and radiological services 0.4 0.4 0.4
Early and periodic screening 0.3 0.3 0.2
Case management services 0.7 0.7 0.6
Capitation payments (non-Medicare) 29.1 31.9 37.8
Medicare premiums 3.3 3.2 3.0
Disproportionate share hosp. payments 4.2 3.8 3.8
Other services 7.1 7.3 7.3
Collections5 -2.0 -1.6 -1.7 1Excludes payments under CHIP.
2Comprised of home health, home and community-based waivers, personal care and home and community-based services for functionally disabled elderly.
3Net of prescription drug rebates.
4Federally qualified health clinics, rural health clinics, and other clinics.
5Includes third party liability, probate, fraud and abuse, overpayments, and other collections.
NOTE: Numbers may not add to totals because of rounding.
SOURCES: CMS, CMCS, and OACT.

28
Table III.9
Medicare Savings Attributable to Secondary Payer
Provisions by Type of Provision
Fiscal Year
2013 2014 2015
In millions
Total $8,925.8 $8,199.9 $8,490.8
Workers' Compensation1 1,888.5 1,711.7 2,148.2
Working Aged 3,838.4 3,545.8 3,426.8
ESRD 303.1 270.9 254.4
Auto 190.1 172.9 170.1
Disability 2,119.6 1,996.8 1,884.8
Liability 566.3 488.5 600.7
VA/Other 19.8 13.3 5.8
1Includes Workers’ Compensation set-asides.
NOTES: Includes Liability savings of the global settlements recovered by CMS. Numbers may not add to totals because of rounding.
SOURCE: CMS, Office of Financial Management.
Table III.10
Medicaid/Payments by Eligibility Status
Fiscal Year 2014
Medical Assistance Payments1
Percent Distribution
In billions
Total2 $470.0 100.0
Age 65 years and over 81.7 17.4
Blind/disabled 192.1 40.9
Dependent children
under 21 years of age 86.5 18.4
Adults 73.6 15.7
Expansion Adults 23.9 5.1
Disproportionate share hospital
and other unallocated payments3 12.2 2.6 1Medicaid Total Computable Expenditures.
2Excludes payments under Children's Health Insurance Program (CHIP).
3Includes collections, prior period adjustments, and payments to territories.
SOURCE: CMS, Office of the Actuary.

29
Table III.11
Medicare/DME/POS1
BETOS Category Allowed Charges2
2014 2015
In thousands
Total $8,686,710 $9,222,185
Medical/surgical supplies 204,469 226,900
Hospital beds 119,600 110,304
Oxygen and supplies 1,429,545 1,427,220
Wheelchairs 617,261 616,072
Prosthetic/orthotic devices 2,363,720 2,495,475
Drugs admin. through DME3 827,574 874,702
Parenteral and enteral nutrition 512,214 499,397
Other DME 2,612,327 2,972,114
1Data are for calendar year. DME=durable medical equipment. POS=Prosthetic, orthotic, and supplies.
2The allowed charge is the Medicare approved payment reported on a line item on the physician/supplier claim.
3Includes inhalation drugs administered through nebulizers only and does not include drugs administered through other DME such as infusion pumps.
NOTES: Over time, the composition of BETOS categories has changed with the reassignment of selected procedures, services, and supplies. Data for 2014 and 2015 as reported in the CMS Chronic Conditions Data Warehouse.
SOURCE: CMS, Office of Enterprise Data and Analytics.
30
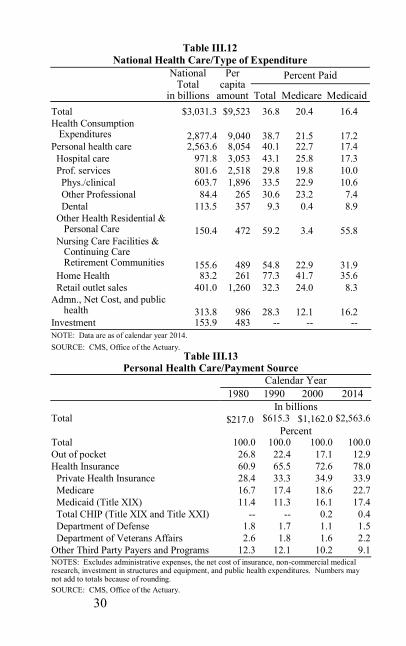
Table III.12
National Health Care/Type of Expenditure
National Total
in billions
Per capita
amount
Percent Paid
Total Medicare Medicaid
Total $3,031.3 $9,523 36.8 20.4 16.4
Health Consumption Expenditures 2,877.4 9,040 38.7 21.5 17.2 Personal health care 2,563.6 8,054 40.1 22.7 17.4
Hospital care 971.8 3,053 43.1 25.8 17.3
Prof. services 801.6 2,518 29.8 19.8 10.0
Phys./clinical 603.7 1,896 33.5 22.9 10.6
Other Professional 84.4 265 30.6 23.2 7.4
Dental 113.5 357 9.3 0.4 8.9
Other Health Residential & Personal Care 150.4 472 59.2 3.4 55.8 Nursing Care Facilities & Continuing Care Retirement Communities 155.6 489 54.8 22.9 31.9 Home Health 83.2 261 77.3 41.7 35.6
Retail outlet sales 401.0 1,260 32.3 24.0 8.3
Admn., Net Cost, and public health 313.8 986 28.3 12.1 16.2 Investment 153.9 483 -- -- --
NOTE: Data are as of calendar year 2014.
SOURCE: CMS, Office of the Actuary.
Table III.13 Personal Health Care/Payment Source
Calendar Year
1980 1990 2000 2014
In billions Total $217.0 $615.3 $1,162.0 $2,563.6
Percent Total 100.0 100.0 100.0 100.0
Out of pocket 26.8 22.4 17.1 12.9
Health Insurance 60.9 65.5 72.6 78.0
Private Health Insurance 28.4 33.3 34.9 33.9
Medicare 16.7 17.4 18.6 22.7
Medicaid (Title XIX) 11.4 11.3 16.1 17.4
Total CHIP (Title XIX and Title XXI) -- -- 0.2 0.4
Department of Defense 1.8 1.7 1.1 1.5
Department of Veterans Affairs 2.6 1.8 1.6 2.2
Other Third Party Payers and Programs 12.3 12.1 10.2 9.1 NOTES: Excludes administrative expenses, the net cost of insurance, non-commercial medical research, investment in structures and equipment, and public health expenditures. Numbers may not add to totals because of rounding.
SOURCE: CMS, Office of the Actuary.

31
Utilization
Information about the use of health
care services
Utilization information is organized by persons receiving
services and alternately by services rendered. Measures
of health care usage include: persons served, units of
service (e.g., discharges, days of care, etc.), and
dimensions of the services rendered (e.g., average length
of stay, charge per person or per unit of service). These
utilization measures are aggregated by program coverage
categories, provider characteristics, type of service, and
demographic and geographic variables.

32
Table IV.1
Medicare/Short-Stay Hospital Utilization
2012 2013 2014 2015
Discharges
Total in millions 10.5 10.1 9.8 9.8
Rate per 1,000 enrollees1 284 270 261 260
Days of care
Total in millions 51 49 48 48
Rate per 1,000 enrollees1 1,382 1,323 1,284 1,275
Total payments per day $2,152 $2,235 $2,280 $2,314
1The population base for the denominator is Part A Original Medicare enrollment. The enrollee counts are based on a person-year methodology.
NOTES: Data may reflect underreporting due to a variety of reasons, including: operational difficulties experienced by intermediaries; no-pay, at-risk managed care utilization; and no-pay Medicare secondary payer bills. Data are based on 100-percent Original Medicare claims data from the Chronic Conditions Data Warehouse (CCW). Data may differ from other sources or from the same source with a different update cycle.
SOURCE: CMS, Office of Enterprise Data and Analytics.
Table IV.2
Medicare Long-Term Care/Trends
Skilled Nursing Facilities Home Health Agencies
Persons
Served in thousands
Served per 1,000 enrollees
Persons
Served in thousands
Served per 1,000 enrollees
Calendar year
2010 1,844 52 3,424 95
2011 1,870 52 3,442 94
2012 1,847 50 3,440 93
2013 1,846 50 3,469 92
2014 1,832 49 3,415 91
2015 1,845 49 3,453 91
NOTE: Managed care enrollees excluded in determining rates.
SOURCE: CMS, Office of Enterprise Data and Analytics.

33
Table IV.3
Medicare Average Length of Stay/Trends
Calendar Year
2011 2012 2013 2014 2015
Total All Hospitals 6.0 6.0 6.1 6.1 6.0
Short-Stay 5.1 5.1 5.1 5.1 5.1
Critical Access 3.6 3.5 3.5 3.4 3.4
Long Term 30.1 30.1 30.5 30.5 31.4
Psychiatric 15.1 15.1 15.1 15.0 15.3
Rehabilitation 13.0 12.9 12.8 12.8 12.7
Religious Nonmedical 20.0 19.8 21.9 23.7 22.6
Childrens’ 7.5 7.5 7.4 7.4 6.9
Other 6.4 6.7 6.8 6.9 6.9
NOTES: Calendar year data. Average length of stay is shown in days. Data are based on 100-percent Original Medicare claims data from the Chronic Conditions Data Warehouse. Data may differ from other sources or from the same source with a different update cycle.
SOURCE: CMS, Office of Enterprise Data and Analytics.
Table IV.4
Medicare Persons Served/Trends
Calendar Year
2011 2012 2013 2014 2015
Aged persons served
per 1,000 enrollees
HI and/or SMI 925 918 916 916 915
HI 223 216 210 204 205
SMI 1,004 1,003 1,004 1,006 1,007
Disabled persons served
per 1,000 enrollees
HI and/or SMI 869 872 877 885 891
HI 210 207 202 201 201
SMI 958 958 959 962 967
NOTES: Managed care enrollees excluded in determining rates. Persons served represent esti-
mates of beneficiaries receiving services under Original Medicare during the calendar year. Data
are based on 100-percent Original Medicare claims data from the Chronic Conditions Data Ware-
house. Data may differ from other sources or from the same source with a different update cycle.
SOURCE: CMS, Office of Enterprise Data and Analytics.

34
Table IV.5
Original Medicare Persons Served
Year
2011 2012 2013 2014 2015
HI
Aged
Original Medicare Enrollees 29.5 30.1 30.5 30.7 31.0
Persons served 6.6 6.5 6.4 6.3 6.4
Rate per 1,000 223 216 210 204 205
Disabled
Original Medicare Enrollees 6.7 6.7 6.7 6.6 6.5
Persons served 1.4 1.4 1.4 1.3 1.3
Rate per 1,000 210 207 202 201 201
SMI
Aged
Original Medicare Enrollees 27.0 27.4 27.6 27.8 28.0
Persons served 27.1 27.5 27.7 27.9 28.2
Rate per 1,000 1,004 1,003 1,004 1,006 1,007
Disabled
Original Medicare Enrollees 6.0 6.1 6.1 6.0 5.9
Persons served 5.7 5.8 5.8 5.8 5.7
Rate per 1,000 958 958 959 962 967
NOTES: Medicare enrollment is based on a person-year methodology. Persons served represents counts of beneficiaries receiving reimbursed services under Original Medicare during the calendar year. Rate is the ratio of persons served during the calendar year to the number of Original Medi-care enrollees. Counts are based on 100-percent Original Medicare claims data from the Chronic Conditions Data Warehouse (CCW). Data may differ from other sources or from the same source with a different update cycle.
Original Medicare enrollees and persons served counts are in millions.
SOURCE: CMS, Office of Enterprise Data and Analytics.

35
Table IV.6
Medicare Persons Served/CMS Region
Aged Persons Served
in thousands
Served per 1,000 Enrollees
Disabled Persons
Served in thousands
Served per 1,000 Enrollees
All Regions1 28,653 915 5,775 891
Boston 1,585 896 354 898
New York 2,592 867 481 818
Philadelphia 3,062 915 588 891
Atlanta 6,217 947 1,367 918
Chicago 4,914 998 1,065 932
Dallas 3,254 921 691 893
Kansas City 1,561 944 301 895
Denver 981 952 152 876
San Francisco 2,776 727 472 740
Seattle 1,127 881 213 856 1Includes utilization for residents of outlying territories, possessions, foreign countries, and unknown.
NOTES: Data are based on counts of beneficiaries receiving HI and/or SMI reimbursed services under Original Medicare during calendar year 2015. Numbers may not add to totals because of rounding.
SOURCE: CMS, Office of Enterprise Data and Analytics.
Table IV.6a
Original Medicare Persons Served by Type of Service
Total Persons Served in thousands
Aged Persons Served in thousands
Disabled Persons
Served in thousands
Parts A and/or B 34,408 28,653 5,755
Part A 7,655 6,360 1,295
Inpatient hospital 6,630 5,394 1,235
Skilled nursing facility 1,845 1,676 169
Hospice 1,395 1,320 75
Home health agency 1,669 1,464 204
Part B 33,834 28,152 5,682
Physician/supplier 33,320 27,748 5,572
Outpatient 25,289 20,829 4,460
Home health agency 1,958 1,711 248
NOTES: Data are as of calendar year 2015. Persons served represents counts of beneficiaries receiving services under Original Medicare during the calendar year.
SOURCE: CMS, Office of Enterprise Data and Analytics.

36
Table IV.7
Medicare End Stage Renal Disease (ESRD) by Treatment Modalities
Medicare Entitled
Year Total Dialysis Patients
Transplant Patients
1991 179,726 140,899 38,827
1999 317,965 247,446 70,519
2000 334,485 260,179 74,306
2004 394,465 303,848 90,617
2005 409,499 314,057 95,442
2006 426,249 325,777 100,472
2007 442,203 337,212 104,991
2008 459,037 349,622 109,415
2009 477,223 363,491 113,732
2010 495,294 377,117 118,177
2011 511,802 388,877 122,925
2012 528,661 401,776 126,885
2013 549,108 414,921 134,187
2014 568,255 426,574 141,681
SOURCES: United States Renal Data System. National Institutes of Health, National Institute of Diabetes and Digestive and Kidney Diseases.
Table IV.8
Medicare End Stage Renal Disease (ESRD)
by Treatment Modalities and Demographics, 2013
Medicare Entitled
Total
Dialysis Patients
Transplant Patients
Total--all patients 549,108 414,921 134,187
Age
0-19 years 3,072 1,240 1,832
20-64 years 298,722 212,386 86,336
65-74 years 143,898 107,743 36,155
75 years and over 103,416 93,552 9,857
Sex
Male 315,124 234,521 80,603
Female 233,984 180,400 53,574
Race
White 335,879 241,045 94,834
Black 176,620 146,764 29,856
Native American 5,991 4,803 1,188
Asian/Pacific 27,952 21,077 6,875
Other/Unknown 2,666 1,232 1,434
SOURCES: United States Renal Data System. National Institutes of Health, National Institute of Diabetes and Digestive and Kidney Diseases.
37
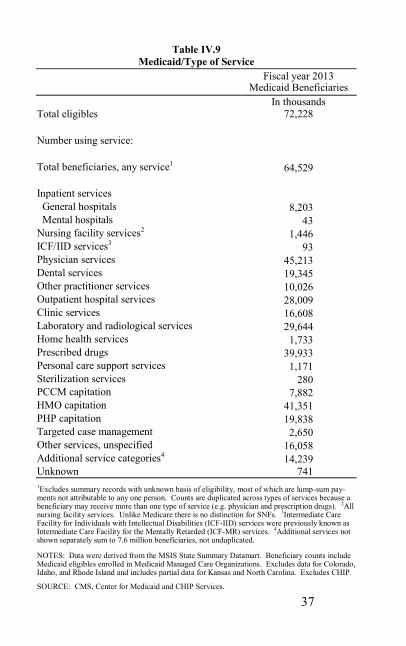
Table IV.9
Medicaid/Type of Service
Fiscal year 2013
Medicaid Beneficiaries
In thousands Total eligibles 72,228
Number using service:
Total beneficiaries, any service1 64,529
Inpatient services
General hospitals 8,203
Mental hospitals 43
Nursing facility services2 1,446
ICF/IID services3 93
Physician services 45,213
Dental services 19,345
Other practitioner services 10,026
Outpatient hospital services 28,009
Clinic services 16,608
Laboratory and radiological services 29,644
Home health services 1,733
Prescribed drugs 39,933
Personal care support services 1,171
Sterilization services 280 PCCM capitation 7,882
HMO capitation 41,351
PHP capitation 19,838
Targeted case management 2,650
Other services, unspecified 16,058
Additional service categories4 14,239
Unknown 741
1Excludes summary records with unknown basis of eligibility, most of which are lump-sum pay-ments not attributable to any one person. Counts are duplicated across types of services because a beneficiary may receive more than one type of service (e.g. physician and prescription drugs). 2All nursing facility services. Unlike Medicare there is no distinction for SNFs. 3Intermediate Care Facility for Individuals with Intellectual Disabilities (ICF-IID) services were previously known as Intermediate Care Facility for the Mentally Retarded (ICF-MR) services. 4Additional services not shown separately sum to 7.6 million beneficiaries, not unduplicated.
NOTES: Data were derived from the MSIS State Summary Datamart. Beneficiary counts include Medicaid eligibles enrolled in Medicaid Managed Care Organizations. Excludes data for Colorado, Idaho, and Rhode Island and includes partial data for Kansas and North Carolina. Excludes CHIP.
SOURCE: CMS, Center for Medicaid and CHIP Services.
38
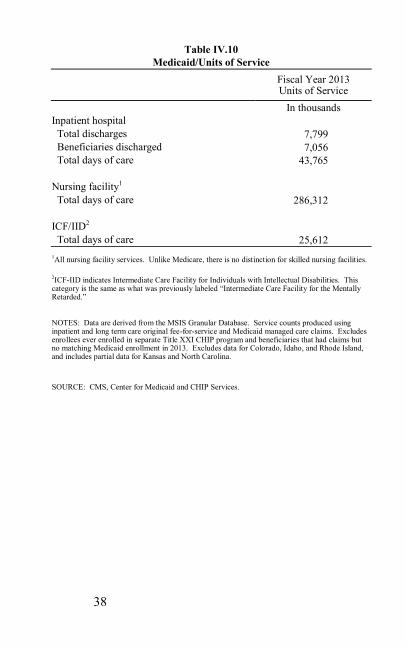
Table IV.10
Medicaid/Units of Service
Fiscal Year 2013 Units of Service
In thousands
Inpatient hospital
Total discharges 7,799
Beneficiaries discharged 7,056
Total days of care 43,765
Nursing facility1
Total days of care 286,312
ICF/IID2
Total days of care 25,612
1All nursing facility services. Unlike Medicare, there is no distinction for skilled nursing facilities.
2ICF-IID indicates Intermediate Care Facility for Individuals with Intellectual Disabilities. This category is the same as what was previously labeled “Intermediate Care Facility for the Mentally Retarded.”
NOTES: Data are derived from the MSIS Granular Database. Service counts produced using inpatient and long term care original fee-for-service and Medicaid managed care claims. Excludes enrollees ever enrolled in separate Title XXI CHIP program and beneficiaries that had claims but no matching Medicaid enrollment in 2013. Excludes data for Colorado, Idaho, and Rhode Island, and includes partial data for Kansas and North Carolina.
SOURCE: CMS, Center for Medicaid and CHIP Services.
39
Administrative/Operating
Information on activities and services
related to oversight of the day-to-day
operations of CMS programs
Included are data on Medicare contractors, contractor
activities and performance, CMS and State agency
administrative costs, quality control, and summaries of
the operation of the Medicare trust funds.
40
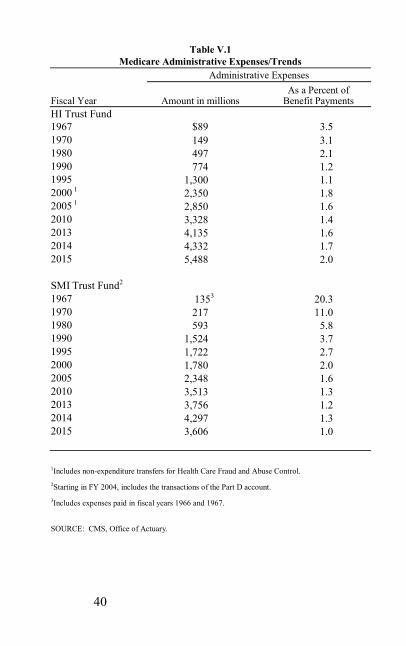
Table V.1
Medicare Administrative Expenses/Trends
Administrative Expenses
Fiscal Year Amount in millions As a Percent of
Benefit Payments
HI Trust Fund
1967 $89 3.5
1970 149 3.1
1980 497 2.1
1990 774 1.2
1995 1,300 1.1
2000 1 2,350 1.8
2005 1 2,850 1.6
2010 3,328 1.4
2013 4,135 1.6
2014 4,332 1.7
2015 5,488 2.0
SMI Trust Fund2
1967 1353 20.3
1970 217 11.0
1980 593 5.8
1990 1,524 3.7
1995 1,722 2.7
2000 1,780 2.0
2005 2,348 1.6
2010 3,513 1.3
2013 3,756 1.2
2014 4,297 1.3
2015 3,606 1.0
1Includes non-expenditure transfers for Health Care Fraud and Abuse Control.
2Starting in FY 2004, includes the transactions of the Part D account.
3Includes expenses paid in fiscal years 1966 and 1967.
SOURCE: CMS, Office of Actuary.

41
Table V.2
Medicare Administrative Contractors
Number
A/B MACs 12
DME MACs 4
NOTE: Data as of January 2016.
SOURCE: CMS, Center for Medicare.
Table V.3
Medicare Redeterminations
A/B MAC
Redeterminations (Part A Cases
Involved)
A/B MAC Redeterminations
(Part B Cases Involved)
A/B MAC and DME MAC
Redeterminations (Part B Cases
Involved)
Number Processed 122,834 199,319 2,484,598
Percent Reversed 20.1 47.4 38.5 (Includes Fully & Partially Reversed Cases)
NOTES: Data for fiscal year 2015. Data presented in cases.
SOURCE: CMS, Center for Medicare.
Table V.4
Medicare Physician/Supplier Claims Assignment Rates
2005 2010 2012 2013 2014 2015
In millions
Claims total 951.6 972.7 1,003.2 994.6 990.4 997.7
Claims assigned 940.7 965.7 997.4 989.2 985.4 993.1
Claims unassigned 10.9 7.0 5.8 5.4 5.0 4.7
Percent assigned 98.9 99.3 99.4 99.5 99.5 99.5
NOTE: Calendar year data (Railroad Board, A/B MACs (B), DME MACs).
SOURCE: CMS, Center for Medicare.
42
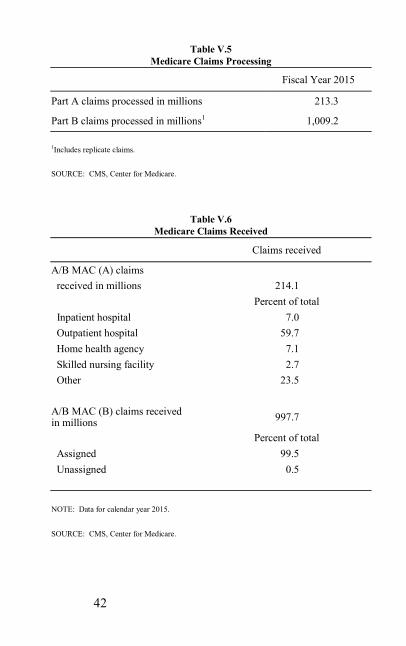
Table V.5
Medicare Claims Processing
Fiscal Year 2015
Part A claims processed in millions 213.3
Part B claims processed in millions1 1,009.2
1Includes replicate claims.
SOURCE: CMS, Center for Medicare.
Table V.6
Medicare Claims Received
Claims received
A/B MAC (A) claims
received in millions 214.1
Percent of total
Inpatient hospital 7.0
Outpatient hospital 59.7
Home health agency 7.1
Skilled nursing facility 2.7
Other 23.5
A/B MAC (B) claims received in millions
997.7
Percent of total
Assigned 99.5
Unassigned 0.5
NOTE: Data for calendar year 2015.
SOURCE: CMS, Center for Medicare.

43
Table V.7
Medicare Charge Reductions
Assigned Unassigned
Claims approved
Number in millions 904.8 4.0
Percent reduced 96.4 83.5
Total covered charges
Amount in millions $371,731 $506
Percent reduced 64.2 23.0
Amount reduced per claim $263.57 $29.05
NOTES: Data for calendar year 2015. As a result of report changes effective April 1, 1992, charge reductions include: reasonable charge, medical necessity, and global fee/rebundling reductions.
SOURCE: CMS, Center for Medicare.
Table V.8
Medicaid Administration
Fiscal Year
2014 2015
In millions
Total payments computable
for Federal funding1 $24,418 $25,603
Federal share1
Family Planning 30 28
Design, development or
installation of MMIS2 663 806
Skilled professional
medical personnel 487 462
Operation of an
approved MMIS2 1,569 1,783
All other 12,359 13,139
Mechanized systems not
approved under MMIS2 85 153
Total Federal Share $15,193 $16,371
Net adjusted Federal share3 $14,675 $15,954 1Source: Form CMS-64. (Net Expenditures Reported—Administration).
2Medicaid Management Information System. 3Includes CMS adjustments.
SOURCE: CMS, Office of Enterprise Data and Analytics.

44

Reference
Selected reference material including
program financing, cost-sharing features
of the Medicare program, and Medicaid
Federal medical assistance percentages
45

Prog
ram
Fin
an
cin
g,
Co
st S
harin
g a
nd
Lim
ita
tio
ns
Med
icare/
So
urc
e of
Inco
me
Med
icare P
art
A
Hosp
ital
In
sura
nce
tru
st f
und
: 1
. P
ayro
ll t
axes
*
2. I
nco
me
from
tax
atio
n o
f S
oci
al S
ecu
rity
ben
efit
s 3
. T
ran
sfer
s fr
om
Rai
lroad
Ret
irem
ent
acco
un
t 4
. G
ener
al r
even
ue
for
un
insu
red p
erso
ns
and
mil
itar
y w
age
cred
its
5. P
rem
ium
s fr
om
volu
nta
ry e
nro
llee
s 6
. I
nte
rest
on
in
ves
tmen
ts
*C
on
trib
uti
on r
ate
2
015
201
6
20
17
Per
cen
t E
mp
loyee
s an
d e
mp
loyer
s, e
ach
1.4
5
1
.45
1.4
5
Sel
f-em
plo
yed
2
.90
2.9
0
2.9
0
Max
imum
tax
able
am
ou
nt
(CY
201
7)
N
on
e1
Volu
nta
ry H
I m
on
thly
pre
miu
m2
$
41
3.0
0
Part
A (
effe
cti
ve d
ate
) A
mo
un
t
In
pat
ient
hosp
ital
$
1,3
16
/ben
efit
per
iod
d
edu
ctib
le (
1/1
/17
)
Reg
ula
r co
insu
rance
$
329
/day
for
61
st
day
s (1
/1/1
7)
th
rou
gh
90th
day
Lif
etim
e re
serv
e d
ays
$
658
/day
(6
0 n
on-
(1
/1/1
7)
r
enew
able
day
s)
SN
F c
oin
sura
nce
day
s
$164
.50/d
ay f
or
21
st
(
1/1
/17
)
th
rou
gh
100
th d
ay
Blo
od
ded
uct
ible
f
irst
3 p
ints
/cal
end
ar
yea
r
Volu
nta
ry h
osp
ital
in
sura
nce
$
413
/mon
th;
$22
7/m
o.
p
rem
ium
(1/1
/17
)2
wit
h 3
0-3
9 q
uar
ters
of
cover
age
Lim
ita
tio
ns:
In
pat
ien
t p
sych
iatr
ic h
osp
ital
s
1
90
non
ren
ewab
le d
ays
1T
he
Om
nib
us
Rec
oncil
iati
on A
ct o
f 1993 e
lim
inat
ed t
he
Annual
Maxim
um
Taxab
le E
arn
ings
am
ou
nts
fo
r 1
99
4 a
nd
lat
er.
F
or
thes
e yea
rs,
the
contr
ibuti
on r
ate
is a
pp
lied
to
all
ear
nin
gs
in c
over
ed e
mp
loym
ent.
2P
rem
ium
paid
fo
r vo
lun
tary
part
icip
ati
on o
f in
div
iduals
aged
65 a
nd o
ver
not
oth
erw
ise
enti
tled
to
ho
spit
al
insu
rance
an
d c
erta
in d
isab
led
in
div
iduals
w
ho h
ave
exhaust
ed o
ther
enti
tlem
ent.
A
red
uce
d p
rem
ium
of
$2
27 i
s av
ail
able
to
in
div
iduals
aged
65
and
over
who
are
no
t o
therw
ise
enti
tled
to
hosp
ital
insu
rance
but
who
have,
or
whose
spouse
has
or
had
, 30
-39 q
uart
ers
of
cover
age
und
er T
itle
II
of
the
So
cia
l S
ecuri
ty A
ct.
SO
UR
CE
: C
MS
, O
ffic
e o
f th
e A
ctuar
y.

Prog
ram
Fin
an
cin
g,
Co
st S
harin
g a
nd
Lim
ita
tio
ns
Med
icare P
art
B
Sup
ple
men
tary
Med
ical
In
sura
nce
tru
st f
und
: 1
. P
rem
ium
s p
aid
by o
r on
beh
alf
of
enro
llee
s 2
. G
ener
al r
even
ue
3. I
nte
rest
on
in
ves
tmen
ts
Part
B (
effe
cti
ve d
ate
)
Am
ou
nt
Ded
uct
ible
(1
/1/1
7)
$
183
in
all
ow
ed c
har
ges
/yea
r B
lood
ded
uct
ible
firs
t 3
pin
ts/c
alen
dar
yea
r C
oin
sura
nce
1
2
0 p
erce
nt
of
allo
wed
char
ges
M
onth
ly s
tan
dar
d p
rem
ium
(1
/1/1
7)
$
134
/mon
th
Lim
ita
tio
ns:
O
utp
atie
nt
trea
tmen
t fo
r m
enta
l il
lnes
s
No l
imit
atio
ns
1T
he
Par
t B
ded
uct
ible
and
co
insu
rance
app
lies
to m
ost
ser
vic
es.
Ite
ms
and/o
r se
rvic
es n
ot
sub
ject
to
eit
her
the
ded
uct
ible
or
coin
sura
nce
are
clin
ical
dia
gno
stic
lab
tes
ts s
ub
ject
to a
fee
sch
edule
, ho
me
hea
lth s
ervic
es,
item
s and
ser
vic
es f
urn
ished
in c
on
nec
tio
n t
o o
bta
inin
g a
sec
ond
or
thir
d o
pin
ion,
and
so
me
pre
ven
tive
serv
ices
.
SO
UR
CE
: C
MS
, O
ffic
e o
f th
e A
ctuar
y.

In a
dd
itio
n,
the
month
ly p
rem
ium
rat
es t
o b
e p
aid b
y b
enef
icia
ries
wh
o a
re m
arri
ed a
nd
liv
ed w
ith
th
eir
spou
se a
t an
y t
ime
du
rin
g t
he
taxab
le y
ear,
but
file
a s
epar
ate
tax r
etu
rn f
rom
th
eir
spou
se a
re l
iste
d b
elo
w:
Benefi
cia
ries
who
fil
e an i
nd
ivid
ual
tax r
eturn
wit
h i
nco
me:
L
ess
than
or
equal
to $
85,0
00
Gre
ater
than
$85,0
00 a
nd l
ess
than
o
r eq
ual
to
$107,0
00
Gre
ater
than
$10
7,0
00
and
les
s th
an
o
r eq
ual
to
$160,0
00
Gre
ater
than
$160,0
00 a
nd l
ess
than
o
r eq
ual
to
$214,0
00
Gre
ater
than
$214,0
00
Benefi
cia
ries
who
fil
e a
join
t ta
x
retu
rn w
ith i
nco
me:
L
ess
than
or
equal
to $
170,0
00
Gre
ater
than
$170,0
00 a
nd l
ess
than
o
r eq
ual
to
$214,0
00
Gre
ater
than
$214,0
00 a
nd l
ess
than
o
r eq
ual
to
$320,0
00
Gre
ater
than
$320,0
00 a
nd l
ess
than
o
r eq
ual
to
$428,0
00
Gre
ater
than
$428,0
00
Inco
me-r
elat
ed m
onth
ly
adju
stm
ent
amo
unt
$0.0
0
$53.5
0
$133.9
0
$214.3
0
$294.6
0
Mar
ried
benefi
cia
ries
who
liv
ed w
ith t
heir
sp
ouse
and f
iled
a s
epar
ate
tax r
eturn
: L
ess
than
or
equal
to $
85,0
00
Gre
ater
than
$85,0
00 a
nd l
ess
than
or
equal
to $
129,0
00
G
reat
er t
han
$129,0
00
Inco
me-r
elat
ed m
onth
ly
adju
stm
ent
amo
unt
$
0.0
0
$
214.3
0
$
294.6
0
Tota
l m
onth
ly
pre
miu
m a
mo
unt
$134.0
0
$348.3
0
$428.6
0
SO
UR
CE
: C
MS
, O
ffic
e o
f th
e A
ctuar
y.
Tota
l m
onth
ly
pre
miu
m a
mo
unt
$134.0
0
$187.5
0
$267.9
0
$348.3
0
$428.6
0
Prog
ram
Fin
an
cin
g,
Co
st S
harin
g a
nd
Lim
ita
tio
ns
Med
ica
re P
art
B (
co
nti
nu
ed
) L
iste
d b
elo
w a
re t
he
2017
Par
t B
month
ly p
rem
ium
rat
es t
o b
e pai
d b
y b
enef
icia
ries
wh
o f
ile
an i
nd
ivid
ual
tax
ret
urn
(i
ncl
udin
g t
hose
wh
o a
re s
ingle
, h
ead
of
hou
seh
old
, qu
alif
yin
g w
idow
(er)
wit
h d
epen
den
t ch
ild
, or
mar
ried
fil
ing s
epar
atel
y
wh
o l
ived
ap
art
from
th
eir
spou
se f
or
the
enti
re t
axab
le y
ear)
, or
a jo
int
tax r
etu
rn.

Prog
ram
Fin
an
cin
g,
Co
st S
harin
g a
nd
Lim
ita
tio
ns
1T
he
bas
e b
enefi
cia
ry p
rem
ium
was
calc
ula
ted b
ased
on a
nat
ional
avera
ge
pla
n b
id.
The
actu
al
pre
miu
m t
hat
a b
enefi
cia
ry p
ays v
arie
s ac
cord
ing t
o t
he
pla
n i
n w
hic
h t
he
benefi
cia
ry i
s enro
lled
.
NO
TE
S:
The
benefi
cia
ries
who q
uali
fy f
or
the
low
-inco
me
subsi
dy u
nder
Part
D p
ay a
red
uce
d o
r ze
ro p
rem
ium
. I
n a
dd
itio
n,
low
-inco
me
ben
efi
cia
ries
are
sub
ject
to
only
min
imal
co
pay
ment
am
ounts
in m
ost
inst
ance
s.
SO
UR
CE
: C
MS
, O
ffic
e o
f th
e A
ctuar
y.
Med
ica
re P
art
D S
tan
da
rd
Ben
efi
ts
Ded
uct
ible
(1
/1/2
017
)
$400
in
ch
arges
/yea
r In
itia
l co
ver
age
lim
it (
1/1
/20
17
)
$
3,7
00
in
ch
arges
/yea
r O
ut-
of-
pock
et t
hre
shold
(1/1
/2017
)
$4,9
50
in
ch
arges
/yea
r B
ase
ben
efic
iary
pre
miu
m (
1/1
/2017
)1
$
35
.63
/mon
th
Med
ica
id F
ina
nci
ng
1
. F
eder
al c
on
trib
uti
on
s (r
angin
g f
rom
50
to 7
5 p
erce
nt
for
fisc
al y
ear
20
17
) 2
. S
tate
con
trib
uti
on
s (r
angin
g f
rom
25
to 5
0 p
erce
nt
for
fisc
al y
ear
2017
)

IX. San Francisco Arizona 69.24 California 50.00 Hawaii 54.93 Nevada 64.67 American Samoa 55.00 Guam 55.00 N. Mariana Islds 55.00
Geographical Jurisdictions of CMS Regional Offices and
Federal Medical Assistance Percentages (FMAP) Fiscal Year 2017
I. Boston FMAP Connecticut 50.00 Maine 64.38 Massachusetts 50.00 New Hampshire 50.00 Rhode Island 51.02 Vermont 54.46
II. New York FMAP New Jersey 50.00 New York 50.00 Puerto Rico 55.00 Virgin Islands 55.00
III. Philadelphia Delaware 54.20 Dist. of Columbia 70.00 Maryland 50.00 Pennsylvania 51.78 Virginia 50.00 West Virginia 71.80
IV. Atlanta Alabama 70.16 Florida 61.10 Georgia 67.89 Kentucky 70.46 Mississippi 74.63 North Carolina 66.88 South Carolina 71.30 Tennessee 64.96
VI. Dallas Arkansas 69.69 Louisiana 62.28 New Mexico 71.13 Oklahoma 59.94 Texas 56.18
VIII. Denver Colorado 50.02 Montana 65.56 North Dakota 50.00 South Dakota 54.94 Utah 69.90 Wyoming 50.00
X. Seattle Alaska 50.00 Idaho 71.51 Oregon 64.47 Washington 50.00
V. Chicago Illinois 51.30 Indiana 66.74 Michigan 65.15 Minnesota 50.00 Ohio 62.32 Wisconsin 58.51
VII. Kansas City Iowa 56.74 Kansas 56.21 Missouri 63.21 Nebraska 51.85
SOURCE: DHHS, Office of the Assistant Secretary for Planning and Evaluation.
NOTE: FMAPs are used in determining the amount of Federal matching funds for State expenditures for assistance payments.

U.S. Department of Health & Human Services Centers for Medicare & Medicaid Services Office of Enterprise Data and Analytics CMS Pub. No. 03513 March 2017