Proposal for Combined Conducted and Radiated Emission ... · Proposal for combined conducted and...
23
© IRT AESE “Saint Exupéry” - All rights reserved Confidential and proprietary document Proposal for combined conducted and radiated emission modelling for Integrated Circuit EMC-Compo 2017 workshop Russia, Saint-Petersburg Sébastien Serpaud, Chaimae Ghfiri, Alexandre Boyer, André Durier [email protected] July 6, 2017
Transcript of Proposal for Combined Conducted and Radiated Emission ... · Proposal for combined conducted and...

© IRT AESE “Saint Exupéry” - All rights reserved Confidential and proprietary document
Proposal for combined conducted and
radiated emission modelling for Integrated
Circuit
EMC-Compo 2017 workshop
Russia, Saint-Petersburg
Sébastien Serpaud, Chaimae Ghfiri, Alexandre Boyer, André Durier
July 6, 2017

• Intro : state of the art about emission modelling of IC
• ICEM-RE modeling approaches:
1. From ICEM CE (proposal method)
2. From NFS measurements (“current” method)
• Conclusion
Agenda
2

• IEC 62433-2 - EMC IC modelling – Part 2: Models of integrated circuits for EMI behavioural
simulation – Conducted emissions modelling (ICEM-CE) - Edition 2.0, January 2017, IEC• 2016 : C. Ghfiri, A. Durier, A. Boyer, S. Ben Dhia, C.Marot “Construction of a Integrated Circuit emission model of a FPGA” APEMC 2016, Shenzhen, China
• 2010 : K.R. Aravind Britto, R. Dhanasekaran, R. Vimala, K. Baskaran; ”EMC analysis of PCB using ICEM model”; 2010 IEEE International Conference on EMC,
Ramanathapuram, India
• 2009 : S. Serpaud, J. L. Levant, Y. Poiré, M. Meyer, S. Tran, "ICEM-CE extraction methodology", EMC Compo 2009, Nov. 17-19, 2009, Toulouse, France
• 2009 : E. Rogard, B. Vrignon, J. Shepherd, E. Sicard, "Characterization and Modelling of Parasitic Emission of a 32-bit Automotive Microcontroller Mounted on 2
Types of BGA", IEEE EMC Symp., Austin, Texas, USA, Aug. 2009.
• 2008 : C Labussiére-Dorgan; S Bendhia; E Sicard; J Tao; H J Quaresma; C Lochot; B Vrignon; “Modeling the Electromagnetic Emission of a Microcontroller Using
a Single Model”; IEEE Transactions on EMC, 2008, Volume: 50
• 2007 : JL Levant, "Mise en place d'une démarche d'intégration des contraintes CEM dans le flot de conception des circuits intégrés", PHD, 2007
• 2006 : T. Steinecke, D. Hesidenz, E. Miersch “EMI modeling and simulation in the IC design process”; EMC-Zurich;17th International Zurich Symposium on EMC
• 2006 : F Lafon, F De Daran; “Analyse de risque au niveau système par l'exploitation du modèle ICEM"; Colloque CEM06, At Saint Malo, France
• 2004 : F Lafon, O Maurice, F De Daran, C Lochot, S Calvet; “Exploitation of the ICEM model in an automotive application” EMC COMPO 2004, Angers, France
• 2004 : M. Ramdani; J.-L. Levant; R. Perdriau “ICEM model extraction: a case study” International Symposium on EMC, 2004
• 2003 : JL Levant; M Ramdani; R Perdriau; “ICEM modelling of microcontroller current activity”; Microelectronics Journal, Vol 35, Issue 6, June 2004, p501-507
• 2003 : C. Lochot ; J.-L. Levant; “ICEM: a new standard for EMC of IC definition and examples” IEEE International Symposium on EMC, 2003
• 2002 : JL Levant; M Ramdani; R Perdriau; “Power- Supply Network Modeling”; 3rd International Workshop on EMC of IC, Nov 2002, Toulouse, France
• IEC-62433-3 - EMC IC modelling – Part 3: Models of integrated circuits for EMI behavioural
simulation – Radiated emissions modelling (ICEM-RE) - Edition 1.0, January 2017, IEC.• 2015 : A Ramanujan, F Lafon, P Fernandez-Lopez; “Radiated Emissions Modelling From Near-Field Data – Toward International Standards”, APEMC 2015, Taipei
– Taiwan
State of the art about IC emission modeling
3
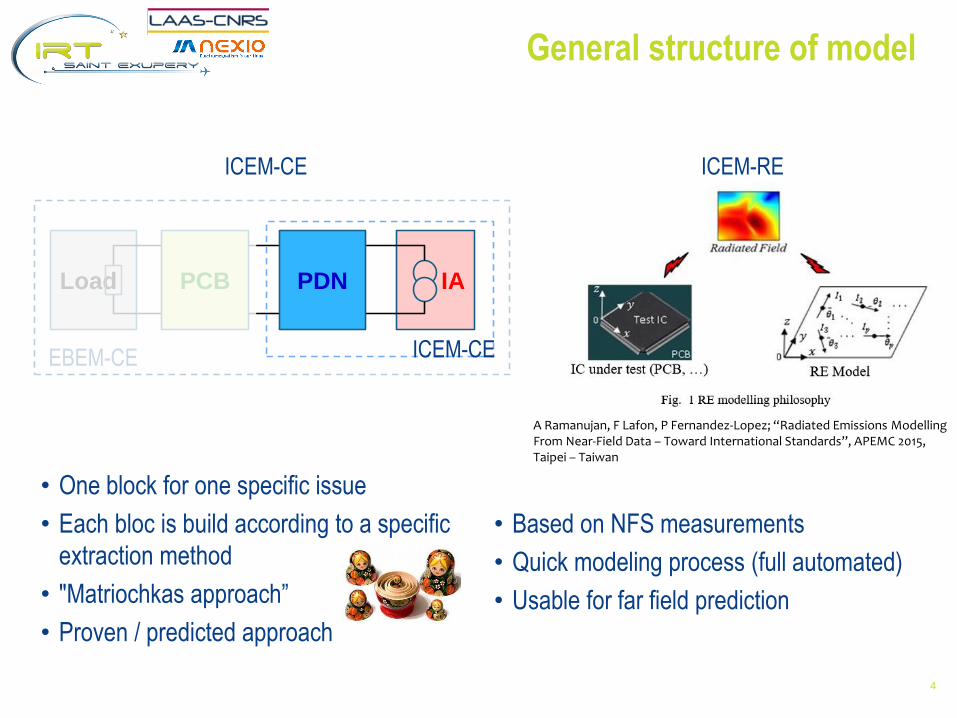
• One block for one specific issue
• Each bloc is build according to a specific
extraction method
• "Matriochkas approach”
• Proven / predicted approach
General structure of model
4
IALoad PDNPCB
ICEM-CEEBEM-CE
A Ramanujan, F Lafon, P Fernandez-Lopez; “Radiated Emissions ModellingFrom Near-Field Data – Toward International Standards”, APEMC 2015, Taipei – Taiwan
ICEM-CE ICEM-RE
• Based on NFS measurements
• Quick modeling process (full automated)
• Usable for far field prediction

• State of the art:
• Two models :
2x workflows (measurement methods)
2x software (model format, license)
2x times / costs
• Proposal: Re-use ICEM-CE to build ICEM-RE
• Only one modeling process
• Combined all advantage of two approaches
• Only one model / simulation tools for both conducted and radiated emission
analyse
• Industrially compatible with costs and delays
State of the art about IC emission modeling
5

• Intro : state of the art about emission modelling of IC
• ICEM-RE modeling approaches
1. From ICEM-CE (proposal method)
2. From NFS measurements (“current” method)
• Conclusion
Agenda
6

• DUT : Spartan 6 family of Xilinx
Device Under Test presentation
July 2017 - EMC-Compo 2017 – Saint Petersburg - Russia 7
X
Y
Area of
measurement
T9 output ball
C16 output ball
T8 input ball
Activity rate
(% LUT used)
Configurations
With periodical switching
of two I/Os at 8 MHz (T9
and C16)
Without IOs
switching
20 % “Config 20% IOon” “Config 20% IOoff”
40 % “Config 40% IOon” “Config 40% IOoff”
90 % “Config 90% IOon” “Config 90% IOoff”

• ICEM-RE model from ICEM-CE model
• ICEM-CE : ”Methodology of modelling of the internal activity of a FPGA for conducted emission prediction purpose” C. Ghfiri1,2,3, A. Boyer2,3, A.
Durier1, S. Ben Dhia2,3; EMC-Compo2017, Saint Petersburg; Russia
• EAN : Electrical Antenna Network
ICEM-RE modelling approach from ICEM-CE
8
IALoad PDNPCB
ICEM-CEEBEM-CE
ICEM-RE
EAN
ZPDN
i
IA
x
y

• Physical PDN structure of FPGA – from XRAY
ICEM-RE modelling approach from ICEM-CE
Package structure of FPGA from X-Ray
Vccint
Vccaux
GND
Vcc0
TOP Layer Bottom Layer
Top of Die
Top of substrate
Top of FPGA
0.65
Top of PCB
1.151.4
0
Dimension in mm
DieAu Bond Wire Epoxy Overmold
Top
Copper
BT/FR5 coreBottom
Copper
Solder ball
Two-layer plastic BGA 256 (FT256) package
Xray from Continental

• Physical PDN structure of FPGA – from XRAY & from pinout
ICEM-RE modelling approach from ICEM-CE
EAN bloc from Pinout of package
(115 dipoles)
Package structure of FPGA from X-Ray
EAN bloc from X-Ray of package
(235 dipoles)
Vccint
Vccaux
GND
Vcc0

• Extraction EAN bloc – from Pinout
ICEM-RE modelling approach from ICEM-CE
Hx HzHy
-22.7dBµA/m -22.2dBµA/m-23.3dBµA/m
-23.6dBµA/m -22.3dBµA/m-19.5dBµA/m
y
x
C16 IO Activity @8MHz (90%LUT with IO config)
NFS
measurement
Simulation
Simulation done on IC-EMC software (www.ic-emc.org)

• Extraction EAN bloc – from Xray
ICEM-RE modelling approach from ICEM-CE
y
x
C16 IO Activity @8MHz (90%LUT with IO config)
Hx HzHy
-22.7dBµA/m -22.2dBµA/m-23.3dBµA/m
-26.6dBµA/m -25.6dBµA/m-22.3dBµA/m
NFS
measurement
Simulation
Simulation done on IC-EMC software (www.ic-emc.org)

• Extraction EAN bloc – from Pinout
ICEM-RE modelling approach from ICEM-CE
y
x
Core Activity @16MHz (90% LUT without IO config)
NFS
measurement
Simulation
Hx Hy HzHxmax = -31dBµA/m Hymax = -31.5dBµA/m Hzmax = -32.7dBµA/m
Hxmax = -26.1dBµA/m Hymax = -27.5dBµA/m Hzmax = -33.4dBµA/m
Simulation done on IC-EMC software (www.ic-emc.org)

• Extraction EAN bloc – from XRay
ICEM-RE modelling approach from ICEM-CE
y
x
Core Activity @16MHz (90% LUT without IO config)
NFS
measurement
Simulation
Hx Hy HzHxmax = -31dBµA/m Hymax = -31.5dBµA/m Hzmax = -32.7dBµA/m
No simulation result
(simulation tool limitation)
Simulation done on IC-EMC software (www.ic-emc.org)

• Intro : state of the art about emission modelling of IC
• ICEM-RE modeling approaches:
1. From ICEM CE (proposal method)
2. From NFS measurements (“current” method)
• Conclusion
Agenda
15

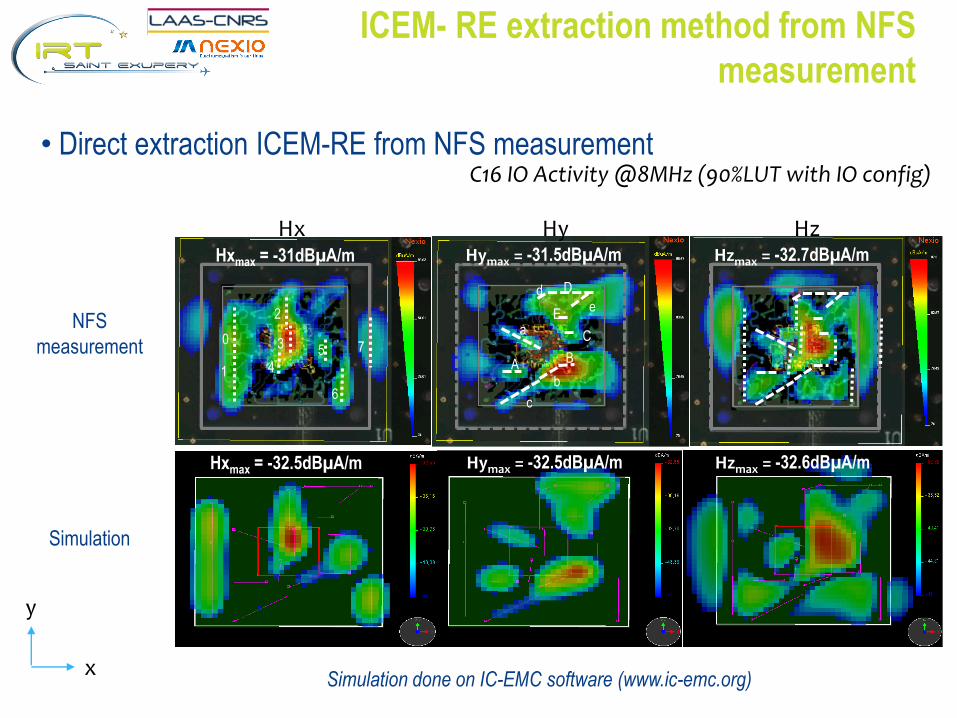
• Direct extraction IECM-RE from NFS measurement
ICEM- RE extraction method from NFS
measurement
y
x
C16 IO Activity @8MHz (90%LUT with IO config)
NFS
measurement
DipoleHeight
[mm]
|Htan|
[dbA/m]
I(f)
[µA]
I(t)
[mA]Type
0 0.65 -35.9 623 6.1 Core
1 0.65 -37.5 518 5 Core
2 1.15 - 0.65 -36 418 3.1 IO
3 1.15 -31 569 5.5 IO
4 1.15 - 0.65 -35 359 3.5 IO
5 0.65 -38.2 478 4.6 Core
6 0.65 -36.6 575 5.6 Core
DipoleHeight
[mm]
|Htan|
[dbA/m]
I(f)
[µA]
I(t)
[mA]Type
A 0.65 -38 549 4.7 Core
B 1.15 -31.6 531 5.2 Core
C 0.65 -38.5 462 4.5 IO
D 0.65 -39/-41 550 4.7/3.3 IO
E 0.65 -35.2 675.5 6.6/4 IO
a 1.15 - 0.65 -39 226.5 2.2 Core
b 1.15 - 0.65 -32.2 648.4 4.8 Core
c 0.65 -41.8 316 3.1 Core
d 0.65 -39 550 4.7 IO
e 0.65 -39/-41 550 4.7/3.3 Core
Hx Hy Hz
1
2
3
4
5
6
7
a
A B
C
D
b
c
0
d
Ee
Hxmax = -31dBµA/m Hymax = -31.5dBµA/m Hzmax = -32.7dBµA/m

• EAN block Extraction – from NFS Measurement
ICEM-RE extraction approach
EAN bloc from NFS Measurement
(17 dipoles)

• FPGA Activity analyse - 40% without IO
• NFSev on FPGA - Hz component
Activities of FPGA Analyse from NFS
measurement
18
14
5
2
3
1
2
T8 IO activity
3
4
5
T8 IO activity
T8 IO activity « filter »
Core activity
Core activity
T8 IO activity « filter »
Core activity « filter »
Core activity « filter »
Localization of picked point:

• Radiated activity (40% without IO configuration)
ICEM- RE extraction method from NFS
measurement
Activity
type
Frequency domain parameters Time domain
parameters|Htang|max
[dBµA/m]
|Af|max*
[mA]
F0
[MHz]
Fc1
[MHz]
Fc2
[MHz]
|At|max
[mA]
T
[ns]
Ton
[ns]
Tr
[ns]
Core90% 98.5 1.7
16 80 80
16.6
62.5 3.2 3.2Core40% 92.8 0.881 8.6
Core20% 89.1 0.575 5.6
Input 87.6 0.484 16 310 550 15.1 62.5 1 0.58
Output 97.8 1.5 8 200 280 61.2 125 1.6 1.15
T8 IO activity
Core activity
* Value compute from equation (2) with h=1.15mm; R=1.825mm
tA.2
log20
1
0
.
..2log20
c
tf
F
FAA
2
0
.
..2log20
c
t
F
FA
r
cT
F.
12
Repetitive Trapezoidal Pulse:
0
Tr Tf
Ton
T
Toff
Tr
on
cT
F.
11
tA
Freq
0
Magnitude
-20dB/decade
-40dB/decade
Magnitude in dB
Core DutyCycle=5.12%
Input DutyCycle=1.6%
Output DutyCycle=1.28%
Top of Die
Top of substrate
Top of FPGA
0.65
Top of PCB
1.151.4
0
Dimension in mm
Center of loop2.5
DieAu Bond Wire Epoxy Overmold
Top
Copper
BT/FR5 coreBottom
Copper
Solder ball
1.35
(3)
R
t
Htan
R
t
Htan
Ground plane
P P
I I
I
h
Image current
h
RandhRtht
Assume
;,
:
(4)
ht
htRRHI
2
2.2 tan
htRR
htIH
2
2
2tan
Radiated Dipole Equation
• Direct extraction ICEM-RE from NFS measurement
ICEM- RE extraction method from NFS
measurement
y
x
C16 IO Activity @8MHz (90%LUT with IO config)
NFS
measurement
Simulation
Hx Hy Hz
1
2
3
4
5
6
7
a
A B
C
D
b
c
0
d
Ee
Hxmax = -31dBµA/m Hymax = -31.5dBµA/m Hzmax = -32.7dBµA/m
Hxmax = -32.5dBµA/m Hymax = -32.5dBµA/m Hzmax = -32.6dBµA/m
Simulation done on IC-EMC software (www.ic-emc.org)

• Direct extraction ICEM-RE from NFS measurement – Hz field component
ICEM- RE extraction method from NFS
measurement
21
y
x
Magnitude Measurement Vector Measurement Simulation
Magnitude of Field
Phase of Field
Simulation done on IC-EMC software (www.ic-emc.org)

• Two complementary approaches (from NFS measurement - from ICEM-CE)
• Select one approach following industrial constraints:
• Ex: far field extrapolation : use ICEM-RE based on NFS measurement
• Ex: decoupling capacitor optimization : use ICEM-RE based on ICEM-CE
• Complex model of PDN/EAN (number of element)
• Limitation of manual approach (> 200 dipoles for BGA 256)
• Need to automate ICEM-RE extraction
• 3D simulation software is necessary
• Perspectives:
• modelling radiated coupling between each component (EBEM-RE)
Conclusion
July 2017 - EMC-Compo 2017 – Saint Petersburg - Russia 22

© IRT AESE ”Saint Exupéry” - All rights reserved Confidential and proprietary document. This document and all information contained
herein is the sole property of IRT AESE “Saint Exupéry”. No intellectual property rights are granted by the delivery of this document
or the disclosure of its content. This document shall not be reproduced or disclosed to a third party without the express written
consent of IRT AESE “Saint Exupéry” . This document and its content shall not be used for any purpose other than that for which it is
supplied. IRT AESE ”Saint Exupéry” and its logo are registered trademarks.
Thank for your attention
Sébastien Serpaud, Chaimae Ghfiri, Alexandre Boyer, André
Durier
23