Property Council of Australia - Retirement Living Council What is a retirement village? 04 Overview...
27
OCTOBER 2014 Property Council of Australia National overview of the retirement village sector COMMUNITY COMMUNITY
Transcript of Property Council of Australia - Retirement Living Council What is a retirement village? 04 Overview...

OCTOBER 2014
Property Council of Australia National overview of the retirement village sector
COMMUNITYCOMMUNITY

COMMUNITYCOMMUNITY
Contents
i Executive Summary
ii Statement of Limitation
01 Glossary
02 Context
03 What is a retirement village?
04 Overview of retirement villages
06 The retirement village sector is positioned for growth
07 The retirement village sector reduces the cost of health care
08 Reduction in expenditure to aged care budget
Reduction in expenditure to broader health care budget
09 Lower hospital admissions
10 Earlier discharge from hospital
11 Less frequent GP visits
12 Improved mental health and wellbeing
13 Retirement villages contribution to the economy
14 Retirement villages sector state snap shots

Executive Summary
The dramatic increase in the number of Australians turning 65 over
the next 20 years is now an established demographic fact. Treasury
projects a doubling of the seniors’ population by 2050, with an
economically significant reduction in the ratio of taxpayers to
retirees.
To support this growth there needs to be a large corresponding
increase in the amount of purpose-built housing, so that the 8.1
million Australians who will be over 65 by 2050 continue to have the
choice, independence and autonomy that they expect and deserve.
Currently about 184,000 Australians live in retirement villages,
or 5.7 per cent of the over 65 population. This penetration rate is
projected to increase to 7.5 per cent in 2025. The increased rate,
combined with the increase in the seniors’ population, means that
there will be approximately 382,000 people wanting to live in a
retirement village in 2025. This is more than double the 184,000
residents currently calling a retirement village home. As such, a large
amount of investment will be needed in the sector in coming years.
The private and not for profit sectors can play a larger role in meeting
the needs of senior Australians. The people who invest in and create
retirement villages in particular have an integral role in building
age-friendly communities, which are often a social and service hub
outside the community too.
Retirement villages offer a range of services and supports to their
residents. As these services and supports are self-funded, there is an
additional benefit of not only improving residents’ lifestyles, but
generating savings to governments. The analysis has shown that this
generates $2.16 billion in savings to the health care system. $1.98
billion of these savings are achieved by retirement villages delaying
residents’ entry into government funded aged care facilities.
While there has been some research on retirement villages delaying
the entry of their residents into aged care, quantitative research on
broader impacts and savings to the healthcare system is sparse. There
are however some logical correlations that can be drawn between the
services and supports offered by a retirement village, and cost savings
to government. The analysis completed estimates that in addition to
the $1.98 billion saved through delayed entry to aged care, there
is a potential $177 million saved through residents requiring
fewer hospital and GP visits, earlier discharge from hospital, and
better mental health.
The retirement living sector is a successful modern industry,
providing a range of care options to facilitate ageing in place. The
Productivity Commission has highlighted in recent reports that an
ageing Australia needs to do more to prepare for its ageing future,
and that retirement villages play an integral role in that future.
Retirement villages are part of the solution to the challenge of
ensuring there are enough affordable homes for Australians of all
ages, compatible with different stages of life, and less reliance on
taxpayers. The sector supplies specially designed homes, preventative
health care and community services, often at much lower margins
than other property assets competing for scarce capital.
And most importantly, all surveys show – whether it’s individual
providers or the national McCrindle Baynes Census – that the vast
majority of the 184,000 people who live in retirement villages across
Australia are happy – and happier than they were before they
moved there.
i

ii
Statement of Limitation
In preparing this report, GTAL has relied upon, and presumed
accurate, any information (or confirmation of the absence thereof)
provided by the Property Council of Australia and the Retirement
Living Council and/or from other sources. Except as otherwise
stated in the report, GTAL has not attempted to verify the accuracy
or completeness of any such information. If the information is
subsequently determined to be false, inaccurate or incomplete then it
is possible that our observations and conclusions as expressed in this
report may change.
GTAL derived the data in this report from information sourced
from the Property Council of Australia and the Retirement
Living Council (if any) and/or available in the public domain
at the time or times outlined in this report. The passage of time,
manifestation of latent conditions or impacts of future events may
require further examination of the project and subsequent data
analysis, and re-evaluation of the data, findings, observations and
conclusions expressed in this report. GTAL has prepared this report
in accordance with the usual care and thoroughness of the consulting
profession, for the sole purpose described above and by reference to
applicable standards, guidelines, procedures and practices at the date
of issue of this report. For the reasons outlined above, however, no
other warranty or guarantee, whether expressed or implied, is made as
to the data, observations and findings expressed in this report, to the
extent permitted by law.
This report should be read in full and no excerpts are to be taken
as representative of the findings. No responsibility is accepted by
GTAL for use of any part of this report in any other context. This
report has been prepared on behalf of, and for the exclusive use of,
the Property Council of Australia and the Retirement Living Council,
and is subject to, and issued in accordance with, the provisions of
the agreement between GTAL and the Property Council of Australia
and the Retirement Living Council. GTAL accepts no liability or
responsibility whatsoever for, or in respect of, any use of, or reliance
upon, this report by any third party.

Glossary
Aged care Aged care refers to residential aged care and is an accommodation option for older people who cannot live independently at
home and have been assessed by a member of the Aged Care Assessment Service (in Victoria) or Aged Care Assessment
Team (other jurisdictions) as needing this care.
Deferred Management Fee (“DMF”)
A DMF is the amount a village operator charges a resident when they leave the village. It is agreed at the time of entry and
applied on exit. The method of calculating the DMF differs across retirement village operators.
Dwelling A single unit, apartment or villa in a retirement village.
Exit entitlement The amount paid to the resident once they vacate their dwelling. This usually consists of the ingoing contribution (see
ingoing contribution definition below), plus any capital gains as stipulated in the contract, less the DMF, less the cost of
reinstatement/refurbishment as stipulated in the contract.
Freehold Freehold refers to a form of agreement for accommodation in a retirement village where the resident owns the dwelling.
DMF is still normally accrued in this agreement.
Ingoing contribution The upfront payment made by the resident to enter into a leasehold agreement for a dwelling in a retirement village, by way
of a refundable payment.
Leasehold A form of agreement for accommodation in a retirement village where the resident leases the dwelling from the operator.
This is the most common form of agreement for residents in a retirement village.
Net tax Net tax includes the company tax, GST and payroll tax paid by the retirement village sector.
Non-owner resident A non-owner resident describes a resident who does not own their dwelling. This usually refers to a resident who holds their
dwelling under a leasehold agreement.
Resident In this report a resident is a senior living in a retirement village.
Retirement village A facility that contains a number of dwellings that accommodates seniors.
Retirement village operator
A retirement village operator is a legal entity that owns and operates one or more retirement villages.
Senior A senior for the purposes of this report is a person aged 65 years or more.
1

Context
This report reviews the national retirement village sector, with specific focus on its benefits to residents, and resulting government health care savings.
Retirement villages are an important component in supporting
Australia’s growing seniors population. Many senior Australians
have chosen retirement villages because villages offer age appropriate
supports in a community environment.
Villages also reduce the costs on publicly funded health services.
This is achieved through a safe and supportive environment where
the residents are part of a close-knit local community and receive a
range of services.
Retirement villages are a self funded service, receiving no
government funding or subsidies. Through the services and supports
that they offer to their residents they are able to reduce the reliance
on other high cost and publicly funded health settings. This results
in substantial cost savings to the health care system. These cost
savings are estimated here for the first time.
As well as generating savings, the retirement village sector
contributes to national GDP and taxation revenue, through
investment and village operations.
2
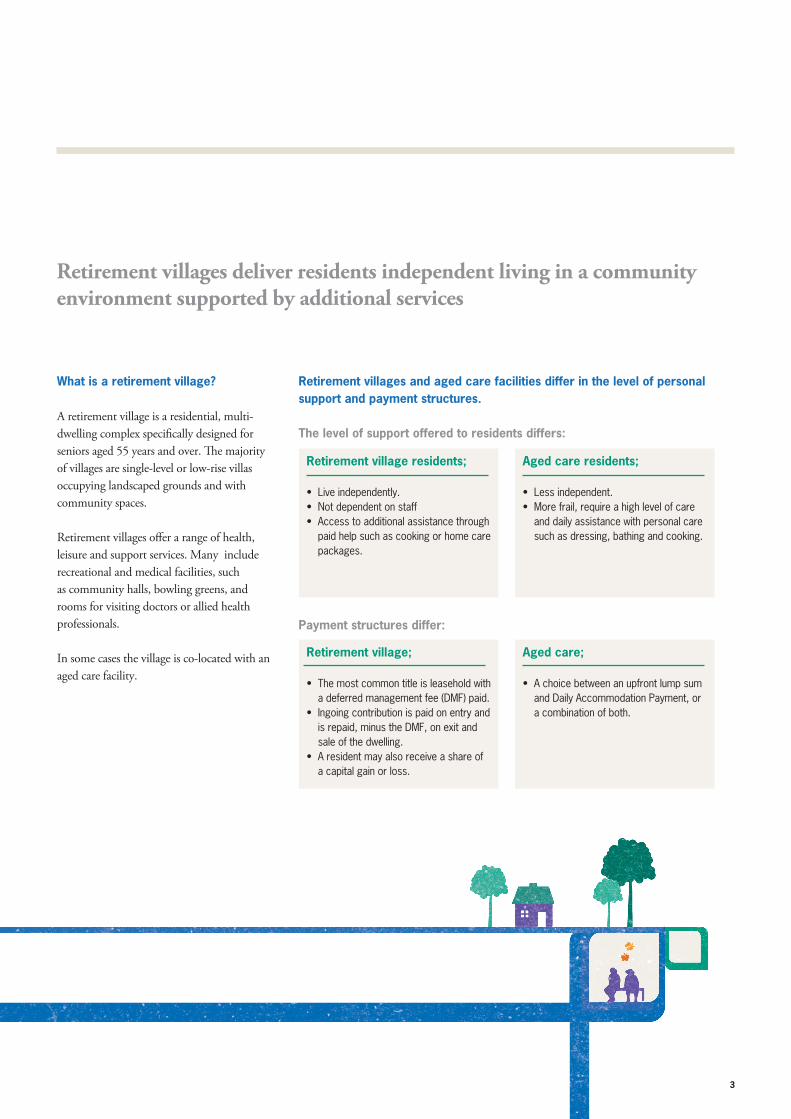
Retirement villages deliver residents independent living in a community environment supported by additional services
What is a retirement village?
A retirement village is a residential, multi-
dwelling complex specifically designed for
seniors aged 55 years and over. The majority
of villages are single-level or low-rise villas
occupying landscaped grounds and with
community spaces.
Retirement villages offer a range of health,
leisure and support services. Many include
recreational and medical facilities, such
as community halls, bowling greens, and
rooms for visiting doctors or allied health
professionals.
In some cases the village is co-located with an
aged care facility.
Retirement villages and aged care facilities differ in the level of personal
support and payment structures.
The level of support offered to residents differs:
Retirement village residents;
Live independently.Not dependent on staffAccess to additional assistance through paid help such as cooking or home care packages.
Aged care residents;
Less independent.More frail, require a high level of care and daily assistance with personal care such as dressing, bathing and cooking.
Retirement village;
The most common title is leasehold with a deferred management fee (DMF) paid. Ingoing contribution is paid on entry and is repaid, minus the DMF, on exit and sale of the dwelling. A resident may also receive a share of a capital gain or loss.
Aged care;
A choice between an upfront lump sum and Daily Accommodation Payment, or a combination of both.
Payment structures differ:
3

Retirement villages offer affordable accommodation where residents are part of a supportive community
Retirement villages address the main wellbeing
concerns of seniors.
The Productivity Commission found that “age-friendly
housing and neighbourhoods can have a positive effect on
the health and quality of life of older Australians”.1*
Older people across Australia list loneliness and social
isolation, mobility and access to transport, lack of
independence and insufficient finances as their major
concerns.2 From a health perspective, they list their top
concerns as dementia and memory loss, mobility, frailty
and mental health (including depression). Because
retirement villages are specially designed for older people,
they can help alleviate several of these concerns.
Retirement villages offer a community within which
seniors receive support in many ways including user pays
services from the organisation, informal support from
their fellow residents and friends, and organised activities
and assistance.
The ‘community feel’ in retirement villages is fostered
especially through community activities and events.
Villages offer many opportunities for residents to
interact – while still maintaining a personal and private
space – through on-site recreational facilities, community
meeting centres and social activities. The largest village
survey conducted to date by independent researchers, the
McCrindle Baynes Villages Census 2013, found that 95
per cent of respondents participated in activities organised
by the village.
95% 87%of village residents participated in activities organised by the village.4
of residents chose their particular village for a safe environment, emergency support and to maintain their independence.4
Chart 1: Retirement village dwellings are often an affordable alternative to local apartments.5
Premium Affordable Budget
13%24%
63%
10% above market price
Between 10% above and 10%
under market price
10% under market price
*Market value is the average apartment price in the LGA. Note 1
Loca
l com
paris
on o
f ret
irem
ent
villa
ge d
wel
lings
to a
part
men
ts.N
ote1
The above graph shows a comparison of retirement village dwellings to
like apartments in the local area.
Retirement villages are an affordable way to downsize from the family
home and free up equity. Analysis shows that 63 per cent of retirement
village dwellings are sold substantially under the market price for similar
sized homes in the local area.5 Through selling the family home and
downsizing to a lower priced retirement village dwelling, seniors free up
equity to fund their lifestyle and additional services over the next stage of
their life. This reduces their reliance on government funded services.
* See endnotes on page 22
Note 1: ‘Local areas’ comparison are Local Government Areas (“LGAs”).
4

184,000 seniors call a retirement village home
There are currently 184,000 seniors living in
retirement villages throughout Australia.3
The penetration rate of over 65’s into retirement villages has increased from 5.3 per cent in 20101 to 5.7 per cent currently.3
NSW, VIC and QLD have the largest overall number of residents in retirement villages.SA, WA and QLD have a higher proportion of their senior population in retirement villages.There are approximately 1.3 residents per dwelling.3
Chart 2: Market share of the retirement village sector in each state (by dwelling number).3
New South Wales and ACT
Victoria
Queensland
30%
23%21%
13%
11%
2%
State Penetration Rate of over 65s in
retirement villages
Number of residents in
retirement villages
Number of dwellings
New South Wales and ACT 4.90% 55,413 42,625
Victoria 5.30% 43,107 33,159
Queensland 6.40% 38,842 29,878
South Australia 8.60% 23,236 17,874
Western Australia 6.90% 20,599 15,846
Tasmania 3.40% 2,883 2,218
Australia 5.70% 184,080 141,600
Table 1: State breakdown of retirement village dwelling and resident numbers3, Note 15.7%
of Australians over the age of 65 are living in retirement villages in 2014.3
South Australia
Western Australia
Tasmania
Note 1: Calculated from data gathered from villages.com and agedcareguide.com.au.
5

Growth in the population of seniors is driving demand for more retirement villages
The high growth forecast for the population of over
65s in Australia will drive growth in demand for
accommodation options for seniors, including retirement
villages. Across all states and territories growth of this
age bracket is well above that of the total population.
Treasury has projected the number of seniors over of
the age of 65 to more than double by 2050.6 In the
medium term this is projected to increase to 5.1 million
by 2025.19
This increase in the population of seniors, in
combination with the projected increase in penetration
rate of over 65s into retirement villages to 7.5%,1 means
that dwellings for 382,200 people will be required by
2025.3 This is almost 200,000 more than, and greater
than double, the number of residents currently calling
a retirement village home. To meet this increase in
demand a lot more investment will be needed in the
retirement village sector over the coming years.
7.5% 8.1 million
of Australians over the age of 65 are forecast to live in retirement villages in 2025, increasing from 5.7% in 2014.3
Australians will be aged over 65 in 2050,6 increasing from 3.2 million currently.7
accommodation options for seniors, including retirement
�!+�
� +�
�+�
+�
!+�
"+�
#+�
$+�
%+�
&+�
'+�
������#��
��$���(��
�� ���� #��
�� $��� (��
��!����!#��
��!$���!(��
��"����"#��
��"$���"(��
��#����##��
��#$���#(��
��$����$#��
��$$���$(��
��%����%#��
��%$���%(��
��&����&#��
��&$���&(��
��'����'#��
��,'$�
����
���� ����
���
�������� ���� ������ ��� ���� �� ������� �����������
Chart 3: State population growth by age bracket7
This chart shows a high annual growth rate of seniors aged 60 to 74 and
indicates that demand in accommodation for seniors is likely to increase in the
coming years.
382.2 thousandPeople will be seeking accommodation in a retirement village by 2025.3
6
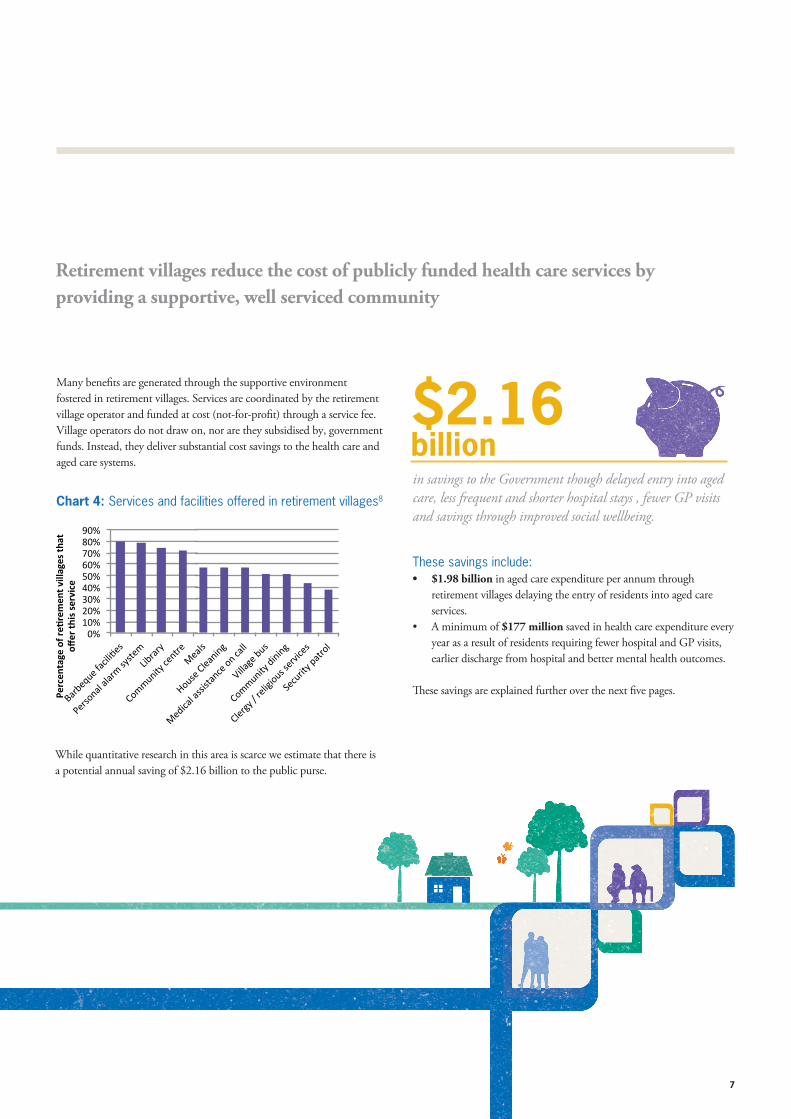
Retirement villages reduce the cost of publicly funded health care services by
providing a supportive, well serviced community
Many benefits are generated through the supportive environment
fostered in retirement villages. Services are coordinated by the retirement
village operator and funded at cost (not-for-profit) through a service fee.
Village operators do not draw on, nor are they subsidised by, government
funds. Instead, they deliver substantial cost savings to the health care and
aged care systems.
Chart 4: Services and facilities offered in retirement villages8
While quantitative research in this area is scarce we estimate that there is
a potential annual saving of $2.16 billion to the public purse.
$2.16 billionin savings to the Government though delayed entry into aged care, less frequent and shorter hospital stays , fewer GP visits and savings through improved social wellbeing.
These savings include:$1.98 billion in aged care expenditure per annum through
retirement villages delaying the entry of residents into aged care
services.
A minimum of $177 million saved in health care expenditure every
year as a result of residents requiring fewer hospital and GP visits,
earlier discharge from hospital and better mental health outcomes.
These savings are explained further over the next five pages.
'3�('3�)'3�*'3�+'3�,'3�-'3�.'3�/'3�0'3�
�����
������ �������
����������������"����
�
��!����
���
������"�
����
����"� ������
�������������$������"�
������
�������������
��
���� ����������� ����� ����
�����������
����
����"������
��
�����"�$�������������� � ���
� ����"��������
�����
�����������
����
�����������
���
������
����
�����
7

Retirement village living delays entry into (government funded) aged care facilities
Age appropriate facilities coupled with additional health and wellbeing
services allow retirement village residents to remain in their home for
longer, even if they are living alone. This enables them to delay entry into
residential aged care.
The Australian Institute of Health and Welfare, Patterns in Aged Care
Program Use 2002-03 to 2010-11 report determined that residents in
retirement villages enter aged care on average five years later than those
going from a family home. Grant Thornton analysis taken from Village
Master software9 also identified a five year delay.
79 years
84 years
Average age of entry into aged care.10
Average age of entry from a retirement village into aged care.10
As the annual cost to the federal government of an aged care bed is
$52,049, a five year delay saves $260,000 per person. When this is
applied to the 7,609 residents moving from a retirement village to
aged care in 2013, a total saving to government of $1.98 billion per
annum can be extrapolated.
Table 2: Numbers and related references used in calculation of delay to aged care
Value Number Source
Annual cost of an aged care bed
$52,049 Stewart Brown; Aged Care Financial Performance Survey Report; 2013
Delay in moving to aged care
5 years Australian Institute of Health and Welfare, Patterns in Aged Care Program Use 2002-03 to 2010-11; 2014
IRT, Independence of Senior Australians and the Built Environment: Exploring the Relationship; 2010
Grant Thornton, Case studies conducted on retirement villages; 2014
Residents moving to aged care from a retirement village
7,609 Australian Institute of Health and Welfare (AIHW); Residential Aged Care in Australia 2010–11: A Statistical Overview; 2012
While there has been some research on retirement villages delaying the entry of their residents into aged care, quantitative research on broader impacts and savings to the healthcare system is sparse. However there are logical correlations that can be drawn between the services and supports offered by a retirement village and cost savings to the health care system that allow us to calculate indicative savings to government. The analysis completed estimates that in addition to the $1.98 billion saved through delayed entry to aged care, there is at least $177 million saved through residents requiring fewer hospital and GP visits, earlier discharge from hospital and improved mental health outcomes.
8

Through age appropriate design and provision of additional care, retirement villages reduce the burden on the hospital system through lower admissions
Each year 611,400 seniors are admitted to hospital at an average cost of
$4,800 per admission.
Living in a retirement village reduces the number of hospital admissions
through the facilities and supports offered, as well as the improved
social wellbeing of residents. Compared to the family home, retirement
villages offer a safer environment, as operators are obliged to ensure safety
standards are met.11
As retirement villages are purpose built, age appropriate designs such as
ramps and railings help reduce accidents. In addition to this, the ability
of retirement village staff to offer immediate assistance can reduce the
number of ambulance calls and hospital admissions. The common
problems of social isolation and depression in the general seniors
population are counteracted by the community support offered by the
other village residents.
These factors assist in avoiding the two main factors that lead to
hospitalisation: falls and depression.12
There are 184,000 residents in retirement villages. For every 10 per cent
reduction in hospital visits for these residents the government saves $16.7
million. While further research is needed, if we estimate a reduction of 50
per cent, a saving to government of $83.7 million is achieved.
Table 3: Numbers and related references used in calculation of reduced hospital admissions
Value Number Source
Admissions to hospital for seniors
611,400 ABS; Health Services: Patient Experiences in Australia; 2010
Percentage of the population who live in a retirement village
5.70% Page 5
Nightly cost of a hospital bed
$686.50 Australian Medical Association; List of Medical Services and Fees; 2012
Average nights stayed in hospital of a person over the age of 65
7 AIHW; Hospitalised Injuries in Older Australians:2011-12; 2012
The level of facilities and services offered by retirement villages reduces
the number of hospital admissions.
9

Retirement villages reduce the burden on the hospital system through earlier discharge rates
Retirement village living can reduce the length of stay in hospitals by
providing services that are integral to early discharge.
A major cost to the health system is the inability to discharge seniors
back to a safe and supported environment. Retirement villages assist by
providing services that allow for an early discharge in a supported and
safe environment.
Through conversations with the health sector, Note 1 and our own health
specialists we estimate that a faster discharge of two days on average is
achieved. This is a conservative figure.
There is no delay in returning home as hand railings, non-slip mats and
motion-sensor alarm systems are standard in most villages.
These safety measures are often required by patients returning home.
Retirement village communities often host visits from their local GP. They
also have site-based managers, who can monitor residents after discharge.
This is a vital element in reducing a resident’s length of hospital stay.
Retirement village managers can help organise discharge plans for
residents who have undergone surgery or are in need of further support for
daily activities.
There are approximately 34,850 retirement village residents admitted to
hospital annually, and for each day of earlier discharge, the government
saves $23.9 million.
An average early discharge of two days saves $47.8 million annually.
Value Number Source
Admissions to hospital for seniors over the age of 65
611,400 ABS; Health Services: Patient Experiences in Australia; 2010
Percentage of the population who live in a retirement village
5.70% Page 5
Nightly cost of a hospital bed
$686.50 Australian Medical Association; List of Medical Services and Fees; 2012
Table 4: Numbers and related references used in calculation of early discharge
Note 1: Two days is an estimate provided to us from the discharge department at a major metropolitan hospital.
10

Retirement village living reduces the frequency of visits made by residents to the GP
Seniors often require multiple GP visits, on average six to seven times a
year. While many of these are necessary, there may also be cases in which
a qualified nurse or retirement village staff member are able to assist with
minor health concerns or provide someone to talk to regarding health
and wellbeing. A survey by Grant Thornton indicated that approximately
60 per cent of retirement villages offer some form of medical assistance
on-site.
Chart 5: Average number of GP visits annually by age bracket14
������� �
���
��� ��� ���������������������� � �� �
���
����
�����������������
���
There are approximately 184,000 residents in retirement villages
throughout Australia, the vast majority of whom visit the GP multiple
times throughout the year.
Discussions with the sector suggest that retirement village residents
require fewer GP visits. Each visit costs the government $37. A reduction
of between one and three visits is estimated, with villages that offer
medical assistance on-site having an even greater ability to reduce the
number of GP visits. This results in an annual saving to government of
$15.0 million.
Value Number Source
Cost to the Government for a standard visit to the GP
$37.00 Department of Human Services; Medicare Australia Statistics; 2014
Number of individuals residing in retirement villages in Australia
184,000 Page 5
Percentage of retirement villages that offer on-site medical assistance
60 per cent Grant Thornton Survey; 2014
Table 5: Numbers and related references used in calculation of reduced GP visits
Retirement villages help reduce the number of visits that need to be
made by their residents to the local general practitioner.
11

Living in a retirement village often leads to improved mental health and wellbeing
The high level of social interaction available to residents living in
retirement villages decreases the prevalence of social isolation, which
is one of the major causes of mental illness in Australian seniors.13
Social isolation is estimated to affect 1 in 5 senior Australians13 and is a leading cause of depression.15
Depression is a common mental health condition in people aged 65 and over, with around 10-15 per cent of Australia’s 3.2 million seniors affected nationally.16 It can have a detrimental effect on quality of life and reduce an individual’s ability to manage their health. As a result 16 per cent of mental health services and related activities are used by people over the age of 65.
Retirement villages facilitate and encourage the interaction of their residents within the village community, thus improving the social wellbeing of their residents. The improved mental wellbeing of residents in retirement villages assists in reducing their need for mental health services.
Total spending on mental health services in Australia was $7.2 billion in 2011-12 with $1.15 billion spent on over 65s. The prevalence of depression in Australian seniors is 15 per cent. The McCrindle Baynes Villages Census Report shows that 46 per cent of residents report improved mental wellbeing. A reduction in the number of seniors suffering depression once moving into a retirement village of 46 per cent equals an annual saving to government of $30.5 million.
Value Number Source
Government funding for Mental Health Services (Nationally)
$7.2 billion AIHW; Health Expenditure Australia 2011-12; 2012
Percentage of mental health services and related activities that are attributed to those aged over 65
16 per cent Australian Bureau of Statistics; National Survey of Mental Health and Wellbeing; 2007
Percentage of Australians over the age of 65 that have depression
15 per cent The Royal Australian and New Zealand College of Psychiatrists, Older Australians Deserve a Better Deal in Mental Health; 2010
Number of Australian seniors over the age of 65
3.2 million ABS, National Regional Profile; 2012
Residents in retirement villages
184,000 Page 5
Percentage of residents surveyed that have improved mental health since entering a retirement village
46 per cent McCrindle Research, The McCrindle Baynes Villages Census Report 2013; 2013.
Table 6: Numbers and related references used in calculation of reduced mental health spend
93%of residents surveyed stated that their ‘overall happiness and life satisfaction’ had increased significantly or stayed neutral since moving into the village.4
12

Chart 6: GDP breakdown by state17
In addition to healthcare savings, the retirement village sector directly contributes $2.93 billion to GDP and $176.2 million in tax per annum
$2.93 billioncontributed to Australian Gross Domestic Product annually through construction and operation of retirement villages.17
$176.2millioncontributed in Australian taxation revenue annually.18 This comprises federal company tax, paid at 30 per cent of taxable income, and state payroll tax, paid at different rates across each state and net GST paid by the sector.
7.5%Sector Growth p.a.18
Growth is measured through the annual growth rate in retirement village equity from 2009 to 2012.
$$����%�
"$"�� �"�$��!��
�"%�$�$� ��#�$#��
"�$#!�
� ��������� ���������
�������� �� ������ �������������� �� �����������
������
������������� �����
Chart 7: Net tax breakdown by state18
�!���!!��
� ���#�����#��$%��
����� #�� ��%�#����
���#"���
� ��������� ���������
�������� �� ������ �������������� �� �����������
������
������������������������
�!���!!��
� ���#�����#��$%��
����� #�� ��%�#����
���#"���
� ��������� ���������
�������� �� ������ �������������� �� �����������
������
������������������������
13

����� ����� ���� ����� ����� ����� ����� �����
Chart 8: Australian seniors population growth7
Australia
$2.93 billioncontributed to Australian Gross Domestic Product annually through construction and operation of retirement villages.17
$176.2millioncontributed in Australian taxation revenue annually.18 This comprises federal company tax, paid at 30 per cent of taxable income, state payroll tax paid at different rates across each state, and net GST paid by the sector.
savings to the health care and aged care systems annually.20
Table 7: Residents and dwellings in Australia3
$2.16billion
��
�������
����������
���������
����������
�������� �������� ���������� ���������� ���������� ���������� �� ���� �� ���� ��
National Growth Rate ����� ����� ���� ����� ����� ����� ����� �����
Pop
ulat
ion
Penetration rate of over 65s in retirement villages
Number of residents in retirement villages
Number of dwellings
5.7% 184,080 141,600
Table 8: Not for profit breakdown in Australia3
Percentage of not for profit retirement villages across
the country
Not for profit sites For profit sites Total sites
40.1% 912 1,360 2,272
����������
�������
����������
���������
����������
�������� �������� ���������� ���������� ���������� ���������� �� ���� �� ���� ��
14
��
��������
��������
�������
�������
��������
��������
�������������������������������������������� ���� ���� ���� ������������� ��������
State Annual Growth Rate ��� � ��� � �� � ��� � ��� � ��� � ��� � �� �
National Annual Growth Rate ��� � ��� � �� � ��� � ��� � ��� � ��� � ��� �
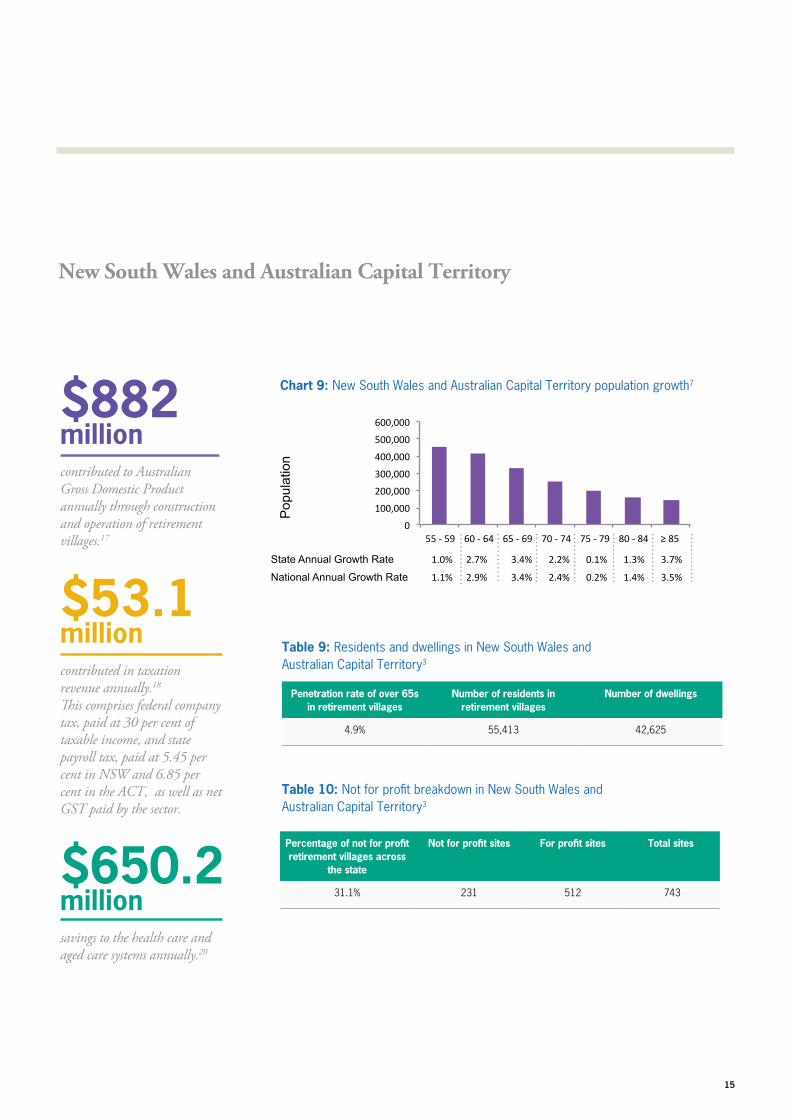
Chart 9: New South Wales and Australian Capital Territory population growth7
New South Wales and Australian Capital Territory
$882 millioncontributed to Australian Gross Domestic Product annually through construction and operation of retirement villages.17
$53.1millioncontributed in taxation revenue annually.18 This comprises federal company tax, paid at 30 per cent of taxable income, and state payroll tax, paid at 5.45 per cent in NSW and 6.85 per cent in the ACT, as well as net GST paid by the sector.
savings to the health care and aged care systems annually.20
Table 9: Residents and dwellings in New South Wales and Australian Capital Territory3
$650.2million
Pop
ulat
ion
Penetration rate of over 65s in retirement villages
Number of residents in retirement villages
Number of dwellings
4.9% 55,413 42,625
Table 10: Not for profit breakdown in New South Wales and Australian Capital Territory3
Percentage of not for profit retirement villages across
the state
Not for profit sites For profit sites Total sites
31.1% 231 512 743
������������
��������
��������
�������
�������
��������
��������
�������������������������������������������� ���� ���� ���� ������������� ��������
��� � ��� � �� � ��� � ��� � ��� � ��� � �� �
��� � ��� � �� � ��� � ��� � ��� � ��� � ��� �
15

����� ����� ����� ���� ����� ��� �� ����� ���
����� ����� ����� ��� ���� ����� ���� ����
Chart 10: Victorian population growth7
Victoria
$686.1 millioncontributed to Australian Gross Domestic Product annually through construction and operation of retirement villages.17
$41.3millioncontributed in taxation revenue annually.18 This comprises federal company tax, paid at 30 per cent of taxable income, and state payroll tax, paid at 4.85 per cent and net GST paid by the sector.
savings to the health care and aged care systems annually.20
Table 11: Residents and dwellings in Victoria3
$505.8million
Pop
ulat
ion
Penetration rate of over 65s in retirement villages
Number of residents in retirement villages
Number of dwellings
5.3% 43,107 33,159
Table 12: Not for profit breakdown in Victoria3
Percentage of not for profit retirement villages across
the state
Not for profit sites For profit sites Total sites
27.3% 119 317 436
��
��������
��������
�������
�������
����������� ������������ ����������� ������������ �� ����� �� �� ����� ��� ����������� �������
State Growth Rate ����� ����� ����� ���� ����� ��� �� ����� ���
National Growth Rate ����� ����� ����� ��� ���� ����� ���� ����
�������������
��������
��������
�������
�������
����������� ������������ ����������� ������������ �� ����� �� �� ����� ��� ����������� �������
16

State Annual Growth Rate ���� ����� ����� ����� ����� ����� ���� �����
National Annual Growth Rate ���� ����� ����� ����� ����� ����� ����� ����
Chart 11: Queensland population growth7
Queensland
$618.3 millioncontributed to Australian Gross Domestic Product annually through construction and operation of retirement villages.17
$37.2millioncontributed in taxation revenue annually.18 This comprises federal company tax, paid at 30 per cent of taxable income, and state payroll tax, paid at 4.75 per cent and net GST paid by the sector.
savings to the health care and aged care systems annually.20
Table 13: Residents and dwellings in Queensland3
$455.8million
Pop
ulat
ion
Penetration rate of over 65s in retirement villages
Number of residents in retirement villages
Number of dwellings
6.4% 38,842 29,878
Table 14: Not for profit breakdown in Queensland3
Percentage of not for profit retirement villages across
the state
Not for profit sites For profit sites Total sites
37.6% 136 225 361
State Annual Growth Rate
���������
����������������������������������������������
�������������������������������������������� ���� ���� ���� ������������� ���������
�����������������������������������������������������
�������������������������������������������� ���� ���� ���� ������������� �������
���� ����� ����� ����� ����� ����� ���� �����
���� ����� ����� ����� ����� ����� ����� ����
17

Chart 12: South Australian population growth7
South Australia
$369.8 millioncontributed to Australian Gross Domestic Product annually through construction and operation of retirement villages.17
$22.2millioncontributed in taxation revenue annually.18 This comprises federal company tax, paid at 30 per cent of taxable income, and state payroll tax, paid at 4.95 per cent and net GST paid by the sector.
savings to the health care and aged care systems annually.20
Table 14: Residents and dwellings in South Australia3
$272.6million
Pop
ulat
ion
Penetration rate of over 65s in retirement villages
Number of residents in retirement villages
Number of dwellings
8.6% 23,236 17,874
Table 15: Not for profit breakdown in South Australia3
Percentage of not for profit retirement villages across the state
Not for profit sites For profit sites Total sites
69.1% 282 129 411
Pop
ulat
ion
��
�������
������
�������
������
��������
��������
���������������������������������������������������������� ���� �� ��� ��
State Annual Growth Rate ����� ����� ����� ���� ����� ��� �� ����� ���
National Annual Growth Rate ����� ����� ����� ��� ���� ����� ���� ����
����������
�������
������
�������
������
��������
��������
���������������������������������������������������������� ���� �� ��� ��
����� ����� ����� ���� ����� ��� �� ����� ���
����� ����� ����� ��� ���� ����� ���� ����
18
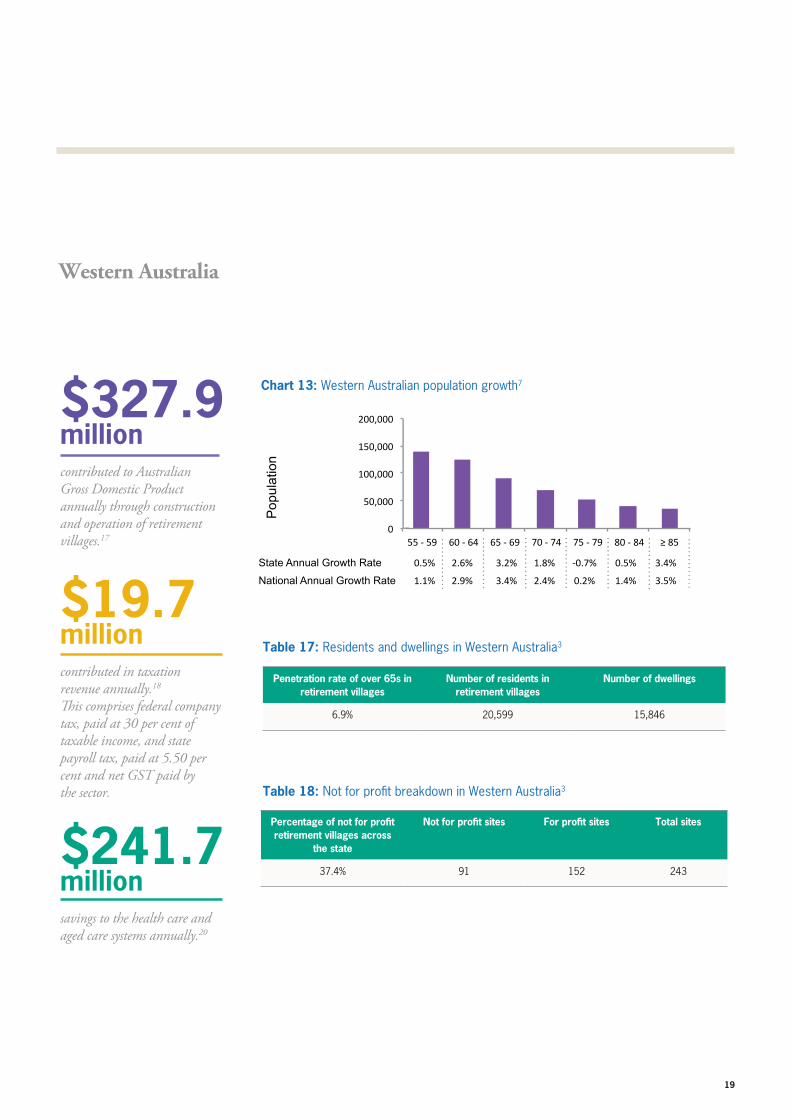
Chart 13: Western Australian population growth7
Western Australia
$327.9 millioncontributed to Australian Gross Domestic Product annually through construction and operation of retirement villages.17
$19.7millioncontributed in taxation revenue annually.18
This comprises federal company tax, paid at 30 per cent of taxable income, and state payroll tax, paid at 5.50 per cent and net GST paid by the sector.
savings to the health care and aged care systems annually.20
Table 17: Residents and dwellings in Western Australia3
$241.7million
Pop
ulat
ion
Penetration rate of over 65s in retirement villages
Number of residents in retirement villages
Number of dwellings
6.9% 20,599 15,846
Table 18: Not for profit breakdown in Western Australia3
Percentage of not for profit retirement villages across
the state
Not for profit sites For profit sites Total sites
37.4% 91 152 243
��
������
��������
�������
��������
�������� �������� ���������� ���������� ���������� ���������� �� ���� �� ��� ��
State Annual Growth Rate ����� ����� ����� ���� ����� ��� �� ����� ���
National Annual Growth Rate ����� ����� ����� ��� ���� ����� ���� ����
����������
������
��������
�������
��������
�������� �������� ���������� ���������� ���������� ���������� �� ���� �� ��� ��
����� ����� ����� ���� ����� ��� �� ����� ���
����� ����� ����� ��� ���� ����� ���� ����
19

����� ����� ����� ���� ����� ��� �� ����� ���
����� ����� ����� ��� ���� ����� ���� ����
Chart 14: Tasmanian population growth7
Tasmania
$46.9 millioncontributed to Australian Gross Domestic Product annually through construction and operation of retirement villages.17
$2.8millioncontributed in taxation revenue annually.18
This comprises federal company tax, paid at 30 per cent of taxable income, and state payroll tax, paid at 6.10 per cent and net GST paid by the sector.
savings to the health care and aged care systems annually.20
Table 19: Residents and dwellings in Tasmania3
$33.8million
Pop
ulat
ion
Penetration rate of over 65s in retirement villages
Number of residents in retirement villages
Number of dwellings
3.4% 2,883 2,218
Table 20: Not for profit breakdown in Tasmania3
Percentage of not for profit retirement villages across the
state
Not for profit sites For profit sites Total sites
67.9% 53 25 78
��������
����������������������������������������������
���������� ����������� ���������� ����������� �� ���� �� �� ���� ��� ���������� �������
State Annual Growth Rate ����� ����� ����� ���� ����� ��� �� ����� ���
National Annual Growth Rate ����� ����� ����� ��� ���� ����� ���� ����
����� ����� ���� ����� ��� �� ����� ���
������������
����������������������������������������������������
���������� ����������� ���������� ����������� �� ���� �� �� ���� ��� ���������� �������
20

Conclusion
Retirement villages provide a supportive accommodation option for the increasing number of Australian seniors.
Many senior Australians choose
retirement villages because villages offer
age appropriate supports in a community
environment.
High growth is forecast for the population
of seniors in Australia and this will drive
growth in demand for age appropriate
accommodation options, including
retirement villages.
There will be approximately 382,000
seniors seeking a place in a retirement
village in 2025.3 This is more than double
the number of residents currently calling
a retirement village home. As such, a large
amount of investment will be needed in the
sector in coming years.
The self funded services and supports that retirement villages offer generate savings to health and aged care budgets.
$2.16 billion is potentially saved by
governments across Australia annually.
These savings include:
$1.98 billion in aged care expenditure
every year through retirement villages
delaying the entry of residents into
residential aged care.
$177 million saved in health care
expenditure every year as a result of
residents requiring fewer hospital and GP
visits, earlier discharge from hospital and
improved mental health.
Retirement villages contribute to the Australian economy through increasing national GDP and tax.
$2.93 billion was contributed to
Australian Gross Domestic Product
annually through construction and
operation of retirement villages.17
$176.2 million contributed in Australian
taxation revenue annually.18
This comprises federal company tax,
paid at 30% of taxable income, and state
payroll tax, paid at different rates across
each state, and net GST paid by the
sector.
21

Endnotes
1. Productivity Commission, Caring for Older Australians Final Inquiry Report, Canberra, 2011.
2. Australian Ageing Agenda, Loneliness leading concern for older people, 2013.
3. Grant Thornton, Analysis completed for this report, Melbourne, 2014.
4. McCrindle Research and Villages.com.au, The McCrindle Baynes Villages Census Report 2013, Bella Vista, 2013.
5. Grant Thornton, Analysis completed for this report; 2014
LANDATA, data purchased for this report; 2014
6. Treasury, Australia to 2050: future challenges, 2010
7. ABS, National Regional Profile, July 2014
8. Grant Thornton, Retirement Village Association Australia, Retirement Industry – Industry Trends & Prospects, 2011
Grant Thornton, Survey of retirement villages, 2014.
9. TotalPlan, Village Master reporting software, 2014.
10. Australian Institute of Health and Welfare Patterns in aged care program use 2002-03 to 2010-11; 2014
11. ACT Government, The Retirement Village Handbook, Canberra, 2014.
12. Biderman, A., Cwikel, J., Fried, A., and Galinsky, D., Depression and falls among community dwelling elderly people: a search for
common risk factors, J Epidemiol Community Health, Israel, 2002.
13. The University of Adelaide, The Impact of Social Isolation on Older Australians, Adelaide, 2011.
14. Department of Human Services; Medicare Australia Statistics; 2014
15. Stephen Ilardi, Social Isolation: A Modern Plague, Sussex, 2009.
16. The Royal Australian and New Zealand College of Psychiatrists, Older Australians Deserve a Better Deal in Mental Health - August
2010, Melbourne, 2010.
17. KPMG, Economic Contribution of Australian Retirement Villages, Australia, 2011. –NOTE: 1. Report stated that the retirement village
sector contributed 0.2% to Australian GDP. This has percentage has been applied to current GDP to get the figure stated. 2. Northern
Territory has only a very small number of retirement villages (approx..3) so is not included in this analysis. 3. State breakdowns are
calculated pro rata to the number of retirement village residents in that state.
18. ATO, Taxation statistics 2008-09, Canberra, 2011.
ATO, Taxation statistics 2009-10, Canberra, 2012.
ATO, Taxation statistics 2010-11, Canberra, 2013.
ATO, Taxation statistics 2011-12, Canberra, 2014. NOTE: 1. State breakdowns are calculated pro rata to the number of retirement
village residents in that state.
FKP, Annual Report, 2013
Stockland, Financial Report, 2013
Lend Lease, Annual Report, 2013
19. ABS, Population Projections- Australia 2006 to 2101-Series A; 2008
20. Grant Thornton, Analysis completed on savings generated by retirement villages; 2014 - NOTE: State breakdowns are calculated pro rata
to the number of retirement village residents in that state.
alalalalalalalalalalalcucucucucucucucuculalalalalalalalalalalalateteteteteteteteteteteteteted d d d d d d d d prprprprprprprprprprproooooooo r r r ratatatatatatatatatatata a a a a a a a a a a
22

www.grantthornton.com.au
Grant Thornton Australia Limited ABN 41 127 556 389
‘Grant Thornton’ refers to the brand under which the Grant Thornton member firms provide assurance, tax and advisory services to their clients and/or refers to one or more member firms, as the context requires. Grant Thornton Australia Ltd is a member firm of Grant Thornton International Ltd (GTIL). GTIL and the member firms are not a worldwide partnership. GTIL and each member firm is a separate legal entity. Services are delivered by the member firms. GTIL does not provide services to clients. GTIL and its member firms are not agents of, and do not obligate one another and are not liable for one another’s acts or omissions. In the Australian context only, the use of the term ‘Grant Thornton’ may refer to Grant Thornton Australia Limited ABN 41 127 556 389 and its Australian subsidiaries and related entities. GTIL is not an Australian related entity to Grant Thornton Australia Limited.
Liability limited by a scheme approved under Professional Standards Legislation. Liability is limited in those States where a current scheme applies.