PROJECT REPORT A STUDY ON WORKING CAPITAL...
91
PROJECT REPORT A STUDY ON WORKING CAPITAL MANAGEMENT AT HERO MOTOCORP LTD. AMBICA MOTORS, GUJARAT. SUBMITTED BY PATEL CHARMIBEN VIMALBHAI 15P35H0256 UNDER THE GUIDANCE OF Ms. RICHA PATHAK ASSISTANT PROFESSOR, DEPARTMENT OF MANAGEMENT STUDIES NEW HORIZON COLLEGE MASTER OF BUSINESS ADMINISTRATION BHARATHIAR UNIVERSITY COLLEGE CODE: KA 11 B 131 2015-2017
Transcript of PROJECT REPORT A STUDY ON WORKING CAPITAL...

PROJECT REPORT
A STUDY ON WORKING CAPITAL MANAGEMENT AT HERO
MOTOCORP LTD. AMBICA MOTORS, GUJARAT.
SUBMITTED BY
PATEL CHARMIBEN VIMALBHAI
15P35H0256
UNDER THE GUIDANCE OF
Ms. RICHA PATHAK
ASSISTANT PROFESSOR,
DEPARTMENT OF MANAGEMENT STUDIES
NEW HORIZON COLLEGE
MASTER OF BUSINESS ADMINISTRATION
BHARATHIAR UNIVERSITY
COLLEGE CODE: KA 11 B 131
2015-2017

STUDENT’S DECLARATION
I hereby declare that this project entitled “A STUDY ON WORKING
CAPITAL MANAGEMENT AT HERO MOTOCORP, AMBICA
MOTORS” was prepared by me during the year 2016-17 and was submitted in
partial fulfillment of the requirements for Master Degree in Business
Management of Bharathiar University.
I also declare that this project report is original and genuine and has not
been submitted to any other university of the award of any degree, diploma or
other similar titles or purposes.
Date: Patel CharmibenVimalbhai
Bangalore 15P35H0256

COMPANY CERTIFICATE
To whom so ever it may concern
This is certify that Patel Charmiben Vimalbhai bearing registration
number 15P35H0256 of 3rd
semester MBA Bharathiar University, New Horizon
college, Bangalore has successfully carried out her project work on “A STUDY
ON WORKING CAPITAL MANAGEMENT AT HERO MOTOCORP,
AMBICA MOTORS”, during from 30th
June 2016 to 30th July 2016
We are satisfied with the project report and appreciate the commitment
towards the project preparations.
We wish all the best in the future.
Signature
Date:

GUIDE CERTIFICATE
This is to certify that the project report entitled “A STUDY ON
WORKING CAPITAL MANAGEMENT” submitted by Patel Charmiben
Vimalbhai bearing registration number 15P35H0256 to Bharathiar University
for the partial fulfillment of Master Degree in Business Management is an
outcome of genuine research work carried under my guidance and it has not
been submitted for the award of any other degree, diploma or prize.
Date: Ms. RICHA PATHAK
Bangalore Assistant Professor

HOD CERTIFICATE
This is to certify that Patel Charmiben Vimalbhai bearing registration
number 15P35H0256 is a bonafide student of this college. The project work
entitled “A STUDY ON WORKING CAPITAL MANAGEMENT” is a work
carried out by her for partial fulfillment of the requirements for Master Degree
in Business Management of Bharathiar University during the year 2016-2017. It
is certified that all corrections/suggestions have been incorporated in the project
report and a copy is deposited in the department library. This project work has
been approved as it satisfied the academic requirement of Master Degree in
Business Management.
Date: Dr. SHEELAN MISRA
Bangalore

PRINCIPAL’S CERTIFICATE
This is to certify that Patel Charmiben Vimalbhai bearing registration
number 15P35H0256 is a bonafide student of this college. The project work
entitled “A STUDY ON WORKING CAPITAL MANAGEMENT” is a work
carried out by her for partial fulfillment of the requirements for Master Degree
in Business Management of Bharathiar University during the year 2016-2017.
Date: Dr. R. BODHISATVAN
Bangalore
ACKNOWLEDGEMENT
While presenting the report of my project, I have great pleasure in
acknowledging the help rendered and guidance to me by various people during
the course of my project.
I would like to express my sincere thanks to my project external guide
Mr. Aashish kumar, Mr. Varunbhai (Financial manager) and Mr. Hemant
Patel manager of AMBICA MOTORS for providing me permission, guidance
and cooperation during the study period.
I would like to express my sincere thanks and gratitude to Ms. Richa
Pathak New Horizon College, Bangalore, for her excellent guidance and
support throughout this project work.
I would like to express my gratitude to all those who gave me the
possibilities to complete this report. I would like thank Dr. R.Bodhisatvan,
Principal and Dr.Sheelan Misra, HOD, NEW HORIZON COLLEGE.
Finally, I wish to thanks my family, friends, faculty members and all
others who have helped me in completing this project work successfully.
I thanks to all above the almighty for my successful completion of this
project.

CONTENTS
CHAPTER CONTENTS PAGE NO
EXECUTIVE SUMMARY
1 INTRODUCTION 1 - 21
1.1 DEFINITIONS 2 - 3
1.2 CLASSIFICATION OF WORKING
CAPITAL 4 - 6
1.3 DETERMINANTS OF WORKING
CAPITAL 6 -13
1.4 RATIO ANALYSIS 14 - 21
2 INDUSTRY AND COMPANY PROFILE 22 - 39
2.1 INDUSRTY PROFILE 22 - 30
2.2 COMPANY PROFILE 30 - 39
3 RESEARCH DESIGN 40 - 43
3.1 RESEARCH DESIGN 40
3.2 STATEMENT OF PROBLEM 40
3.3 SCOPE OF THE STUDY 41
3.4 METHODOLOGY OF THE STUDY 41
3.5 OBJECTIVES OF STUDY 41
3.6 SOURCES OF DATA 42
3.7 TOOLS OF ANALYSIS 42
3.8 LIMITATIONS OF THE STUDY 43
4
ANALYSIS AND INTERPRETATION OF
DATA 44 - 68
4.1 STATEMENT OF CHANGES IN
WORKING CAPITAL 44 - 47
4.2 RATIO ANALYSIS 48 - 68
5
FINDINGS, CONCLUSION AND
SUGGESTIONS 69 - 72
5.1 FINDINGS 69 - 70
5.2 CONCLUSION 71
5.3 SUGGESTIONS 72
BIBLIOGRAPHY
ANNEXURE

LIST OF TABLES
TABLES No. PARTICULARS PAGE No.
4.1
Calculation of statement of change in
working capital for the year 2013-14 45
4.2
Calculation of statement of change in
working capital for the year 2014-15 46
4.3
Calculation of statement of change in
working capital for the year 2015-16 47
4.4 Calculation of current ratio 49
4.5 Calculation of liquid or quick ratio 51
4.6 Calculation of absolute liquid ratio 53
4.7 Calculation of gross profit ratio 55
4.8 Calculation of operating profit ratio 57
4.9 Calculation of net profit ratio 59
4.10 Calculation of inventory turnover ratio 61
4.11 Calculation of fixed assets turnover ratio 63
4.12 Calculation of current assets turnover ratio 65
4.13 Calculation of working capital turnover ratio 67
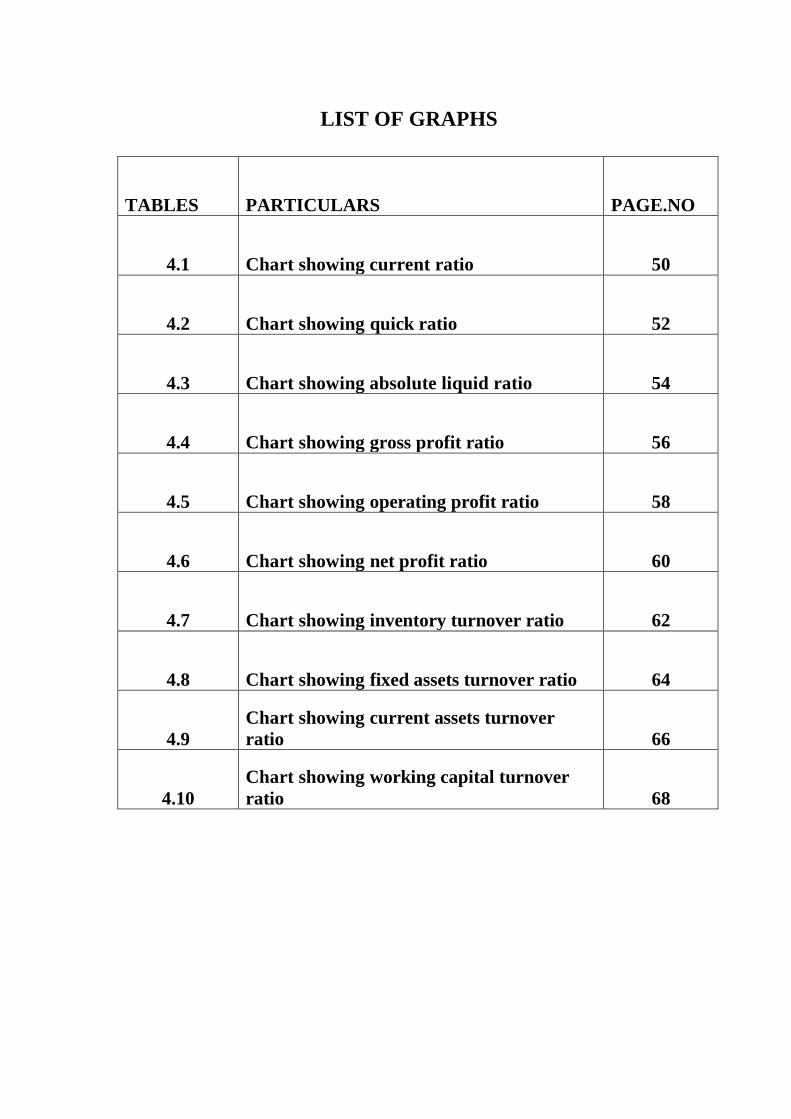
LIST OF GRAPHS
TABLES PARTICULARS PAGE.NO
4.1 Chart showing current ratio 50
4.2 Chart showing quick ratio 52
4.3 Chart showing absolute liquid ratio 54
4.4 Chart showing gross profit ratio 56
4.5 Chart showing operating profit ratio 58
4.6 Chart showing net profit ratio 60
4.7 Chart showing inventory turnover ratio 62
4.8 Chart showing fixed assets turnover ratio 64
4.9
Chart showing current assets turnover
ratio 66
4.10
Chart showing working capital turnover
ratio 68

EXECUTIVE SUMMARY
This is a study conducted to focus on the short term financial
management or working capital management. Working capital refers to that part
of the firm’s capital which required for financing short term or current asset.
Adequate amount of working capital is required by the firm in the form of
different activities to continue uninterrupted and to tackle problems that may
arise. Financial viability structure and utilization of working capital in the
company is analyzed for three years from 2013-2016
The study is mainly based on the secondary data. Ratios and statement of
changes in working capital are the tools used for the study. The interpretations
are summarized and suggestions are provided based on it.

CHAPTER 1
INTRODUCTION

CHAPTER 2
INDUSTRY AND COMPANY PROFILE

CHAPTER 3
RESEARCH DESIGN
CHAPTER 4
ANALYSIS AND INTERPRETATION OF
DATA

CHAPTER 5
FINDINGS, SUGGESTIONS & CONCLUSION

BIBLIOGRAPHY

ANNEXURE

Working capital management
New Horizon College
1
1. INTRODUCTION
Working capital management refers to a company's managerial
accounting strategy designed to monitor and utilize the two components of
working capital, current assets and current liabilities, to ensure the most
financially efficient operation of the company. The primary purpose of working
capital management is to make sure the company always maintains sufficient
cash flow to meet its short-term operating costs and short-term debt obligations.
Working capital management is concerned with the problems that arise in
attempting to manage the current assets, the current liabilities and the
interrelationship that exists between them. The term current assets refer to those
assets which in the ordinary course of business can be, or will be, converted in
to cash within one year without undergoing a diminution in value and without
disrupting the operation of the firm.
The goal of working capital management is to ensure that a firm is able to
continue its operations and that it has sufficient ability to satisfy both maturing
short-term debt and upcoming operational expenses. The management of
working capital involves managing inventories, accounts receivable and
payable, and cash. The excess of ‗current assets‘ of a business organization over
its ‗current liabilities‘ is termed as the ‗working capital‘ of that organization.
The major current assets are cash, marketable security, account receivable
and inventory. Current liabilities are those liabilities which are intended, at their
inception, too be paid in the ordinary course of business, within a year, out of
the current assets or earning of the concern. The basic current liabilities are
account payable, bills payable, bank overdraft and outstanding expenses.

Working capital management
New Horizon College
2
1.1 DEFINITIONS
The term working capital is commonly used for the capital required for
day-to-day working in a business concern, such as for purchasing raw material,
for meeting day-to-day expenditure on salaries, wages, rents rates, advertising
etc. But there is much disagreement among various financial authorities
(Financiers, accountants, businessmen and economists) as to the exact meaning
of the term working capital.
Working capital is defined as, ―the excess of current assets over current
liabilities and provisions‖.
In the Annual Survey of Industries (1961), working capital is defined to include,
―Stocks of materials, fuels, semi-finished goods including work-in-progress and
finished goods and by-products; cash in hand and bank and the algebraic sum of
sundry creditors as represented by,
(a) outstanding factory payments e.g. rent, wages, interest and dividend;
(b) purchase of goods and services;
(c) short-term loans and advances and sundry debtors comprising amounts due
to the factory on account of sale of goods and services and advances towards tax
payments‖.
In the words of shubin, "working capital is the amount of funds necessary to
cover the cost of operating the enterprise."
According to Ganestenberg, "circulating capital means current assets of a
company that are changed in the ordinary course of business from one form to
another, as for example from cash to inventories, inventories to receivables,
receivables to cash."
Working capital management
New Horizon College
3
Working capital has been described as the ―life blood of any business which is a
applicable because it constitutes a cyclically flowing stream through the
business‖.
CALCULATION OF WORKING CAPITAL
The net working capital formula is calculated by subtracting the current
liabilities from the current assets. Here is what the basic equation looks like:
Net working capital = current assets - current liabilities n nb n
Typical current assets that are included in the net working capital
calculation are cash, accounts receivable, inventory, and short-term investments.
The current liabilities section typically includes accounts payable, accrued
expenses and taxes, customer deposits, and other trade debt.
A positive net working capital is better than a negative one. A positive
calculation shows creditors and investors that the company is able to generate
enough from operations to pay for its current obligations with current assets.
A negative net working capital, on the other hand, shows creditors and
investors that the operations of the business aren‘t producing enough to support
the business‘ current debts.

Working capital management
New Horizon College
4
1.2 CLASSIFICATION OF WORKING CAPITAL
Working Capital may be classified in two ways,
a) Concept based working capital
b) Time based working capital
Concepts based working capital
1. Gross Working Capital: It refers to the firm‘s investment in total current or
circulating assets.
2. Net Working Capital: The term ―Net Working Capital‖ has been defined in
two different ways:
1) It is the excess of current assets over current liabilities. This is, as a matter of
fact, the most commonly accepted definition. Some people define it as only
the difference between current assets and current liabilities.
2) Alternate definition of net working capital is that portion of a firm‘s current
assets which is financed by long-term funds.
Time based working capital
Permanent Working Capital:
This refers to that minimum amount of investment in all current assets
which is required at all times to carry out minimum level of business activities.
In other words, it represents the current assets required on a continuing basis
over the entire year.

Working capital management
New Horizon College
5
Temporary Working Capital:
The amount of such working capital keeps on fluctuating from time to
time on the basis of business activities. In other words, it represents additional
current assets required at different times during the operating year.
For example, extra inventory has to be maintained to support sales during peak
sales period. Similarly, receivable also increase and must be financed during
period of high sales. On the other hand, investment in inventories, receivables,
etc., will decrease in periods of depression.
NEEDS FOR WORKING CAPITAL
Working capital is needed till a firm gets cash on sale of finished
products. It depends on two factors:
1. Manufacturing cycle i.e. time required for converting the raw material into
finished product.
2 Credit policy i.e. credit period given to Customers and credit period
allowed by creditors.
Thus, the sum total of these times is called an ―Operating cycle‖ and it consists
of the following six steps:
a. Conversion of cash into raw materials.
b. Conversion of raw materials into work-in-process.
c. Conversion of work-in-process into finished products.
d. Time for sale of finished goods—cash sales and credit sales.
e. Time for realization from debtors and Bills receivables into cash.
f. Credit period allowed by creditors for credit purchase of raw materials,
inventory and creditors for wages and overheads.

Working capital management
New Horizon College
6
Debtors & Bills
Receivables
cash
raw materials
work- in- progress
finished product
Sales
Chart for operating cycle or working capital cycle.
1.3 DETERMINANTS OF WORKING CAPITAL
The factors influencing the working capital decisions of a firm may be
classified as two groups, such as
I. Internal factors
II. External factors
The internal factors include
1. Nature of business size of business,
2. Firm‘s product policy
3. Firm‘s credit policy
Working capital management
New Horizon College
7
4. Availability of credit
5. Growth and expansion of business
6. Profit margin and dividend policy
7. Operating efficiency of the firm
8. Co-ordinating activities in firm
The external factors include
1. Business fluctuations,
2. Changes in the technology,
3. Infrastructural facilities,
4. Import policy and
5. The taxation policy etc.
These factors are discussed in brief in the following lines.
I. INTERNAL FACTORS
1. Nature and size of the business
The working capital requirements of a firm are basically influenced by
the nature and size of the business. Size may be measured in terms of the scale
of operations. A firm with larger scale of operations will need more working
capital than a small firm. Similarly, the nature of the business - influence the
working capital decisions. Trading and financial firms have less investment in
fixed assets. But require a large sum of money to be invested in working capital.
Retail stores, business units require larger amount of working capital, where as ,
public utilities need less working capital and more funds to invest in fixed
assets.

Working capital management
New Horizon College
8
2. Firm’s production policy
The firm‘s production policy (manufacturing cycle) is an important factor
to decide the working capital requirement of a firm. The production cycle starts
with the purchase and use of raw material and completes with the production of
finished goods. On the other hand, production policy is uniform production
policy or seasonal production policy etc., also influences the working capital
decisions. Larger the manufacturing cycle and uniform production policy –
larger will be the requirement of working capital. The working capital
requirement will be higher with varying production schedules in accordance
with the changing demand.
3. Firm’s credit policy
The credit policy of a firm influences credit policy of working capital. A
firm following liberal credit policy to all customers require funds. On the other
hand, the firm adopting strict credit policy and grant credit facilities to few
potential customers will require less amount of working capital.
4. Availability of credit
The working capital requirements of a firm are also affected by credit
terms granted by its suppliers – i.e. creditors. A firm will need less working
capital if liberal credit terms are available to it. Similarly, the availability of
credit from banks also influences the working capital needs of the firm. A firm,
which can get bank credit easily on favorable conditions will be operated with
less working capital than a firm without such a facility.
5. Growth and expansion of business
Working capital requirement of a business firm tend to increase in
correspondence with growth in sales volume and fixed assets. A growing firm
may need funds to invest in fixed assets in order to sustain its growing
Working capital management
New Horizon College
9
production and sales. This will, in turn, increase investment in current assets to
support increased scale of operations. Thus, a growing firm needs additional
funds continuously.
6. Profit margin and dividend policy
The magnitude of working capital in a firm is dependent upon its profit
margin and dividend policy. A high net profit margin contributes towards the
working capital pool. To the extent the net profit has been earned in cash, it
becomes a source of working capital. This depends upon the dividend policy of
the firm. Distribution of high proportion of profits in the form of cash dividends
results in a drain on cash resources and thus reduces company‘s working capital
to that extent. The working capital position of the firm is strengthened if the
management follows conservative dividend policy and vice versa.
7. Operating efficiency of the firm
Operating efficiency means the optimum utilisation of a firm‘s resources
at minimum cost. If a firm successfully controls operating cost, it will be able to
improve net profit margin which, will, in turn, release greater funds for working
capital purposes.
8. Co-ordinating activities in firm
The working capital requirements of a firm is depend upon the co-
ordination between production and distribution activities. The greater and
effective the co-ordinations, the pressure on the working capital will be
minimized. In the absence of co-ordination, demand for working capital is
reduced.
Working capital management
New Horizon College
10
II. EXTERNAL FACTORS
1. Business fluctuations
Most firms experience fluctuations in demand for their products and
services. These business variations affect the working capital requirements.
When there is an upward swing in the economy, sales will increase,
correspondingly, the firm‘s investment in inventories and book debts will also
increase. Under boom, additional investment in fixed assets may be made by
some firms to increase their productive capacity. This act of the firm will
require additional funds. On the other hand when, there is a decline in economy,
sales will come down and consequently the conditions, the firm try to reduce
their short-term borrowings. Similarly the seasonal fluctuations may also affect
the requirement of working capital of a firm.
2. Changes in the technology
The technological changes and developments in the area of production
can have immediate effects on the need for working capital. If the firm wish to
install a new machine in the place of old system, the new system can utilise less
expensive raw materials, the inventory needs may be reduced there by working
capital needs.
3. Import policy
Import policy of the Government may also effect the levels of working
capital of a firm since they have to arrange funds for importing goods at
specified times.
4. Infrastructural facilities
The firms may require additional funds to maintain the levels of inventory
and other current assets, when there is good infrastructural facilities in the
company like, transportation and communications.

Working capital management
New Horizon College
11
5. Taxation policy
The tax policies of the Government will influence the working capital
decisions. If the Government follow regressive taxation policy, i.e. imposing
heavy tax burdens on business firms, they are left with very little profits for
distribution and retention purpose. Consequently, the firm has to borrow
additional funds to meet their increased working capital needs. When there is a
liberalised tax policy, the pressure on working capital requirement is minimised.
IMPORTANCE OR ADVANTAGES OF ADEQUATE
WORKING CAPITAL
Working capital is the life blood of a business. Just as circulation of blood
is essential in the human body for maintaining life, working capital is very
essential to maintain the smooth running of a business. No business can run
successfully without an adequate amount of working capital. The main
advantages of maintaining adequate amount of working capital are as follows:
1. Solvency of the business:
Adequate working capital helps in maintaining solvency of the business
by providing uninterrupted flow of production.
2. Goodwill:
Sufficient working capital enables a business concern to make prompt
payments and hence helps in creating and maintaining goodwill.
3. Easy loans:
A concern having adequate working capital, high solvency and good
credit standing can arrange loans from banks and other on easy and favourable
terms.

Working capital management
New Horizon College
12
4. Cash Discounts:
Adequate working capital also enables a concern to avail cash discounts
on the purchases and hence it reduces costs.
5. Regular supply of raw materials:
Sufficient working capital ensures regular supply of raw materials and
continuous production.
6. Regular payment of salaries, wages and other day-to-day commitments:
A company which has ample working capital can make regular payment
of salaries, wages and other day-to-day commitments which raises the morale of
its employees, increases their efficiency, reduces wastages and costs and
enhances production and profits.
7. Exploitation of favorable market conditions:
Only concerns with adequate working capital can exploit favourable
market conditions such as purchasing its requirements in bulk when the prices
are lower and by holding its inventories for higher prices.
8. Ability to face Crisis:
Adequate working capital enables a concern to face business crisis in
emergencies such as depression because during such periods, generally, there is
much pressure on working capital.
9. Quick and Regular return on Investments:
Every Investor wants a quick and regular return on his investments.
Sufficiency of working capital enables a concern to pay quick and regular
dividends to its investors as there may not be much pressure to plough back
profits. This gains the confidence of its investors and creates a favourable
market to raise additional funds i.e., the future.
Working capital management
New Horizon College
13
10. High morale:
Adequacy of working capital creates an environment of security,
confidence, high morale and creates overall efficiency in a business.
EXCESS OR INADEQUATE WORKING CAPITAL
Every business concern should have adequate working capital to run its
business operations. It should have neither redundant or excess working capital
nor inadequate or shortage of working capital. Both excess as well as short
working capital positions are bad for any business. However, out of the two, it is
the inadequacy of working capital which is more dangerous from the point of
view of the firm.
DISADVANTAGES OF INADEQUATE WORKING CAPITAL
1. A concern which has inadequate working capital cannot pay its short-term
liabilities in time. Thus, it will lose its reputation and shall not be able to get
good credit facilities.
2. It cannot buy its requirements in bulk and cannot avail of discounts, etc.
3. It becomes difficult for the firm to exploit favourable market conditions and
undertake profitable projects due to lack of working capital.
4. The firm cannot pay day-to-day expenses of its operations and its creates
inefficiencies, increases costs and reduces the profits of the business.
5. It becomes impossible to utilize efficiently the fixed assets due to non-
availability of liquid funds.
6. The rate of return on investments also falls with the shortage of working
capital.

Working capital management
New Horizon College
14
1.4 RATIO ANALYSIS
Ratio analysis is one of the most powerful tool and widely used technique
of analyzing financial statements. It is the process of computing and interpreting
relationship between the items of the financial statements for arriving at
conclusions about the financial position and performance of an enterprise. With
the help of ratios, the financial statements can be analyzed more clearly and
scientific decisions are made from such analysis.Ratio analysis can also be
defined as the yard stick that provides a measure of relationship between two
accounting figures. Ratio analysis can be used both in the trend or dynamic
analysis and statistical analysis.
Financial ratio analysis is the calculation and comparison of ratios which
are derived from the information in a company‘s financial condition, its
operations and attractiveness as an investment. Financial ratios are calculated
from one or more pieces of information from a company‘s financial statements.
For example, the ―gross margin‖ is the gross profit from operations divided by
the total sales or revenues of a company, expressed in percentage terms. In
isolation, a financial ratio is a useless piece of information. In context, however
a financial ratio can give a financial analyst an excellent picture of a company‘s
situation and the trends that are developing.
Financial ratio analysis groups the ratio into categories which tell us
about different facets of a company‘s finances. Some ratios which are most
importance are listed below
1. Liquidity Ratio.
2. Leverage Ratio
3. Profitability Ratio.
4. Activity Ratio

Working capital management
New Horizon College
15
LIQUIDITY RATIO
Liquidity refers to the ability of the concern to meet its current obligations
as and when they become due. These ratios are calculated to comment upon the
short term paying capacity of the concern or the firm‘s ability to meet its current
obligations. Much insight could be obtained into the present cash solvency of
the firm and its ability to remain solvent in the event of emergent i.e. the firm
should ensure that it does not suffer from any lack of liquidity and also that it is
necessary to strike a proper balance between high liquidity and lack of liquidity.
The various liquidity ratios are:
Current Ratio
Current ratio may be defined as the relationship between current assets
and current liabilities. This ratio is also known as working capital ratio, is a
measure of general liquidity and is most widely used to make the analysis of a
short term financial position or liquidity of a firm. It is calculated by dividing
the total of current assets to the total of current liabilities.
Current Ratio = Current Assets / Current Liabilities
Liquid Ratio
It is also known as acid test ratio. Liquid ratio is more rigorous test of
liquidity than the current ratio. The term liquidity refers to the ability of a firm
to pay its short term obligations as and when they become due. An asset is said
to be liquid if it can be converted into cash within a short period without loss of
value. Liquid ratio may be defined as the relationship between liquid assets and
current liabilities.
Liquid Ratio = Liquid Assets / Current Liabilities
Working capital management
New Horizon College
16
Absolute Liquid ratio
Some authors are of the opinion that the absolute liquid ratio should also be
calculated together with current ratio and acid test ratio so as to exclude even
receivables from the current assets and find out the absolute liquid assets.
Absolute Liquid Ratio = Absolute Liquid Assets / Current Liabilities
LEVERAGE RATIOS
The short term creditors like the bankers and the suppliers of the raw
materials are more concerned with the firm‘s current debt paying ability. On the
other hand long-term creditors like debenture holders, financial institutions, etc
are more concerned with the firm‘s long term financial position. To judge the
long term financial position of the firm, financial leverage or capital structure
ratio is used. The shareholders, debenture holders and other long term creditors
like financial institutions are more interested in the long term financial position
or long term solvency of the firm. Leverage or solvency ratios are used to
analyze the capital structure of a company; it is also known as capital structure
ratios. The term solvency generally refers to the firm‘s ability to pay the interest
regularly and repay the principal amount of debt on due date.
Accordingly, there are two types of leverage ratios. The first type of
leverage ratio is based on the relationship between owned capital and borrowed
capital. These ratios are calculated from the balance items. The second type of
leverage ratio is coverage ratio. These are computed from profit and loss
account.

Working capital management
New Horizon College
17
Debt-equity ratio
Debt-equity ratio is also known as external-internal equity ratio. It is
calculated to measure the relative claims of outsiders and the owners against the
firm‘s assets. This ratio indicates the relationship between the external equities
or the outsiders fund and the internal equities or shareholders fund.
Debt-equity ratio = Outsider‘s fund / Shareholders fund
Primarily Interpretation of this ratio depends upon the financial policy of the
firm and the firm‘s nature of business. A ratio of 1:1 may be usually considered
to be satisfactory ratio although there cannot be any rule of thumb or standard
norm for all types of business.
Capital gearing ratio
The term capital gearing is used to describe the relationship between
equity share capital including reserves and surpluses to preference share capital
and other fixed interest bearing loans. If preference share capital and other fixed
interest bearing loans exceed the equity share capital including reserves, the
firm is said to be highly geared. The firm is said to be in low gear if preference
share capital and other fixed interest bearing loans are less than equity capital
and reserves.
Capital gearing ratio= (ESC + R & S)/(PSC - TDBFI)
Where , ESC = equity share capital
R&S = reserve and surplus
PSC = preferenceshare capital-term debt bearing
TDBFI = term debt bearing fixed interest

Working capital management
New Horizon College
18
PROFITABILITY RATIOS
Profit reflects the final result of the business operations. There is two
types of profitability ratios namely margin ratio and ratio on returns rates. Profit
margin ratios show the relation between sales and profits.
The ultimate aim of any business enterprise is to earn maximum profit.
Lord Keens remarked, ―Profit is the engine that drives the business enterprise ―,
a firm should earn profit to survive and grow for a long period of time. To the
management profit is a measurement of efficiency and control. To the owners it
is to measure the worth of their investment. To the creditors it is margin of
safety.
The management of the company should know how efficiently they carry
out business operation. In other words, the management of the company is very
much interested in the profitability of the company. Beside management,
creditors and owners are also interested in the profitability of the firm, as they
want to get interest and repayment of principal amount regularly. Owners want
to get a reasonable return on their investment. The profitability ratio measures
the ability of the firm to earn and on sales, total assets and invested capital.
Profitability ratios are generally calculated either in relation to sales or in
relation to investment.
The following profitability ratios are calculated in relation to sales:
Gross profit ratio
Gross profit ratio measures the relationship of gross profit to net sales and
is usually represented as percentage. Thus it is calculated by dividing gross
profit by sales.
Gross profit ratio = gross profit / net sales

Working capital management
New Horizon College
19
Operating profit ratio
This ratio is calculated by dividing operating profit by sales. Operating
profit is the excess of net sales over operating costs. Operating cost is the
cumulative of cost of goods sold, administrative and office expenses and selling
and distribution expenses.
Operating profit ratio = operating profits /net sales
Net profit ratio
Net profit ratio establishes the relationship between net profit (after taxes)
and sales, and it indicates the efficiency of the management in manufacturing,
selling, administrative and other activities of the firm. This ratio is the overall
measure of firm‘s profitability and is calculated as:
Net profit ratio = net profit / net sales
ACTIVITY RATIOS
Funds of the owners and creditors are invested in various assets to
generate sales and profits. Activity ratios are employed to evaluate the
efficiency with which the firm‘s managers utilize their assets. These ratios is
also called turnover ratio because they indicate the speed with the assets are
being converted or turn over into sales.
The various activity ratios are:
Debtors turnover ratio
Debtor‘s turnover ratio indicates the velocity of debt collection of a firm.
In simple words, it indicates the number of times average debtors are turned
over during a year.
Debtors turnover ratio = Net credit annual sale / Average trade debtors

Working capital management
New Horizon College
20
Creditors turnover ratio
This ratio indicates the velocity with which the creditors are turned over
the relation to purchases.
Creditors turnover ratio = Net credit purchases / Average trade creditors
Inventory turnover ratio
It is also known as stock velocity, is normally calculated as sales/average
inventory or cost of goods sold /average inventory. It indicates whether the
inventory has been efficiently used or not. The purpose is to see whether only
the required minimum funds have been locked up in inventory. Inventory
turnover ratio indicates the number of times the stock has been turned over
during the period and evaluates the efficiency with which a firm is able to
manage its inventory.
Inventory turnover ratio = Cost of goods sold / Average inventory at cost
Usually, a high inventory turnover indicates efficient management of inventory
because more frequently the stocks are sold; the lesser amount of money is
required to finance the inventory.
Fixed assets turnover ratio
This ratio indicates the extent to which the investments in fixed assets
contribute towards sales. If it is compared with a previous period, it indicates
whether the investment in fixed assets has been judicious or not. The ratio is
calculated as follows:
Fixed assets turnover ratio = Net sales / Fixed assets (Net)

Working capital management
New Horizon College
21
Working capital turnover ratio
It indicates the velocity of the utilization of net working capital. This ratio
indicates the number of times the working capital is turned over in the course of
a year. It measures the efficiency with which the working capital is being used
by a firm.
This ratio is calculated as:
Working capital turnover ratio = Cost of sales / Average working capital
A higher ratio indicates efficient utilization of working capital and a low
ratio indicates vice versa. But a very high working capital turnover ratio is not a
good situation for any firm and hence care must be taken while interpreting the
ratio.

Working capital management
New Horizon College
22
2. INDUSTRY AND COMPANY PROFILE
2.1 INDUSTRY PROFILE
The automotive industry is a wide range of companies and organizations
involved in the design, development, manufacturing, marketing, and selling of
motor vehicles. The term automotive was created from Greek autos (self), and
Latin motives (of motion) to represent any form of self-powered vehicle. This
term was proposed by SAE member Elmer Sperry.
The automotive industry does not include industries dedicated to the
maintenance of automobiles following delivery to the end-user, such as
automobile repair shops and motor fuel filling stations.
HISTORY
The automotive industry began in the 1890s with hundreds of
manufacturers that pioneered the horseless carriage. For many decades, the
United States led the world in total automobile production. In 1929 before the
Great Depression, the world had 32,028,500 automobiles in use, and the U.S.
automobile industry produced over 90% of them.
In 1768, the first steam-powered automobile capable of human transportation
was built by Nicolas-Joseph Cugnot.
In 1807, Francois Isaac de Rivaz designed the first car powered by an internal
combustion engine fueled by hydrogen.
In 1864, Siegfried Marcus created the first gasoline powered combustion
engine, which he placed on a pushcart.
1880, introduced innovations such as a four-cycle, gasoline-powered engine, an
ingenious carburetor design, and magneto ignition.
Working capital management
New Horizon College
23
In 1886, Karl Benz developed a petrol- or gasoline-powered automobile. This is
also considered to be the first "production" vehicle as Benz made several other
identical copies.
At the turn of the 20th century electrically powered automobiles appeared but
only occupied a niche market until the turn of the 21st century.
After World War II, the U.S. produced about 75 percent of world's auto
production. In 1980, the U.S. was overtaken by Japan and became world's leader
again in 1994. In 2006, Japan narrowly passed the U.S. in production and held
this rank until 2009, when China took the top spot with 13.8 million units.
In 1897, the first car ran on an Indian road. Through the 1930s, cars were
imports only, and in small numbers. Hindustan Motors was launched in 1942,
long-time competitor Premier in 1944, building Chrysler, Dodge, and Fiat
products respectively.
In 1952, the government appointed the first Tariff Commission, and one
of the purpose was to come out with the feasible plan for indigenization of the
Indian automobile industry.
ECONOMY
Around the world, there were about 806 million cars and light trucks on
the road in 2007, consuming over 980 billion litres of gasoline and diesel fuel
yearly.The automobile is a primary mode of transportation for many developed
economies. The Detroit branch of Boston Consulting Group predicts that, by
2014, one-third of world demand will be in the four BRIC markets (Brazil,
Russia, India and China). Meanwhile, in the developed countries, the
automotive industry has slowed down. It is also expected that this trend will
continue, especially as the younger generations of people (in highly urbanized
countries) no longer want to own a car anymore, and prefer other modes of
Working capital management
New Horizon College
24
transport. Other potentially powerful automotive markets are Iran and
Indonesia. Emerging auto markets already buy more cars than established
markets. According to a J.D. Power study, emerging markets accounted for 51
percent of the global light-vehicle sales in 2010. The study, performed in 2010
expected this trend to accelerate. However, more recent reports (2012)
confirmed the opposite; namely that the automotive industry was slowing down
even in BRIC countries. In the United States, vehicle sales peaked in 2000, at
17.8 million units.
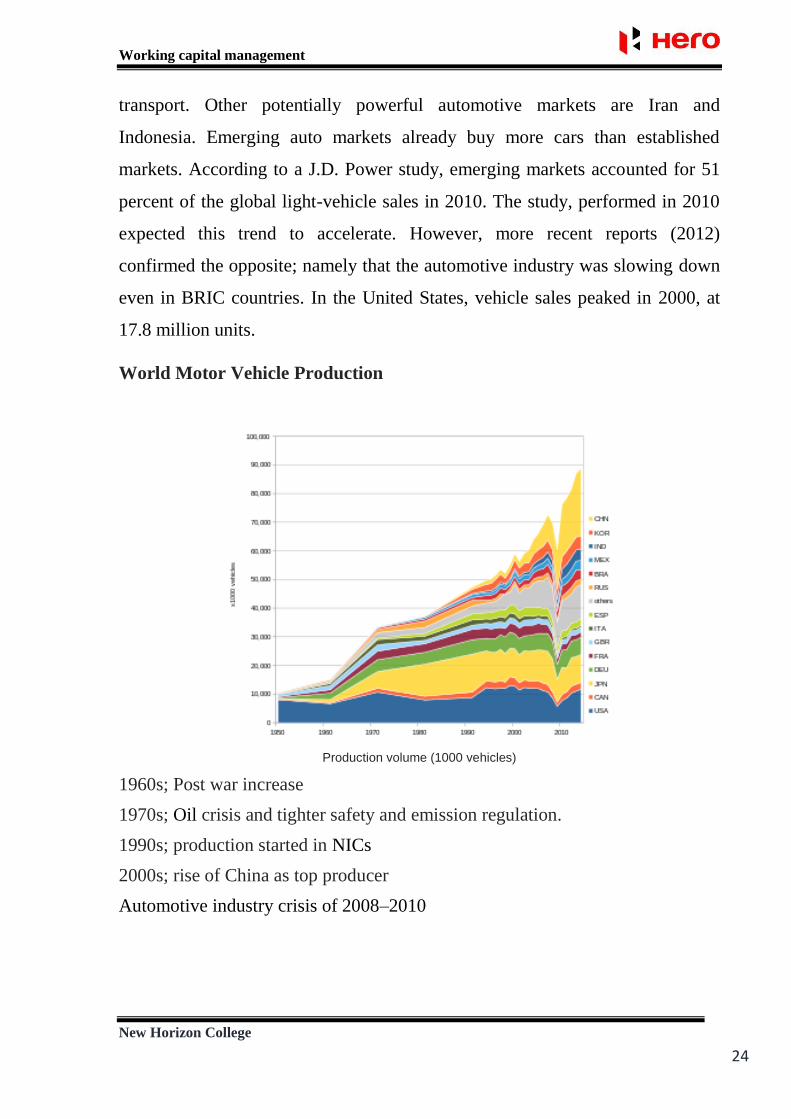
World Motor Vehicle Production
Production volume (1000 vehicles)
1960s; Post war increase
1970s; Oil crisis and tighter safety and emission regulation.
1990s; production started in NICs
2000s; rise of China as top producer
Automotive industry crisis of 2008–2010

Working capital management
New Horizon College
25
To 1950; USA had produced more than 80% of motor vehicles.[15]
1950s; UK, Germany and France restarted production.
1960s; Japan started production and increased volume through the 1980s.
US, Japan, Germany, France and UK produced about 80% of motor vehicles
through the 1980s.
1990s; Korea became a volume producer. In 2004, Korea became No. 5 passing
France.
2000s; China increased its production drastically, and 2009 became the world
largest producing country.
2013; The share of China (25.4%), Korea, India, Brazil and Mexico rose to
43%, while the share of USA (12.7%), Japan, Germany, France and UK fell to
34%.
Working capital management
New Horizon College
26
AUTOMOTIVE INDUSTRY IN INDIA
In 1897, the first car ran on an Indian road. Through the 1930s, cars were
imports only, and in small numbers. in 1954, General Motors, Ford and Roots
Group who has assembly plants in Mumbai to India decided to move out of
India.
The automotive industry in India is one of the largest in the world with an
annual production of 23.37 million vehicles in FY 2014-15, following a growth
of 8.68 per cent over the last year. India is also a prominent auto exporter and
has strong export growth expectations for the near future. In FY 2014-15,
automobile exports grew by 15 per cent over the last year.
In addition, several initiatives by the Government of India and the major
automobile players in the Indian market are expected to make India a leader in
the Two Wheeler (2W) and Four Wheeler (4W) market in the world by 2020.
The Government of India encourages foreign investment in the
automobile sector and allows 100 per cent FDI under the automatic route.
Some of the major initiatives taken by the Government of India are:
The Government of India aims to make automobile manufacturing the main
driver of "Make in India" initiative, as it expects the passenger vehicles
market to triple to 9.4 million units by 2026, as highlighted in the Auto
Mission Plan (AMP) 2016-26.
In the Union budget of 2015-16, the Government has announced plans to
provide credit of Rs 850,000 crore (US$127.5 billion) to farmers, which is
expected to boost sales in the tractors segment.
The government plans to promote eco-friendly cars in the country—i.e.
CNG-based vehicles, hybrid vehicles, and electric vehicles—and also to
make mandatory 5 per cent ethanol blending in petrol.

Working capital management
New Horizon College
27
The government has formulated a Scheme for Faster Adoption and
Manufacturing of Electric and Hybrid Vehicles in India, under the National
Electric Mobility Mission 2020, to encourage the progressive introduction of
reliable, affordable, and efficient electric and hybrid vehicles into the
country.
The Automobile Mission Plan (AMP) for the period 2006–2016, designed
by the government is aimed at accelerating and sustaining growth in this
sector. Also, the well-established Regulatory Framework under the Ministry
of Shipping, Road Transport and Highways, plays a part in providing a boost
to this sector.
THE 1952 TARIFF COMMISSION
In 1952, the government appointed the first Tariff Commission, and one
of the purpose was to come out with the feasible plan for indigenization of the
Indian automobile industry.
In 1953 the commission submitted the report which recommended
categorizing the existing Indian companies according to their then infrastructure
with license capacity to manufacture a certain number of vehicle with capacity
increase allowable as per demands in future.
The Tariff commission along with similar restriction applied to other
Industries can to be known as the license that later proved to be the greatest
undoing for the Indian automotive industry where bureaucratic(official) red tape
ended up making demand outstripping supply with month long waiting period
for cars, scooter and motorcycles.
Working capital management
New Horizon College
28
PASSENGER CARS
Hindustan Motors, Calcutta - technical collaboration with Morris Motors to
manufacture Morris Oxford models that would later become HM
Ambassador.
Premier Automobiles, Bombay - technical collaboration with Chrysler to
manufacture Dodge, Plymouth and Desoto models and with Fiat to
manufacture the 1100D models which would later with Premier Padmini
range.
Standard Motor Products of India, Madras - technical collaboration from
Standard-Triumph to manufacture Standard Vanguard, Standard 8, 10 and
later Standard Herald.
UTILITY AND LIGHT COMMERCIAL VEHICLES
Mahindra & Mahindra, Bombay - technical collaboration with Willys to
manufacture CJ Series Jeep.
Bajaj Tempo, Poona now Force Motors - technical collaboration with Tempo
(company) to manufacture Tempo Hanseat, a three-wheeler and Tempo
Viking and Hanomag, later known as Tempo Matador in India.
Standard Motor Products of India - technical collaboration from Standard has
licence to manufacture the Standard Atlas passenger van with panel van and
one-tonne one tonne pickup variants.
MEDIUM AND HEAVY COMMERCIAL VEHICLES
Tata Motors, Poona, then known as TELCO - technical collaboration with
Mercedes Benz to manufacture medium to heavy commercial vehicles both
Bus and Trucks.
Ashok Motors, later Ashok Leyland, Madras - technical collaboration with
Leyland Motors to manufacture medium to heavy commercial vehicles both

Working capital management
New Horizon College
29
Bus and Trucks. Ashok Motors also discontinued its Austin venture formed
in 1948 to sell Austin A40 and retooled the factory to make trucks and buses.
Hindustan Motors - technical collaboration with General Motors to
manufacture the Bedford range of medium lorry and bus chassis.
Premier Automobiles - technical collaboration with Chrysler to manufacture
the Dodge, Fargo range of medium lorry, panel vans, mini-bus and bus
chassis.
SCOOTERS, MOPEDS AND MOTORCYCLE
known as Bajaj Chetak, by Bajaj became the largest sold scooter in the world
Many of the two-wheelers manufacturers were granted licenses in early 60's
well after the tariff commission was enabled.
Royal Enfield (India), Madras - technical collaboration with Royal Enfield,
UK to manufacture the Enfield Bullet range of motorcycles.
Bajaj Auto, Poona - technical collaboration with Piaggio, Italy to
manufacture their best-selling Vespa range of scooters and three wheelers
with commercial option as well.
Automobile Products of India, Bombay (Better known for API Lambretta -
technical colloboration with Innocenti of Milan, Italy to manufacture their
Lambretta range of mopeds, scooters adn three-wheelers. This company was
actually the Rootes Group car plant that was bought over by M. A.
Chidambaram family.
Mopeds India Limited, Tirupathi - technical collaboration with Motobecane,
France to manufacture their best-selling Mobility mopeds.
Escorts Group, New Delhi - technical collaboration with CEKOP of Poland
to manufacture the Rajdoot 175 motorcycle whose origin was DKW RT 125
Ideal Jawa, Mysore - in technical collaboration with CZ - Jawa of
Czechoslovakia for its Jawa and Yezdi range of motorcycles.

Working capital management
New Horizon College
30
2.2 COMPANY PROFILE
Hero MotoCorp Ltd. (Formerly Hero Honda Motors Ltd.) is the world's
largest manufacturer of two - wheelers, based in India.
In 2001, the company achieved the coveted position of being the largest
two-wheeler manufacturing company in India and also, the 'World No.1' two-
wheeler company in terms of unit volume sales in a calendar year. Hero
MotoCorp Ltd. continues to maintain this position till date.
Hero Motocorp Ltd., formerly Hero Honda, is an Indian motorcycle
(<250cc) and scooter manufacturer based in New Delhi, India. The company is
the largest two wheeler manufacturer in India. In India, it has a market share of
about 46% share in 2-wheeler category. The 2006 Forbes 200 Most Respected
companies list has Hero Honda Motors ranked at #108. On 31 March 2013, the
market capitalisation of the company was ₹308 billion
Hero MotoCorp, the country's largest two-wheeler maker by volume,
continue to dominate the top 10 selling two-wheelers list in financial year 2014-
15 with its four products - Splendor, Passion, HF Deluxe, and Glamour ranked
at 1st, 3rd, 4th, 8th spots respectively, according to the sales data released by
Society of India Automobiles Manufacturers (SIAM) recently.
VISION
The story of Hero Honda began with a simple vision - the vision of a
mobile and an empowered India, powered by its two wheelers. Hero MotoCorp
Ltd., company's new identity, reflects its commitment towards providing world
class mobility solutions with renewed focus on expanding company's footprint
in the global arena.

Working capital management
New Horizon College
31
MISSION
Hero MotoCorp's mission is to become a global enterprise fulfilling its
customers' needs and aspirations for mobility, setting benchmarks in
technology, styling and quality so that it converts its customers into its brand
advocates. The company will provide an engaging environment for its people to
perform to their true potential. It will continue its focus on value creation and
enduring relationships with its partners.
STRATEGY
Hero MotoCorp's key strategies are to build a robust product portfolio
across categories, explore growth opportunities globally, continuously improve
its operational efficiency, aggressively expand its reach to customers, continue
to invest in brand building activities and ensure customer and shareholder
delight.
BRAND
The new Hero is rising and is poised to shine on the global arena.
Company's new identity "Hero MotoCorp Ltd." is truly reflective of its vision to
strengthen focus on mobility and technology and creating global footprint.
Building and promoting new brand identity will be central to all its initiatives,
utilizing every opportunity and leveraging its strong presence across sports,
entertainment and ground-level activation.
MANUFACTURING
Hero MotoCorp two wheelers are manufactured across 4 globally
benchmarked manufacturing facilities. Two of these are based at Gurgaon and
Dharuhera which are located in the state of Haryana in northern India. The third
manufacturing plant is based at Haridwar, in the hill state of Uttrakhand; the

Working capital management
New Horizon College
32
latest addition is the state-of-the-art Hero Garden Factory in Neemrana,
Rajasthan.
DISTRIBUTION
The Company's growth in the two wheeler market in India is the result of an
intrinsic ability to increase reach in new geographies and growth markets. Hero
MotoCorp's extensive sales and service network now spans over to 6000
customer touch points. These comprise a mix of authorized dealerships, service
& spare parts outlets, and dealer-appointed outlets across the country.
SPORTS ASSOCIATION
Hero MotoCorp began its association with the prestigious Indian Open
Golf tournament in 2005.
In 2010, Hero MotoCorp extended its support to Hockey by sponsoring
the 'Hockey World Cup 2010' that was held in India.
Hero MotoCorp has in the past sponsored major cricket tournaments in
association with International Cricket Council (ICC), including the cricket
World Cup and the Champions Trophy. Hero has also been associated with IPL.
EMPLOYEES
As on 31 March 2014, the company had 6,782 employees, out of which
66 were women (1.1%). It also had approx. 13,800 temporary employees on that
date. The company had an attrition rate of 5.1% in the FY 2012-13. The
company spent ₹8.21 billion (US$120 million) on employee benefits during the
FY 2012-13.

Working capital management
New Horizon College
33
HIERARCHY
CSR COMMITTEE
Mr. Pawan MunjalChair
man
Chairman, Managing Director &
CEO
Gen. (Retd.) V. P. Malik
Member
Non-executive & Independent
Director
Mr. Pradeep
Dinodia
Member
Non-executive &
Independent Director
STAKEHOLDERS' RELATIONSHIP
COMMITTEE
Dr. Pritam Singh
Chairman
Non-executive & Independent
Director
Mr. M. Damodaran
Member
Non-executive & Independent
Director
Mr. Ravi Nath
Member
Non-executive & Independent
Director
RISK MANAGEMENT
COMMITTEE
Mr. M. DamodaranC
hairman
Non-executive & Independent
Director
Mr. Pradeep
Dinodia
Member
Non-executive & Independent
Director
Mr. Ravi NathMember
Non-executive &
Independent Director
AUDIT COMMITTEE
Mr. Pradeep Dinodia
Chairman
Non-executive & Independent
Director
Gen. (Retd.) V. P. Malik
Member
Non-executive & Independent
Director
Dr. Pritam Singh
Member
Non-executive & Independent
Director
Mr.M.
DamodaranMember
Non-executive & Independent
Director
NOMINATION AND
REMUNERATION COMMITTEE
Gen. (Retd.) V. P.
MalikChairman
Non-executive & Independent
Director
Mr. Pradeep Dinodia
Member
Non-executive &
Independent Director
Mr. Ravi Nath
Member
Non-executive & Independent
Director

Working capital management
New Horizon College
34
OPERATIONS
Hero MotoCorp has four manufacturing facilities based at Dharuhera,
Neemrana and Gurgaon in Haryana and at Haridwar in Uttarakhand. These
plants together have a production capacity of 7.6 million 2-wheelers per year.
Hero MotoCorp has a sales and service network with over 6,000
dealerships and service points across India. It has a customer loyalty program
since 2000, called the Hero Honda Passport Program which is now known as
Hero GoodLife Program.
It is reported that Hero MotoCorp has five joint ventures or associate
companies, Munjal Showa, AG Industries, Sunbeam Auto, Rockman Industries
and Satyam Auto Components, that supply a majority of its components.
The company has a stated aim of achieving revenues of $10 billion and
volumes of 10 million two-wheelers by 2016–17. This in conjunction with new
countries where they can now market their two-wheelers following the
disengagement from Honda.
COMPETITION
Name Last
Price
Market
Cap.
(Rs. cr.)
Sales
Turnover
Net
Profit
Total
Assets
Bajaj Auto 2,981.60 86,277.67 23,883.20 3,929.67 12,454.14
Hero
Motocorp
3,588.70 71,663.28 30,700.88 3,161.52 7,944.75
TVS Motor 338.35 16,074.57 11,243.87 432.14 2,695.26
Mah
Scooters
1,485.45 1,697.66 8.97 101.00 312.00
Atul Auto 432.35 979.27 531.04 47.40 154.59
LML 8.00 65.59 156.13 -78.36 -662.45 Source: https://en.wikipedia.org/wiki

Working capital management
New Horizon College
35
The above chart shows comparison with competitor
29
81
.6
35
88
.7
33
8.3
5
14
85
.45
43
2.3
5
8
86
27
7.6
7
71
66
3.2
8
16
07
4.5
7
16
97
.66
97
9.2
7
65
.59
23
88
3.2
30
70
0.8
8
11
24
3.8
7
8.9
7
53
1.0
4
15
6.1
3
39
29
.67
31
61
.52
43
2.1
4
10
1
47
.4
-78
.36
12
45
4.1
4
79
44
.5
26
95
.26
31
2
15
4.5
9
-66
2.4
5
-10000
0
10000
20000
30000
40000
50000
60000
70000
80000
90000
100000
BAJAJ AUTO HEROMOTOCROP
TVS MOTOR MAH SCOOTER ATUL AUTO LML
Rs.
Cr
Company
Chart Title
LAST PRIC MARKET CAP SALES TURNOVER NET PROFIT TOTAL ASSET

Working capital management
New Horizon College
36
AMBICA HERO PROFILE
MANAGEMENT
At Ambica Hero, they believe in a customer centric approach towards
their business. This has enabled us to provide the very best after sales services.
they determination to achieve the highest standards has led us to be one of the
leading Hero MotoCorp dealers in India.
They state of the art service centre with modern equipment and their team
of dedicated staff are there to provide a satisfying experience to their customers.
AWARDS
In 2010 at the Hero Inter School Athletic Meet, Hero MotoCorp awarded a
Certificate of Appreciation to Kumar Hero.
At the National Mechanics Contest in 2005, Rakesh Machhi of Ambica Hero
was awarded a Certificate of Appreciation at the National Training Centre,
Gurgaon.
A Certificate of Excellence was awarded to Ambica Hero as a winner for his
overall performance in the 'Hero Stars' Contest for the year 2003-04.
A Certificate of Excellence was awarded to Mr. Jayant Shah as a winner for his
overall performance in the 'HH' Contest for the year 2007-08.
The first runner-up trophy was awarded to Ambica Hero, Baroda for the west
zone in 1987.
The Top 10 Technicians Award was presented to Mr. Gautam Shah of Ambica
Hero, for his excellence in the National Technician's Contest.

Working capital management
New Horizon College
37
EMPLOYEES
At Ambica Hero, we draw on each other‘s capabilities and experiences, to
inspire and motivate one another. We are a tight knit family of professionals
with the expertise to help us meet and surpass the expectations of our customers.
Key functional heads are ably supported by a team of more than 65 people in
the areas of sales , servicing , spare parts and administration.
CAREERS
Ambica Hero is a dynamic, growth-oriented environment that provides
exciting opportunities to grow as a professional. We have , from time to time ,
across multiple departments such as :-
Sales
Customer Care
Administration
Accounting Finance
Spare Parts Accessories
SERVICES
GENERAL SERVICES
Washing
Denting & Painting
Fuel Lines Inspection
Throttle Inspection
Carburetor Inspection

Working capital management
New Horizon College
38
Air Cleaner Inspection
Drain Tube Inspection
Spark Plug Inspection
Engine Oil Replacement
Valve Inspection
Engine Oil Inspection
Battery Inspection
Suspension Check
Wheel Balance Check
Tyre Pressure Check
Steering Inspection
Brake Inspection
Engine Overhauling
Rubbing and Polishing
Ignition Systems
Cylinder Reboring and Honing
Gearbox Repairs
Porting & Gasflow Testing
Accident Repairs

Working capital management
New Horizon College
39
EVENTS
Cricket Tournament
Diwali Sweets Distribution
Doodh Mandli Activity
Service Har Jagah Activity
VALUE ADDED SERVICES
At Hero MotoCorp, they believe in meeting and exceeding the
expectations of the customers. This extends beyond providing the best products
and unmatched service in the market. It includes a host of value added services
to enhance customers riding experience.

Working capital management
New Horizon College
40
3. RESEARCH DESIGN
3.1 RESEARCH DESIGN
Research design is the arrangement of conditions for collection and
analysis of data in a manner that aims to combine relevance to the research
purpose with economy in procedure. It constitutes the blueprint for the
collection, measurement and analysis of data. The design adopted in the study is
both descriptive and analytical done at branch level.
3.2 STATEMENT OF PROBLEM
This project deals with the study about ―Working Capital Management‖
in Hero MotoCorp Ltd. AMBICA MOTORS authorized representative of
dealer kumar hero.
The working capital management is very important term. It involves the
study of day-to-day affairs of the company. The motive behind the study is to
develop an understanding about the working capital management in the running
business organization and to help the company in developing the efficient
working capital management. Therefore, it helps in future planning and control
decisions.
If we look at any financial statement it will be evident that the investment
in fixed assets remains more or less static but the working capital is constantly
changing. A healthy working capital position is the thing that is absolutely
necessary of a successful business. This is reflected in adequate inventories,
lowest level of debtors, minimum utilization of bank facilities for working
capital, etc. thus the study of working capital management occupies an
important place in financial management.

Working capital management
New Horizon College
41
3.3 SCOPE OF THE STUDY
The study is conducted at Hero MotoCorp Ltd. AMBICA MOTORS. The
study of working capital management is purely based on secondary data and all
the information is available within the company itself in the form of records. To
get proper understanding of this concept, I have done the study of the balance
sheets, profit and loss A/C. So, scope of the study is limited up to the
availability of official records and information provided by the finance
department. The study is supposed to be related to the period of last three years.
The main scope of the study was to put into practical the theoretical
aspect of the study into real lifework experience.
The study of working capital is based on tools like Ratio Analysis,
Statement of changes in working capital. Further the study is based on last three
years balance sheet.
3.4 METHODOLOGY OF THE STUDY
Research methodology describes about the research objectives, design
and methodology adopted to conduct the study. The data collected can be either
primary or secondary. The above information is carried on with the cooperation
of management of Hero MotoCorp Ltd. AMBICA MOTORS.
3.5 OBJECTIVES OF STUDY
To analyze the effective utilization of working capital
To evaluate the performance of receivables and cash
To study the structure of working capital
To study the sources of working capital finance
To study need of working capital requirement in organization

Working capital management
New Horizon College
42
3.6 SOURCES OF DATA
The analysis of financial viability of the company necessitates accurate
and reliable data. Therefore, the methodology used for the collection of
information. There are mainly two types of data.
1 Primary data
2. Secondary data
PRIMARY DATA:
Most of the information is collected from internal discussion with various
officials in the finance department and concerned executive of other department.
SECONDARY DATA:
The information collection from:
Annual reports, published records and reference books, official websites.
Executive and staff of financial accounting department.
3.7 TOOLS OF ANALYSIS
There are some of the tools, which are relevant for the study of ration
analysis and performance of Hero MotoCorp Ltd. AMBICA MOTORS.
Net working capital
Ratio analysis
Balance sheet

Working capital management
New Horizon College
43
3.8 LIMITATIONS OF THE STUDY
The study is restricted for a period of three years only commencing from
2013-2016. So it shows limited period data is considered.
As the financial information is confidential, they do not want to share
accurate data or information.
Study duration is very short (one month only).
Limited interaction with concerned head because of their busy schedule.

Working capital management
New Horizon College
44
4. ANALYSIS AND INTERPRETATION OF DATA
4.1 STATEMENT OF CHANGES IN WORKING CAPITAL
Working capital means the excess of current assets over current liabilities.
Statement of changes in working capital is calculated for comparing the figure
of two consecutive years.
THE GENERAL RULE
a) An increase in current asset will increases working capital
b) A decrease in the current asset will decreases working capital
c) An increase in current liabilities will decreases working capital
d) A decrease in current liabilities will increases working capital.
The change in the amount of any current asset or current liability in the
current balance sheet as compared to that of previous balance sheet either results
in increase or decrease in working capital. The difference is recorded for each
individual current asset and current liability.
In case, current assets in the current period are more than in the previous
period, the effect is an increase in working capital and it is recorded in the
increase column. If a current liability in the current period is more than in the
previous period, the effect is decrease in working capital and it is recorded in
the decrease column.
Working capital management
New Horizon College
45
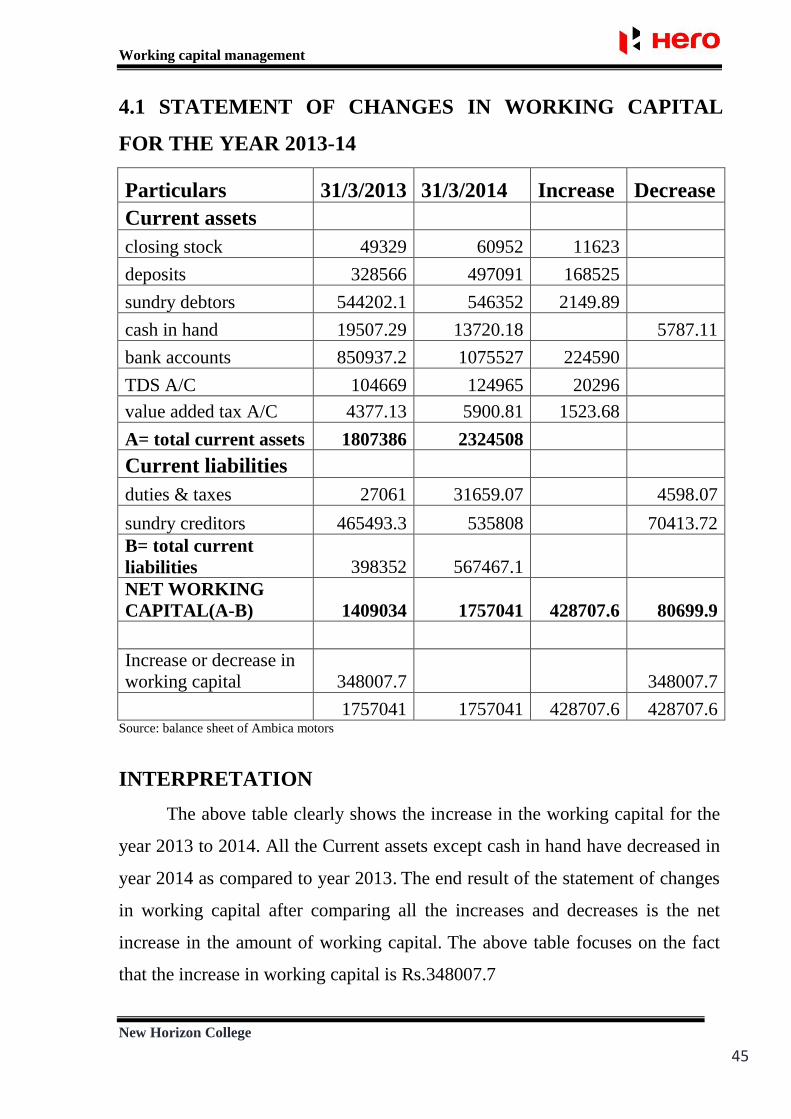
4.1 STATEMENT OF CHANGES IN WORKING CAPITAL
FOR THE YEAR 2013-14
Particulars 31/3/2013 31/3/2014 Increase Decrease
Current assets
closing stock 49329 60952 11623
deposits 328566 497091 168525
sundry debtors 544202.1 546352 2149.89
cash in hand 19507.29 13720.18 5787.11
bank accounts 850937.2 1075527 224590
TDS A/C 104669 124965 20296
value added tax A/C 4377.13 5900.81 1523.68
A= total current assets 1807386 2324508
Current liabilities
duties & taxes 27061 31659.07 4598.07
sundry creditors 465493.3 535808 70413.72
B= total current
liabilities 398352 567467.1
NET WORKING
CAPITAL(A-B) 1409034 1757041 428707.6 80699.9
Increase or decrease in
working capital 348007.7 348007.7
1757041 1757041 428707.6 428707.6 Source: balance sheet of Ambica motors
INTERPRETATION
The above table clearly shows the increase in the working capital for the
year 2013 to 2014. All the Current assets except cash in hand have decreased in
year 2014 as compared to year 2013. The end result of the statement of changes
in working capital after comparing all the increases and decreases is the net
increase in the amount of working capital. The above table focuses on the fact
that the increase in working capital is Rs.348007.7
Working capital management
New Horizon College
46
4.2 STATEMENT OF CHANGES IN WORKING CAPITAL
FOR THE YEAR 2014-15
Particulars 31/3/2014 31/3/2015 Increase Decrease
Current assets
closing stock 60952 90485 29533
deposits 497091 1193568 696477
sundry debtors 546352 549272 2919.79
cash in hand 13720.18 31116.68 17396.5
bank accounts 1075527 669936.3 405591
TDS A/C 124965 146221 21256
value added tax A/C 5900.81 5883.24 17.57
A= total current assets 2324508 2686482
Current liabilities
duties & taxes 31659.07 5000 26659.07
sundry creditors 535808 256890 278918
B= total current liabilities 567467.1 261890
NET WORKING
CAPITAL(A-B) 17757041 2424592 1073159 405608.6
Increase or decrease in
working capital 667550.8 667550.8
2424592 2424592 1073159 1073159 Source: balance sheet of Ambica motors
INTERPRETATION
The above table clearly shows the increase in the working capital for the
year 2014 to 2015. All the Current assets except bank account and value added
tax A/C have decreased in year 2015 as compared to year 2014. The end result
of the statement of changes in working capital after comparing all the increases
and decreases is the net increase in the amount of working capital. The above
table focuses on the fact that the increase in working capital is Rs.667550.8

Working capital management
New Horizon College
47
4.3 STATEMENT OF CHANGES IN WORKING CAPITAL
FOR THE YEAR 2015-16
Particulars 31/3/2015 31/3/2016 Increase Decrease
Current assets
stock 90485 78143 12342
deposits 1193568 2290545 1096977
sundry debtors 549272 565969 16697
cash in hand 31116.68 5787.29 25329.39
bank accounts 669936.3 811997.8 142061.5
TDS A/C 146221 169068.8 22847.8
value added tax A/C 5883.24 12249.33 6365.09
A= total current assets 2686482 3933760
Current liabilities
duties & taxes 5000 4500 500
sundry creditors 256890 327989 71099
B= total current
liabilities 261890 332489 NET WORKING
CAPITAL(A-B) 2424592 3601271 1285448 106770.4
Increase or decrease in
working capital 11176679 1176678
3601271 3601271 1285448 1285448 Source: balance sheet of Ambica motors
INTERPRETATION
The above table clearly shows the increase in the working capital for the
year 2015 to 2016. All the Current assets except stock and cash in hand have
decreased in year 2016 as compared to year 2015. The end result of the
statement of changes in working capital after comparing all the increases and
decreases is the net increase in the amount of working capital. The above table
focuses on the fact that the increase in working capital is Rs.11176679.

Working capital management
New Horizon College
48
4.2 RATIO ANALYSIS
A ratio is a relationship expressed in mathematical terms between two
individual groups of data connected with each other in some logical manner.
Ratio analysis is widely used tool of financial analysis. This systematic method
helps to interpret the financial statement so that the strengths and weakness of a
firm as well as the historical performance and current financial condition can be
determined.
A ratio can be used as a yardstick for evaluating the financial position and
performance of a concern, because the absolute accounting data cannot provide
meaningful understanding and Interpretation. A ratio is the relationship between
two accounting items expressed mathematically. Ratio analysis helps the analyst
to make quantitative judgment with regard to concern's financial position and
performance.
Purpose of the ratio analysis
To study the short term solvency of the firm- liquidity of the firm.
To study the long term solvency of the firm- leverage position of the firm.
To interpret the profitability of the firm- profit earning capacity of the firm.
To identify the operating efficiency of the firm- turnover of the ratios.
STEPS INVOLVED IN RATIO ANALYSIS
STEP 1
Calculation of ratios from the information obtained from financial statements
according to the requirement of decision.
STEP 2
Compare the calculated ratios with pre-determined standard ratios. They may be
a past ratio of the same organization average ratio or a projected ratio or the
ratio of the most successful organization in the industry.

Working capital management
New Horizon College
49
LIQUIDITY RATIO
4.4 CURRENT RATIO
Current ratio may be defined as a relationship between current assets and
current liabilities. It is a measure of general liquidity and is most widely used to
make the analysis of short term financial position of a firm.
The ideal value of current ratio is 2:1
Current Ratio = Current Assets / Current Liabilities
Year Current
assets
Current
liabilities
Current
ratio
2013-14 1220002 504148.9 2.41
2014-15 1307987 261890 4.99
2015-16 2089140 332489 6.28
Source: balance sheet of Ambica motors
ANALYSIS
From the above table, we can observed that current ratio in 2013-2014 it is 2.41,
in 2014-2015 it is 4.99, in 2015-2016 it is 6.28. This is higher than ideal ratio.
The ideal value of current ratio is 2:1

Working capital management
New Horizon College
50
CHART NO: 4.1
CURRENT RATIO
INTERPRETATION
The chart shows that current ratio in 2013-2014 is 2.41, in 2014-2015 it is
4.99 and in 2015-2016 it is 6.28. The current ratio of all the above three years is
above the standard, so the society can meet its short term obligation. The
company is able to generate enough from operations to pay for its current
obligations with current assets.
2.41992389
4.99441254
6.283334216
0
1
2
3
4
5
6
7
2013-14 2014-15 2015-16
Cu
rre
nt
rati
o
Year
current ratio
current ratio

Working capital management
New Horizon College
51
4.5 LIQUID OR QUICK RATIO
The liquidity ratios are a result of dividing cash and other liquid assets by the
short term borrowings and current liabilities. They show the number of times
the short term debt obligations are covered by the cash and liquid assets. If the
value is greater than 1, it means the short term obligations are fully covered.
Liquidity refers to the ability of a concern to meet its current obligations and
when these become due.
The ideal value of quick ration is 1:1.
Liquid Ratio = Liquid Assets / Current Liabilities
OR
Quick Ratio = Quick Assets / Quick Liabilities
Quick assets = Current assets – (stock + prepaid expenses)
Quick liabilities = Current liabilities – Bank overdraft
Year Quick
assets
Quick
liabilities
Quick Ratio
2013-14 1159050 504148.9 2.299024
2014-15 1217502 261890 4.648905
2015-16 2010997 332489 6.04831
Source: balance sheet of Ambica motors
ANALYSIS
From the above table, we can observed that Liquid or quick ratio in 2013-2014
it is 2.29, in 2014-2015 it is 4.64, in 2015-2016 it is 6.04
Above all the value of that Liquid or quick ratio is greater than standard form of
absolute liquid ratio.
Working capital management
New Horizon College
52
CHART NO: 4.2
LIQUID OR QUICK RATIO
INTERPRETATION
The chart shows that that Liquid or quick ratio in 2013-2014 is 2.29, in
2014-2015 it is 4.64, and in 2015-2016 it is 6.04. The Liquid or quick ratio of all
the above three years is above the standard, so the society can meet its short
term obligation. The company is able to generate enough from operations to pay
for its current obligations with current assets.
0
1
2
3
4
5
6
7
2013-14 2014-15 2015-16
2.299023822
4.648904884
6.048309869
Qu
ick
rati
o
Year
Quick Ratio
Quick Ratio

Working capital management
New Horizon College
53
4.6 ABSOLUTE LIQUID RATIO
Absolute Liquid Assets include cash in hand and at bank and marketable
securities or temporary investments.
The acceptable norm for this ratio is 50% or 0.5: 1 or 1: 2
Absolute Liquid Ratio = Absolute Liquid Assets / Current Liabilities
Year Absolute Liquid
Assets
Current
liabilities
Absolute Liquid
Ratio
2013-14 2132690 504148.9 4.230278
2014-15 2443892 261890 9.331751
2015-16 3674299 332489 11.05089
Source: balance sheet of Ambica motors
ANALYSIS
From the above table, we can observed that Absolute Liquid Ratio in 2013-2014
it is 4.23, in 2014-2015 it is 9.33, in 2015-2016 it is 11.05
Above all the value of Absolute Liquid Ratio is greater than standard form of
absolute liquid ratio.

Working capital management
New Horizon College
54
CHART NO: 4.3
ABSOLUTE LIQUID RATIO
INTERPRETATION
The chart shows that Absolute quick ratio in 2013-2014 is 4.23, in
2014-2015 it is 9.33, and in 2015-2016 it is 11.05. The Absolute quick ratio of
all the above three years is above the standard, so the society can meet its short
term obligation. The company is able to generate enough from operations to pay
for its current obligations with current assets.
4.230278164
9.331750964
11.05088815
0
2
4
6
8
10
12
2013-14 2014-15 2015-16
Ab
solu
te q
uic
k ra
tio
Year
Absolute quick ratio
Quick Ratio

Working capital management
New Horizon College
55
PROFITABILITY RATIOS
4.7 GROSS PROFIT RATIO
Gross profit is a financial metric used to assess a company's financial health and
business model by revealing the proportion of money left over from revenues
after accounting for the cost of goods sold (COGS).
It is a popular tool to evaluate the operational performance of the business.
Gross profit ratio = (Gross profit / Net sales) × 100
Year Gross profit Net sales Gross profit
ratio
Gross
profit ratio
(in
percentage)
2013-14 532999.8 1293793 0.411967 41.1 %
2014-15 471627.3 1474486 0.319859 31.9 %
2015-16 407400.3 1717079 0.237264 23.7 %
Source: balance sheet of Ambica motors
ANALYSIS
From the above table, we can observed Gross profit ratio in 2013-2014 it is
41.1%, in 2014-2015 it is decrease to 31.9%, and in 2015-2016 it is decrease to
23.7%
There is no norm or standard to interpret gross profit ratio (GP ratio). Generally,
a higher ratio is considered better.

Working capital management
New Horizon College
56
CHART NO: 4.4
GROSS PROFIT RATIO
INTERPRETATION
The chart shows that Gross profit ratio in 2013-2014 it is 41.1%, in 2014-2015 it
is decrease to 31.9%, and in 2015-2016 it is decrease to 23.7%. Therefor by
comparing all the three years ratio, the chart shows that its keep decreasing from
2013-14 to 2015-16. The ratio can be used to test the business condition by
comparing it with past years ratio. The gross profit ratio from the chart, over the
past three years is the indication that there is no improvement in this firm.
0
5
10
15
20
25
30
35
40
45
2013-14 2014-15 2015-16
41.1
31.9
23.7
Pe
rce
nta
ge (
%)
Year
Gross profit ratio
Gross profit ratio
Working capital management
New Horizon College
57
4.8 OPERATING PROFIT RATIO
Operating profit ratio is a profitability ratio that measures what
percentage of total revenues is made up by operating income. This ratio shows
what proportion of revenues is available to cover non-operating costs like
interest expense. This ratio is important to both creditors and investors because it
helps show how strong and profitable a company's operations are.
Operating profit ratio = (Operating profit / Net sales) × 100
Operating profit= Net sales - (Cost of goods sold + Administrative and
office expenses + Selling and distribution exp.)
OR
Operating profit = Net sales - Operating cost
A higher operating margin is more favorable compared with a lower ratio
because this shows that the company is making enough money from its ongoing
operations to pay for its variable costs as well as its fixed costs.
Year Operating
profit
Net sales Operating
profit ratio
Operating
profit ratio(in
percentage)
2013-14 102427.8 1293793 0.079169 7.91%
2014-15 215355.3 1474486 0.146054 14.6%
2015-16 238442 1717079 0.138865 13.88%
Source: balance sheet of Ambica motors
ANALYSIS
From the above table, we can observed operating profit ratio in 2013-2014 it is
7.91%, in 2014-2015 it is increase to 14.6%, and in 2015-2016 again it is
decrease to 13.88% . A higher operating margin is more favorable compared
with a lower ratio.

Working capital management
New Horizon College
58
CHART NO: 4.5
OPERATING PROFIT RATIO
INTERPRETATION
The chart shows that operating profit ratio in 2013-2014 it is 7.91%, in 2014-
2015 it is increase to 14.6%, and in 2015-2016 again it is decrease to 13.88%. A
higher operating margin is more favorable compared with a lower ratio. The
graph shows that last two years operating profit ratio is higher than 2013-14
year ratio. But it is also shows that 2015-16 operating profit ratio is less than
2014-15. Also 2014-15 operating ratio is highest compare to 2013-14 and 2015-
16.therefore operating profit is more favorable in 2014-15.
0
2
4
6
8
10
12
14
16
2013-14 2014-15 2015-16
7.91
14.6 13.88
Pe
rce
nta
ge (
%)
year
Operating profit ratio
Operating profit ratio

Working capital management
New Horizon College
59
4.9 NET PROFIT RATIO
It is the ratio that shows relationship between net profit after tax and net
sales. It is computed by dividing the net profit (after tax) by net sales. The
measure is commonly reported on a trend line, to judge performance over time.
It is also used to compare the results of a business with its competitors.
Net profit is not an indicator of cash flows, since net profit incorporates a
number of non-cash expenses, such as accrued expenses, amortization, and
depreciation.
The formula for the net profit ratio is to divide net profit by net sales, and then
multiply by 100. The formula is:
Net profit ratio = (Net profit / Net sales) x 100
Year Net Profit Net sales Net profit
ratio
Net profit
ratio x 100
2013-14 624187.8 1293793 0.482448 48.24%
2014-15 713099 1474486 0.483625 48.36%
2015-16 967525.8 1717079 0.563472 56.34%
Source: balance sheet of Ambica motors
ANALYSIS
From the above table, we can observed Net profit ratio in 2013-2014 it is
48.24%, in 2014-2015 it is increase to 48.36%, and in 2015-2016 again it is
increase to 56.34% .

Working capital management
New Horizon College
60
CHART NO: 4.6
NET PROFIT RATIO
INTERPRETATION
The chart shows that net profit ratio in 2013-2014 it is 48.24%, in 2014-2015 it
is increase to 48.36%, and in 2015-2016 again it is increase to 56.34%. A higher
net profit ratio is more favorable compared with a lower ratio. The graph shows
that last year net profit ratio is higher than both 2013-14 and 2014-15 year ratio.
So it is satisfactory to the society.
44.00%
46.00%
48.00%
50.00%
52.00%
54.00%
56.00%
58.00%
2013-14 2014-15 2015-16
48.24% 48.36%
56.34%
Pe
rce
nta
ge(%
)
Year
Net profit ratio
Net profit ratio

Working capital management
New Horizon College
61
ACTIVITY RATIOS
4.10 INVENTORY TURNOVER RATIO
The Inventory turnover is a measure of the number of times inventory is
sold or used in a time period such as a year. The equation for inventory turnover
equals the cost of goods sold or net sales divided by the average inventory.
Inventory turnover ratio = Cost of goods sold / Average inventory
Usually, a higher inventory turnover ratio is preferred, as it indicates that more
sales are being generated given a certain amount of inventory.
Sometimes a very high inventory ratio could result in lost sales, as there is not
enough inventory to meet demand. It is always important to compare the
inventory turnover ratio to the industry benchmark to asses if a company is
successfully managing its inventory.
Year cost of goods sold average inventory Inventory turnover
ratio
2013-14 760793.3 60952 12.48184
2014-15 1002859 78143 12.83364
2015-16 1309679 90485 14.47399
Source: balance sheet of Ambica motors
ANALYSIS
From the above table, we can observed Inventory turnover ratio in 2013-2014 it
is 12.48, in 2014-2015 it is increase to 12.83, and in 2015-2016 again it is
increase and reached to 14.47. Last year (2015-16) inventory ratio is higher,
satisfactory to the society.
Working capital management
New Horizon College
62
CHART NO: 4.7
INVENTORY TURNOVER RATIO
INTERPRETATION
The chart shows that inventory turnover ratio in 2013-2014 it is 12.48, in 2014-
2015 it is increase to 12.83 and in 2015-2016 again it is increase to 14.47. A
higher inventory turnover ratio is more favorable compared with a lower ratio.
The graph shows that last year net profit ratio is higher than both 2013-14 and
2014-15 year ratio. So it is satisfactory to the society.
11
11.5
12
12.5
13
13.5
14
14.5
2013-14 2014-15 2015-16
12.48184227
12.833635
14.47398674
Inve
nto
ry t
ue
rove
r ra
tio
Year
Inventory turnover ratio
Inventory turnover ratio

Working capital management
New Horizon College
63
4.11 FIXED ASSETS TURNOVER RATIO
Fixed-asset turnover is the ratio of sales to the value of fixed assets. It
indicates how well the business is using its fixed assets to generate sales. This
ratio measures the efficiency with which a firm is utilizing its fixed assets in
generating sales.
Fixed assets turnover ratio = Net sales / Fixed assets (Net)
Year Net sales fixed assets fixed assets
turnover ratio
2013-14 1293793 929879 1.391356
2014-15 1474486 1288061 1.144733
2015-16 1717079 1267558 1.354635
Source: balance sheet of Ambica motors
ANALYSIS
From the above table, we can observed Fixed-asset turnover ratio in 2013-2014
it is 1.39, in 2014-2015 it is decrease to 1.14, and in 2015-2016 again it is
increase and reached to 1.35.
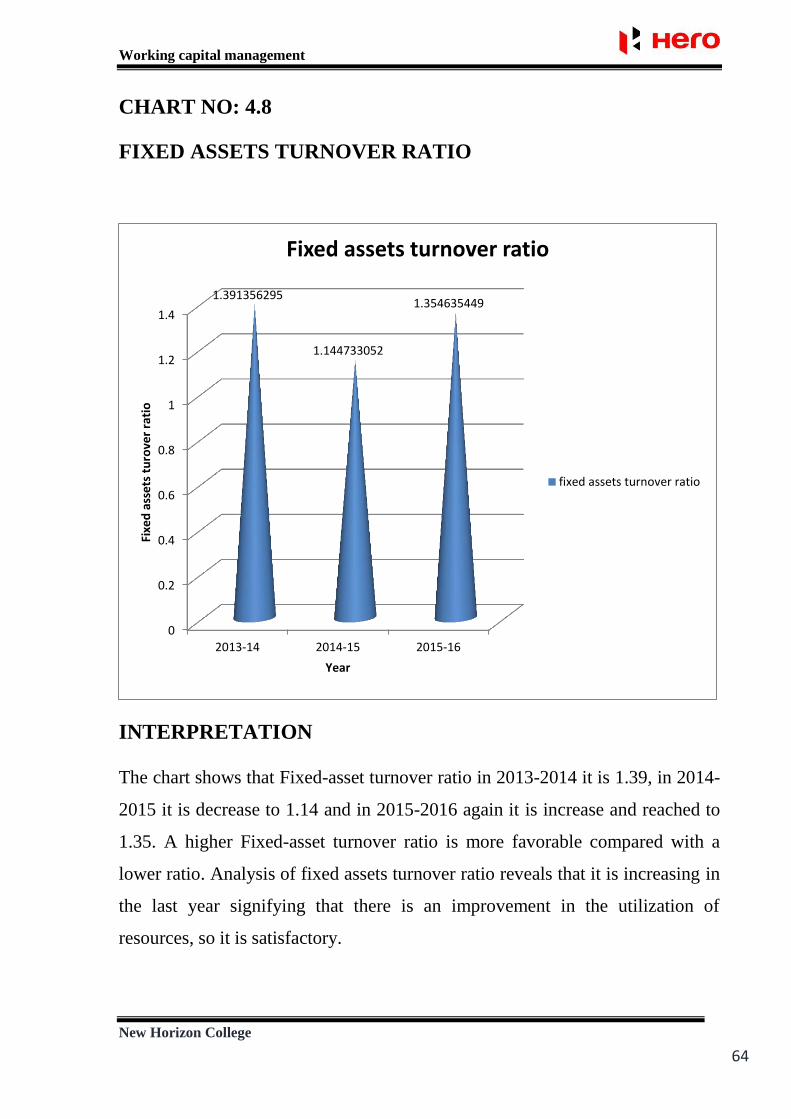
Working capital management
New Horizon College
64
CHART NO: 4.8
FIXED ASSETS TURNOVER RATIO
INTERPRETATION
The chart shows that Fixed-asset turnover ratio in 2013-2014 it is 1.39, in 2014-
2015 it is decrease to 1.14 and in 2015-2016 again it is increase and reached to
1.35. A higher Fixed-asset turnover ratio is more favorable compared with a
lower ratio. Analysis of fixed assets turnover ratio reveals that it is increasing in
the last year signifying that there is an improvement in the utilization of
resources, so it is satisfactory.
0
0.2
0.4
0.6
0.8
1
1.2
1.4
2013-14 2014-15 2015-16
1.391356295
1.144733052
1.354635449
Fixe
d a
sse
ts t
uro
ver
rati
o
Year
Fixed assets turnover ratio
fixed assets turnover ratio

Working capital management
New Horizon College
65
4.12 CURRENT ASSETS TURNOVER RATIO
Current assets turnover ratio is the relationship between sales or cost of
goods sold and current assets employed in the business. This ratio measures the
efficiency with which a firm is utilizing its current assets in generating sales.
Current assets turnover ratio = (Net sales / Current asset)
Year Net sales Current assets Current assets
turnover ratio
2013-14 1293793 1220002 1.060484
2014-15 1474486 1307987 1.127294
2015-16 1717079 2089140 0.821907
Source: balance sheet of Ambica motors
ANALYSIS
From the above table, we can observed current asset turnover ratio in 2013-2014
it is 1.06, in 2014-2015 it is increase to 1.12, and in 2015-2016 it is decrease to
0.82.

Working capital management
New Horizon College
66
CHART NO: 4.9
CURRENT ASSETS TURNOVER RATIO
INTERPRETATION
The chart shows that current asset turnover ratio in 2013-2014 it is 1.06, in
2014-2015 it is increase to 1.12, and in 2015-2016 it is decrease to 0.82.
Analysis of current assets turnover ratio reveals that it is increasing during
2014-15 and a decreasing in the 2015-16. A higher ratio is always more
favorable. Higher turnover ratios mean the company is using its assets more
efficiently. This chart shows that the company isn't using its assets efficiently.
0
0.2
0.4
0.6
0.8
1
1.2
2013-14 2014-15 2015-16
1.060483979
1.127294337
0.821907293
Cu
rre
nt
asse
ts t
turn
ove
r ra
tio
Year
Current assets turnover ratio
Current assets turnover ratio
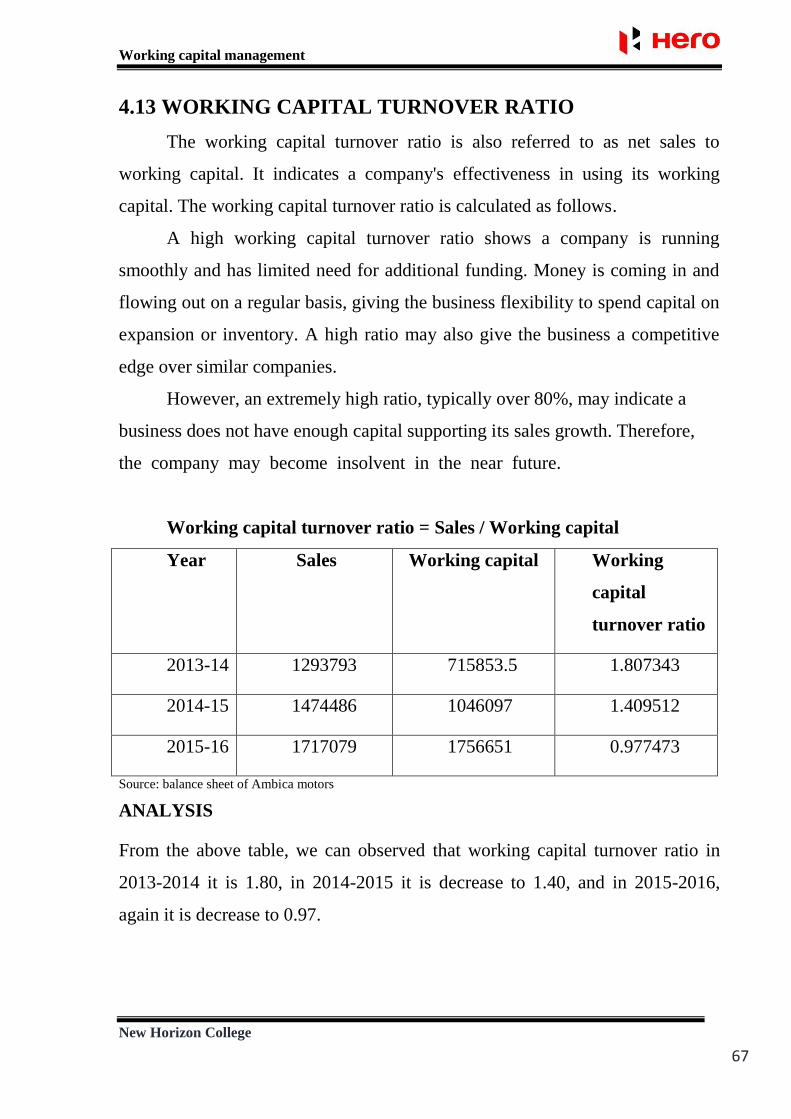
Working capital management
New Horizon College
67
4.13 WORKING CAPITAL TURNOVER RATIO
The working capital turnover ratio is also referred to as net sales to
working capital. It indicates a company's effectiveness in using its working
capital. The working capital turnover ratio is calculated as follows.
A high working capital turnover ratio shows a company is running
smoothly and has limited need for additional funding. Money is coming in and
flowing out on a regular basis, giving the business flexibility to spend capital on
expansion or inventory. A high ratio may also give the business a competitive
edge over similar companies.
However, an extremely high ratio, typically over 80%, may indicate a
business does not have enough capital supporting its sales growth. Therefore,
the company may become insolvent in the near future.
Working capital turnover ratio = Sales / Working capital
Year Sales Working capital Working
capital
turnover ratio
2013-14 1293793 715853.5 1.807343
2014-15 1474486 1046097 1.409512
2015-16 1717079 1756651 0.977473
Source: balance sheet of Ambica motors
ANALYSIS
From the above table, we can observed that working capital turnover ratio in
2013-2014 it is 1.80, in 2014-2015 it is decrease to 1.40, and in 2015-2016,
again it is decrease to 0.97.

Working capital management
New Horizon College
68
CHART NO: 4.10
WORKING CAPITAL TURNOVER RATIO
INTERPRETATION
The chart shows that working capital turnover ratio in 2013-2014 it is 1.80,
in 2014-2015 it is decrease to 1.40, and in 2015-2016, again it is decrease to
0.97. A low ratio shows that this business is investing in too many accounts
receivable (AR) and inventory assets for supporting its sales. This may lead to
an excessive amount of bad debts and obsolete inventory. This chart shows that
the company isn't using its working capital efficiently, so it isn‘t satisfactory.
0
0.2
0.4
0.6
0.8
1
1.2
1.4
1.6
1.8
2
2013-14 2014-15 2015-16
1.807343338
1.409512142
0.977473317
wo
rkin
g ca
pit
al t
urn
ove
r ra
tio
year
working capital turnover ratio
working capital turnover ratio

Working capital management
New Horizon College
69
5. FINDINGS, SUGGESTIONS & CONCLUSION
5.1 FINDINGS
The end result of the statement of changes in working capital after
comparing all the increases and decreases is the net increase in the amount of
working capital is Rs.348007.7 during year 2013-14.
The end result of the statement of changes in working capital after
comparing all the increases and decreases is the net increase in the amount of
working capital is Rs.667550.8 during year 2014-15.
The end result of the statement of changes in working capital after
comparing all the increases and decreases is the net increase in the amount of
working capital is Rs.11176679 during year 2015-16.
Current ratio in 2013-2014 is 2.41, in 2014-2015 it is 4.99 and in 2015-2016
it is 6.28. The current ratio of all the above three years is above the standard
current ratio, which is 2:1.
Liquid or quick ratio in 2013-2014 is 2.29, in 2014-2015 it is 4.64, and in
2015-2016 it is 6.04. The Liquid or quick ratio of all the above three years is
above the standard liquid or quick ratio, which is 1:1.
Absolute quick ratio in 2013-2014 is 4.23, in 2014-2015 it is 9.33, and in
2015-2016 it is 11.05. The Absolute quick ratio of all the above three years is
above the standard absolute quick ratio, which is 0.5:1 or 2:1.
Gross profit ratio in 2013-2014 it is 41.1%, in 2014-2015 it is decrease to
31.9%, and in 2015-2016 it is decrease to 23.7%. Comparing all the three
years ratio, the chart shows that its keep decreasing from 2013-14 to 2015-
16. That indicates there is no improvement in this firm.
Operating profit ratio in 2013-2014 it is 7.91%, in 2014-2015 it is increase to
14.6%, and in 2015-2016 again it is decrease to 13.88%. A higher operating
margin is more favorable compared with a lower ratio.

Working capital management
New Horizon College
70
Net profit ratio in 2013-2014 it is 48.24%, in 2014-2015 it is increase to
48.36%, and in 2015-2016 again it is increase to 56.34%. A higher net profit
ratio is more favorable compared with a lower ratio.
Inventory turnover ratio in 2013-2014 it is 12.48, in 2014-2015 it is increase
to 12.83 and in 2015-2016 again it is increase to 14.47. A higher inventory
turnover ratio is more favorable compared with a lower ratio.
Fixed-asset turnover ratio in 2013-2014 it is 1.39, in 2014-2015 it is decrease
to 1.14 and in 2015-2016 again it is increase and reached to 1.35. A higher
Fixed-asset turnover ratio is more favorable compared with a lower ratio.
Current asset turnover ratio in 2013-2014 it is 1.06, in 2014-2015 it is
increase to 1.12, and in 2015-2016 it is decrease to 0.82. Analysis of current
assets turnover ratio reveals that it is increasing during 2014-15 and a
decreasing in the 2015-16. A higher ratio is always more favorable.
Working capital turnover ratio in 2013-2014 it is 1.80, in 2014-2015 it is
decrease to 1.40, and in 2015-2016, again it is decrease to 0.97. it shows that
the company isn't using its working capital efficiently, so it isn‘t satisfactory.
Working capital management
New Horizon College
71
5.2 SUGGESTIONS
The company should concentrate on the current ratio by utilizing current asset
for productive purpose in order to achieve the standard ratio.
The society should take necessary steps to make use of the quick asset for the
development of the society and should balance with the standard ratio.
Current assets turnover ratio is fluctuating. It‘s not good for society so in order
to increase the current assets turnover ratio a society need to increase its sales.
Gross profit ratio is not stable. So in order to increase the gross profit the society
wants to increase the production.
The working capital turnover ratio is decreasing year by year. It is not good for
the society so in order to increase the working capital turnover the society needs
to increase its sales.
Working capital management
New Horizon College
72
5.3 CONCLUSION
The study conducted on working capital management at ―AMBICA
MOTORS Hero MotoCorp Ltd.” gives a view of assessing the performance
of working capital management of the society by analyzing the financial data
with the help of ratio analysis.
During the period of study, there were a few up and downs in the working
capital and ratio analysis it will affect the operations of the society but it is
observed that the overall financial position is good. The AMBICA MOTORS
Hero MotoCorp Ltd. resources utilization has been very low. The society has to
take necessary steps to utilize current asset for improve profitability. It is
anticipated that the profitability will improve in the coming years.
Based on the analysis and interpretation I tried to give my findings and
suggestions for the company as per my best knowledge.

Working capital management
New Horizon College
73
BIBLIOGRAPHY
BOOKS
I.M. Pandey, ―Financial Management‖, 10/e, Vikas Publishing House, Pvt.
Ltd, New, Delhi.
M.Y. Khan and P.K. Jain, ―Financial Management‖, 7/e , Tata M C Graw
Hill publishing company ltd, New Delhi.
Dr. R Thirumal, ―Financial and Management Accounting‖, Thakur
publishers, Chennai.
WEBSITE
https://en.wikipedia.org/wiki/hero_motocrop#company_timeline
https://en.wikipedia.org/wiki/Automotive_industry
http://www.heromotocorp.com/en-in/about-us/key-policies.html
http://www.investopedia.com/terms/w/workingcapitalturnover.asp
http://www2.aku.edu.tr/~icaga/kitaplar/working-capital-management.pdf