Progress in Organic Coatings - scientificnovelcoatings.com/wp-content/uploads/a-7.pdfProgress in...
7
Progress in Organic Coatings 77 (2014) 1688–1694 Contents lists available at ScienceDirect Progress in Organic Coatings j o ur nal ho me pag e: www.elsevier.com/locate/porgcoat The impact of baking conditions on physico-chemical characteristics influencing topography and appearance aspects of polyurethane coatings H. Yazdani Ahmadabadi a , S. Rastegar a,∗ , Z. Ranjbar b,c , A. Allahdini a a Faculty of Polymer Engineering and Color Technology, Amirkabir University of Technology, Hafez Street, Tehran, Iran b Department of Surface Coatings and Corrosion, Institute for Color Science and Technology, No. 55, Vafamanesh Street, Hossein Abad Square, Pasdaran, Tehran, Iran c Center of Excellence for Color Science and Technology, Tehran, Iran a r t i c l e i n f o Article history: Received 18 November 2013 Received in revised form 11 May 2014 Accepted 15 May 2014 Available online 12 August 2014 Keywords: Polyurethane electro-coating Baking conditions Cross-linking Cure shrinkage Specular gloss Color difference a b s t r a c t The appearance aspects of an electrodeposited polyurethane-based coating as a function of baking con- dition were investigated. Specular gloss and color was measured as a mean to trace the changes of the surface topography due to baking conditions. Atomic force microscopy combined with FTIR spectroscopic investigations showed that the shrinkage occurred due to the high baking temperature results in surface roughness. Films baked at higher temperature form higher-T g networks. The color was changed to yellow as the baking temperature was raised. © 2014 Elsevier B.V. All rights reserved. 1. Introduction Polyurethane coatings are used in a large variety of industrial and commercial applications (such as organic coatings, adhesives, sealant, fibers, foams and elastomeric products) due to their good flexibility, water resistance, pH stability, superior solvent resis- tance and good mechanical properties [1–5]. Despite all good characteristics, poor UV resistance is a big limitation for the aro- matic polyurethanes which has been studied by several researchers in recent years. Introducing nano materials into the urethane struc- ture is one of the new methods to solve this problem [4]. Also, the thermal decomposition of polyurethane coatings at high temperatures is a great concern, and furthermore the decomposition reactions and the mechanical properties of the rearranged structure have been studied by many authors [6–9]. One of the major application fields of urethane structures is in automotive cathodic electro-coatings as the first organic pro- tective layer on the car bodies. A typical automotive coating system includes an inorganic conversion coating, the cathodic electro-coating, a primer surfacer, base coat and the clear coat, ∗ Corresponding author. Tel.: +98 21 64542481; +98 21 66468243. E-mail address: [email protected] (S. Rastegar). respectively. Urethane structure of a cataphretic electro-coating is formed by the reaction of a polyol (normally epoxy-based) and a de-blocked polyisocyanate as the cross-linking agent [10]. Electrochemical deposition of materials on the metallic sub- strates warrants the high corrosion resistance and good adhesion of the primer for long time service life due to the high throwing power, a highly cross-linked urethane structure and an excel- lent saponification resistance. Basic characteristics of the adducted group (amine) catalyze the reaction of the polyol (adducted epoxy) and polyisocyanate. As the reaction proceeds, a highly cross-linked urethane network (HCUN) is formed which is responsible for the corrosion protection of the car bodies. Electro-deposition process is a complex application method due to the combination of electrical and chemical phenomena [11]. In this process, mass transfer happens via three steps of migration, convection and diffusion [12]. In the paint bath, firstly, colloidal micelles (positively charged epoxy-amine adduct and pigment par- ticles) move toward the cathode surface (convection step), after that the colloidal particles penetrate to the alkaline boundary layer. Establishing of the alkaline boundary layer close to the cathode sur- face persists just a few seconds (diffusion step) [10]. And finally a uniform compact layer is formed on the surface of the cathode and its recessed area [11]. http://dx.doi.org/10.1016/j.porgcoat.2014.05.011 0300-9440/© 2014 Elsevier B.V. All rights reserved.
Transcript of Progress in Organic Coatings - scientificnovelcoatings.com/wp-content/uploads/a-7.pdfProgress in...

Tip
Ha
b
Tc
a
ARRAA
KPBCCSC
1
asfltcmit
adrOatse
h0
Progress in Organic Coatings 77 (2014) 1688–1694
Contents lists available at ScienceDirect
Progress in Organic Coatings
j o ur nal ho me pag e: www.elsev ier .com/ locate /porgcoat
he impact of baking conditions on physico-chemical characteristicsnfluencing topography and appearance aspects ofolyurethane coatings
. Yazdani Ahmadabadia, S. Rastegara,∗, Z. Ranjbarb,c, A. Allahdinia
Faculty of Polymer Engineering and Color Technology, Amirkabir University of Technology, Hafez Street, Tehran, IranDepartment of Surface Coatings and Corrosion, Institute for Color Science and Technology, No. 55, Vafamanesh Street, Hossein Abad Square, Pasdaran,ehran, IranCenter of Excellence for Color Science and Technology, Tehran, Iran
r t i c l e i n f o
rticle history:eceived 18 November 2013eceived in revised form 11 May 2014ccepted 15 May 2014vailable online 12 August 2014
a b s t r a c t
The appearance aspects of an electrodeposited polyurethane-based coating as a function of baking con-dition were investigated. Specular gloss and color was measured as a mean to trace the changes of thesurface topography due to baking conditions. Atomic force microscopy combined with FTIR spectroscopicinvestigations showed that the shrinkage occurred due to the high baking temperature results in surfaceroughness. Films baked at higher temperature form higher-Tg networks. The color was changed to yellowas the baking temperature was raised.
eywords:olyurethane electro-coatingaking conditionsross-linkingure shrinkage
© 2014 Elsevier B.V. All rights reserved.
pecular glossolor difference
. Introduction
Polyurethane coatings are used in a large variety of industrialnd commercial applications (such as organic coatings, adhesives,ealant, fibers, foams and elastomeric products) due to their goodexibility, water resistance, pH stability, superior solvent resis-ance and good mechanical properties [1–5]. Despite all goodharacteristics, poor UV resistance is a big limitation for the aro-atic polyurethanes which has been studied by several researchers
n recent years. Introducing nano materials into the urethane struc-ure is one of the new methods to solve this problem [4].
Also, the thermal decomposition of polyurethane coatingst high temperatures is a great concern, and furthermore theecomposition reactions and the mechanical properties of theearranged structure have been studied by many authors [6–9].ne of the major application fields of urethane structures is inutomotive cathodic electro-coatings as the first organic pro-
ective layer on the car bodies. A typical automotive coatingystem includes an inorganic conversion coating, the cathodiclectro-coating, a primer surfacer, base coat and the clear coat,∗ Corresponding author. Tel.: +98 21 64542481; +98 21 66468243.E-mail address: [email protected] (S. Rastegar).
ttp://dx.doi.org/10.1016/j.porgcoat.2014.05.011300-9440/© 2014 Elsevier B.V. All rights reserved.
respectively. Urethane structure of a cataphretic electro-coatingis formed by the reaction of a polyol (normally epoxy-based)and a de-blocked polyisocyanate as the cross-linking agent[10].
Electrochemical deposition of materials on the metallic sub-strates warrants the high corrosion resistance and good adhesionof the primer for long time service life due to the high throwingpower, a highly cross-linked urethane structure and an excel-lent saponification resistance. Basic characteristics of the adductedgroup (amine) catalyze the reaction of the polyol (adducted epoxy)and polyisocyanate. As the reaction proceeds, a highly cross-linkedurethane network (HCUN) is formed which is responsible for thecorrosion protection of the car bodies.
Electro-deposition process is a complex application method dueto the combination of electrical and chemical phenomena [11]. Inthis process, mass transfer happens via three steps of migration,convection and diffusion [12]. In the paint bath, firstly, colloidalmicelles (positively charged epoxy-amine adduct and pigment par-ticles) move toward the cathode surface (convection step), afterthat the colloidal particles penetrate to the alkaline boundary layer.
Establishing of the alkaline boundary layer close to the cathode sur-face persists just a few seconds (diffusion step) [10]. And finally auniform compact layer is formed on the surface of the cathode andits recessed area [11].
H.Y. Ahmadabadi et al. / Progress in Organic Coatings 77 (2014) 1688–1694 1689
5
10
15
20
25
30
35
360
Refle
ctan
ce %
460 560wave len g
0 66gth(n m)
60
OB2
OB1
NB
UB
760
tleuaa
pTc
toc[l[tosp
wta
Table 1Bath parameters of the cathodic electro-coatings.
PBR 0.15Conductivity (mS/cm) 1.4 ± 0.2
Fig. 1. The spectral reflectance of electro-coatings baked at different conditions.
In an automotive paint shop, a CED-coated car body is passedhrough different baking zones. Sometimes occurrence of a prob-em in the temperature control unit causes a change in the thermalnergy transferred to the coated body. Furthermore, the coatingndergoes a thermal gradient. These additional thermal energiesffect especially the electrodeposited film as the first organic layerpplied on the body.
It has been assumed that thermal decomposition of rigidolyurethanes results in formation of polyols and polyisocyanates.hen, at low temperatures the polyol is decomposed resulting inreating volatile products [13].
Several thermo-gravimetric methods have been used to inves-igate the thermal decomposition of polymers. Systematic studyn kinetics of thermal decomposition of polymeric materials espe-ially polyurethanes have been carried out by various researchers14,15]. Both isothermal and dynamic techniques have been uti-ized. A dynamic approach has been proposed by Fambri et al.16] for investigation of non-oxidative degradation of polyurethanehrough which activation energies and reaction orders have beenbtained. Isothermal kinetic measurements are essential for under-tanding the thermal degradation of polymeric materials speciallyolyurethanes.
In this research, the thermal sensitivity of polyurethane coatingsas elucidated and it was tried to find a relationship between
he thermal history, coating morphology and topography and itsppearance.
Fig. 2. Relative color situation of the samples in CIELAB color space.
pH 5.7 ± 0.2Temperature (◦C) 30 ± 2
2. Experimental
2.1. Materials and procedures
A commercial two-component cathodic electro-coating (water-borne resin dispersion and pigment paste) was kindly supplied byBASF Co. (Germany). The binder is composed of an epoxy-polyolamine adduct which is cross-linked by a blocked isocyanate. Bathparameters are presented in Table 1.
Electro-deposition process was performed on galvanized steelpanels of 200 mm × 100 mm × 0.8 mm pre-treated by a tri-cationicphosphating process. Samples were dipped in the electro-deposition bath for two minutes and a voltage of 260 V wasapplied by a DC power supply (400 V, 200 mA, ImanTablo, Iran) toobtain a dry film thickness of 20 �m. The electro-deposited filmswere then exposed to different curing conditions (150 ◦C/15 min,160 ◦C/20 min, 185 ◦C/35 min and 195 ◦C/20 min). The cure sched-ule was chosen based on the baking window provided by CEDsupplier. The reason of choosing the present baking conditions wasto cure the coatings at the extreme conditions of under-bakingand over-baking and comparing the appearance of the baked filmswith normal baking conditions recommended by the paint supplier.The curing oven was an electrically heated lab oven (Memmert,Germany). The panels were placed in the same location inside theoven to obtain a reproducible curing condition.
2.2. Testing methods
2.2.1. Differential scanning calorimetry (DSC)A Mettler Toledo DSC calibrated with an indium reference sam-
ple was used to determine the glass transition temperature of theelectro-coatings. The samples weighed around 4–5 mg and N2 gaswas purged into the instrument atmosphere. Dynamic scans wereperformed at 10 ◦C/min on the prepared samples during the mea-surement. The samples notations, given in Table 2, are based ontheir curing conditions.
2.2.2. SpectrophotometryA CE 741 GL spectrophotometer was employed to obtain the
spectral reflectance curve of the samples and their colorimetricmeasurements by a 10 nm wavelength step.
0
2345678910
Col
or d
iffer
ence
01234567890
UBB-NB OB1-Curing co
-NBondition
OB2-NBB
Fig. 3. Color difference between the samples baked at different conditions and thenormal-baked sample.

1690 H.Y. Ahmadabadi et al. / Progress in Organic Coatings 77 (2014) 1688–1694
F he refv
2
at
2
Tst
2
ufiuo
2
as
2
b
TD
according to ASTM D4752 was performed. A MEK impregnated fab-ric was rubbed against the surface of the baked electro-coatings.Visual inspection of the rubbed films and the fabric were then
0.7
0.75
0.8
0.85
bsor
banc
e
OB2UB
ig. 4. Mechanism of polyurethane thermal degradation [6]. (For interpretation of tersion of this article.)
.2.3. Gloss measurementTo measure the specular gloss of electro-coatings, an Erichsen 3-
ngle instrument at 60◦ measurement angle was utilized accordingo ASTM D523.
.2.4. Atomic force microscope (AFM)To evaluate the surface topology of electro-coatings, an Ambios
echnologies USPM instrument was employed in tapping mode. Ailicon cantilever at a resonant frequency of 180 kHz was used forhis purpose.
.2.5. Scanning electron microscope (SEM)A Scanning Electron Microscope (LEO 1455VP, England) was also
sed to image the morphology of the surface and the bulk of thelms. For this purpose a scratch was made on the coating surfacesing a keen cutter and the image was taken from the upper edgef the scratch.
.2.6. Fourier transform-infrared spectroscopy (FT-IR)Chemical characterization of specimens was carried out using
Bomem FT-IR instrument. Suitable amounts of electro-coatingamples were mixed with KBr powder and then pressed.
.2.7. Thermo-gravimetric analysis (TGA)By employing a Perkin-Elmer Pyris Diamond TGA the thermal
ehavior of the electro-coatings was isothermally characterized.
able 2ifferent curing conditions and samples’ notations.
Curing conditions Sample code
150 ◦C, 15 min UB160 ◦C, 20 min NB185 ◦C, 35 min OB1195 ◦C, 20 min OB2
erences to color in text near the reference citation, the reader is referred to the web
3. Results and discussion
3.1. Degree of curing
To investigate the state of curing of the electro-coatings bakedat different conditions, methyl ethyl ketone (MEK) rub-out test
0 1000 2000 3000 4000 5000Wavenumber (cm-1)
0.55
0.6
0.65
A
Fig. 5. Normalized FT-IR spectra for UB and OB2 samples.

H.Y. Ahmadabadi et al. / Progress in Organic Coatings 77 (2014) 1688–1694 1691
F
ci
c
3
c
Table 3Color values of the electro-coatings baked at different conditions.
L* a* b*
UB 60.3 −1.15 −3.19
electro-coating is much more significant compared to the under-
ig. 6. Specular gloss values of the electro-coatings baked at different conditions.
arried out and the complete or partial removal of the coating wasnspected.
The sample UB was observed to contaminate the MEK-soakedloth, which is an evidence for insufficient curing of the sample.
.2. Color measurement
Fig. 1 illustrates the reflected light spectrum for the electro-oatings prepared at different baking conditions.
Fig. 7. Surface topology images of polyurethane electro-coatings bak
NB 60.51 −1.2 −3.04OB1 57.14 −2.51 2.5OB2 57.63 −2.62 5
As shown in Fig. 1, the under-baked and the normal-bakedelectro-coatings displayed the maximum reflectance at blue region(380–450 nm) while the samples baked at higher temperaturesshow a maximum reflectance at green-yellow wavelength.
Fig. 2 schematically shows the color coordinates of each samplein the CIE LAB color space. It could be observed that the a* valueis positive for all the samples, while b* changes from negative topositive by increasing the curing temperature.
This change is visually observed by a color shift toward yellow byincreasing the curing temperature. As Fig. 2 shown, the over-bakedelectro-coatings are green-yellow while blue tone was observed forthe under-baked electro-coating.
Table 3 represents the color coordinates of the electro-coatingson the basis of the CIE LAB color space.
Fig. 3 represents the value of color difference between eachsample and the normal baked one (as the reference sample) inaccordance to the CIE LAB 1976 color difference formula. The colordifference between the over-baked coating and the normal-baked
baked case.Curing at high temperatures may cause the chemical struc-
ture of the polyurethane electro-coatings to be changed to a urea
ed at different conditions: (a) UB, (b) NB, (c) OB1, and (d) OB2.
1692 H.Y. Ahmadabadi et al. / Progress in Organic Coatings 77 (2014) 1688–1694
nt con
stiiau
pt
bpcccfiiast
bDTs
fncsh
roughness for the coatings baked at various baking conditions.The surface roughness of electro-coating baked at high tempera-ture would be higher due to the cure shrinkage. Fig. 7 illustratessurface topology of the polyurethane electro-coatings baked at
Table 4The absorbance intensities of vibration peaks of the polyurethane electro-coatingsbaked at lowest and highest temperature.
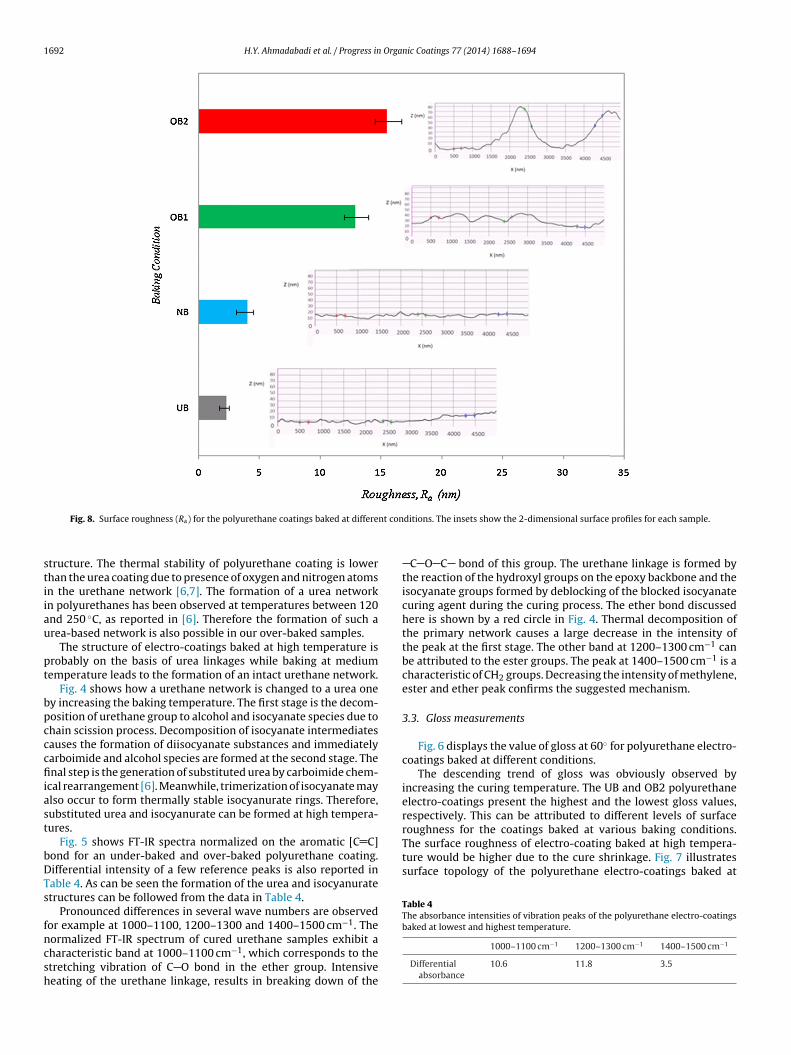
Fig. 8. Surface roughness (Ra) for the polyurethane coatings baked at differe
tructure. The thermal stability of polyurethane coating is lowerhan the urea coating due to presence of oxygen and nitrogen atomsn the urethane network [6,7]. The formation of a urea networkn polyurethanes has been observed at temperatures between 120nd 250 ◦C, as reported in [6]. Therefore the formation of such area-based network is also possible in our over-baked samples.
The structure of electro-coatings baked at high temperature isrobably on the basis of urea linkages while baking at mediumemperature leads to the formation of an intact urethane network.
Fig. 4 shows how a urethane network is changed to a urea oney increasing the baking temperature. The first stage is the decom-osition of urethane group to alcohol and isocyanate species due tohain scission process. Decomposition of isocyanate intermediatesauses the formation of diisocyanate substances and immediatelyarboimide and alcohol species are formed at the second stage. Thenal step is the generation of substituted urea by carboimide chem-
cal rearrangement [6]. Meanwhile, trimerization of isocyanate maylso occur to form thermally stable isocyanurate rings. Therefore,ubstituted urea and isocyanurate can be formed at high tempera-ures.
Fig. 5 shows FT-IR spectra normalized on the aromatic [C C]ond for an under-baked and over-baked polyurethane coating.ifferential intensity of a few reference peaks is also reported inable 4. As can be seen the formation of the urea and isocyanuratetructures can be followed from the data in Table 4.
Pronounced differences in several wave numbers are observedor example at 1000–1100, 1200–1300 and 1400–1500 cm−1. The
ormalized FT-IR spectrum of cured urethane samples exhibit aharacteristic band at 1000–1100 cm−1, which corresponds to thetretching vibration of C O bond in the ether group. Intensiveeating of the urethane linkage, results in breaking down of theditions. The insets show the 2-dimensional surface profiles for each sample.
C O C bond of this group. The urethane linkage is formed bythe reaction of the hydroxyl groups on the epoxy backbone and theisocyanate groups formed by deblocking of the blocked isocyanatecuring agent during the curing process. The ether bond discussedhere is shown by a red circle in Fig. 4. Thermal decomposition ofthe primary network causes a large decrease in the intensity ofthe peak at the first stage. The other band at 1200–1300 cm−1 canbe attributed to the ester groups. The peak at 1400–1500 cm−1 is acharacteristic of CH2 groups. Decreasing the intensity of methylene,ester and ether peak confirms the suggested mechanism.
3.3. Gloss measurements
Fig. 6 displays the value of gloss at 60◦ for polyurethane electro-coatings baked at different conditions.
The descending trend of gloss was obviously observed byincreasing the curing temperature. The UB and OB2 polyurethaneelectro-coatings present the highest and the lowest gloss values,respectively. This can be attributed to different levels of surface
1000–1100 cm−1 1200–1300 cm−1 1400–1500 cm−1
Differentialabsorbance
10.6 11.8 3.5
Organic Coatings 77 (2014) 1688–1694 1693
dtaifr
tteca(rtftsvchittstcscwspu
icof
50
60
70
80
90
100
110
140 150 160 170 180 190 200
T g(˚
C)
Baking Temper atu re (˚C)
H.Y. Ahmadabadi et al. / Progress in
ifferent baking conditions. As shown in this figure, by increasinghe baking temperature, the surface of coating becomes roughernd due to this roughness the diffusivity of the surface reflectances increased. Using AFM images, the values of surface roughnessor the polyurethane electro-coatings were measured which areeported in Fig. 8.
The cross-linking density of a thermosetting system is a func-ion of curing temperature [17,18]. In this system, curing atemperatures below 160 ◦C for less than 20 min, do not supplynough energy for the de-blocking process of the blocked iso-yanates. Therefore the reaction does not progress to completionnd a weak network (if any) will be formed. At normal situation160 ◦C/20 min), curing reactions are completely performed and theesult is a highly cross-linked urethane structure. Glass transitionemperature (Tg) of the baked films can be used as a good indicatoror the extent of the progress of the curing process [19–22]. DMTA ishe most suitable technique for determining the cross-linking den-ity of polymer networks. The electrodeposition coatings adhereery well to the substrate surface and therefore measuring theirrosslinking density using DMTA is extremely difficult. On the otherand, due to very high chemical resistance of baked electrocoat-
ng films, swelling methods are also not possible to be used forhe determination of cross-link density in these coatings. Based onhe generally accepted idea of the correlation of cross-link den-ity and segmental motion in polymeric networks, glass transitionemperature of the electrocoatings can be used as a measure toharacterize their relative cross-link density. In other words, in apecific electrocoating film, the higher glass transition temperaturean be resulted from a higher degree of cross-linking. In this report,e have used Tg values of the baked coatings only as a measure to
how their relative cross-link density and we would not intend toresent a quantitative description of the network cross-linking bysing their Tg value.
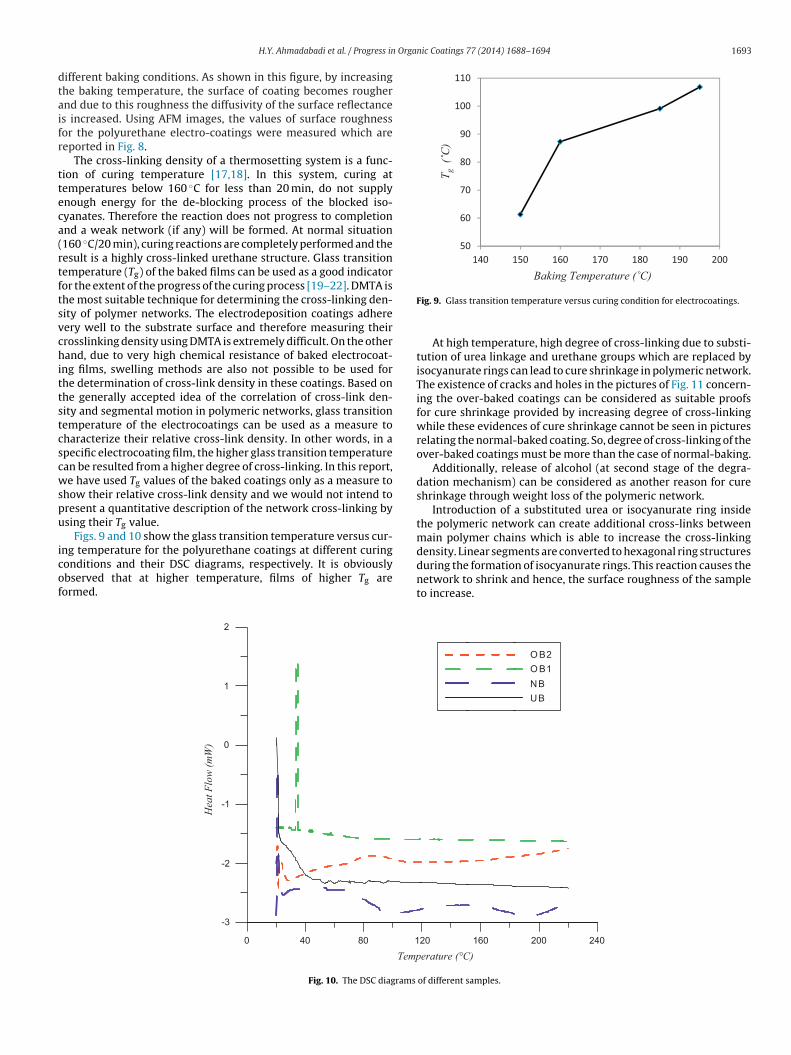
Figs. 9 and 10 show the glass transition temperature versus cur-
ng temperature for the polyurethane coatings at different curingonditions and their DSC diagrams, respectively. It is obviouslybserved that at higher temperature, films of higher Tg areormed.-3
-2
-1
0
1
2
Hea
t Flo
w (m
W)
0 40 80
Temp1
Fig. 10. The DSC diagrams
Fig. 9. Glass transition temperature versus curing condition for electrocoatings.
At high temperature, high degree of cross-linking due to substi-tution of urea linkage and urethane groups which are replaced byisocyanurate rings can lead to cure shrinkage in polymeric network.The existence of cracks and holes in the pictures of Fig. 11 concern-ing the over-baked coatings can be considered as suitable proofsfor cure shrinkage provided by increasing degree of cross-linkingwhile these evidences of cure shrinkage cannot be seen in picturesrelating the normal-baked coating. So, degree of cross-linking of theover-baked coatings must be more than the case of normal-baking.
Additionally, release of alcohol (at second stage of the degra-dation mechanism) can be considered as another reason for cureshrinkage through weight loss of the polymeric network.
Introduction of a substituted urea or isocyanurate ring insidethe polymeric network can create additional cross-links betweenmain polymer chains which is able to increase the cross-linkingdensity. Linear segments are converted to hexagonal ring structures
during the formation of isocyanurate rings. This reaction causes thenetwork to shrink and hence, the surface roughness of the sampleto increase.erature (°C)20 160 200
O B2O B1NBU B
240
of different samples.

1694 H.Y. Ahmadabadi et al. / Progress in Organic Coatings 77 (2014) 1688–1694
Fig. 11. The pictures of the normal- and ov
0
1
2
3
4
5
6
2120
2130
2140
2150
2160
2170
2180
2190
2200
2210
4035302520151050
dm/d
t (m
g/m
in)
Wei
ght (
mg)
Time (min)
Fm
mtfr1tsfiit
4
ptie
[[[[[
[
[
[
[[[
ig. 12. TG signal versus temperature of normal cured urethane sample at isother-al temperature 195 ◦C.
As mentioned above, the structural variation of polyurethaneaterials was made by changing the urethane segments converting
o urea groups and isocyanurate rings and also along this trans-ormation some volatile products like alcohols are decomposedesulting in losing weight. In Fig. 12, isothermal thermograph at95 ◦C concerning the normal-baked sample is plotted. The aim ofhis work was that the losing weight of the over-baked sample ishown upon curing. As can be seen, after about 15 min the bakedlm start to exhibit loss and the maximum rate of the weight loss
s observed after 17 min at 195 ◦C. This weight loss can be assignedo release of alcohols from the films (as shown in Fig. 4).
. Conclusion
The effect of curing conditions on the appearance of a
olyurethane-based electro-coating was studied. It was found thathe specular gloss of polyurethane electro-coatings is decreased byncreasing the curing temperature. The color of the polyurethanelectro-coatings is also dependent on curing conditions and varies[
[
er-baked coatings obtained by SEM.
from blue-green for the electro-coatings baked at low and mediumtemperature to a green-yellow for the coatings baked at high tem-peratures.
AFM investigations show an increase in roughness of the surfaceof the films as the baking temperature is increased. This roughnessis reflected in lower gloss values of the films baked at higher tem-peratures. Formation of new linkages and releasing some materialsfrom the films baked at higher temperatures were proved usingFT-IR and TGA analyses.
References
[1] D.K. Chattopadhyay, K.V.S.N. Raju, Prog. Polym. Sci. 32 (2007) 352–418.[2] P. Russo, D. Acierno, G. Marletta, G.L. Destri, Eur. Polym. J. 49 (2013) 3155–
3164.[3] D.J. Mills, S.S. Jamali, K. Paprocka, Surf. Coat. Technol. 209 (2012) 137–142.[4] M. Rashvand, Z. Ranjnbar, S. Rastegar, Prog. Org. Coat. 71 (2011) 362–368.[5] A. Mobin, A.U. Malik, F. Al-Muaili, M. Al-Hajiri, J. Coat. Technol. Res. 21 (2012)
1292–1299.[6] A. Agic, E.G. Bajsic, J. Appl. Polym. Sci. 103 (2007) 764–772.[7] K. Pielichowski, K. Kulesza, E.M. Pearce, J. Appl. Polym. Sci. 88 (2003)
2319–2330.[8] D. Rosu, L. Rosu, N. Cascaval, Polym. Degrad. Stab. 94 (2009) 591–596.[9] F. Suhara, S.K.N. Kutty, G.B. Nandobt, Polym. Degrad. Stab. 61 (1998) 9–13.10] P.E. Pierce, J. Coat. Technol. 53 (1981) 52–67.11] N. Vatistas, N. Marcetic, Prog. Org. Coat. 38 (2000) 127–131.12] F. Beck, Prog. Org. Coat. 4 (1976) 1–60.13] F. Gaboriaud, J.P. Vantelon, J. Polym. Sci. 19 (1981) 139–150.14] C. Branca, C. Di Blasi, A. Casu, V. Morone, C. Costa, Thermochim. Acta 399 (2003)
127–137.15] P. Albu, C. Bolcu, G. Valse, N. Doca, T. Valse, J. Therm. Anal. Calorim. 105 (2011)
685–689.16] L. Fambri, A. Pegoretti, C. Gavazza, A. Penati, J. Appl. Polym. Sci. 81 (2001)
1218–1225.17] J. Bajat, V.B. Miscovic-Stankovic, D. Drazic, J. Serb. Chem. Soc. 72 (2007)
1383–1392.18] A. Lee, G.B. McKenna, Polymers 29 (1988) 1812–1817.19] A.F. Abdelkader, J.R. White, J. Mater. Sci. 40 (2005) 1843–1854.20] A.P. Romano, M.G. Olivier, A. Nazarov, D. Thierry, Prog. Org. Coat. 66 (2009)
173–182.21] S.J. Garcia, M.T. Rodriguez, R. Izquierdo, J. Suay, Prog. Org. Coat. 60 (2007)
303–311.22] A.P. Romano, M.G. Olivier, C. Vandermiers, M. Poelman, Prog. Org. Coat. 57
(2006) 400–407.