Progress in Organic Coatings
29
See discussions, stats, and author profiles for this publication at: http://www.researchgate.net/publication/223491911 Using electrochemical impedance spectroscopy to predict the corrosion resistance of unexposed coated metal panels ARTICLE in PROGRESS IN ORGANIC COATINGS · SEPTEMBER 2009 Impact Factor: 2.36 · DOI: 10.1016/j.porgcoat.2009.04.009 CITATIONS 9 DOWNLOADS 81 VIEWS 200 7 AUTHORS, INCLUDING: F. Louis Floyd 20 PUBLICATIONS 39 CITATIONS SEE PROFILE Bhaumik Mehta Ink Systems, Inc. 1 PUBLICATION 9 CITATIONS SEE PROFILE Theodore Provder Polymer and Coatings Consultants, LLC 37 PUBLICATIONS 174 CITATIONS SEE PROFILE Available from: Theodore Provder Retrieved on: 21 July 2015
-
Upload
patricio-mira -
Category
Documents
-
view
231 -
download
3
description
Spectroscopy to predict corrosion resistance of unexposed coated metal panels
Transcript of Progress in Organic Coatings

Seediscussions,stats,andauthorprofilesforthispublicationat:http://www.researchgate.net/publication/223491911
Usingelectrochemicalimpedancespectroscopytopredictthecorrosionresistanceofunexposedcoatedmetalpanels
ARTICLEinPROGRESSINORGANICCOATINGS·SEPTEMBER2009
ImpactFactor:2.36·DOI:10.1016/j.porgcoat.2009.04.009
CITATIONS
9
DOWNLOADS
81
VIEWS
200
7AUTHORS,INCLUDING:
F.LouisFloyd
20PUBLICATIONS39CITATIONS
SEEPROFILE
BhaumikMehta
InkSystems,Inc.
1PUBLICATION9CITATIONS
SEEPROFILE
TheodoreProvder
PolymerandCoatingsConsultants,LLC
37PUBLICATIONS174CITATIONS
SEEPROFILE
Availablefrom:TheodoreProvder
Retrievedon:21July2015

This article appeared in a journal published by Elsevier. The attachedcopy is furnished to the author for internal non-commercial researchand education use, including for instruction at the authors institution
and sharing with colleagues.
Other uses, including reproduction and distribution, or selling orlicensing copies, or posting to personal, institutional or third party
websites are prohibited.
In most cases authors are permitted to post their version of thearticle (e.g. in Word or Tex form) to their personal website orinstitutional repository. Authors requiring further information
regarding Elsevier’s archiving and manuscript policies areencouraged to visit:
http://www.elsevier.com/copyright
Author's personal copy
Progress in Organic Coatings 66 (2009) 8–34
Contents lists available at ScienceDirect
Progress in Organic Coatings
journa l homepage: www.e lsev ier .com/ locate /porgcoat
Using electrochemical impedance spectroscopy to predict the corrosionresistance of unexposed coated metal panels
F. Louis Floyda, Sundaresan Avudaiappanb, Jason Gibsonb, Bhaumik Mehtab, Pauline Smithc,Theodore Provderd,∗, John Escarsegae
a PO Box 31208; Independence, OH 44131, United Statesb Eastern Michigan University; Ypsilanti, MI, United Statesc U.S. Army Research Lab; Aberdeen Proving Grounds, MD, United Statesd Polymer & Coatings Consultants, LLC, Solon, OH, United Statese US Army Research Lab; Aberdeen Proving Grounds, MD, United States
a r t i c l e i n f o
Article history:Received 1 April 2008Received in revised form 19 March 2009Accepted 23 April 2009
Keywords:CorrosionElectrochemical impedance spectroscopySalt fog testingPretreatmentPrimerTopcoat
a b s t r a c t
The goal of the current work was to determine if electrochemical impedance spectroscopy (EIS) testingof a series of coated but unexposed metal panels could predict the corrosion results of other sections ofthe same coated panels that were subjected to both continuous and cyclic corrosion testing. Variablesincluded metal, pretreatment, primer, and topcoat. EIS results were shown to be strongly dependentupon the time-of-residence in the electrochemical cell prior to commencement of testing, and to thechoice of electrolyte used in the cell. Good correlations between EIS and corrosion testing were seen fortopcoat effects, but not for pretreatment effects. EIS results appear to relate mostly to barrier propertiesrather than electrochemical properties of coatings. It is suggested that the variation seen in EIS solutionresistance values (Rs) can be utilized to quantify total system error. Total error was estimated by threetechniques: total Rs variation, panel replicate variation, and EIS reading replication. The three approachesyielded similar results: total error for equivalent circuit components expressed in log10 form was on theorder of 50%, expressed as percent standard deviation.
© 2009 Elsevier B.V. All rights reserved.
1. Introduction
Electrochemical impedance spectroscopy (EIS) scans have beenused for over 40 years to measure the properties of coated metalpanels, and to infer relative performance of those coated panelsin corrosive or other environments. There are several hundred ref-erences in the literature to EIS scans of coated metals, includingjournals, books, and government contract reports. Only a few arecited here, to provide context for the present report.
Activity in this field started in the 1940’s (see Bacon et al. [1] forexample) and proceeded slowly until 1970’s, after which it acceler-ated sharply with the introduction by Solatron (UK) and PrincetonApplied Research (U.S.) of automated EIS instruments. Today’s sup-pliers include Solatron, Zahner, Eco-Chemie, and Radiometer whoall use frequency response analyzers; AMETEK (formerly PAR) whouse a lock-in amplifier, and Gamry who use sub-harmonic samplingwith discrete Fourier Transform. The present study employs Gamryinstrumentation.
∗ Corresponding author. Tel.: + 1 440 914 0611.E-mail address: [email protected] (T. Provder).
EIS scans are accomplished by vertically mounting an opencylindrical cell containing electrolyte and the various electrodesonto a horizontal flat coated panel, attaching the electrodes, elec-trically isolating the entire system, pushing the start button.The instrument applies an AC voltage (typically 10 mV in ampli-tude), measures the resulting current and calculates the resultingimpedance, all as a function of AC frequency from high (MHz) to low(mHz). There is a phase lag between applied voltage and measuredcurrent, which produces both a real and imaginary component tothe impedance measured at each frequency.
Results are commonly reported as a plot of imaginary vs. realcomponents of impedance (Nyquist plots) or impedance vs. fre-quency and phase angle vs. frequency (Bode plots). One can alsocalculate the values of various circuit components from a modelequivalent circuit applied to the results. Later sections considerthese in greater detail.
It is generally agreed among workers in the field that to be valid,EIS measurements must adhere to the following four rules [2]:
• Causality: the observed response is due only to the applied per-turbation (no significant spurious signals).
• Linearity: system obeys Ohm’s Law, dE/dl = Z. Impedance (Z)is independent of the magnitude of the applied perturbation.
0300-9440/$ – see front matter © 2009 Elsevier B.V. All rights reserved.doi:10.1016/j.porgcoat.2009.04.009
Author's personal copy
F.L. Floyd et al. / Progress in Organic Coatings 66 (2009) 8–34 9
[Requires small amplitudes, on the order of 10 mV of appliedperturbation.]
• Stability: system does not change over time, and returns to itsoriginal state after the perturbation is removed. [E and I after arun are the same as before the run.]
• Continuity: finite values exist for highest and lowest frequencies,and are continuous in between.
Unfortunately, it is fairly common for publications on EIS mea-surements of coated panels to overlook one or more of the aboverules.
1.1. Tutorials and critical reviews
Taylor [3] provides a good basic introduction on the use of EISmeasurements to observe the changes in film properties over timewhile immersed in an electrolyte solution, such as the decline inresistance and increase in capacitance caused by the absorption ofwater. On the other hand, Al-Janabi, et al., [4] report that in somecircumstances impedance (Z) can actually increase at long exposuretimes, which they attribute to the clogging of pores with corrosionproducts. There is an example of such behavior in the present work.
Geenen [5] provides an excellent summary of EIS techniques forstudying coatings, covering the behavior of the individual circuitcomponents with increasing exposure time, and the role of flaws inthe film by measuring the effect of laser-induced model flaws. Thepresent authors found this work to be lucid, comprehensive, andquite helpful.
Tait [6] has written an excellent text on electrochemical corro-sion testing, including EIS measurements, covering not only theorybut also step-by-step practice in the use of the various techniques.The text also covers experimental error and the need for replica-tion (he asserts a minimum of five). In this context, Tait cautionsthe reader to not discard extreme values (aka flyers, outliers) unlessthey are the result of known causes.
Amirudin and Thierry [7], of the Swedish Corrosion Institute,provide an excellent critical review of the use of EIS measurementsto study the degradation of coated metals. They caution that justbecause many equivalent circuits of varying complexity can beemployed does not necessarily mean that they are valid, have beenconfirmed by other techniques, or represent physical reality. Theyalso assert that a number of commonly accepted practices are notyet settled, viz., the significance of the coating resistance, the util-ity of the breakpoint frequency, and the alternate use of constantphase elements and capacitance in equivalent circuits.
Silverman [8] provides a recent tutorial on and critical reviewof the use of electrochemical techniques to predict corrosionbehavior. He notes that the demand for quicker assessments ofcorrosion behavior prompted the development of electrochemicaltechniques, which can produce useful results in 1–3 days. He alsonotes that while the technique is easy to use, the interpretation ofresults can be quite difficult. He likens the difficulty in trying tosolve for several unknowns using only one equation. As such, he isone of the few authors to point out that EIS measurements cannot ofthemselves provide all the information needed to reliably predictcorrosion results, but must instead be used in combination withother techniques to provide the desired results. This view is echoedby Fontana [9], Haynes [10], Baboian [11], and Silverman [12].
1.2. Equivalent circuit models
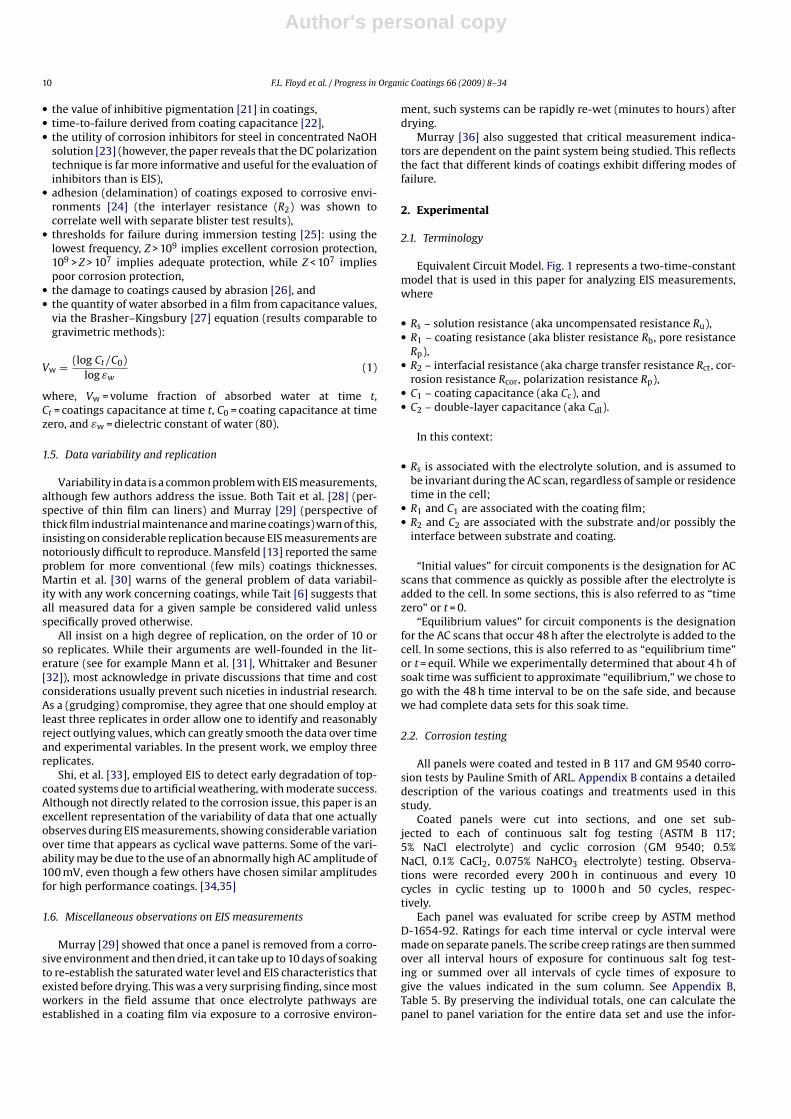
On occasion, an equivalent circuit model has been employed tocalculate circuit components which are claimed to relate separatelyto the coatings and the substrate (or interface). The most commonform of circuit model is a two-time-constant model with resistancesand capacitances related to each of the coating and the substrate
Fig. 1. Equivalent circuit model with two time constants.
(or interface). All models also contain an uncompensated solutionresistance which is presumed to be invariant.
In 1993 Mansfeld [13] described the use of a simple two-time-constant equivalent circuit for the interpretation of EISmeasurements of coated aluminum panels, and the use of thosecircuit components to determine the protective properties ofcoatings and their degradation with exposure time in corrosiveenvironments. Considerable data scatter was shown for the cir-cuit components, and smoothing suggestions were offered. He alsointroduced a pitting model for aluminum alloys, that involved adifferent model circuit that correlated nicely with the observedgrowth rate of the pits.
Kern et al. [14] recently proposed an alternate model to accountfor blistering that employs an additional set of capacitances andresistance in parallel with the elements shown in Fig. 1.
In the present work, we chose to go with the simpler model asshown in Fig. 1, since it provided an adequate fit to our data.
1.3. Rapid electrochemical assessment of paint (REAP; akaAC/DC/AC tests)
In 1996, Kendig et al., [15] first proposed that one could combineEIS measurements with DC-driven delamination experiments toprovide a rapid assessment of paint quality applied to steel (REAP;aka AC/DC/AC test). Their process involved running an EIS scan ini-tially, and then again after 24 h of immersion in 0.5 M NaCl solution.A parallel cathodic delamination experiment is run to determinedelamination rate from a scribe. The DC potential of the sample isheld either at OCP or at −0.600 V vs. SCE if no stable OCP couldbe obtained. The results are combined via multiple regression intoa model that correlates to continuous salt fog results, althoughthe data scatter is rather large. One EIS equipment manufacturer(Gamry) has automated this process for their instruments.
Suay et al. [16] picked up on the concept in 2003 and developed adifferent cycle to accomplish the same mission, also on steel. Suay’sprocess involves running an EIS scan (∼1.5 h), followed by a cathodicpolarization test driven by an applied DC voltage (−3 V relative toOCP; 30 min), followed by a relaxation period of an hour, then fol-lowed by another EIS scan (∼1.5 h). The sequence is repeated 20times. The results are combined with a parallel measure of cathodicdelamination test that involves exposure to voltage of −0.60 V vs.Ag/AgCl for 24 h, then taping the scribe to determine the extent ofdelamination from the scribe. This is said to provide meaningfulresults in as little as a few days.
In 2005, Poelman et al. [17], applied Suay’s technique to coatingsfor aluminum, and reported good results.
1.4. Other uses of EIS
Various authors have used EIS measurements to characterize
• the utility of pretreatments [18–20],
Author's personal copy
10 F.L. Floyd et al. / Progress in Organic Coatings 66 (2009) 8–34
• the value of inhibitive pigmentation [21] in coatings,• time-to-failure derived from coating capacitance [22],• the utility of corrosion inhibitors for steel in concentrated NaOH
solution [23] (however, the paper reveals that the DC polarizationtechnique is far more informative and useful for the evaluation ofinhibitors than is EIS),
• adhesion (delamination) of coatings exposed to corrosive envi-ronments [24] (the interlayer resistance (R2) was shown tocorrelate well with separate blister test results),
• thresholds for failure during immersion testing [25]: using thelowest frequency, Z > 109 implies excellent corrosion protection,109 > Z > 107 implies adequate protection, while Z < 107 impliespoor corrosion protection,
• the damage to coatings caused by abrasion [26], and• the quantity of water absorbed in a film from capacitance values,
via the Brasher–Kingsbury [27] equation (results comparable togravimetric methods):
Vw = (log Ct/C0)log εw
(1)
where, Vw = volume fraction of absorbed water at time t,Ct = coatings capacitance at time t, C0 = coating capacitance at timezero, and εw = dielectric constant of water (80).
1.5. Data variability and replication
Variability in data is a common problem with EIS measurements,although few authors address the issue. Both Tait et al. [28] (per-spective of thin film can liners) and Murray [29] (perspective ofthick film industrial maintenance and marine coatings) warn of this,insisting on considerable replication because EIS measurements arenotoriously difficult to reproduce. Mansfeld [13] reported the sameproblem for more conventional (few mils) coatings thicknesses.Martin et al. [30] warns of the general problem of data variabil-ity with any work concerning coatings, while Tait [6] suggests thatall measured data for a given sample be considered valid unlessspecifically proved otherwise.
All insist on a high degree of replication, on the order of 10 orso replicates. While their arguments are well-founded in the lit-erature (see for example Mann et al. [31], Whittaker and Besuner[32]), most acknowledge in private discussions that time and costconsiderations usually prevent such niceties in industrial research.As a (grudging) compromise, they agree that one should employ atleast three replicates in order allow one to identify and reasonablyreject outlying values, which can greatly smooth the data over timeand experimental variables. In the present work, we employ threereplicates.
Shi, et al. [33], employed EIS to detect early degradation of top-coated systems due to artificial weathering, with moderate success.Although not directly related to the corrosion issue, this paper is anexcellent representation of the variability of data that one actuallyobserves during EIS measurements, showing considerable variationover time that appears as cyclical wave patterns. Some of the vari-ability may be due to the use of an abnormally high AC amplitude of100 mV, even though a few others have chosen similar amplitudesfor high performance coatings. [34,35]
1.6. Miscellaneous observations on EIS measurements
Murray [29] showed that once a panel is removed from a corro-sive environment and then dried, it can take up to 10 days of soakingto re-establish the saturated water level and EIS characteristics thatexisted before drying. This was a very surprising finding, since mostworkers in the field assume that once electrolyte pathways areestablished in a coating film via exposure to a corrosive environ-
ment, such systems can be rapidly re-wet (minutes to hours) afterdrying.
Murray [36] also suggested that critical measurement indica-tors are dependent on the paint system being studied. This reflectsthe fact that different kinds of coatings exhibit differing modes offailure.
2. Experimental
2.1. Terminology
Equivalent Circuit Model. Fig. 1 represents a two-time-constantmodel that is used in this paper for analyzing EIS measurements,where
• Rs – solution resistance (aka uncompensated resistance Ru),• R1 – coating resistance (aka blister resistance Rb, pore resistance
Rp),• R2 – interfacial resistance (aka charge transfer resistance Rct, cor-
rosion resistance Rcor, polarization resistance Rp),• C1 – coating capacitance (aka Cc), and• C2 – double-layer capacitance (aka Cdl).
In this context:
• Rs is associated with the electrolyte solution, and is assumed tobe invariant during the AC scan, regardless of sample or residencetime in the cell;
• R1 and C1 are associated with the coating film;• R2 and C2 are associated with the substrate and/or possibly the
interface between substrate and coating.
“Initial values” for circuit components is the designation for ACscans that commence as quickly as possible after the electrolyte isadded to the cell. In some sections, this is also referred to as “timezero” or t = 0.
“Equilibrium values” for circuit components is the designationfor the AC scans that occur 48 h after the electrolyte is added to thecell. In some sections, this is also referred to as “equilibrium time”or t = equil. While we experimentally determined that about 4 h ofsoak time was sufficient to approximate “equilibrium,” we chose togo with the 48 h time interval to be on the safe side, and becausewe had complete data sets for this soak time.
2.2. Corrosion testing
All panels were coated and tested in B 117 and GM 9540 corro-sion tests by Pauline Smith of ARL. Appendix B contains a detaileddescription of the various coatings and treatments used in thisstudy.
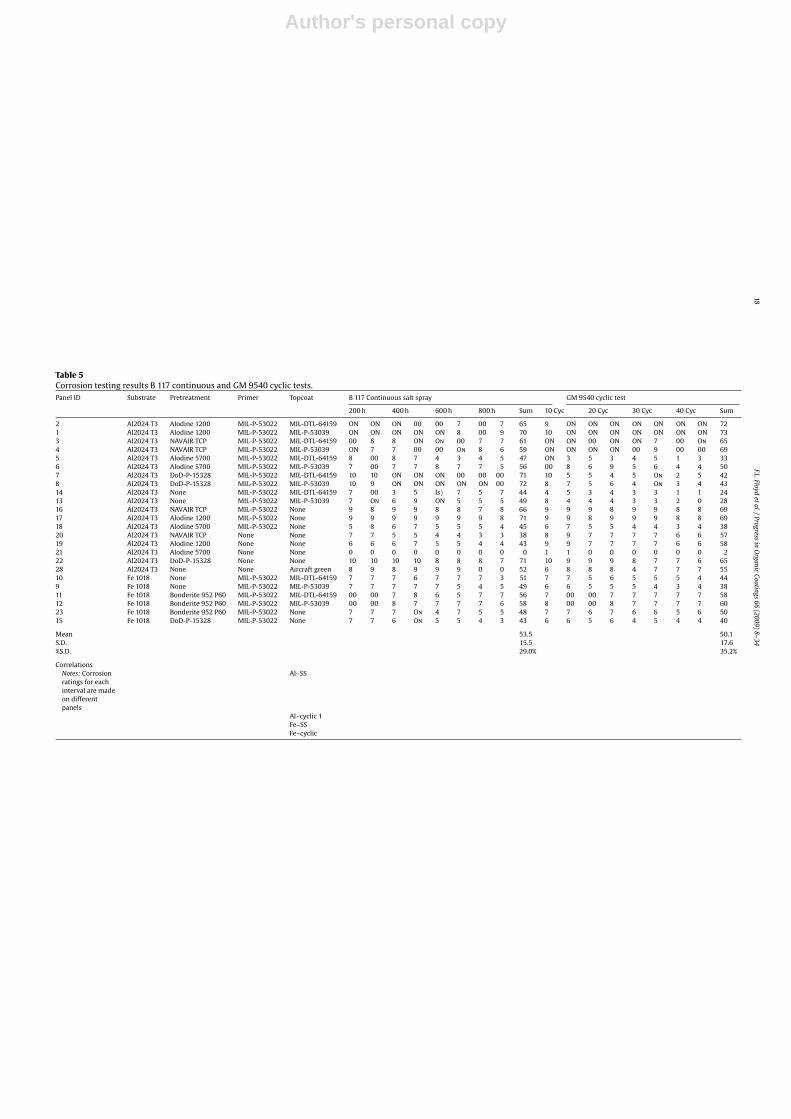
Coated panels were cut into sections, and one set sub-jected to each of continuous salt fog testing (ASTM B 117;5% NaCl electrolyte) and cyclic corrosion (GM 9540; 0.5%NaCl, 0.1% CaCl2, 0.075% NaHCO3 electrolyte) testing. Observa-tions were recorded every 200 h in continuous and every 10cycles in cyclic testing up to 1000 h and 50 cycles, respec-tively.
Each panel was evaluated for scribe creep by ASTM methodD-1654-92. Ratings for each time interval or cycle interval weremade on separate panels. The scribe creep ratings are then summedover all interval hours of exposure for continuous salt fog test-ing or summed over all intervals of cycle times of exposure togive the values indicated in the sum column. See Appendix B,Table 5. By preserving the individual totals, one can calculate thepanel to panel variation for the entire data set and use the infor-
Author's personal copy
F.L. Floyd et al. / Progress in Organic Coatings 66 (2009) 8–34 11
mation to filter the rest of the data for actual paint variationsvs. panel variations. Averages would simply compress the differ-ences and make the differences less credible or harder to believe.It was found that technique best represented what one saw visu-ally if one laid out the panels and compared them one paint toanother. This also had the advantage of removing judgment frompicking any particular point in the continuum. The authors foundthis summation technique superior to alternatives for clearly seeingnoise vs. coatings differences. This summation approach previ-ously has been successfully used by the authors in this manner[37].
The GM 9540 test involves the following sequence in a 24 h cycle:
• 6 h at 50 ◦C and 100% RH;• 15 min in contact with an electrolyte solution (0.5% NaCl, 0.1%
CaCl2, 0.075% NaHCO3);• 17 h, 45 min drying at 60 ◦C and 50% RH.
Note: operators report that it is common to encounter a pre-cipitate with the GM 9540 electrolyte, and therefore performcontinuous mixing of that electrolyte. The precipitate was foundto be CaCO3. However, with electrochemical testing this was unac-ceptable due to fouling of the EIS cell, so we resorted to a finalfiltration step to remove the precipitate before commencing EIStesting with the GM 9540 electrolyte.
2.3. EIS testing (Unexposed coated panels provided by PaulineSmith of ARL)
Following is a brief summary of the essential elements in thetesting protocols, as provided by Gamry:
• Measure Eoc and allow it to stabilize.• Apply a DC voltage equal to the measured value of Eoc.• In addition to the DC voltage, apply a small sinusoidal voltage
(10 mV) perturbation of fixed frequency and measure the currentresponse.
• Calculate the impedance and the phase shift.• Repeat the measurement at a wide range of frequencies (1 mHz
to 100 kHz).• Model the electrochemical process with a two-time-constant
model using resistors capacitors. Adjust the value of the circuitelements to fit the model to the EIS data.
• Record the data in a spreadsheet, and convert to log10 transformfor subsequent analysis.
The EIS instrumentation used in our studies is a Gamry (Warmin-ster, PA) MultEchem 4 Electrochemistry System consisting of 4 FAS2Femtostats for EIS measurements in a parallel multiplexing modewith EIS300 Electrochemical Impedance Spectroscopy Software.ZView Electrochemical Analysis software (Scribner Associates, Inc.,Southern Pines, NC) was used to interpret and illustrate the AC data.
2.4. Assumptions
Every investigation carries with it a series of assumptions, whichmay derive from hard science, convention, and biases and opin-ions of the experimenters. It is important to make assumptions asexplicit as possible to avoid (or clarify) problems later on with theresults and interpretations. Here are ours:
• AC impedance results can be modeled adequately with a two-time-constant model, from which the various valid circuitelements can be extracted.
• Higher resistance values are better. This view derives from a bar-rier model of film protection: better films will resist passage ofboth water and ions more than poorer films.
• Lower capacitance values are better. This is because water absorp-tion increases coating capacitance. This view also derives from abarrier model of film protection.
• Higher corrosion testing values are better. This is a simple conse-quence of using an ASTM scale where higher numbers representbetter performance.
• Corrosion test results for a series of coatings (including replicates)are best reported as the sum of all replicate panels at all time inter-vals for which corrosion results are recorded. Such totals werefound to be the most robust way of expressing system results, andtend to reduce the errors involved in any single interval rating.
• Correlation coefficients (r2) are considered compelling only ifthey exceed 0.70 (+ or −), and are usually indicated in spread-sheets by bold numbers and a colored background (blue or green).
Sometimes we had to reject extreme value data. Standard tech-niques were used to accomplish this in the few cases where it wasrequired.
2.5. Abbreviations and terms used in this report
Avg: mean calculated for given group of panels.TC, tc, Tpct: Topcoat utilized. Average of topcoated panels com-
pared to average of untopcoated panels.Tpct DTL-C: Comparison of panels topcoated with DTL vs. those
topcoated with C. In Table 6 and later, the designation is for thedifference between the two topcoated alternatives.
no TC, no tc, no Tpct: no topcoat utilized – only primer andpretreatment. Average of untopcoated panels calculated for com-parisons to average of topcoated panels.
Primer only: alternative label for untopcoated. Includes primerand pretreatment.
Pretreatment only: no primer and no topcoat.no ctg: no coating; alternate reference to pretreatment only.Pretreatments, primer, and topcoats are all described in detail
in Appendix III. Abbreviations of the long official names are used inthe report to facilitate reading.
BC: basecoat (aka “pretreatment” in other sections of thisreport).
BC + Pr: pretreatment plus primer (aka no topcoat).BC + Pr + TC: fully coated panels (aka topcoated).TC1: topcoat 1 (aka topcoat DTL).TC2: topcoat 2 (aka topcoat C).
3. Results and discussion
3.1. Corrosion test results
3.1.1. Pretreatment effects (cf. Tables 1, 4, 5, 9)The reader should note that the present section deals with rank
orders only. Subsequent sections deal with various quantitativecorrelations. The reader should see Appendix A. for descriptionsof pretreatments and coatings studied. See Appendix B for Tables4–16. Note that the numbers in parentheses in the tables indicatenegative numbers.
3.1.2. Steel vs. aluminumPretreatment corrosion rankings for various coating con-
ditions on aluminum and steel are summarized in Table 1.There were insufficient panel comparisons for the steel sub-strate to draw any broad conclusions other than pretreatmentP60 is superior to alternatives. As a result, the balance of
Author's personal copy
12 F.L. Floyd et al. / Progress in Organic Coatings 66 (2009) 8–34
this discussion is focused exclusively on the aluminum pan-els.
3.1.3. B 117In continuous testing, there was agreement in rank order among
fully coated, primer only, and pretreatment only conditions for allof the pretreatments. The effect of adding coatings to the pretreat-ments was to reduce their differences and increase their longevity,but did not alter their rank orders.
3.1.4. GM 9540In cyclic testing, three of the pretreatments showed agreement
in rank order among the coatings situations, while the DOD treat-ment was higher in rank order uncoated than it was coated. Thesingle deviation for DOD was its inferior performance once coated.
3.1.5. Cyclic vs. continuousThe only deviation in agreement between the corrosion tests
was the same inferior performance of fully coated DOD in cyclictesting. Otherwise, the agreement between cycles was nearly per-fect. This was surprising, considering all the work published on thedeficiencies of continuous vs. cyclic testing.
Interestingly, the Alodine 5700 showed essentially zero protec-tion by itself in both continuous and cyclic testing. However, oncecoated, its performance rose to the bottom end of the performanceof the other coated systems in B 117 testing, but closed only abouthalf the gap in cyclic testing.
3.2. Correlations
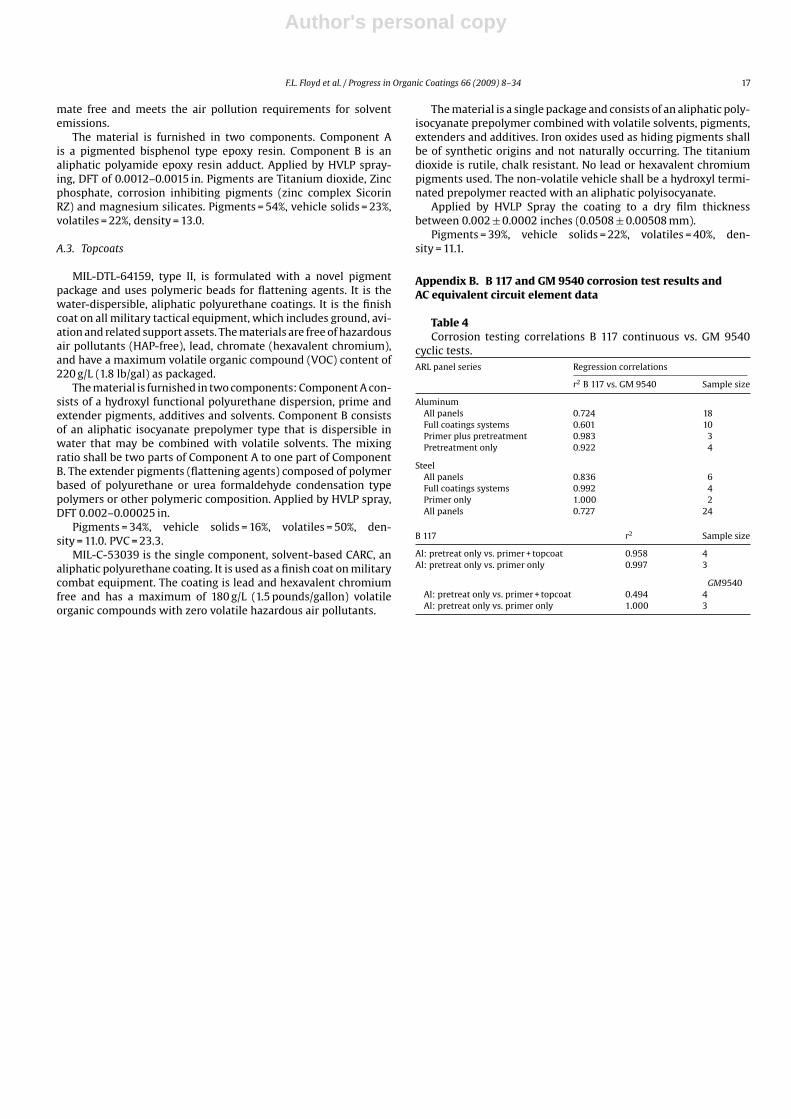
Table 4 shows the regression coefficients for B 117continuous vs.GM 9540 cyclic testing for various subsets of data: all panels, fullcoatings systems, primer plus pretreatment only, and pretreatmentonly (i.e., uncoated). The overall correlation for all panels betweenthe two tests is r = .727 (see Table 4), which is common for sucha correlation between cyclic and continuous testing (informal pollamong colleagues in the industry).
For aluminum panels, it is interesting that the correlation startshigh for the pretreatment only set (r = .922), improves slightlyas one adds primer (r = .983), then declines sharply as one addstopcoat (r = .601). This means that the difference between cyclicand continuous exposure is minimal for pretreatment only andpretreatment + primer, and increases as one adds topcoats to thepretreated metal. A similar result is seen for steel panels.
The aluminum panels in B 117 continuous testing show anexcellent correlation (r > .9) between pretreatment only, pretreat-ment + primer, and the fully coated system. This strongly suggeststhat the pretreatment is the controlling layer in subsequent contin-uous corrosion testing of coated panels.
However, the aluminum panels in GM 9540 cyclic testing showan excellent correlation between pretreatment only and pretreat-ment + primer (r = 1), but a poor correlation for the fully coatedsystem (r ∼ .5). This suggests that there are factors contributed bythe topcoat that are modifying the relative performance of the pre-treatments in subsequent cyclic corrosion testing.
Table 5 shows the corrosion results for all aluminum panels forall time intervals of observation. To summarize the data, we choseto sum all observations for a given system for all time intervalsto represent the final corrosion rating for that system. We thenaveraged the results for each subset of pretreatments to arrive atthe rating for that variable. Next, there were three samples withpretreatment + primer (no topcoat), and four samples with pre-treatment only. These data were then utilized for comparison toelectrochemical results later in this report.
The data set for steel was much smaller, and will not be exten-sively discussed in this report.
4. EIS testing of coated panels: equivalent circuit elementanalysis results
We utilized the Z-view software to calculate the equivalentcircuit elements for each experiment, based on the measuredimpedance vs. frequency results, and based on a two-time-constantmodel.
The equivalent circuit elements for the two-time-constantmodel consist of Rs (solution resistance), R1 (coating resistance),C1 (coating capacitance), R2 (substrate or interface resistance), andC2 (substrate or interface capacitance).
We chose to transform all the circuit element data to log10 val-ues, because of the variable magnitudes involved, and because ofthe magnitude of total error involved in the various measurements.Once we made this transformation of the data, meaningful resultsbecame much more visually obvious.
4.1. Plots of circuit elements vs. soak time
Supplementary material contains plots of the various circuit ele-ments as a function of soak time in the electrochemical cell.
4.1.1. B 117 electrolyteAs will be discussed later in Section 7, the solution resistance val-
ues calculated from EIS measurements do not likely represent anyphysical significance, but instead probably represent total systemerror. Therefore Rs values will not be discussed further here.
Most systems showed an increase in coatings resistance (R1)as soak time increased, although a few showed a slight decrease.Likewise, interfacial resistance (R2) showed a general increase inresistance vs. soak time.
Coating capacitance (C1) was either flat, or jumped to a highervalue during early soak times, then remained constant thereafter. Itshould be noted that none of the capacitance measurements in thisstudy showed evidence of water clustering as asserted by Geneen[5], among others, even though our soak times were similar to oth-ers reported in the literature.
Topcoat DTL showed a definite tendency to absorb more waterthan the topcoat C, as evidenced by the higher coating capacitancefor topcoat DTL. Double layer capacitance (C2) also showed eitherflat or early jumps in capacitance as a function of soak time. TopcoatDTL again showed a much higher C2 than topcoat C, suggesting morewater absorption.
GM 9540 Electrolyte. With GM 9540 electrolyte, coating resis-tance values were largely flat vs. soak time in the cell, in contrast tothe B 117 electrolyte. Surprisingly, topcoat DTL showed higher coat-ing resistance values than topcoat C. The pretreatment only panelsshowed the lowest R1 values, as expected.
Interfacial resistance (R2) values were largely flat during soaktime, except for topcoat DTL, which started high, then droppedabout two orders of magnitude within the first few hours of soak-ing.
Coating capacitance (C1) was essentially flat for all systems asa function of soak time. The pretreatment only samples were con-sistently four orders of magnitude higher in capacitance than thevarious coated samples, suggesting that they were more water sen-sitive than the coatings in this electrolyte.
Double layer capacitance (C2) showed the same behavior as coat-ing capacitance (C1).
4.2. Circuit element data analysis (see Appendix B)
4.2.1. Time-of-soakThe first issue is to determine how long it takes to achieve equi-
librium in the EIS cell (aka t = equil), once electrolyte has beenadded, and then to compare those equilibrium results with ones
Author's personal copy
F.L. Floyd et al. / Progress in Organic Coatings 66 (2009) 8–34 13
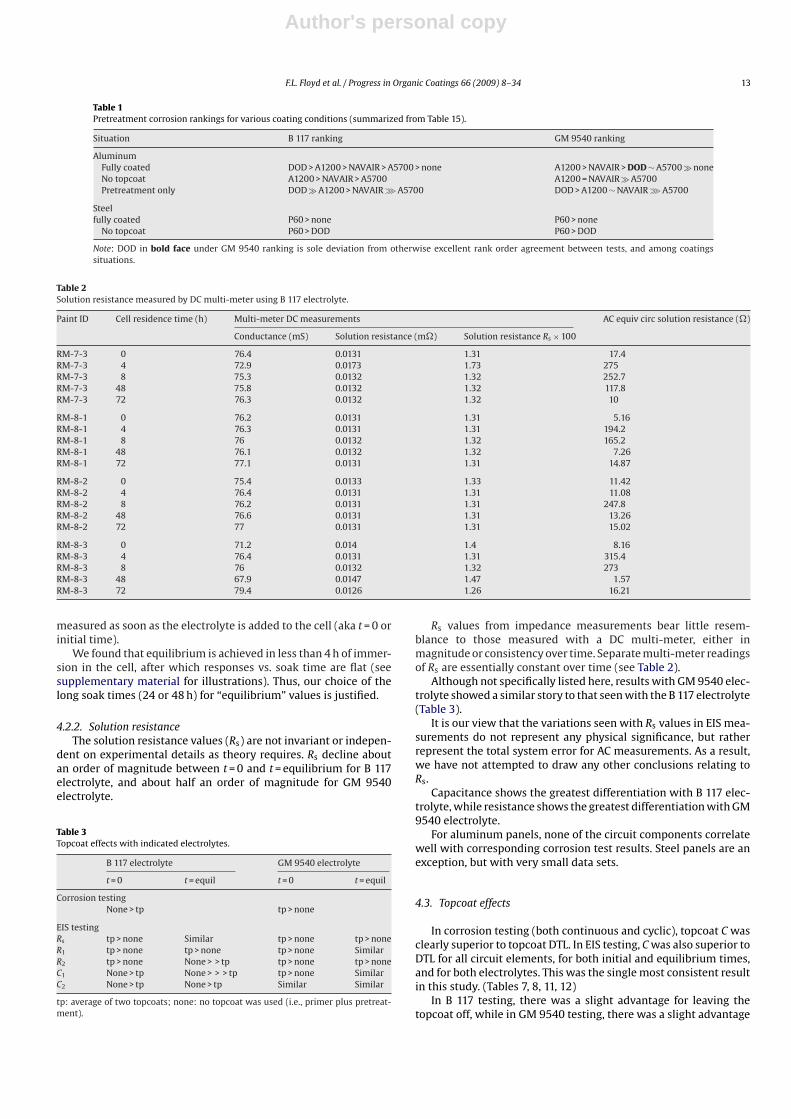
Table 1Pretreatment corrosion rankings for various coating conditions (summarized from Table 15).
Situation B 117 ranking GM 9540 ranking
AluminumFully coated DOD > A1200 > NAVAIR > A5700 > none A1200 > NAVAIR > DOD ∼ A5700 � noneNo topcoat A1200 > NAVAIR > A5700 A1200 = NAVAIR � A5700Pretreatment only DOD � A1200 > NAVAIR≫A5700 DOD > A1200 ∼ NAVAIR≫A5700
Steelfully coated P60 > none P60 > none
No topcoat P60 > DOD P60 > DOD
Note: DOD in bold face under GM 9540 ranking is sole deviation from otherwise excellent rank order agreement between tests, and among coatingssituations.
Table 2Solution resistance measured by DC multi-meter using B 117 electrolyte.
Paint ID Cell residence time (h) Multi-meter DC measurements AC equiv circ solution resistance (�)
Conductance (mS) Solution resistance (m�) Solution resistance Rs × 100
RM-7-3 0 76.4 0.0131 1.31 17.4RM-7-3 4 72.9 0.0173 1.73 275RM-7-3 8 75.3 0.0132 1.32 252.7RM-7-3 48 75.8 0.0132 1.32 117.8RM-7-3 72 76.3 0.0132 1.32 10
RM-8-1 0 76.2 0.0131 1.31 5.16RM-8-1 4 76.3 0.0131 1.31 194.2RM-8-1 8 76 0.0132 1.32 165.2RM-8-1 48 76.1 0.0132 1.32 7.26RM-8-1 72 77.1 0.0131 1.31 14.87
RM-8-2 0 75.4 0.0133 1.33 11.42RM-8-2 4 76.4 0.0131 1.31 11.08RM-8-2 8 76.2 0.0131 1.31 247.8RM-8-2 48 76.6 0.0131 1.31 13.26RM-8-2 72 77 0.0131 1.31 15.02
RM-8-3 0 71.2 0.014 1.4 8.16RM-8-3 4 76.4 0.0131 1.31 315.4RM-8-3 8 76 0.0132 1.32 273RM-8-3 48 67.9 0.0147 1.47 1.57RM-8-3 72 79.4 0.0126 1.26 16.21
measured as soon as the electrolyte is added to the cell (aka t = 0 orinitial time).
We found that equilibrium is achieved in less than 4 h of immer-sion in the cell, after which responses vs. soak time are flat (seesupplementary material for illustrations). Thus, our choice of thelong soak times (24 or 48 h) for “equilibrium” values is justified.
4.2.2. Solution resistanceThe solution resistance values (Rs) are not invariant or indepen-
dent on experimental details as theory requires. Rs decline aboutan order of magnitude between t = 0 and t = equilibrium for B 117electrolyte, and about half an order of magnitude for GM 9540electrolyte.
Table 3Topcoat effects with indicated electrolytes.
B 117 electrolyte GM 9540 electrolyte
t = 0 t = equil t = 0 t = equil
Corrosion testingNone > tp tp > none
EIS testingRs tp > none Similar tp > none tp > noneR1 tp > none tp > none tp > none SimilarR2 tp > none None > > tp tp > none tp > noneC1 None > tp None > > > tp tp > none SimilarC2 None > tp None > tp Similar Similar
tp: average of two topcoats; none: no topcoat was used (i.e., primer plus pretreat-ment).
Rs values from impedance measurements bear little resem-blance to those measured with a DC multi-meter, either inmagnitude or consistency over time. Separate multi-meter readingsof Rs are essentially constant over time (see Table 2).
Although not specifically listed here, results with GM 9540 elec-trolyte showed a similar story to that seen with the B 117 electrolyte(Table 3).
It is our view that the variations seen with Rs values in EIS mea-surements do not represent any physical significance, but ratherrepresent the total system error for AC measurements. As a result,we have not attempted to draw any other conclusions relating toRs.
Capacitance shows the greatest differentiation with B 117 elec-trolyte, while resistance shows the greatest differentiation with GM9540 electrolyte.
For aluminum panels, none of the circuit components correlatewell with corresponding corrosion test results. Steel panels are anexception, but with very small data sets.
4.3. Topcoat effects
In corrosion testing (both continuous and cyclic), topcoat C wasclearly superior to topcoat DTL. In EIS testing, C was also superior toDTL for all circuit elements, for both initial and equilibrium times,and for both electrolytes. This was the single most consistent resultin this study. (Tables 7, 8, 11, 12)
In B 117 testing, there was a slight advantage for leaving thetopcoat off, while in GM 9540 testing, there was a slight advantage
Author's personal copy
14 F.L. Floyd et al. / Progress in Organic Coatings 66 (2009) 8–34
for using a topcoat. However, in EIS testing, the story was mixed forusing a topcoat vs. none.
With B 117 electrolyte, resistance values supported using a top-coat, while capacitance values argued for leaving it off. This mightsuggest that the topcoats were relatively water sensitive in thiselectrolyte.
With GM 9540 electrolyte, such differences as existed were allin favor of using a topcoat, which was consistent with corrosiontest results. The differences were most pronounced with resistancereadings. This suggests that there was no difference in water sensi-tivity with or without topcoat with the GM 9540 electrolyte.
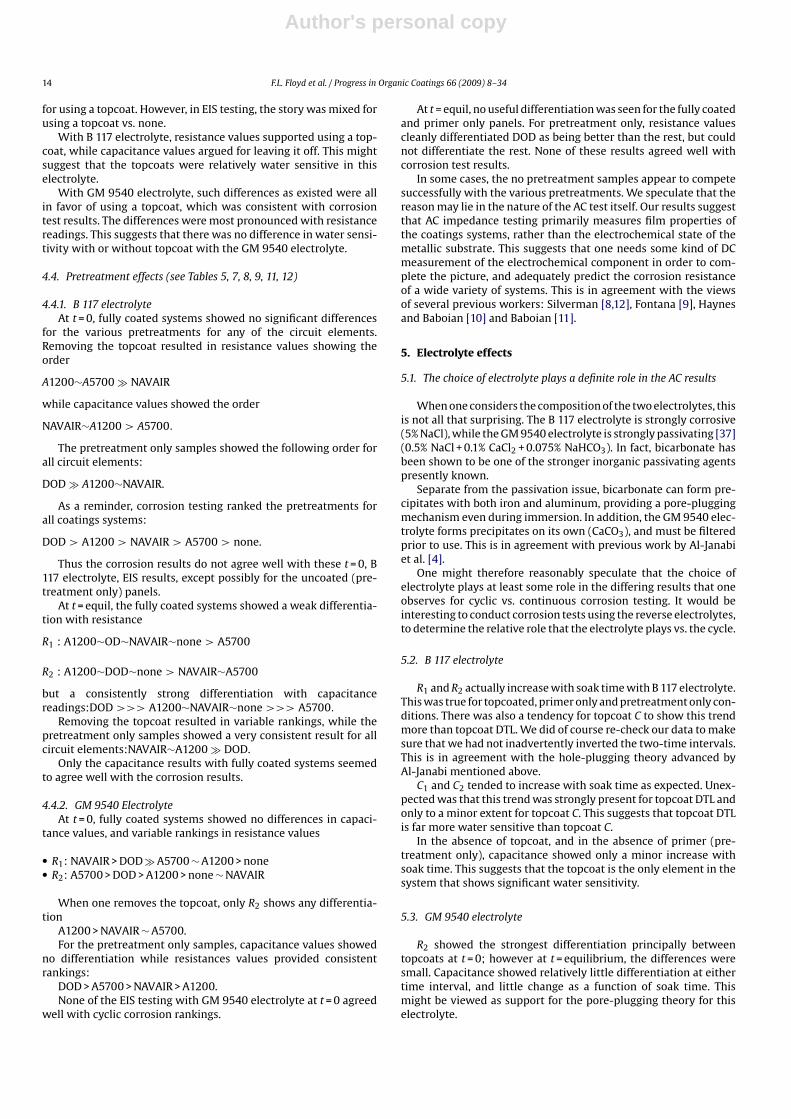
4.4. Pretreatment effects (see Tables 5, 7, 8, 9, 11, 12)
4.4.1. B 117 electrolyteAt t = 0, fully coated systems showed no significant differences
for the various pretreatments for any of the circuit elements.Removing the topcoat resulted in resistance values showing theorder
A1200∼A5700 � NAVAIR
while capacitance values showed the order
NAVAIR∼A1200 > A5700.
The pretreatment only samples showed the following order forall circuit elements:
DOD � A1200∼NAVAIR.
As a reminder, corrosion testing ranked the pretreatments forall coatings systems:
DOD > A1200 > NAVAIR > A5700 > none.
Thus the corrosion results do not agree well with these t = 0, B117 electrolyte, EIS results, except possibly for the uncoated (pre-treatment only) panels.
At t = equil, the fully coated systems showed a weak differentia-tion with resistance
R1 : A1200∼OD∼NAVAIR∼none > A5700
R2 : A1200∼DOD∼none > NAVAIR∼A5700
but a consistently strong differentiation with capacitancereadings:DOD >>> A1200∼NAVAIR∼none >>> A5700.
Removing the topcoat resulted in variable rankings, while thepretreatment only samples showed a very consistent result for allcircuit elements:NAVAIR∼A1200 � DOD.
Only the capacitance results with fully coated systems seemedto agree well with the corrosion results.
4.4.2. GM 9540 ElectrolyteAt t = 0, fully coated systems showed no differences in capaci-
tance values, and variable rankings in resistance values
• R1: NAVAIR > DOD � A5700 ∼ A1200 > none• R2: A5700 > DOD > A1200 > none ∼ NAVAIR
When one removes the topcoat, only R2 shows any differentia-tion
A1200 > NAVAIR ∼ A5700.For the pretreatment only samples, capacitance values showed
no differentiation while resistances values provided consistentrankings:
DOD > A5700 > NAVAIR > A1200.None of the EIS testing with GM 9540 electrolyte at t = 0 agreed
well with cyclic corrosion rankings.
At t = equil, no useful differentiation was seen for the fully coatedand primer only panels. For pretreatment only, resistance valuescleanly differentiated DOD as being better than the rest, but couldnot differentiate the rest. None of these results agreed well withcorrosion test results.
In some cases, the no pretreatment samples appear to competesuccessfully with the various pretreatments. We speculate that thereason may lie in the nature of the AC test itself. Our results suggestthat AC impedance testing primarily measures film properties ofthe coatings systems, rather than the electrochemical state of themetallic substrate. This suggests that one needs some kind of DCmeasurement of the electrochemical component in order to com-plete the picture, and adequately predict the corrosion resistanceof a wide variety of systems. This is in agreement with the viewsof several previous workers: Silverman [8,12], Fontana [9], Haynesand Baboian [10] and Baboian [11].
5. Electrolyte effects
5.1. The choice of electrolyte plays a definite role in the AC results
When one considers the composition of the two electrolytes, thisis not all that surprising. The B 117 electrolyte is strongly corrosive(5% NaCl), while the GM 9540 electrolyte is strongly passivating [37](0.5% NaCl + 0.1% CaCl2 + 0.075% NaHCO3). In fact, bicarbonate hasbeen shown to be one of the stronger inorganic passivating agentspresently known.
Separate from the passivation issue, bicarbonate can form pre-cipitates with both iron and aluminum, providing a pore-pluggingmechanism even during immersion. In addition, the GM 9540 elec-trolyte forms precipitates on its own (CaCO3), and must be filteredprior to use. This is in agreement with previous work by Al-Janabiet al. [4].
One might therefore reasonably speculate that the choice ofelectrolyte plays at least some role in the differing results that oneobserves for cyclic vs. continuous corrosion testing. It would beinteresting to conduct corrosion tests using the reverse electrolytes,to determine the relative role that the electrolyte plays vs. the cycle.
5.2. B 117 electrolyte
R1 and R2 actually increase with soak time with B 117 electrolyte.This was true for topcoated, primer only and pretreatment only con-ditions. There was also a tendency for topcoat C to show this trendmore than topcoat DTL. We did of course re-check our data to makesure that we had not inadvertently inverted the two-time intervals.This is in agreement with the hole-plugging theory advanced byAl-Janabi mentioned above.
C1 and C2 tended to increase with soak time as expected. Unex-pected was that this trend was strongly present for topcoat DTL andonly to a minor extent for topcoat C. This suggests that topcoat DTLis far more water sensitive than topcoat C.
In the absence of topcoat, and in the absence of primer (pre-treatment only), capacitance showed only a minor increase withsoak time. This suggests that the topcoat is the only element in thesystem that shows significant water sensitivity.
5.3. GM 9540 electrolyte
R2 showed the strongest differentiation principally betweentopcoats at t = 0; however at t = equilibrium, the differences weresmall. Capacitance showed relatively little differentiation at eithertime interval, and little change as a function of soak time. Thismight be viewed as support for the pore-plugging theory for thiselectrolyte.
Author's personal copy
F.L. Floyd et al. / Progress in Organic Coatings 66 (2009) 8–34 15
6. Correlations
6.1. Corrosion vs. electrochemical testing
For aluminum panels in B 117 electrolyte vs. continuous saltfog testing, none of the electrochemical parameters correlated withcorrosion testing for either soak time. However, steel panels showedgood correlations for R2 (both soak times), R1 (t = 0 only), and C2(t = equil only).
For aluminum panels in GM 9540 electrolyte vs. cyclic testing,none of the electrochemical parameters correlated with corrosiontesting for either soak time. However, steel panels showed goodcorrelations for R2 (t = 0 only) and Rs (t = equil only). Unfortunately,the fortuitous correlations with salt spray for steel panels in GM9540 electrolyte casts suspicion on the correlations with R2 and Rs.
6.2. Continuous vs. cyclic corrosion tests
A significant, but imperfect, correlation exists between continu-ous (B 117) and cyclic (GM 9540) tests for both steel and aluminumpanels. The overall correlation is about r = 0.72.
6.3. Pretreatment vs. coating
There appears to be a strong correlation between pretreatmentonly and fully coated systems, suggesting that quick-screeningmight be accomplished with pretreatment only panels. For B 117testing, the correlation is excellent, while for cyclic testing, thereis one strong exception: DOD performs far worse (relatively) whencoated than uncoated.
6.4. Topcoating
For aluminum, the presence of a topcoat detracts from the cor-relation between continuous and cyclic test results. In the absenceof topcoat (primer only), the correlation increases to greater than0.9.
For steel, there is no topcoat effect. However, the sample size isquite small.
7. Assessment of system error
• The solution resistance (Rs) is assumed in all models to be invari-ant, and independent of all experimental variables. If true, thenany observed variation in Rs can be considered to be solely dueto total experimental error, including sample preparation andelectrochemical testing. Our AC measurements show that log10 Rs
varies on the order of 50%, expressed as percent standard devia-tion of all log Rs values for all panels, substrates, and electrolytes.Meanwhile, solution resistance as measured by DC was essen-tially constant.
• A separate calculation, based only on replicate AC readings onduplicate panels, produces the following estimates of error (as%S.D.):© log10 Rs – 20%© log10 R1 – 50%© log10 R2 – 41%© log10 C1 – 31%© log10 C2 – 27%
The reader should note that these values represent only theerror associated with electrochemical measurements, and do notinclude all the other experimental steps. However, they are allwithin the same order of magnitude as the total log10 Rs specula-tion above.
• The reader is cautioned to take this error issue seriously whenattempting to develop any correlations between electrochemical
measurements and actual corrosion test results. While error isonly infrequently discussed in the open literature on EIS mea-surements, that minority view is very likely representative of EISdata in general.
8. Summary and conclusions
The goal of this work was to determine if EIS testing of unexposedcoated metal panels could predict the corrosion results of othersections of the same coated panels that were separately subjectedto continuous (B 117) and cyclic (GM 9540) corrosion testing.
The panels of interest were prepared at the US Army ResearchLaboratory, and represent a combination of two metals (alu-minum and steel), five pretreatments, one primer (solventborneepoxy) and two topcoats (solventborne urethanes). Details of thepanels and their coatings and pretreatments can be found inAppendix A. EIS testing was conducted with both the B 117 elec-trolyte and the GM 9540 electrolyte at both initial (t = 0) andequilibrium (t = equil) times after adding the electrolyte to thecell. Comparisons were then made between each corrosion testand its corresponding EIS test conducted with the same elec-trolyte.
Equivalent circuit components were calculated from a two-time-constant model, and were expressed as the log10 transformdue to their large magnitudes. This transformation simplified thedata so that one could readily see component effects on the circuitelements. The elements calculated were solution resistance (Rs),coating resistance (R1), interface resistance (R2), coating capaci-tance (C1) and interface capacitance (C2).
Within the context of the panels tested, following is a summaryof our findings and interpretations:
• The EIS results depended strongly on the time-of-residence in theelectrochemical cell prior to commencement of AC scans (“soaktime”), requiring at least 4 h to achieve equilibrium, after whichresults remained essentially constant up to the maximum of 48 htested.
• The EIS results also depended strongly on the choice of electrolyteused in the AC cell, suggesting that corrosion differences seenbetween continuous and cyclic corrosion testing may be due inpart to the electrolyte used separate from the cycle employed.Corrosion test results were therefore compared to the EIS resultsobtained with the corresponding electrolyte.
• EIS testing clearly demonstrated the same superiority of topcoat Cover topcoat DTL seen in corrosion testing. This was the strongesteffect seen in this study. Descriptions of the two topcoats can befound in Appendix A – topcoat C is MIL-C-53039; topcoat DTL isMIL-DTL-64159.
• EIS testing showed good correlation with corrosion testing for thetopcoat vs. no topcoat series. In corrosion testing, B 117 showeda slight preference for leaving the topcoat off, while GM 9540showed a slight advantage for using a topcoat. In EIS testing withB 117 electrolyte, the capacitance values agreed while the resis-tance values disagreed with the corrosion results. EIS testing withGM 9540 electrolyte showed broad agreement with the corre-sponding corrosion results.
• EIS testing could not accurately predict the relative performanceof the various pretreatments seen in corrosion testing. There wasone exception where capacitance readings with B 117 electrolyteat t = equil did provide good correlation to B 117 corrosion testing.The results broke down as follows:© B 117 electrolyte, t = 0 poor correlation to B 117 testing© B 117 electrolyte, t = equil capacitance had good correlation to
B 117© GM 9540 electrolyte, t = 0 poor correlation to GM 9540 testing
Author's personal copy
16 F.L. Floyd et al. / Progress in Organic Coatings 66 (2009) 8–34
© GM 9540 electrolyte, t = equil poor correlation to GM 9540testing.
• The corrosion of coated metal panels seems to be largely con-trolled by the pretreatment used. The addition of coatings servesto reduce the differences between pretreatments, but does notalter their rank order. Unfortunately, the equivalent circuit ele-ments measured by EIS do not provide a similar clear-cut result,and do not generally correlate with the corrosion results.
• Pair-wise analysis provides better insight than overall regressionor rank order correlations, due to the relatively high systematicerror involved in EIS testing.
• The solution resistance (Rs) measured by EIS was highly vari-able and bore no resemblance to that measured by conventionalDC techniques, which was essentially constant as theory sug-gests. We therefore speculate that Rs as measured by EIS may beemployed as a measure of total experimental error (metal consis-tency, pretreatment, coatings preparation and application, andEIS measurements).
• EIS testing is probably providing information largely on the bar-rier component of corrosion, and little on the electrochemical(inhibiting) component. In contrast, an earlier report demon-strated that DC measurements can be employed to quantify theelectrochemical component separately from the barrier compo-nent [8–12].
8.1. Recommendations
It is presently unclear how much of the difference seen betweencontinuous and cyclic corrosion testing is due to the cycle, and howmuch is due to the choice of electrolyte. Given the differences seenin EIS testing with the two different electrolytes, it would be usefulto conduct corrosion testing of well-characterized coating systemson both steel and aluminum using opposite electrolytes: GM 9540electrolyte in continuous testing and B 117 electrolyte in the cyclictest. This would help to separate the electrolyte effects from thecycle effects in corrosion testing results.
Acknowledgments
This work was supported by the U.S. Department of the Army,Tank-Automotive and Armaments Command (TACOM), contract no.DDAE07-03-C-L127 and the Army Research Laboratory (ARL) con-tract no. DAAD19-03-2-0013.
The authors would like to acknowledge the contributions of thefollowing people in completing this study:
I. Carl Handsy of the U.S. Department of the Army, Tank-Automotive and Armaments Command, Warren, MI for very usefultechnical discussions during our testing.
Martin Donbrosky, Jr., Chemir Analytical Services, Ypsilanti, MI.,for technical discussions and support of some of the laboratorywork.
Appendix A.
A.1. Pretreatments and coatings studied (descriptions provided byPauline Smith of ARL)
A.1.1. Metal pretreatmentConversion coatings: Typically, conversion coatings are thin and
are below a half-micron (�) in thickness. Coating weights areinversely dependent on the inherent corrosion resistance of the alu-minum alloy. The following conversion coatings were employed inthe present study:
Alodine 1200S is a chromate control, and based on chromicacid, fluorides, and ferricyanide. The film is mostly chromium
oxide/aluminum oxide. The chromium oxide in the film consistsof about half trivalent and half hexavalent chromium. It is one ofthe best treatments from an historically performance stand point.Treatment weight is 40 –70 mg/sq. ft. on AA-2024-T3.
Navair TCP is based on zirconium fluoride and trivalentchromium sulfate; it is one of the best all-around chromate alter-natives. The film is mostly zirconium oxide/aluminum oxide withapproximately 3–5% by weight trivalent chromium and complexeswith the zirconium compound. Treatment weight is 30–50 mg/sq.ft. on AA-2024-T3.
Alodine 5700 is based on zirconium oxide and titanium fluoride;it is one of the best non-chrome conversion coatings. It functions asan adhesion promoter and must be coated to offer corrosion protec-tion. The film is mostly zirconium oxide/titanium oxide/aluminumoxide. Treatment weight is usually below 15 mg/sq. ft.
All three pretreatments were deposited by the same traditionalprocess used for the chromate control, Alodine 1200S. The onlystipulation is that TCP and Alodine 5700 are not used with sili-cate cleaners in the process. They were deposited by immersion,spray or wipe-on, at ambient (75–80 ◦F) temperatures. Dependingon the condition of the metals, (mill marks, ink, oil), the usual pro-cedure is to solvent wipe or vapor degrease with acetone or methylethyl ketone, followed with a hot, mildly alkaline, non-silicate, non-etching aluminum cleaner. Then, an acid etch and desmit, and theninto the conversion coating solution. Better results are obtainedwhen there is 1.5–10 min of contact time with the conversion coat-ing solution.
Alodine 1200S has the lowest pH and is the most active solution;therefore, it generally has the shortest reaction time of 1.5–3.0 min.Next is Alodine 5700, with a 3.0–5.0 min contact and the TCP isusually within 5.0 min. The contact times are longer for spray pro-cessing than for immersion processing.
Wash primer. DoD-P-15328 is formulated as a low-solid,solvent-base that contains polyvinyl butyral, phosphoric acid andzinc chromate. It serves to promote adhesion and minimize corro-sion.
Wash primers are characteristically thin 0.5–0.7 mil (1mil = 0.001 in.), cross-linked coatings applied by HVLP spray-ing directly to the bare metal substrate to provide protection fromcorrosion and promote adhesion.
The CARC system application specification, MIL-C-53072Crequires that metal surfaces on tactical vehicles be treated toimprove adhesion and corrosion resistance prior to coating withan epoxy primer and a camouflage topcoat. In original equipmentmanufacturer (OEM) processes, the surface treatment is generallyperformed by a five-stage immersion process, for instance, zincphosphate prescribed in TT-C-490.
The purpose of the DoD-P-15328D wash primer is to enhancecorrosion resistance, through the passivation of the metal sur-face. In the U.S. Army’s Chemical Agent Resistant Coating (CARC)System, the metal surface is coated with a wash primer, over-coated with an epoxy primer and followed by a camouflageurethane topcoat. Several coating procedures specify the use ofthe wash primer, DoD-P-15328D, as a surface treatment prior tothe application of an epoxy primer and polyurethane topcoat CARCsystem.
The material is furnished in two components. Component A haspolyvinyl butyral, zinc chromate, magnesium silicate and phospho-ric acid in Component B.
A.2. Primer
MIL-P-53022 is the current solvent-based, epoxy primer, for-mulated with corrosion inhibiting pigments. This specificationcovers a flash drying, corrosion inhibiting epoxy primer forferrous and nonferrous metals. The primer is lead and chro-
Author's personal copy
F.L. Floyd et al. / Progress in Organic Coatings 66 (2009) 8–34 17
mate free and meets the air pollution requirements for solventemissions.
The material is furnished in two components. Component Ais a pigmented bisphenol type epoxy resin. Component B is analiphatic polyamide epoxy resin adduct. Applied by HVLP spray-ing, DFT of 0.0012–0.0015 in. Pigments are Titanium dioxide, Zincphosphate, corrosion inhibiting pigments (zinc complex SicorinRZ) and magnesium silicates. Pigments = 54%, vehicle solids = 23%,volatiles = 22%, density = 13.0.
A.3. Topcoats
MIL-DTL-64159, type II, is formulated with a novel pigmentpackage and uses polymeric beads for flattening agents. It is thewater-dispersible, aliphatic polyurethane coatings. It is the finishcoat on all military tactical equipment, which includes ground, avi-ation and related support assets. The materials are free of hazardousair pollutants (HAP-free), lead, chromate (hexavalent chromium),and have a maximum volatile organic compound (VOC) content of220 g/L (1.8 lb/gal) as packaged.
The material is furnished in two components: Component A con-sists of a hydroxyl functional polyurethane dispersion, prime andextender pigments, additives and solvents. Component B consistsof an aliphatic isocyanate prepolymer type that is dispersible inwater that may be combined with volatile solvents. The mixingratio shall be two parts of Component A to one part of ComponentB. The extender pigments (flattening agents) composed of polymerbased of polyurethane or urea formaldehyde condensation typepolymers or other polymeric composition. Applied by HVLP spray,DFT 0.002–0.00025 in.
Pigments = 34%, vehicle solids = 16%, volatiles = 50%, den-sity = 11.0. PVC = 23.3.
MIL-C-53039 is the single component, solvent-based CARC, analiphatic polyurethane coating. It is used as a finish coat on militarycombat equipment. The coating is lead and hexavalent chromiumfree and has a maximum of 180 g/L (1.5 pounds/gallon) volatileorganic compounds with zero volatile hazardous air pollutants.
The material is a single package and consists of an aliphatic poly-isocyanate prepolymer combined with volatile solvents, pigments,extenders and additives. Iron oxides used as hiding pigments shallbe of synthetic origins and not naturally occurring. The titaniumdioxide is rutile, chalk resistant. No lead or hexavalent chromiumpigments used. The non-volatile vehicle shall be a hydroxyl termi-nated prepolymer reacted with an aliphatic polyisocyanate.
Applied by HVLP Spray the coating to a dry film thicknessbetween 0.002 ± 0.0002 inches (0.0508 ± 0.00508 mm).
Pigments = 39%, vehicle solids = 22%, volatiles = 40%, den-sity = 11.1.
Appendix B. B 117 and GM 9540 corrosion test results andAC equivalent circuit element data
Table 4Corrosion testing correlations B 117 continuous vs. GM 9540
cyclic tests.ARL panel series Regression correlations
r2 B 117 vs. GM 9540 Sample size
AluminumAll panels 0.724 18Full coatings systems 0.601 10Primer plus pretreatment 0.983 3Pretreatment only 0.922 4
SteelAll panels 0.836 6Full coatings systems 0.992 4Primer only 1.000 2All panels 0.727 24
B 117 r2 Sample size
Al: pretreat only vs. primer + topcoat 0.958 4Al: pretreat only vs. primer only 0.997 3
GM9540Al: pretreat only vs. primer + topcoat 0.494 4Al: pretreat only vs. primer only 1.000 3
Author's personal copy18
F.L.Floydet
al./Progressin
Organic
Coatings66
(2009)8–34
Table 5Corrosion testing results B 117 continuous and GM 9540 cyclic tests.Panel ID Substrate Pretreatment Primer Topcoat B 117 Continuous salt spray GM 9540 cyclic test
200 h 400 h 600 h 800 h Sum 10 Cyc 20 Cyc 30 Cyc 40 Cyc Sum
2 Al2024 T3 Alodine 1200 MIL-P-53022 MIL-DTL-64159 ON ON ON 00 00 7 00 7 65 9 ON ON ON ON ON ON ON 721 Al2024 T3 Alodine 1200 MIL-P-53022 MIL-P-53039 ON ON ON ON ON 8 00 9 70 10 ON ON ON ON ON ON ON 733 Al2024 T3 NAVAIR TCP MIL-P-53022 MIL-DTL-64159 00 8 8 ON On 00 7 7 61 ON ON 00 ON ON 7 00 On 654 Al2024 T3 NAVAIR TCP MIL-P-53022 MIL-P-53039 ON 7 7 00 00 On 8 6 59 ON ON ON ON 00 9 00 00 695 Al2024 T3 Alodine 5700 MIL-P-53022 MIL-DTL-64159 8 00 8 7 4 3 4 5 47 ON 3 5 3 4 5 1 3 336 Al2024 T3 Alodine 5700 MIL-P-53022 MIL-P-53039 7 00 7 7 8 7 7 5 56 00 8 6 9 5 6 4 4 507 Al2024 T3 DoD-P-15328 MIL-P-53022 MIL-DTL-64159 10 10 ON ON ON 00 00 00 71 10 5 5 4 5 On 2 5 428 Al2024 T3 DoD-P-15328 MIL-P-53022 MIL-P-53039 10 9 ON ON ON ON ON 00 72 8 7 5 6 4 On 3 4 4314 Al2024 T3 None MIL-P-53022 MIL-DTL-64159 7 00 3 5 Is) 7 5 7 44 4 5 3 4 3 3 1 1 2413 Al2024 T3 None MIL-P-53022 MIL-P-53039 7 On 6 9 ON 5 5 5 49 8 4 4 4 3 3 2 0 2816 Al2024 T3 NAVAIR TCP MIL-P-53022 None 9 8 9 9 8 8 7 8 66 9 9 9 8 9 9 8 8 6917 Al2024 T3 Alodine 1200 MIL-P-53022 None 9 9 9 9 9 9 9 8 71 9 9 8 9 9 9 8 8 6918 Al2024 T3 Alodine 5700 MIL-P-53022 None 5 8 6 7 5 5 5 4 45 6 7 5 5 4 4 3 4 3820 Al2024 T3 NAVAIR TCP None None 7 7 5 5 4 4 3 3 38 8 9 7 7 7 7 6 6 5719 Al2024 T3 Alodine 1200 None None 6 6 6 7 5 5 4 4 43 9 9 7 7 7 7 6 6 5821 Al2024 T3 Alodine 5700 None None 0 0 0 0 0 0 0 0 0 1 1 0 0 0 0 0 0 222 Al2024 T3 DoD-P-15328 None None 10 10 10 10 8 8 8 7 71 10 9 9 9 8 7 7 6 6528 Al2024 T3 None None Aircraft green 8 9 8 9 9 9 0 0 52 6 8 8 8 4 7 7 7 5510 Fe 1018 None MIL-P-53022 MIL-DTL-64159 7 7 7 6 7 7 7 3 51 7 7 5 6 5 5 5 4 449 Fe 1018 None MIL-P-53022 MIL-P-53039 7 7 7 7 7 5 4 5 49 6 6 5 5 5 4 3 4 3811 Fe 1018 Bonderite 952 P60 MIL-P-53022 MIL-DTL-64159 00 00 7 8 6 5 7 7 56 7 00 00 7 7 7 7 7 5812 Fe 1018 Bonderite 952 P60 MIL-P-53022 MIL-P-53039 00 00 8 7 7 7 7 6 58 8 00 00 8 7 7 7 7 6023 Fe 1018 Bonderite 952 P60 MIL-P-53022 None 7 7 7 On 4 7 5 5 48 7 7 6 7 6 6 5 6 5015 Fe 1018 DoD-P-15328 MIL-P-53022 None 7 7 6 On 5 5 4 3 43 6 6 5 6 4 5 4 4 40
Mean 53.5 50.1S.D. 15.5 17.6%S.D. 29.0% 35.2%
CorrelationsNotes: Corrosionratings for eachinterval are madeon differentpanels
Al–SS
Al–cyclic 1Fe–SSFe–cyclic
Author's personal copyF.L.Floyd
etal./Progress
inO
rganicCoatings
66(2009)
8–3419
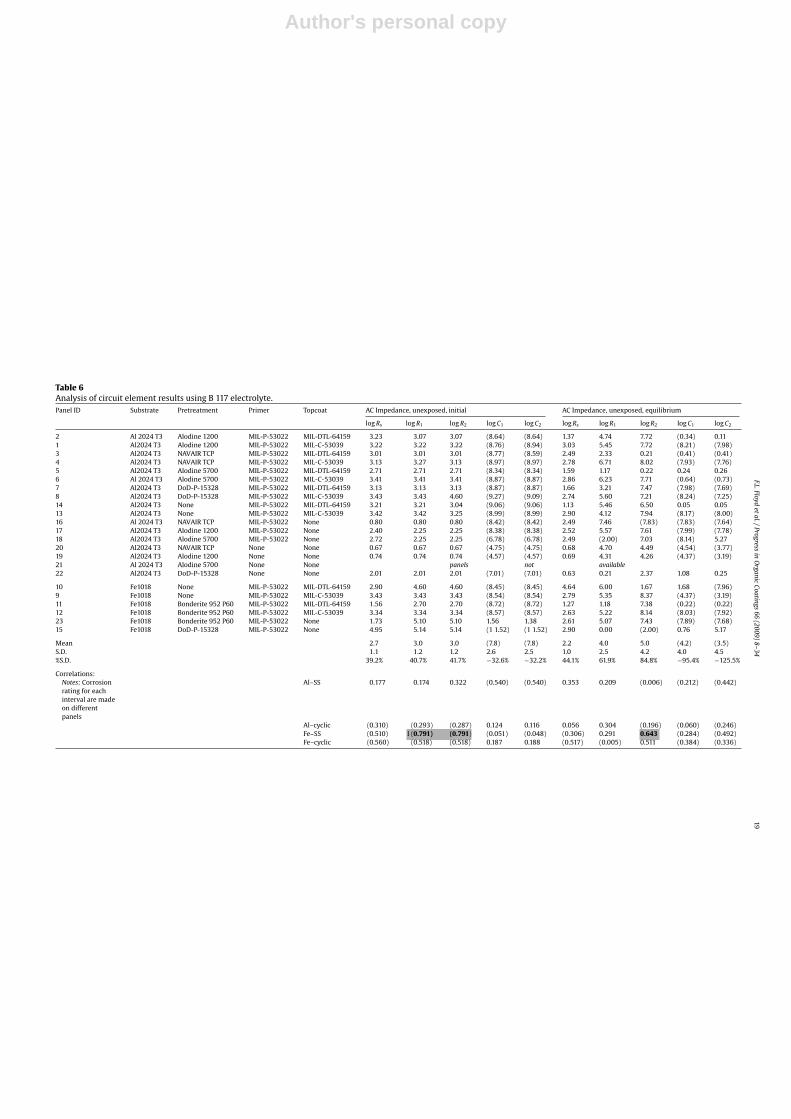
Table 6Analysis of circuit element results using B 117 electrolyte.Panel ID Substrate Pretreatment Primer Topcoat AC Impedance, unexposed, initial AC Impedance, unexposed, equilibrium
log Rs log R1 log R2 log C1 log C2 log Rs log R1 log R2 log C1 log C2
2 Al 2024 T3 Alodine 1200 MIL-P-53022 MIL-DTL-64159 3.23 3.07 3.07 (8.64) (8.64) 1.37 4.74 7.72 (0.34) 0.111 Al2024 T3 Alodine 1200 MIL-P-53022 MIL-C-53039 3.22 3.22 3.22 (8.76) (8.94) 3.03 5.45 7.72 (8.21) (7.98)3 Al2024 T3 NAVAIR TCP MIL-P-53022 MIL-DTL-64159 3.01 3.01 3.01 (8.77) (8.59) 2.49 2.33 0.21 (0.41) (0.41)4 Al2024 T3 NAVAIR TCP MIL-P-53022 MIL-C-53039 3.13 3.27 3.13 (8.97) (8.97) 2.78 6.71 8.02 (7.93) (7.76)5 Al2024 T3 Alodine 5700 MIL-P-53022 MIL-DTL-64159 2.71 2.71 2.71 (8.34) (8.34) 1.59 1.17 0.22 0.24 0.266 Al 2024 T3 Alodine 5700 MIL-P-53022 MIL-C-53039 3.41 3.41 3.41 (8.87) (8.87) 2.86 6.23 7.71 (0.64) (0.73)7 Al2024 T3 DoD-P-15328 MIL-P-53022 MIL-DTL-64159 3.13 3.13 3.13 (8.87) (8.87) 1.66 3.21 7.47 (7.98) (7.69)8 Al2024 T3 DoD-P-15328 MIL-P-53022 MIL-C-53039 3.43 3.43 4.60 (9.27) (9.09) 2.74 5.60 7.21 (8.24) (7.25)14 Al2024 T3 None MIL-P-53022 MIL-DTL-64159 3.21 3.21 3.04 (9.06) (9.06) 1.13 5.46 6.50 0.05 0.0513 Al2024 T3 None MIL-P-53022 MIL-C-53039 3.42 3.42 3.25 (8.99) (8.99) 2.90 4.12 7.94 (8.17) (8.00)16 Al 2024 T3 NAVAIR TCP MIL-P-53022 None 0.80 0.80 0.80 (8.42) (8.42) 2.49 7.46 (7.83) (7.83) (7.64)17 Al2024 T3 Alodine 1200 MIL-P-53022 None 2.40 2.25 2.25 (8.38) (8.38) 2.52 5.57 7.61 (7.99) (7.78)18 Al2024 T3 Alodine 5700 MIL-P-53022 None 2.72 2.25 2.25 (6.78) (6.78) 2.49 (2.00) 7.03 (8.14) 5.2720 Al2024 T3 NAVAIR TCP None None 0.67 0.67 0.67 (4.75) (4.75) 0.68 4.70 4.49 (4.54) (3.77)19 Al2024 T3 Alodine 1200 None None 0.74 0.74 0.74 (4.57) (4.57) 0.69 4.31 4.26 (4.37) (3.19)21 Al 2024 T3 Alodine 5700 None None panels not available22 Al2024 T3 DoD-P-15328 None None 2.01 2.01 2.01 (7.01) (7.01) 0.63 0.21 2.37 1.08 0.25
10 Fe1018 None MIL-P-53022 MIL-DTL-64159 2.90 4.60 4.60 (8.45) (8.45) 4.64 6.00 1.67 1.68 (7.96)9 Fe1018 None MIL-P-53022 MIL-C-53039 3.43 3.43 3.43 (8.54) (8.54) 2.79 5.35 8.37 (4.37) (3.19)11 Fe1018 Bonderite 952 P60 MIL-P-53022 MIL-DTL-64159 1.56 2.70 2.70 (8.72) (8.72) 1.27 1.18 7.38 (0.22) (0.22)12 Fe1018 Bonderite 952 P60 MIL-P-53022 MIL-C-53039 3.34 3.34 3.34 (8.57) (8.57) 2.63 5.22 8.14 (8.03) (7.92)23 Fe1018 Bonderite 952 P60 MIL-P-53022 None 1.73 5.10 5.10 1.56 1.38 2.61 5.07 7.43 (7.89) (7.68)15 Fe1018 DoD-P-15328 MIL-P-53022 None 4.95 5.14 5.14 (1 1.52) (1 1.52) 2.90 0.00 (2.00) 0.76 5.17
Mean 2.7 3.0 3.0 (7.8) (7.8) 2.2 4.0 5.0 (4.2) (3.5)S.D. 1.1 1.2 1.2 2.6 2.5 1.0 2.5 4.2 4.0 4.5%S.D. 39.2% 40.7% 41.7% −32.6% −32.2% 44.1% 61.9% 84.8% −95.4% −125.5%
Correlations:Notes: Corrosionrating for eachinterval are madeon differentpanels
Al–SS 0.177 0.174 0.322 (0.540) (0.540) 0.353 0.209 (0.006) (0.212) (0.442)
Al–cyclic (0.310) (0.293) (0.287) 0.124 0.116 0.056 0.304 (0.196) (0.060) (0.246)Fe–SS (0.510) I (0.791) (0.791) (0.051) (0.048) (0.306) 0.291 0.643 (0.284) (0.492)Fe–cyclic (0.560) (0.518) (0.518) 0.187 0.188 (0.517) (0.005) 0.511 (0.384) (0.336)
Author's personal copy20
F.L.Floydet
al./Progressin
Organic
Coatings66
(2009)8–34
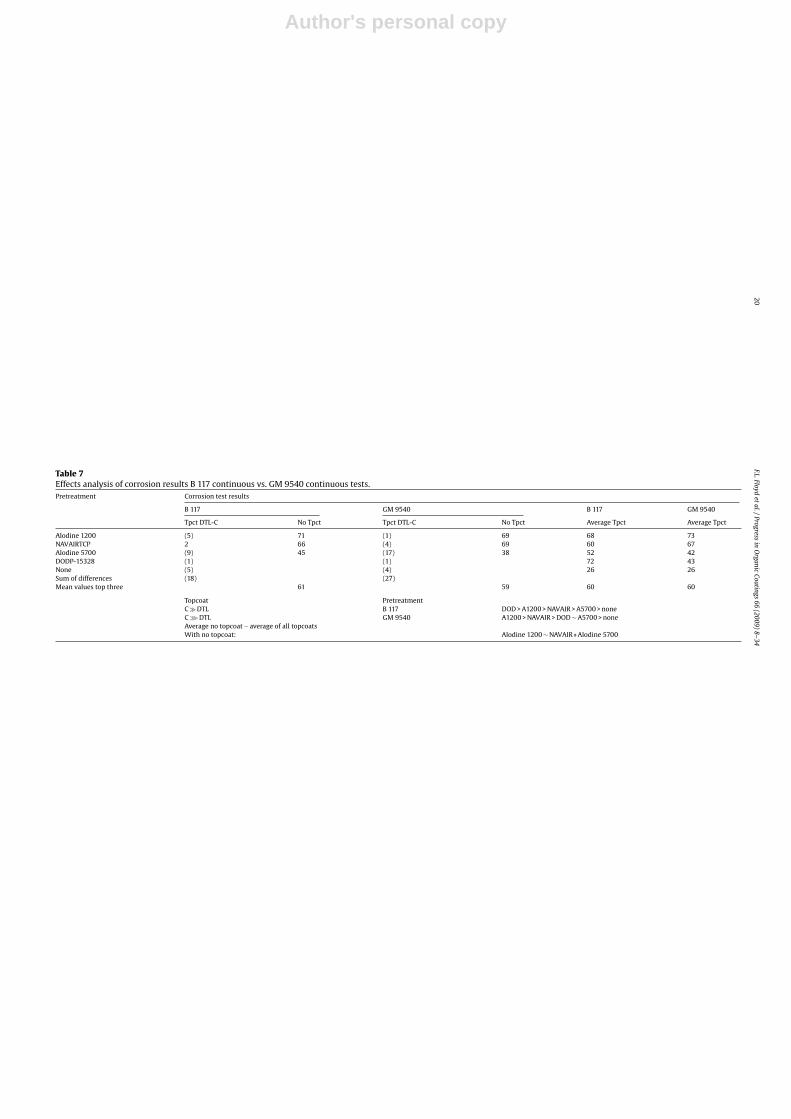
Table 7Effects analysis of corrosion results B 117 continuous vs. GM 9540 continuous tests.Pretreatment Corrosion test results
B 117 GM 9540 B 117 GM 9540
Tpct DTL-C No Tpct Tpct DTL-C No Tpct Average Tpct Average Tpct
Alodine 1200 (5) 71 (1) 69 68 73NAVAIRTCP 2 66 (4) 69 60 67Alodine 5700 (9) 45 (17) 38 52 42DODP-15328 (1) (1) 72 43None (5) (4) 26 26Sum of differences (18) (27)Mean values top three 61 59 60 60
Topcoat PretreatmentC � DTL B 117 DOD > A1200 > NAVAIR > A5700 > noneC≫DTL GM 9540 A1200 > NAVAIR > DOD ∼ A5700 > noneAverage no topcoat − average of all topcoatsWith no topcoat: Alodine 1200 ∼ NAVAIR » Alodine 5700
Author's personal copyF.L.Floyd
etal./Progress
inO
rganicCoatings
66(2009)
8–3421
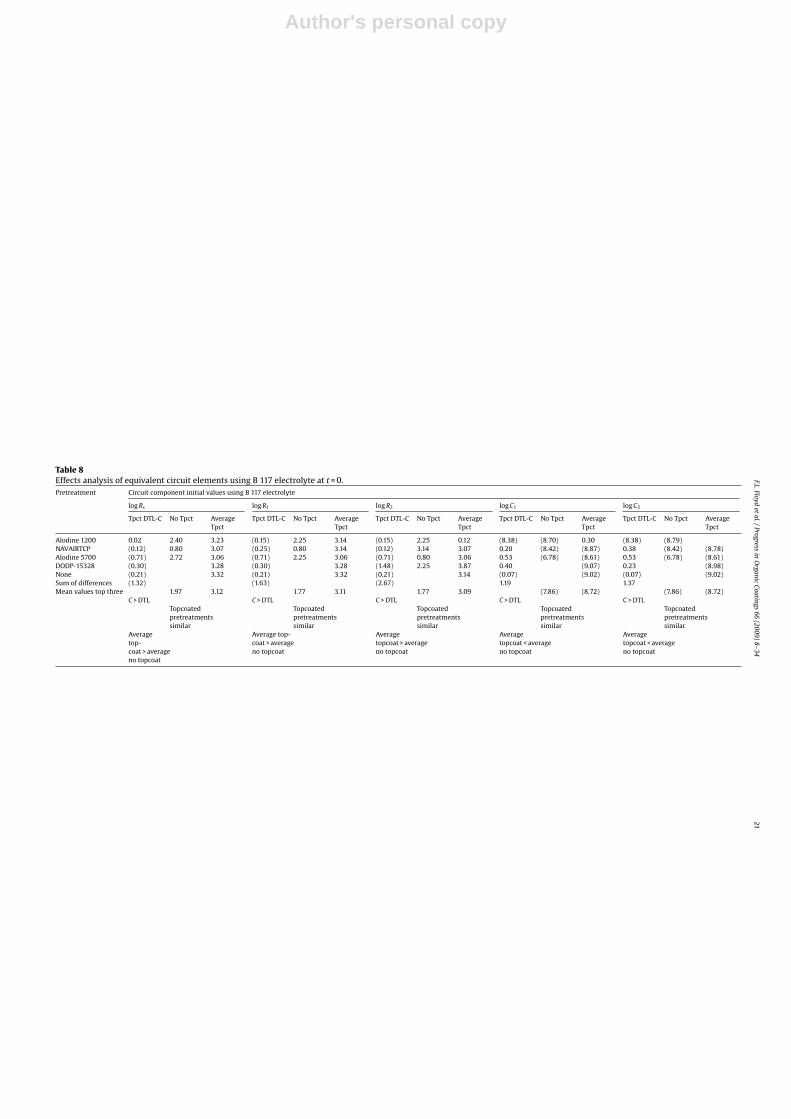
Table 8Effects analysis of equivalent circuit elements using B 117 electrolyte at t = 0.Pretreatment Circuit component initial values using B 117 electrolyte
log Rs log R1 log R2 log C1 log C2
Tpct DTL-C No Tpct AverageTpct
Tpct DTL-C No Tpct AverageTpct
Tpct DTL-C No Tpct AverageTpct
Tpct DTL-C No Tpct AverageTpct
Tpct DTL-C No Tpct AverageTpct
Alodine 1200 0.02 2.40 3.23 (0.15) 2.25 3.14 (0.15) 2.25 0.12 (8.38) (8.70) 0.30 (8.38) (8.79)NAVAIRTCP (0.12) 0.80 3.07 (0.25) 0.80 3.14 (0.12) 3.14 3.07 0.20 (8.42) (8.87) 0.38 (8.42) (8.78)Alodine 5700 (0.71) 2.72 3.06 (0.71) 2.25 3.06 (0.71) 0.80 3.06 0.53 (6.78) (8.61) 0.53 (6.78) (8.61)DODP-15328 (0.30) 3.28 (0.30) 3.28 (1.48) 2.25 3.87 0.40 (9.07) 0.23 (8.98)None (0.21) 3.32 (0.21) 3.32 (0.21) 3.14 (0.07) (9.02) (0.07) (9.02)Sum of differences (1.32) (1.63) (2.67) 1.19 1.37Mean values top three 1.97 3.12 1.77 3.11 1.77 3.09 (7.86) (8.72) (7.86) (8.72)
C > DTL C > DTL C > DTL C > DTL C > DTLTopcoatedpretreatmentssimilar
Topcoatedpretreatmentssimilar
Topcoatedpretreatmentssimilar
Topcoatedpretreatmentssimilar
Topcoatedpretreatmentssimilar
Averagetop-coat > averageno topcoat
Average top-coat > averageno topcoat
Averagetopcoat > averageno topcoat
Averagetopcoat < averageno topcoat
Averagetopcoat < averageno topcoat
Author's personal copy22
F.L.Floydet
al./Progressin
Organic
Coatings66
(2009)8–34
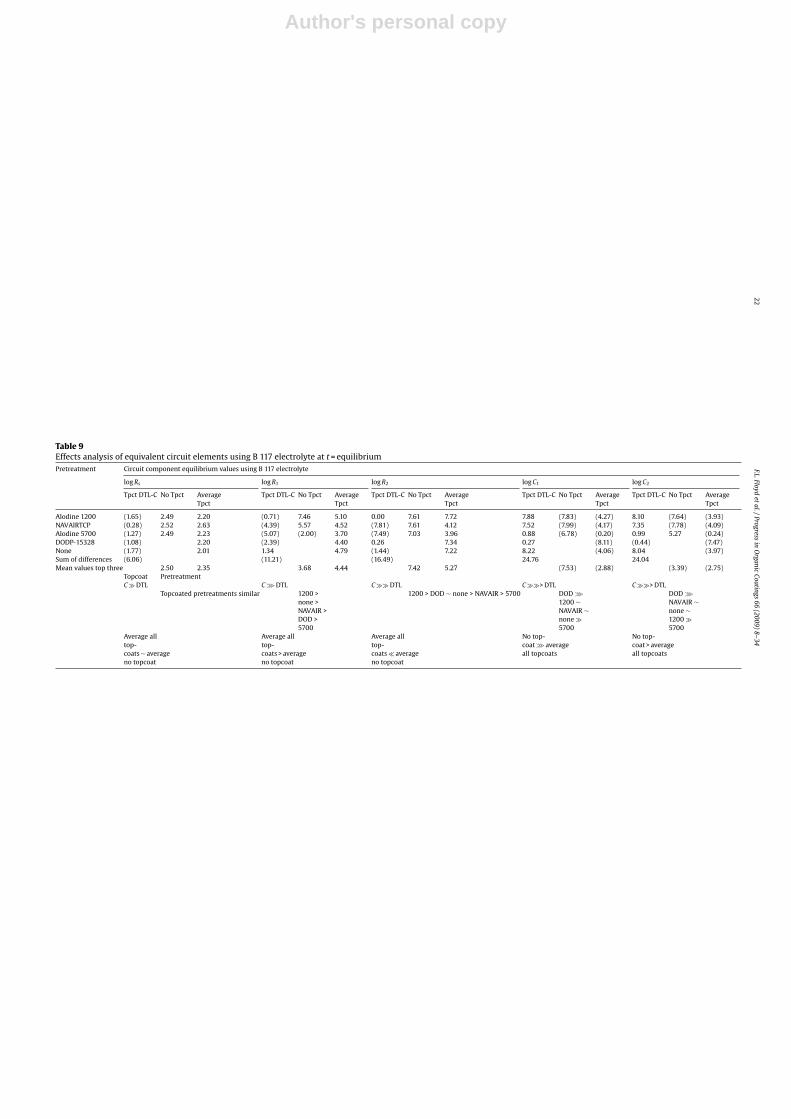
Table 9Effects analysis of equivalent circuit elements using B 117 electrolyte at t = equilibriumPretreatment Circuit component equilibrium values using B 117 electrolyte
log Rs log R1 log R2 log C1 log C2
Tpct DTL-C No Tpct AverageTpct
Tpct DTL-C No Tpct AverageTpct
Tpct DTL-C No Tpct AverageTpct
Tpct DTL-C No Tpct AverageTpct
Tpct DTL-C No Tpct AverageTpct
Alodine 1200 (1.65) 2.49 2.20 (0.71) 7.46 5.10 0.00 7.61 7.72 7.88 (7.83) (4.27) 8.10 (7.64) (3.93)NAVAIRTCP (0.28) 2.52 2.63 (4.39) 5.57 4.52 (7.81) 7.61 4.12 7.52 (7.99) (4.17) 7.35 (7.78) (4.09)Alodine 5700 (1.27) 2.49 2.23 (5.07) (2.00) 3.70 (7.49) 7.03 3.96 0.88 (6.78) (0.20) 0.99 5.27 (0.24)DODP-15328 (1.08) 2.20 (2.39) 4.40 0.26 7.34 0.27 (8.11) (0.44) (7.47)None (1.77) 2.01 1.34 4.79 (1.44) 7.22 8.22 (4.06) 8.04 (3.97)Sum of differences (6.06) (11.21) (16.49) 24.76 24.04Mean values top three 2.50 2.35 3.68 4.44 7.42 5.27 (7.53) (2.88) (3.39) (2.75)
Topcoat PretreatmentC � DTL C≫DTL C �� DTL C ��> DTL C ��> DTL
Topcoated pretreatments similar 1200 >none >NAVAIR >DOD >5700
1200 > DOD ∼ none > NAVAIR > 5700 DOD ≫1200 ∼NAVAIR ∼none �5700
DOD ≫NAVAIR ∼none ∼1200 �5700
Average alltop-coats ∼ averageno topcoat
Average alltop-coats > averageno topcoat
Average alltop-coats � averageno topcoat
No top-coat≫ averageall topcoats
No top-coat > averageall topcoats
Author's personal copyF.L.Floyd
etal./Progress
inO
rganicCoatings
66(2009)
8–3423
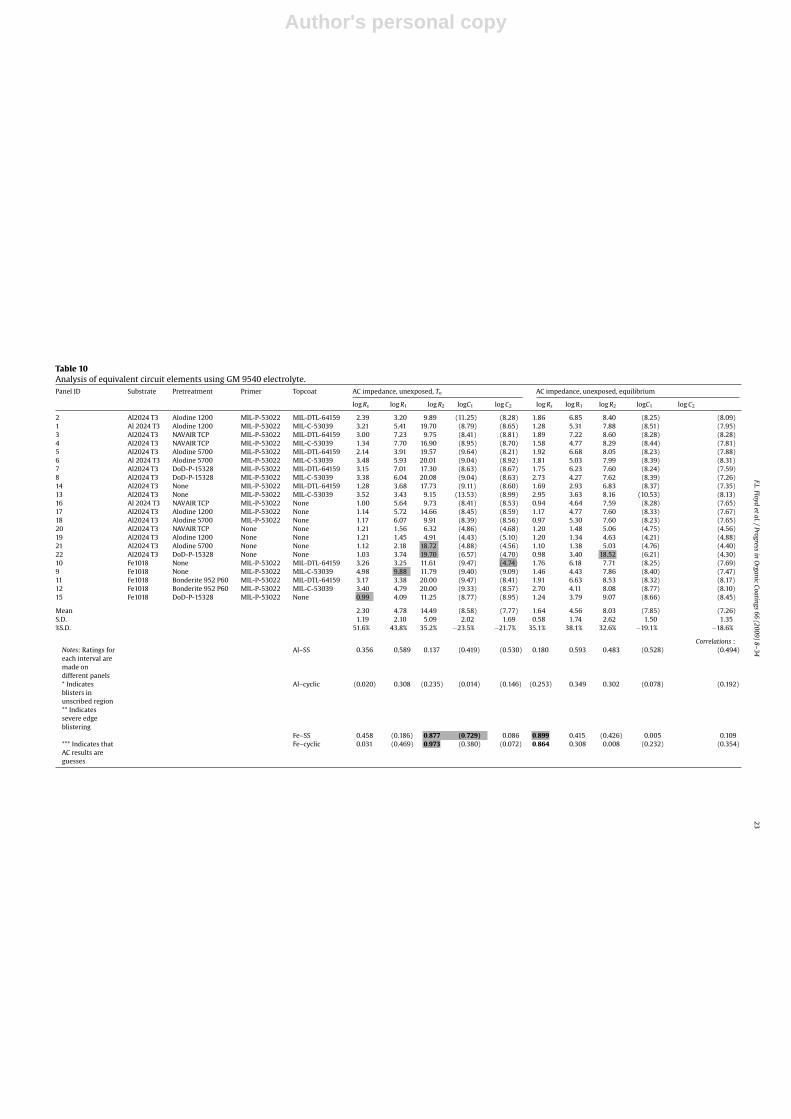
Table 10Analysis of equivalent circuit elements using GM 9540 electrolyte.Panel ID Substrate Pretreatment Primer Topcoat AC impedance, unexposed, To AC impedance, unexposed, equilibrium
log Rs log R1 log R2 logC1 log C2 log Rs log R1 log R2 logC1 log C2
2 Al2024 T3 Alodine 1200 MIL-P-53022 MIL-DTL-64159 2.39 3.20 9.89 (11.25) (8.28) 1.86 6.85 8.40 (8.25) (8.09)1 Al 2024 T3 Alodine 1200 MIL-P-53022 MIL-C-53039 3.21 5.41 19.70 (8.79) (8.65) 1.28 5.31 7.88 (8.51) (7.95)3 Al2024 T3 NAVAIR TCP MIL-P-53022 MIL-DTL-64159 3.00 7.23 9.75 (8.41) (8.81) 1.89 7.22 8.60 (8.28) (8.28)4 Al2024 T3 NAVAIR TCP MIL-P-53022 MIL-C-53039 1.34 7.70 16.90 (8.95) (8.70) 1.58 4.77 8.29 (8.44) (7.81)5 Al2024 T3 Alodine 5700 MIL-P-53022 MIL-DTL-64159 2.14 3.91 19.57 (9.64) (8.21) 1.92 6.68 8.05 (8.23) (7.88)6 Al 2024 T3 Alodine 5700 MIL-P-53022 MIL-C-53039 3.48 5.93 20.01 (9.04) (8.92) 1.81 5.03 7.99 (8.39) (8.31)7 Al2024 T3 DoD-P-15328 MIL-P-53022 MIL-DTL-64159 3.15 7.01 17.30 (8.63) (8.67) 1.75 6.23 7.60 (8.24) (7.59)8 Al2024 T3 DoD-P-15328 MIL-P-53022 MIL-C-53039 3.38 6.04 20.08 (9.04) (8.63) 2.73 4.27 7.62 (8.39) (7.26)14 Al2024 T3 None MIL-P-53022 MIL-DTL-64159 1.28 3.68 17.73 (9.11) (8.60) 1.69 2.93 6.83 (8.37) (7.35)13 Al2024 T3 None MIL-P-53022 MIL-C-53039 3.52 3.43 9.15 (13.53) (8.99) 2.95 3.63 8.16 (10.53) (8.13)16 Al 2024 T3 NAVAIR TCP MIL-P-53022 None 1.00 5.64 9.73 (8.41) (8.53) 0.94 4.64 7.59 (8.28) (7.65)17 Al2024 T3 Alodine 1200 MIL-P-53022 None 1.14 5.72 14.66 (8.45) (8.59) 1.17 4.77 7.60 (8.33) (7.67)18 Al2024 T3 Alodine 5700 MIL-P-53022 None 1.17 6.07 9.91 (8.39) (8.56) 0.97 5.30 7.60 (8.23) (7.65)20 Al2024 T3 NAVAIR TCP None None 1.21 1.56 6.32 (4.86) (4.68) 1.20 1.48 5.06 (4.75) (4.56)19 Al2024 T3 Alodine 1200 None None 1.21 1.45 4.91 (4.43) (5.10) 1.20 1.34 4.63 (4.21) (4.88)21 Al2024 T3 Alodine 5700 None None 1.12 2.18 18.72 (4.88) (4.56) 1.10 1.38 5.03 (4.76) (4.40)22 Al2024 T3 DoD-P-15328 None None 1.03 3.74 19.70 (6.57) (4.70) 0.98 3.40 18.52 (6.21) (4.30)10 Fe1018 None MIL-P-53022 MIL-DTL-64159 3.26 3.25 11.61 (9.47) (4.74) 1.76 6.18 7.71 (8.25) (7.69)9 Fe1018 None MIL-P-53022 MIL-C-53039 4.98 9.88 11.79 (9.40) (9.09) 1.46 4.43 7.86 (8.40) (7.47)11 Fe1018 Bonderite 952 P60 MIL-P-53022 MIL-DTL-64159 3.17 3.38 20.00 (9.47) (8.41) 1.91 6.63 8.53 (8.32) (8.17)12 Fe1018 Bonderite 952 P60 MIL-P-53022 MIL-C-53039 3.40 4.79 20.00 (9.33) (8.57) 2.70 4.11 8.08 (8.77) (8.10)15 Fe1018 DoD-P-15328 MIL-P-53022 None 0.99 4.09 11.25 (8.77) (8.95) 1.24 3.79 9.07 (8.66) (8.45)
Mean 2.30 4.78 14.49 (8.58) (7.77) 1.64 4.56 8.03 (7.85) (7.26)S.D. 1.19 2.10 5.09 2.02 1.69 0.58 1.74 2.62 1.50 1.35%S.D. 51.6% 43.8% 35.2% −23.5% −21.7% 35.1% 38.1% 32.6% −19.1% −18.6%
Correlations :Notes: Ratings foreach interval aremade ondifferent panels
Al–SS 0.356 0.589 0.137 (0.419) (0.530) 0.180 0.593 0.483 (0.528) (0.494)
* Indicatesblisters inunscribed region
Al–cyclic (0.020) 0.308 (0.235) (0.014) (0.146) (0.253) 0.349 0.302 (0.078) (0.192)
** Indicatessevere edgeblistering
Fe–SS 0.458 (0.186) 0.877 (0.729) 0.086 0.899 0.415 (0.426) 0.005 0.109*** Indicates thatAC results areguesses
Fe–cyclic 0.031 (0.469) 0.973 (0.380) (0.072) 0.864 0.308 0.008 (0.232) (0.354)
Author's personal copy24
F.L.Floydet
al./Progressin
Organic
Coatings66
(2009)8–34
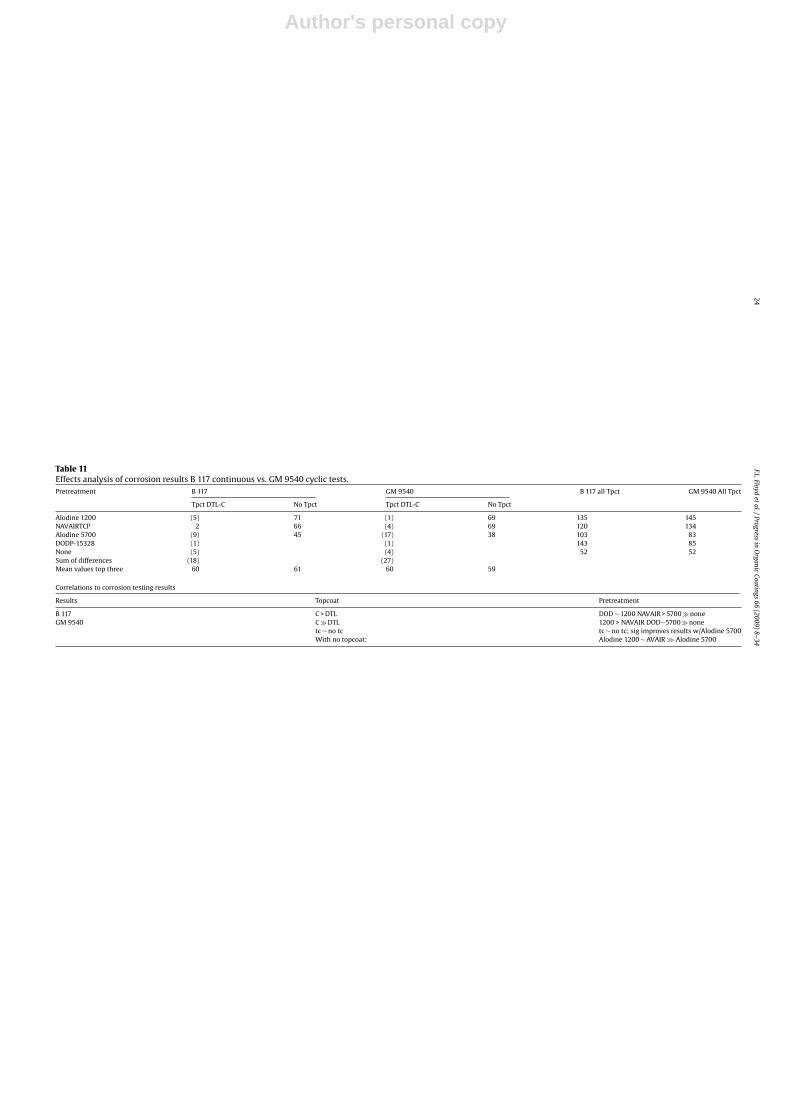
Table 11Effects analysis of corrosion results B 117 continuous vs. GM 9540 cyclic tests.Pretreatment B 117 GM 9540 B 117 all Tpct GM 9540 All Tpct
Tpct DTL-C No Tpct Tpct DTL-C No Tpct
Alodine 1200 (5) 71 (1) 69 135 145NAVAIRTCP 2 66 (4) 69 120 134Alodine 5700 (9) 45 (17) 38 103 83DODP-15328 (1) (1) 143 85None (5) (4) 52 52Sum of differences (18) (27)Mean values top three 60 61 60 59
Correlations to corrosion testing results
Results Topcoat Pretreatment
B 117 C > DTL DOD ∼ 1200 NAVAIR > 5700 � noneGM 9540 C � DTL 1200 > NAVAIR DOD∼5700 � none
tc ∼ no tc tc ∼ no tc; sig improves results w/Alodine 5700With no topcoat: Alodine 1200 ∼ AVAIR≫Alodine 5700
Author's personal copyF.L.Floyd
etal./Progress
inO
rganicCoatings
66(2009)
8–3425
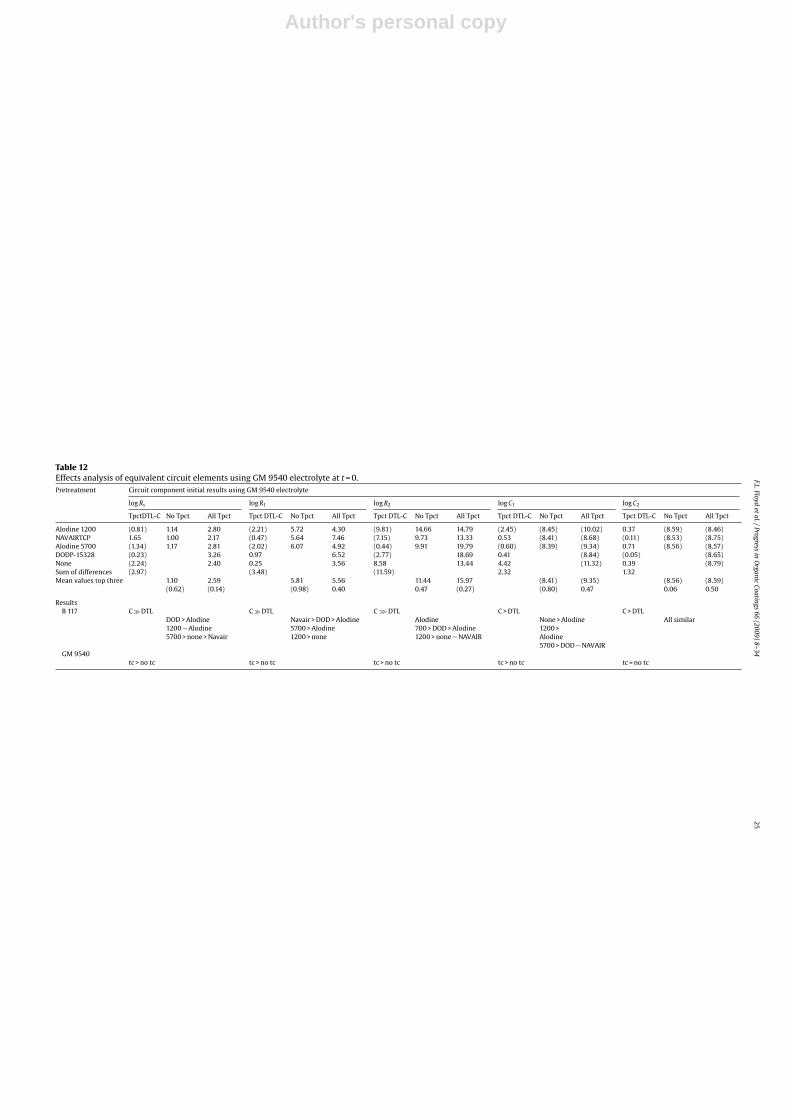
Table 12Effects analysis of equivalent circuit elements using GM 9540 electrolyte at t = 0.Pretreatment Circuit component initial results using GM 9540 electrolyte
log Rs log R1 log R2 log C1 log C2
TpctDTL-C No Tpct All Tpct Tpct DTL-C No Tpct All Tpct Tpct DTL-C No Tpct All Tpct Tpct DTL-C No Tpct All Tpct Tpct DTL-C No Tpct All Tpct
Alodine 1200 (0.81) 1.14 2.80 (2.21) 5.72 4.30 (9.81) 14.66 14.79 (2.45) (8.45) (10.02) 0.37 (8.59) (8.46)NAVAIRTCP 1.65 1.00 2.17 (0.47) 5.64 7.46 (7.15) 9.73 13.33 0.53 (8.41) (8.68) (0.11) (8.53) (8.75)Alodine 5700 (1.34) 1.17 2.81 (2.02) 6.07 4.92 (0.44) 9.91 19.79 (0.60) (8.39) (9.34) 0.71 (8.56) (8.57)DODP-15328 (0.23) 3.26 0.97 6.52 (2.77) 18.69 0.41 (8.84) (0.05) (8.65)None (2.24) 2.40 0.25 3.56 8.58 13.44 4.42 (11.32) 0.39 (8.79)Sum of differences (2.97) (3.48) (11.59) 2.32 1.32Mean values top three 1.10 2.59 5.81 5.56 11.44 15.97 (8.41) (9.35) (8.56) (8.59)
(0.62) (0.14) (0.98) 0.40 0.47 (0.27) (0.80) 0.47 0.06 0.50
ResultsB 117 C � DTL C � DTL C≫DTL C > DTL C > DTL
DOD > Alodine1200 ∼ Alodine5700 > none > Navair
Navair > DOD > Alodine5700 > Alodine1200 > none
Alodine700 > DOD > Alodine1200 > none ∼ NAVAIR
None > Alodine1200 >Alodine5700 > DOD ∼ NAVAIR
All similar
GM 9540tc > no tc tc > no tc tc > no tc tc > no tc tc = no tc
Author's personal copy26
F.L.Floydet
al./Progressin
Organic
Coatings66
(2009)8–34
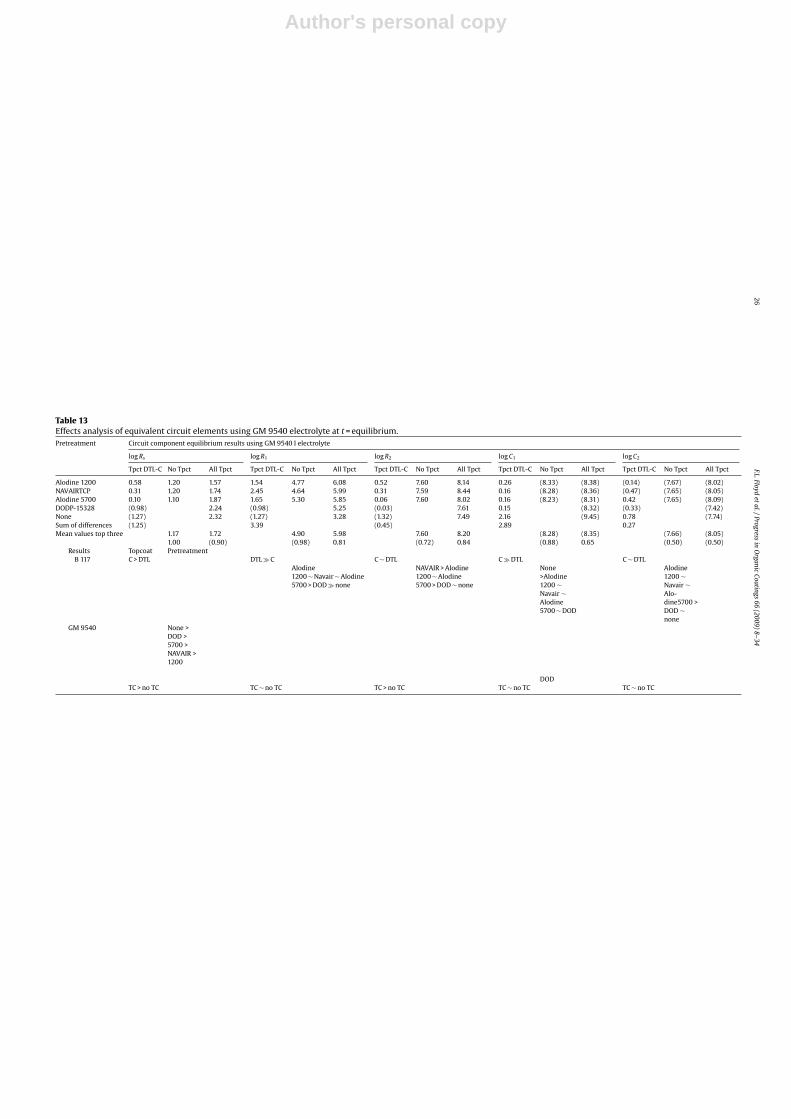
Table 13Effects analysis of equivalent circuit elements using GM 9540 electrolyte at t = equilibrium.Pretreatment Circuit component equilibrium results using GM 9540 I electrolyte
log Rs log R1 log R2 log C1 log C2
Tpct DTL-C No Tpct All Tpct Tpct DTL-C No Tpct All Tpct Tpct DTL-C No Tpct All Tpct Tpct DTL-C No Tpct All Tpct Tpct DTL-C No Tpct All Tpct
Alodine 1200 0.58 1.20 1.57 1.54 4.77 6.08 0.52 7.60 8.14 0.26 (8.33) (8.38) (0.14) (7.67) (8.02)NAVAIRTCP 0.31 1.20 1.74 2.45 4.64 5.99 0.31 7.59 8.44 0.16 (8.28) (8.36) (0.47) (7.65) (8.05)Alodine 5700 0.10 1.10 1.87 1.65 5.30 5.85 0.06 7.60 8.02 0.16 (8.23) (8.31) 0.42 (7.65) (8.09)DODP-15328 (0.98) 2.24 (0.98) 5.25 (0.03) 7.61 0.15 (8.32) (0.33) (7.42)None (1.27) 2.32 (1.27) 3.28 (1.32) 7.49 2.16 (9.45) 0.78 (7.74)Sum of differences (1.25) 3.39 (0.45) 2.89 0.27Mean values top three 1.17 1.72 4.90 5.98 7.60 8.20 (8.28) (8.35) (7.66) (8.05)
1.00 (0.90) (0.98) 0.81 (0.72) 0.84 (0.88) 0.65 (0.50) (0.50)Results Topcoat Pretreatment
B 117 C > DTL DTL � C C ∼ DTL C � DTL C ∼ DTLAlodine1200 ∼ Navair ∼ Alodine5700 > DOD � none
NAVAIR > Alodine1200 ∼ Alodine5700 > DOD ∼ none
None>Alodine1200 ∼Navair ∼Alodine5700 ∼ DOD
Alodine1200 ∼Navair ∼Alo-dine5700 >DOD ∼none
GM 9540 None >DOD >5700 >NAVAIR >1200
DODTC > no TC TC ∼ no TC TC > no TC TC ∼ no TC TC ∼ no TC
Author's personal copyF.L.Floyd
etal./Progress
inO
rganicCoatings
66(2009)
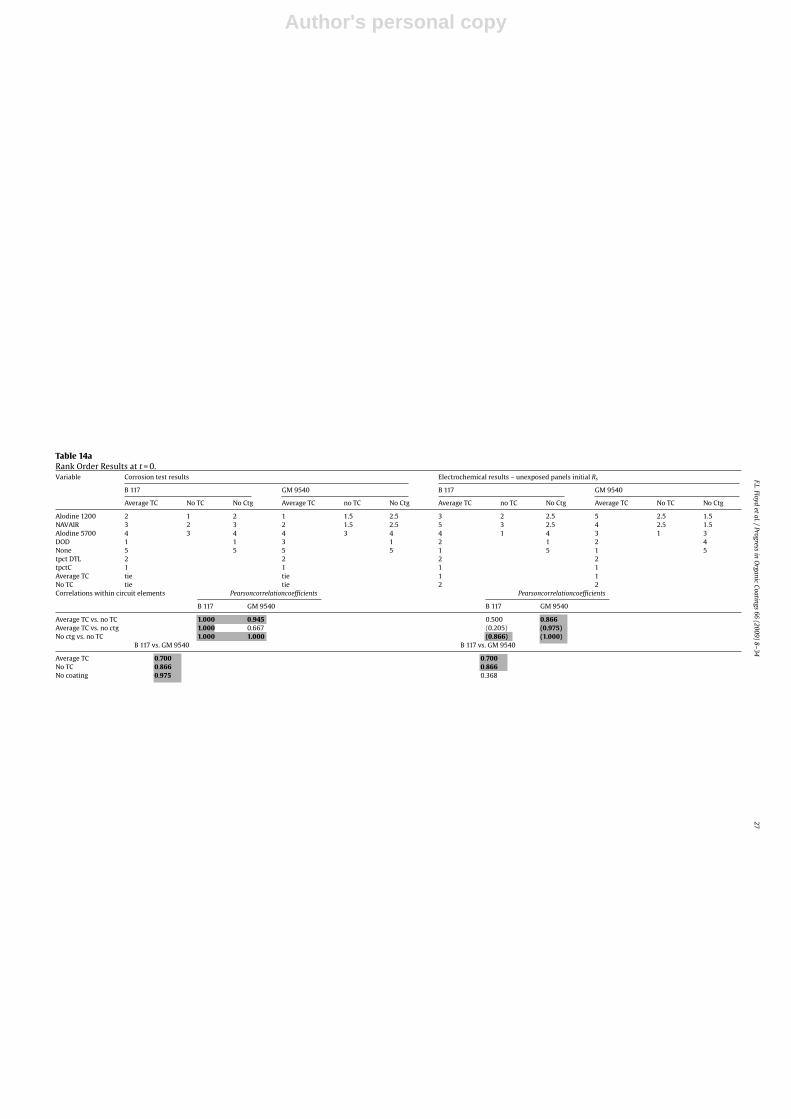
8–3427
Table 14aRank Order Results at t = 0.Variable Corrosion test results Electrochemical results – unexposed panels initial Rs
B 117 GM 9540 B 117 GM 9540
Average TC No TC No Ctg Average TC no TC No Ctg Average TC no TC No Ctg Average TC No TC No Ctg
Alodine 1200 2 1 2 1 1.5 2.5 3 2 2.5 5 2.5 1.5NAVAIR 3 2 3 2 1.5 2.5 5 3 2.5 4 2.5 1.5Alodine 5700 4 3 4 4 3 4 4 1 4 3 1 3DOD 1 1 3 1 2 1 2 4None 5 5 5 5 1 5 1 5tpct DTL 2 2 2 2tpctC 1 1 1 1Average TC tie tie 1 1No TC tie tie 2 2Correlations within circuit elements Pearsoncorrelationcoefficients Pearsoncorrelationcoefficients
B 117 GM 9540 B 117 GM 9540
Average TC vs. no TC 1.000 0.945 0.500 0.866Average TC vs. no ctg 1.000 0.667 (0.205) (0.975)No ctg vs. no TC 1.000 1.000 (0.866) (1.000)
B 117 vs. GM 9540 B 117 vs. GM 9540
Average TC 0.700 0.700No TC 0.866 0.866No coating 0.975 0.368
Author's personal copy28
F.L.Floydet
al./Progressin
Organic
Coatings66
(2009)8–34
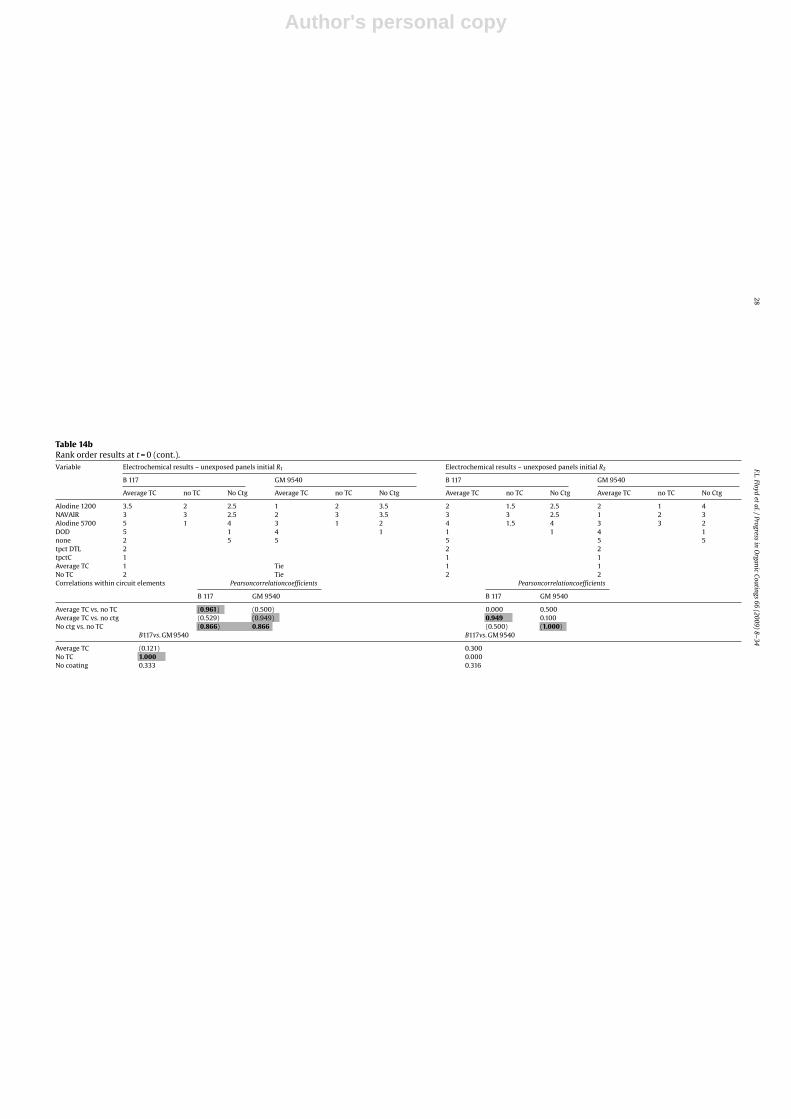
Table 14bRank order results at t = 0 (cont.).Variable Electrochemical results – unexposed panels initial R1 Electrochemical results – unexposed panels initial R2
B 117 GM 9540 B 117 GM 9540
Average TC no TC No Ctg Average TC no TC No Ctg Average TC no TC No Ctg Average TC no TC No Ctg
Alodine 1200 3.5 2 2.5 1 2 3.5 2 1.5 2.5 2 1 4NAVAIR 3 3 2.5 2 3 3.5 3 3 2.5 1 2 3Alodine 5700 5 1 4 3 1 2 4 1.5 4 3 3 2DOD 5 1 4 1 1 1 4 1none 2 5 5 5 5 5tpct DTL 2 2 2tpctC 1 1 1Average TC 1 Tie 1 1No TC 2 Tie 2 2Correlations within circuit elements Pearsoncorrelationcoefficients Pearsoncorrelationcoefficients
B 117 GM 9540 B 117 GM 9540
Average TC vs. no TC (0.961) (0.500) 0.000 0.500Average TC vs. no ctg (0.529) (0.949) 0.949 0.100No ctg vs. no TC (0.866) 0.866 (0.500) (1.000)
B117vs. GM 9540 B117vs. GM 9540
Average TC (0.121) 0.300No TC 1.000 0.000No coating 0.333 0.316
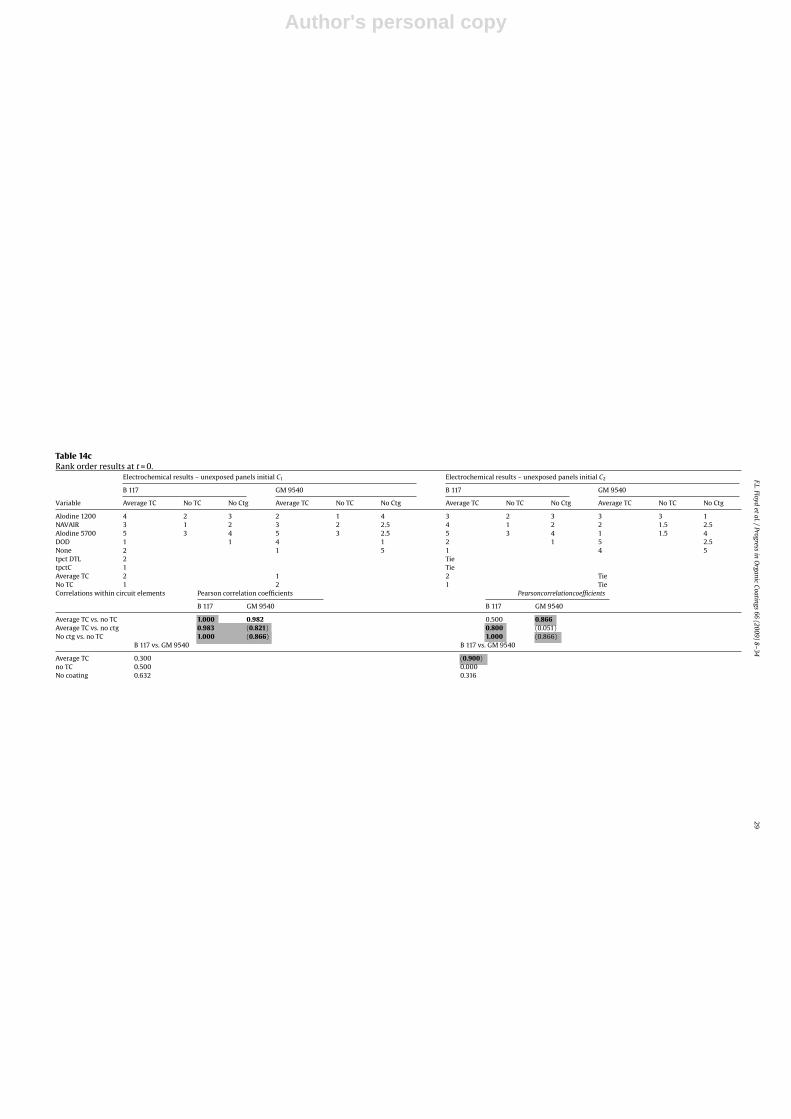
Author's personal copyF.L.Floyd
etal./Progress
inO
rganicCoatings
66(2009)
8–3429
Table 14cRank order results at t = 0.
Electrochemical results – unexposed panels initial C1 Electrochemical results – unexposed panels initial C2
B 117 GM 9540 B 117 GM 9540
Variable Average TC No TC No Ctg Average TC No TC No Ctg Average TC No TC No Ctg Average TC No TC No Ctg
Alodine 1200 4 2 3 2 1 4 3 2 3 3 3 1NAVAIR 3 1 2 3 2 2.5 4 1 2 2 1.5 2.5Alodine 5700 5 3 4 5 3 2.5 5 3 4 1 1.5 4DOD 1 1 4 1 2 1 5 2.5None 2 1 5 1 4 5tpct DTL 2 TietpctC 1 TieAverage TC 2 1 2 TieNo TC 1 2 1 TieCorrelations within circuit elements Pearson correlation coefficients Pearsoncorrelationcoefficients
B 117 GM 9540 B 117 GM 9540
Average TC vs. no TC 1.000 0.982 0.500 0.866Average TC vs. no ctg 0.983 (0.821) 0.800 (0.051)No ctg vs. no TC 1.000 (0.866) 1.000 (0.866)
B 117 vs. GM 9540 B 117 vs. GM 9540
Average TC 0.300 (0.900)no TC 0.500 0.000No coating 0.632 0.316

Author's personal copy30
F.L.Floydet
al./Progressin
Organic
Coatings66
(2009)8–34
Table 15aRank order results at t = equilibrium.Variable Corrosion test results Electrochemical results –- unexposed panels equilibrium Rs
B 117 GM 9540 B 117 Electrolyte GM 9540 Electrolyte
Average TC No TC No Ctg Average TC No TC No Ctg Average TC No TC No Ctg Average TC No TC No Ctg
Alodine1200 2 1 2 1 1.5 2.5 1 1.5 2 5 1 1.5NAVAIR 3 2 3 2 1.5 2.5 2.5 1.5 2 4 2.5 1.5Alodine 5700 4 3 4 4 3 4 4 4 4 3 2.5 3DOD 1 1 3 1 2.5 3 2 1 4No pretreatment 5 5 5 5 2 5tpct DTL 2 2 2 2tpctC 1 1 1 1Average TC tie tie 2 1No TC tie tie 1 2
Correlations within circuit elements Pearson correlation coefficients Pearson correlation coefficients
B 117 GM 9540 B 117 GM 9540
Average TC vs. no TC 1.000 0.945 0.866 (0.866)Average TC vs. no ctg 1.000 0.316 0.816 (0.872)No ctg vs. no TC 1.000 1.000 1.000 0.500
B 117 vs. GM 9540 B 117 vs. GM 9540
Average TC 0.700 (0.564)No TC 0.866 0.500No Coating 0.949 0.272

Author's personal copyF.L.Floyd
etal./Progress
inO
rganicCoatings
66(2009)
8–3431
Table 15bRank order results at t = equlibrium (cont.).Variable Electrochemical results – unexposed panels equilibrium R1 Electrochemical results – unexposed panels equilibrium R2
B 117 Electrolyte GM 9540 electrolyte B 117 Electrolyte GM 9540 electrolyte
Average TC no TC No Ctg Average TC no TC No Ctg Average TC No TC No Ctg Average TC No TC No Ctg
Alodine 1200 3.5 2.5 2 1 2 2 4 1 1 3 2 2.5NAVAIR 1 1 1 3 3 3.5 2 2 2 1 2 4Alodine 5700 2 2.5 4 2 1 3.5 2 3 4 2 2 2.5DOD 3.5 3 4 1 5 3 4 1no pretreatment 5 5 5 5 2 5 5 5tpct DTL 2 2 2 2tpct C 1 1 1 1Average TC 1 Tie 2 1No Tc 2 Tie 1 2
Correlations within circuit elements Pearson correlation coefficients Pearson correlation coefficients
B 117 GM 9540 B 117 GM 9540
Average TC vs. no TC 0.803 0.500 (0.866) *Average TC vs. no ctg 0.316 (0.316) (0.258) (0.949)No ctg vs. no TC 0.756 0.000 0.982 *
B 117 vs. GM 9540 B 117 vs. GM 9540
Average TC 0.462 0.335No TC (0.866)No Coating (0.105) 0.316
*Note correlation not meaningful, since one component is invariant.
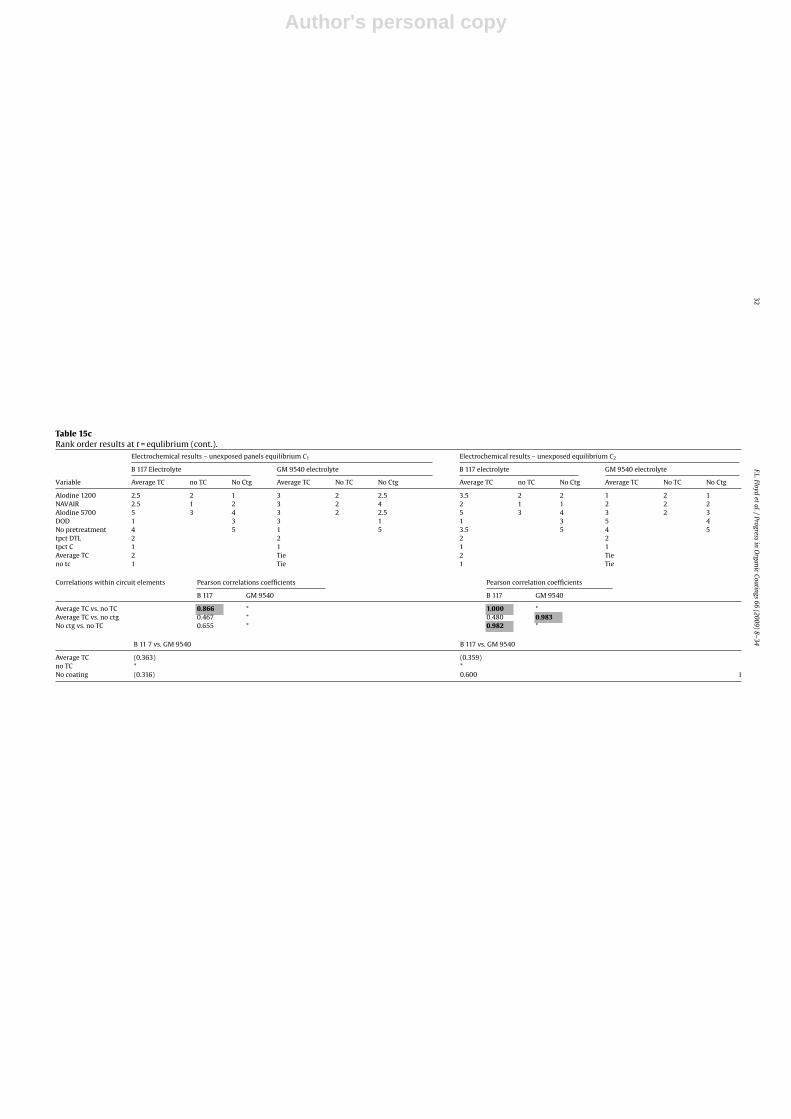
Author's personal copy32
F.L.Floydet
al./Progressin
Organic
Coatings66
(2009)8–34
Table 15cRank order results at t = equlibrium (cont.).
Electrochemical results – unexposed panels equilibrium C1 Electrochemical results – unexposed equilibrium C2
B 117 Electrolyte GM 9540 electrolyte B 117 electrolyte GM 9540 electrolyte
Variable Average TC no TC No Ctg Average TC No TC No Ctg Average TC no TC No Ctg Average TC No TC No Ctg
Alodine 1200 2.5 2 1 3 2 2.5 3.5 2 2 1 2 1NAVAIR 2.5 1 2 3 2 4 2 1 1 2 2 2Alodine 5700 5 3 4 3 2 2.5 5 3 4 3 2 3DOD 1 3 3 1 1 3 5 4No pretreatment 4 5 1 5 3.5 5 4 5tpct DTL 2 2 2 2tpct C 1 1 1 1Average TC 2 Tie 2 Tieno tc 1 Tie 1 Tie
Correlations within circuit elements Pearson correlations coefficients Pearson correlation coefficients
B 117 GM 9540 B 117 GM 9540
Average TC vs. no TC 0.866 * 1.000 *Average TC vs. no ctg 0.467 * 0.480 0.983No ctg vs. no TC 0.655 * 0.982 *
B 11 7 vs. GM 9540 B 117 vs. GM 9540
Average TC (0.363) (0.359)no TC * *No coating (0.316) 0.600 I
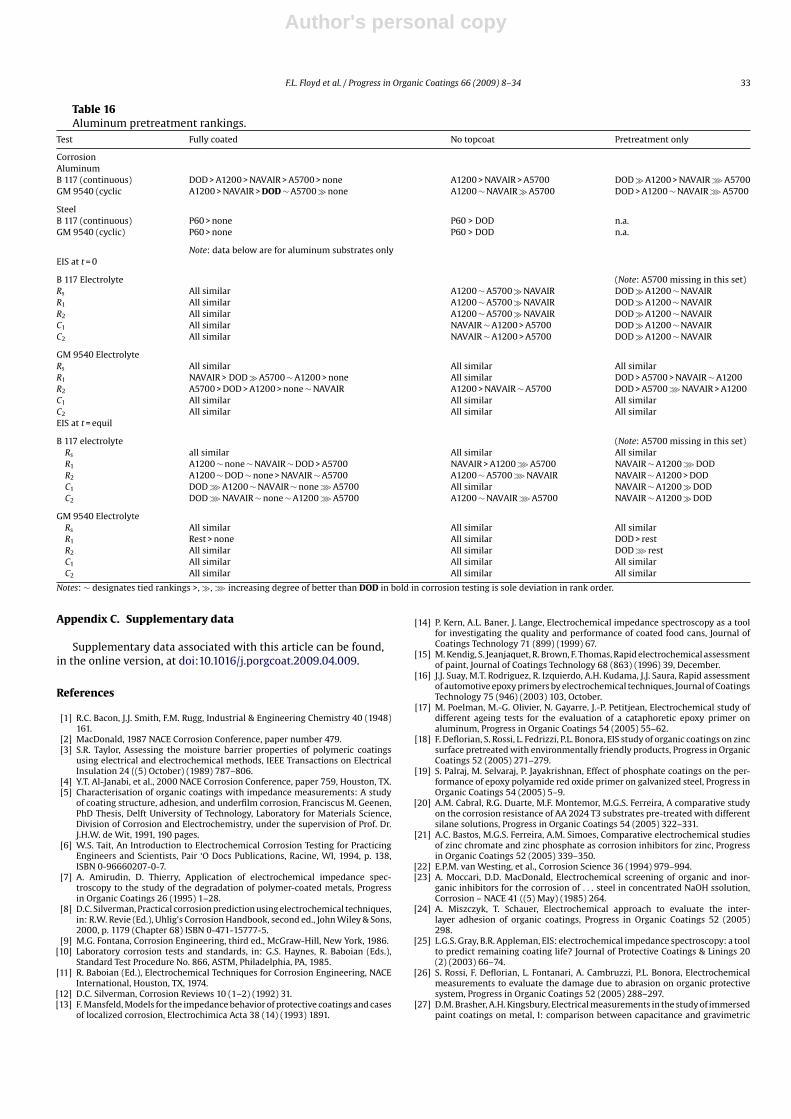
Author's personal copy
F.L. Floyd et al. / Progress in Organic Coatings 66 (2009) 8–34 33
Table 16Aluminum pretreatment rankings.
Test Fully coated No topcoat Pretreatment only
CorrosionAluminumB 117 (continuous) DOD > A1200 > NAVAIR > A5700 > none A1200 > NAVAIR > A5700 DOD � A1200 > NAVAIR≫A5700GM 9540 (cyclic A1200 > NAVAIR > DOD ∼ A5700 � none A1200 ∼ NAVAIR � A5700 DOD > A1200 ∼ NAVAIR≫A5700
SteelB 117 (continuous) P60 > none P60 > DOD n.a.GM 9540 (cyclic) P60 > none P60 > DOD n.a.
Note: data below are for aluminum substrates onlyEIS at t = 0
B 117 Electrolyte (Note: A5700 missing in this set)Rs All similar A1200 ∼ A5700 � NAVAIR DOD � A1200 ∼ NAVAIRR1 All similar A1200 ∼ A5700 � NAVAIR DOD � A1200 ∼ NAVAIRR2 All similar A1200 ∼ A5700 � NAVAIR DOD � A1200 ∼ NAVAIRC1 All similar NAVAIR ∼ A1200 > A5700 DOD � A1200 ∼ NAVAIRC2 All similar NAVAIR ∼ A1200 > A5700 DOD � A1200 ∼ NAVAIR
GM 9540 ElectrolyteRs All similar All similar All similarR1 NAVAIR > DOD � A5700 ∼ A1200 > none All similar DOD > A5700 > NAVAIR ∼ A1200R2 A5700 > DOD > A1200 > none ∼ NAVAIR A1200 > NAVAIR ∼ A5700 DOD > A5700≫NAVAIR > A1200C1 All similar All similar All similarC2 All similar All similar All similarEIS at t = equil
B 117 electrolyte (Note: A5700 missing in this set)Rs all similar All similar All similarR1 A1200 ∼ none ∼ NAVAIR ∼ DOD > A5700 NAVAIR > A1200≫A5700 NAVAIR ∼ A1200≫DODR2 A1200 ∼ DOD ∼ none > NAVAIR ∼ A5700 A1200 ∼ A5700≫NAVAIR NAVAIR ∼ A1200 > DODC1 DOD≫A1200 ∼ NAVAIR ∼ none≫A5700 All similar NAVAIR ∼ A1200 � DODC2 DOD≫NAVAIR ∼ none ∼ A1200≫A5700 A1200 ∼ NAVAIR≫A5700 NAVAIR ∼ A1200 � DOD
GM 9540 ElectrolyteRs All similar All similar All similarR1 Rest > none All similar DOD > restR2 All similar All similar DOD≫ restC1 All similar All similar All similarC2 All similar All similar All similar
Notes: ∼ designates tied rankings >, �, ≫ increasing degree of better than DOD in bold in corrosion testing is sole deviation in rank order.
Appendix C. Supplementary data
Supplementary data associated with this article can be found,in the online version, at doi:10.1016/j.porgcoat.2009.04.009.
References
[1] R.C. Bacon, J.J. Smith, F.M. Rugg, Industrial & Engineering Chemistry 40 (1948)161.
[2] MacDonald, 1987 NACE Corrosion Conference, paper number 479.[3] S.R. Taylor, Assessing the moisture barrier properties of polymeric coatings
using electrical and electrochemical methods, IEEE Transactions on ElectricalInsulation 24 ((5) October) (1989) 787–806.
[4] Y.T. Al-Janabi, et al., 2000 NACE Corrosion Conference, paper 759, Houston, TX.[5] Characterisation of organic coatings with impedance measurements: A study
of coating structure, adhesion, and underfilm corrosion, Franciscus M. Geenen,PhD Thesis, Delft University of Technology, Laboratory for Materials Science,Division of Corrosion and Electrochemistry, under the supervision of Prof. Dr.J.H.W. de Wit, 1991, 190 pages.
[6] W.S. Tait, An Introduction to Electrochemical Corrosion Testing for PracticingEngineers and Scientists, Pair ‘O Docs Publications, Racine, WI, 1994, p. 138,ISBN 0-96660207-0-7.
[7] A. Amirudin, D. Thierry, Application of electrochemical impedance spec-troscopy to the study of the degradation of polymer-coated metals, Progressin Organic Coatings 26 (1995) 1–28.
[8] D.C. Silverman, Practical corrosion prediction using electrochemical techniques,in: R.W. Revie (Ed.), Uhlig’s Corrosion Handbook, second ed., John Wiley & Sons,2000, p. 1179 (Chapter 68) ISBN 0-471-15777-5.
[9] M.G. Fontana, Corrosion Engineering, third ed., McGraw-Hill, New York, 1986.[10] Laboratory corrosion tests and standards, in: G.S. Haynes, R. Baboian (Eds.),
Standard Test Procedure No. 866, ASTM, Philadelphia, PA, 1985.[11] R. Baboian (Ed.), Electrochemical Techniques for Corrosion Engineering, NACE
International, Houston, TX, 1974.[12] D.C. Silverman, Corrosion Reviews 10 (1–2) (1992) 31.[13] F. Mansfeld, Models for the impedance behavior of protective coatings and cases
of localized corrosion, Electrochimica Acta 38 (14) (1993) 1891.
[14] P. Kern, A.L. Baner, J. Lange, Electrochemical impedance spectroscopy as a toolfor investigating the quality and performance of coated food cans, Journal ofCoatings Technology 71 (899) (1999) 67.
[15] M. Kendig, S. Jeanjaquet, R. Brown, F. Thomas, Rapid electrochemical assessmentof paint, Journal of Coatings Technology 68 (863) (1996) 39, December.
[16] J.J. Suay, M.T. Rodriguez, R. Izquierdo, A.H. Kudama, J.J. Saura, Rapid assessmentof automotive epoxy primers by electrochemical techniques, Journal of CoatingsTechnology 75 (946) (2003) 103, October.
[17] M. Poelman, M.-G. Olivier, N. Gayarre, J.-P. Petitjean, Electrochemical study ofdifferent ageing tests for the evaluation of a cataphoretic epoxy primer onaluminum, Progress in Organic Coatings 54 (2005) 55–62.
[18] F. Deflorian, S. Rossi, L. Fedrizzi, P.L. Bonora, EIS study of organic coatings on zincsurface pretreated with environmentally friendly products, Progress in OrganicCoatings 52 (2005) 271–279.
[19] S. Palraj, M. Selvaraj, P. Jayakrishnan, Effect of phosphate coatings on the per-formance of epoxy polyamide red oxide primer on galvanized steel, Progress inOrganic Coatings 54 (2005) 5–9.
[20] A.M. Cabral, R.G. Duarte, M.F. Montemor, M.G.S. Ferreira, A comparative studyon the corrosion resistance of AA 2024 T3 substrates pre-treated with differentsilane solutions, Progress in Organic Coatings 54 (2005) 322–331.
[21] A.C. Bastos, M.G.S. Ferreira, A.M. Simoes, Comparative electrochemical studiesof zinc chromate and zinc phosphate as corrosion inhibitors for zinc, Progressin Organic Coatings 52 (2005) 339–350.
[22] E.P.M. van Westing, et al., Corrosion Science 36 (1994) 979–994.[23] A. Moccari, D.D. MacDonald, Electrochemical screening of organic and inor-
ganic inhibitors for the corrosion of . . . steel in concentrated NaOH ssolution,Corrosion – NACE 41 ((5) May) (1985) 264.
[24] A. Miszczyk, T. Schauer, Electrochemical approach to evaluate the inter-layer adhesion of organic coatings, Progress in Organic Coatings 52 (2005)298.
[25] L.G.S. Gray, B.R. Appleman, EIS: electrochemical impedance spectroscopy: a toolto predict remaining coating life? Journal of Protective Coatings & Linings 20(2) (2003) 66–74.
[26] S. Rossi, F. Deflorian, L. Fontanari, A. Cambruzzi, P.L. Bonora, Electrochemicalmeasurements to evaluate the damage due to abrasion on organic protectivesystem, Progress in Organic Coatings 52 (2005) 288–297.
[27] D.M. Brasher, A.H. Kingsbury, Electrical measurements in the study of immersedpaint coatings on metal, I: comparison between capacitance and gravimetric

Author's personal copy
34 F.L. Floyd et al. / Progress in Organic Coatings 66 (2009) 8–34
methods of estimating water uptake, Journal of Applied Chemistry 4 (62) (1954)62.
[28] W.S. Tait, K.A. Handrich, S.W. Tait, J.W. Martin, Analyzing and interpreting elec-trochemical impedance spectroscopy data from internally coated steel aerosolcontainers Standard Technical Publication, 1188, ASTM, Philadelphia, 1993.
[29] J.N. Murray, Testing issues for coatings for in-service marine immersion appli-cations, NACE Corrosion (2005), paper 05219.
[30] J.W. Martin, S.C. Saunders, F.L. Floyd, J.P. Wineburg, Methodologies for Predict-ing the Service Lives of Coatings Systems, FSCT Series on Coatings Technology(booklet), Blue Bell, PA, 1996, June, p. 34.
[31] N.R. Mann, R.E. Schafer, N.D. Singpurwalla, Methods for Statistical Analysis ofReliability and Life Data, Wiley, New York, 1975.
[32] I.C. Whittaker, P.M. Besuner, A reliability analysis approach to fatigue life vari-ability of aircraft structures, Air Force Materials Laboratory Technical Report.AFML-TR-69-65.
[33] A. Shi, S. Koka, J. Ullett, Performance evaluation on the weathering resistance oftwo USAF coatings systems . . . via EIS, Progress in Organic Coatings 52 (2005)196–209.
[34] J.R. Scully, S.T. Hensley, Corrosion Science 50 (1994) 705.[35] J.N. Murray, H.P. Hack, Corrosion 48 (1992) 671.[36] J.N. Murray, Progress in Organic Coatings 31 (1997) 375–391.[37] F.L. Floyd, S. Tatti, T. Provder, Using DC electrochemical techniques to assess the
relative corrosiveness of water-based coatings and their ingredients, Journalof Coatings Technology and Research 4 (2) (2007) 111–129, also available as areport to the U.S. Department of the Army, Tank-Automotive and ArmamentsCommand (TACOM) in partial completion of Contract DAAE07-03-C-L127,2006.