Proceedings of the Great Lakes Paleo-Levels … NOAA Technical Memorandum ERL GLERL-113 Proceedings...
43
NOAA Technical Memorandum ERL GLERL-113 Proceedings of the Great Lakes Paleo-Levels Workshop: The Last 4000 Years Cynthia E. Sellinger and Frank H. Quinn, Editors NOAA, Great Lakes Environmental Research Laboratory, Ann Arbor, MI 48105 Great Lakes Environmental Research Laboratory Ann Arbor, Michigan August 1999 N A T I O N A L O C E A N IC A N D A T M O S P H E R IC A D M I N I S T R A T I O N U . S .D E P A R T M E N T O F C O M M E R C E UNITED STATES DEPARTMENT OF COMMERCE William Daley Secretary NATIONAL OCEANIC AND ATMOSPHERIC ADMINISTRATION D. James Baker Under Secretary for Oceans and Atmosphere/Administrator Environmental Research Laboratories James L. Rasmussen Director
Transcript of Proceedings of the Great Lakes Paleo-Levels … NOAA Technical Memorandum ERL GLERL-113 Proceedings...

1
NOAA Technical Memorandum ERL GLERL-113
Proceedings of the Great Lakes Paleo-Levels Workshop: The Last 4000 Years
Cynthia E. Sellinger and Frank H. Quinn, Editors
NOAA, Great Lakes Environmental Research Laboratory, Ann Arbor, MI 48105
Great Lakes Environmental Research LaboratoryAnn Arbor, MichiganAugust 1999
NA
TIO
NA
L O
CE
ANIC AND ATMOSPHERIC AD
MIN
IST
RA
TIO
N
U.S.DEPARTMENT OF COMMER
CE
UNITED STATESDEPARTMENT OF COMMERCE
William DaleySecretary
NATIONAL OCEANIC ANDATMOSPHERIC ADMINISTRATION
D. James BakerUnder Secretary for Oceansand Atmosphere/Administrator
Environmental ResearchLaboratories
James L. RasmussenDirector

2
NOTICE
Mention of a commercial company or product does not constitute an endorsementby the NOAA Environmental Research Laboratories. Use of information fromthis publication concerning proprietary products or the tests of such products forpublicity or advertising purposes is not authorized. This is GLERL ContributionNo. 1137.
The Workshop was held at NOAA’s Great Lakes Environmental Research Labo-ratory in Ann Arbor, MI, April 13-14, 1999, and was sponsored by GLERL andthe US Army Corps of Engineers, Detroit District.
This publications is available as a PDF file and can be downloaded fromGLERL’s web site: www.glerl.noaa.gov. Hard copies can be requested from theGLERL Publications Unit, 2205 Commonwealth Blvd., Ann Arbor, MI [email protected]

3
CONTENTS
Page
1. INTRODUCTIONFrank H. Quinn .................................................................................................................................. 4
2. BACKGROUNDJoan Pope ........................................................................................................................................... 5
3. HOLOCENE LAKE LEVELS AND CLIMATE, LAKES WINNIPEG, ERIE,AND ONTARIOC.F.M. Lewis ..................................................................................................................................... 6
4. RECONSTRUCTING HOLOCENE LAKE LEVEL FLUCTUATIONS IN THELAKE SUPERIOR BASINCurtis Larsen.................................................................................................................................... 20
5. LAKE LEVELS IN THE ERIE BASIN: DRIVING FACTORS AND RECENT TRENDSJohn P. Coakley................................................................................................................................ 24
6. STRANDPLAIN EVIDENCE FOR RECONSTRUCTING LATE HOLOCENE LAKELEVEL IN THE LAKE MICHIGAN BASINTodd A. Thompson, and Steve J. Baedke ........................................................................................ 30
7. DISCUSSIONCynthia E. Sellinger ......................................................................................................................... 35
8. LIST OF ATTENDEES ................................................................................................................... 43

4
“~ Paleo Lake Levels — The Last Four-Thousand Years ~
INTRODUCTION
Frank H. QuinnGreat Lakes Environmental Research Laboratory
2205 Commonwealth Blvd.Ann Arbor, MI 48105
The Great Lakes, Figure 1, are one of North America’s largest water resource systems with a basin area of about770,000 km2, of which about one third is lake surface. It is one of the most intensively used freshwater systems inthe world, serving multiple interests including navigation, hydropower, recreation, water supply, food supply, andriparian. The outflows from Lakes Superior and Ontario are regulated by regulatory works in the St. Marys andSt. Lawrence Rivers, respectively. The remainder of the system is naturally regulated through the large surfaceareas and limited outflow capacity. Great Lakes water levels change slowly due to the large lake surface areas andconstricted outlet channels, which integrate short-term climate fluctuations. Because of the relatively small rangein lake levels, about 1.8 m, significant uses have become dependant upon small changes in water levels andoutflows, resulting in system sensitivity to relatively small changes in climate variability and change.
The Great lakes water levels constitute one of the longest high quality hydrometeorological data sets in NorthAmerica with master gage records beginning about 1860 with other sporadic records back to the early 1800’s.However, from a longer term perspective under the current system hydraulic regime, which has been in place forabout 3000 years, we have only observed/measured about 5 percent of the time series. There is a highly likelyprobability that we could experience runs of high and low lake levels with extremes significantly higher than ourpresent measurements would indicate. For example, few if any envisioned in the 1960’s that we would have a 30year run of well-above-average high lake levels and set two record highs within 13 years. A longer term lake levelperspective can only be obtained by examining paleo information from the geologic record, or in a more limitedfashion, from stochastic hydrologic analysis based upon the historic record.
The workshop was convened to place the historical lake level measurements in a longer term perspective througha series of papers and discussion by highly qualified experts in the specialized field of Great Lakes paleo lakelevel reconstruction. This perspective will serve a broad range of uses from evaluation of potential Great Lakesshoreline damages to the development of more robust lake level regulation and water resource policy.
Figure 1. The Laurentian Great Lakes.
5
~ Paleo Lake Levels — The Last Four-Thousand Years ~
BACKGROUND
Joan PopeChief, Coastal Evaluation and Design Branch
Coastal and Hydraulics LaboratoryU.S. Army Engineer Research and Development Center
3903 Halls Ferry Rd.Vicksburg, MS 39180
Human perception of flooding and erosion hazards along the shores of the Great Lakes is often limited by thelength of human memory and recorded past conditions. Yet, records of Great Lakes water level fluctuations coveronly a little more than a century (1860 to the present). This is only a little more than 3 percent of the period thatthe Great Lakes system has existed with its present drainage system.
During the last 4 or 5 millennia, Great Lakes water levels have responded to geological, atmospheric, and anthro-pogenic changes. There have been subtle, yet progressive tectonic changes to the basin as the earth’s mantle andcrust have adjusted to the disappearance of the massive Pleistocene continental glacier. These geotechnicalchanges have both tipped and warped the basins; modifying the relative elevation of the outfalls and levels ofwater impoundment in each lake. The Earth’s atmosphere exhibits poorly understood long and short periodchanges in the balance between polar and tropical air masses, the location of major pressure system lows andhighs, and the jet stream. As the atmosphere evolves, meteorological cycles and trends materialize resulting inperiods of greater or lesser precipitation for different regions of the earth. Within recorded time there have beenseasonal, annual, and decadal alternating cycles of droughts and floods in the Great Lakes system resulting inperiods of low and high water levels. In more recent times, man has modified the Great Lakes basin and drainagesystem through land use practices and modifications to the drainage system, including some changes to thecapacity of lake inflows and outflows. Finally, there are the effects of atmospheric pollution and the unknownfuture associated with global warming.
Geological evidence developed by independent researchers studying different evidence in different locationsthroughout the Great Lakes suggest the presence of water level change trends associated with basin tectonics andlonger period atmospherically-induced cycles than those captured in the recent record. Future stewardship of theGreat Lakes system needs to look beyond the documented record in predicting future water level changes andpotential extreme values.
In response to the 1993 International Joint Commission Great Lakes Levels Reference Study, the U.S. ArmyCorps of Engineers is developing a basin-scale Flooding and Erosion Evaluation System. This system includes alake-by-lake relational database of geological, land use and hydraulic information; coastal recession, sediment andflood models; and computer-based linkages to analyze the erosion and damage consequences of changed waterlevel and sediment supply scenarios. This interactive data base and analysis system provides those responsible forGreat Lakes coastal zone planning, public policy, engineering actions, and operating water level control elementswith a powerful regional management tool. The goal of this workshop is to develop rational future Great Lakeswater level scenarios for use in the development and application of this regional management system.

6
~ Paleo Lake Levels — The Last Four-Thousand Years ~
HOLOCENE LAKE LEVELS AND CLIMATE, LAKES WINNIPEG, ERIE, AND ONTARIO
C.F.M. LewisGeological Survey of Canada (Atlantic)
Box 1006Dartmouth, NS B2Y 4A2
Significant change in postglacial lake levels in areas formerly covered by the Laurentide Ice Sheet is mainly afunction of ice-margin position during ice retreat, land topography, and differential glacial rebound (Hough,1958), and climatic or hydrological change (Larsen, 1985). Additional causes of lake level change have beenrelated to increases or decreases in drainage basin area (Lewis and Anderson, 1989), and by erosional downcuttingof outlet sills (Pengelly et al., 1997). Potential neotectonic adjustments (Sanford et al., 1985; Wallach et al., 1998)are another possible source of change in relative lake levels. Of these factors, climate change is likely the mostimportant (and perhaps the most uncertain) for consideration of future lake levels in the next few centuries.
In this presentation, I will first show results of a nearly completed study of the geological evolution of LakeWinnipeg, a large lake in southern Manitoba, about 550 km northwest of Lake Superior, that is comparable in areawith the Laurentian Great Lakes. Lake Winnipeg’s surface area of 24,530 km2 is 31 percent larger than that ofLake Ontario and 4.6 percent smaller than that of Lake Erie. The Lake Winnipeg team discovered significantchanges in water level owing to the effects of a mid-Holocene switch from dry to moist climate conditions. Thesechanges were superimposed on progressive tilting of the basin by ongoing postglacial rebound (Todd et al., 1996,1999; Lewis et al., 1998a,b, 1999). These findings have sensitized me to the importance of water balance indrainage basins for lake levels; in extreme situations, negative water balance may cause lakes to switch from anopen (overflowing) state to a closed state with levels drawn down by evaporation below the basin outlet sill. Evenin an open state, lake levels will fluctuate moderately with changes in water balance, as in the present hydrologi-cal regime of the Great Lakes.
From Lake Winnipeg, I will move to Lake Erie and show that similar dry climate effects (closed basin conditions)likely occurred there in the early to mid-Holocene. Then, I will identify sedimentological work by others in theOntario basin which suggests climatically-driven oscillatory changes in lake level over the past 4000 years (Flintet al., 1988; McCarthy and McAndrews, 1988; Dalrymple and Carey, 1990). Finally, I will explore recent paleo-climate findings in the Ontario basin that late Holocene climate shifts may be explained as changes in air masscirculation, drier periods occurring because of more frequent westerly flows of dry Pacific air (Yu et al., 1997).Further research to better determine the relationship of paleoclimate to former lake level change could provehelpful in understanding the past and future regime of change in water balances and levels of the Great Lakes.
Lake Winnipeg
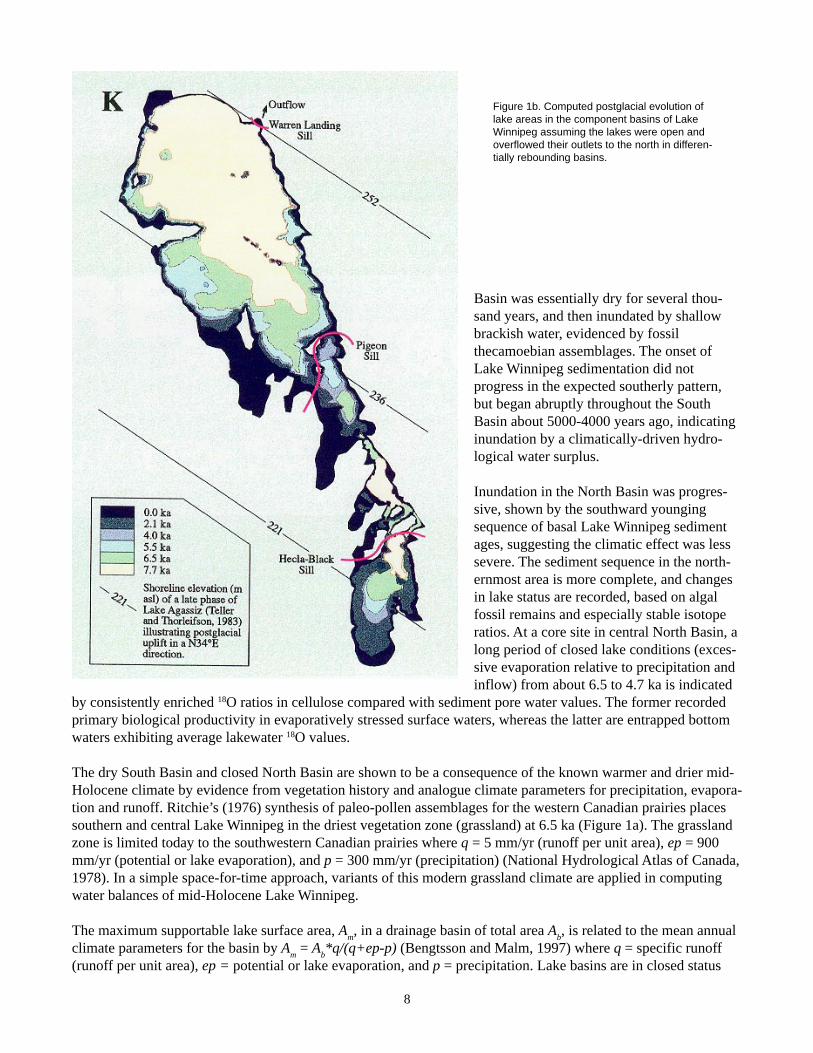
Lake Winnipeg consists of a small South Basin separated from a large North Basin by a constricted central areawith the long axis of the 400 km-long lake oriented approximately south to north. Its catchment area (982 900km2) (National Atlas of Canada, 1985) includes most of the Canadian prairies and adjacent US, and extendseastward to the Lake Superior drainage basin on the Canadian Shield (Figure 1a). The bathymetry of the lake isflat and shallow ranging from about 11 m (South Basin) to 19 m (North Basin). Lake Winnipeg is located in theformer basin of glacial Lake Agassiz (Figure 1a). Throughout its history, the Lake Winnipeg basin has beendifferentially uplifted by postglacial rebound in a northerly to northeasterly direction towards the centre of formermaximum glacial loading in Hudson Bay. As a result, computations of theoretical former levels of Lake Winnipegshow a progressive increase in water surface area and southward transgression, under the assumption of openlakes in component basins overflowing their outlet sills to the north (Figure 1b).

7
Figure 1a. Lake Winnipeg setting, showing the Lake Winnipeg watershed abutting that of Lake Superior at its eastern margin.
The level of Lake Winnipeg (217.4 m asl) is controlled by a hydroelectric power dam 79 km north of WarrenLanding at Jenpeg, site of the former natural control. The lake presently overflows northward to Hudson Bay viaNelson River (Figure 1a). Bedrock lake floor now submerged 3-5.5 m at Warren Landing was an earlier controlsill for North Basin. The Hecla-Black sill served as a control for an early separate impoundment in South Basin(Figure 1b).
The sedimentary sequences throughout the lake were studied with high-resolution seismic profiles and long cores(Figure 1c). Twenty-five cores fully penetrated Lake Winnipeg fining-upward muddy sediments into the underly-ing glacial Lake Agassiz silty clay, and 5 reached paleo-beach or nearshore sands under offshore mud, evidence offormer low lake stands. Both seismic profiles and cores revealed a widespread inconformity between the LakeWinnipeg sediments and Lake Agassiz deposits, signifying a gap in time and a period of erosion. The surface ofthe clay-rich Agassiz sediments beneath the inconformity commonly displays a decimetre-scale zone of highershear strength, higher bulk density, and a crumbly dry texture, indicating a period of soil formation and desicca-tion before deposition of the overlying Lake Winnipeg sediments. The desiccation zone is absent in the northern,deeper part of North Basin which is an area of continuous inundation since the basin was isolated before 7.7 ka(7700 radiocarbon years BP) by the recession and drainage of glacial Lake Agassiz.
The age-spans of subaerial exposure are severely underestimated by the computed open-lake model according tothe 14C ages of basal Lake Winnipeg sediment, especially in South Basin (compare Figs. 1c and 1b). The South
8
Basin was essentially dry for several thou-sand years, and then inundated by shallowbrackish water, evidenced by fossilthecamoebian assemblages. The onset ofLake Winnipeg sedimentation did notprogress in the expected southerly pattern,but began abruptly throughout the SouthBasin about 5000-4000 years ago, indicatinginundation by a climatically-driven hydro-logical water surplus.
Inundation in the North Basin was progres-sive, shown by the southward youngingsequence of basal Lake Winnipeg sedimentages, suggesting the climatic effect was lesssevere. The sediment sequence in the north-ernmost area is more complete, and changesin lake status are recorded, based on algalfossil remains and especially stable isotoperatios. At a core site in central North Basin, along period of closed lake conditions (exces-sive evaporation relative to precipitation andinflow) from about 6.5 to 4.7 ka is indicated
by consistently enriched 18O ratios in cellulose compared with sediment pore water values. The former recordedprimary biological productivity in evaporatively stressed surface waters, whereas the latter are entrapped bottomwaters exhibiting average lakewater 18O values.
The dry South Basin and closed North Basin are shown to be a consequence of the known warmer and drier mid-Holocene climate by evidence from vegetation history and analogue climate parameters for precipitation, evapora-tion and runoff. Ritchie’s (1976) synthesis of paleo-pollen assemblages for the western Canadian prairies placessouthern and central Lake Winnipeg in the driest vegetation zone (grassland) at 6.5 ka (Figure 1a). The grasslandzone is limited today to the southwestern Canadian prairies where q = 5 mm/yr (runoff per unit area), ep = 900mm/yr (potential or lake evaporation), and p = 300 mm/yr (precipitation) (National Hydrological Atlas of Canada,1978). In a simple space-for-time approach, variants of this modern grassland climate are applied in computingwater balances of mid-Holocene Lake Winnipeg.
The maximum supportable lake surface area, Am, in a drainage basin of total area A
b, is related to the mean annual
climate parameters for the basin by Am = A
b*q/(q+ep-p) (Bengtsson and Malm, 1997) where q = specific runoff
(runoff per unit area), ep = potential or lake evaporation, and p = precipitation. Lake basins are in closed status
Figure 1b. Computed postglacial evolution oflake areas in the component basins of LakeWinnipeg assuming the lakes were open andoverflowed their outlets to the north in differen-tially rebounding basins.

9
Figure 1c. Locations of seismic profiles and cores showing radiocarbon ages of basal Lake Winnipeg sediment.

10
when their computed open-lake areas exceed water surface areas supportable by their basin climate. Supportablelake areas for a moister version of the grassland climate accord with the geological observation of a closed NorthBasin (Figure 1d). The mid-Holocene climate apparently closed and dried the South Basin in accordance with thegeological observations of widespread desiccation and delayed inundation (Figure 1e). These basins were separatehydrological entities until about 1.7 ka. The 18O evidence shows North Basin switched to overflowing status aboutthe same time the Saskatchewan River was diverted to it (4.7 ka) by rebound. Similarly, water balance for theSouth Basin was augmented by diversion of the Assiniboine River from Lake Manitoba about 4 ka. The general-ized likely climate history experienced by Lake Winnipeg since 7.5 ka started with a dry grassland climate, lessarid in the north, which created a closed North and a dry South Basin. This was followed by progressively moisterclimates (with short dry episodes) and a switch to open lake conditions starting about 4.7 ka in North Basin and4.5-4 ka in South Basin.
Lake Erie
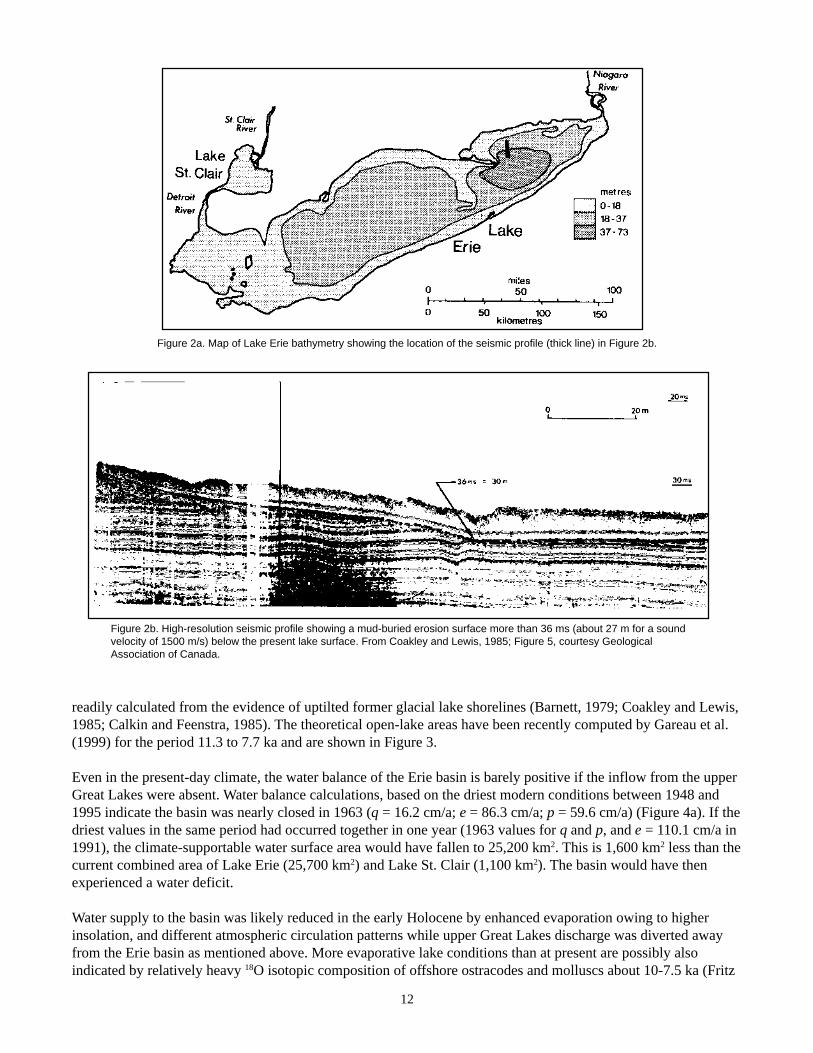
In 1985, Coakley and Lewis reported subsurface erosion, interpreted as wave erosion in former low-level shorezones as low as 39 m below present lake level (bpl) in the Long Point area of eastern Lake Erie (Figure 2a,b).These shore zones sloped upward in an easterly direction but projected below the sill of the lake outlet to NiagaraRiver. Although it was considered possible that the shore features related to an earlier low-level phase whichpredated early Lake Erie, it was concluded more information was needed before their significance would becomeclear (Coakley and Lewis, 1985). A reevaluation of these observations with information and the example ofclimate-driven drawdown (closed-basin conditions) from Lake Winnipeg provides the needed clarity.
Figure 1d. LakeWinnipeg North Basinlake area vs age plot forboth computed open-lake conditions andareas supportable bythe basin climate.

11
The erosion surface is readily traced in seismic profiles and echograms beneath the mid- and late Holoceneoffshore muddy sediments in Lake Erie (Figure 2b). It is also apparent in a borehole near the western end of LongPoint (Coakley and Lewis, 1985) and in piston cores of sediments on the north flank of eastern Lake Erie east ofLong Point (Cameron, 1991). This inconformity is the eroded upper surface of glaciolacustrine sediments, andthus must postdate the termination of inflow of glacial sediment plumes from the upper Great Lakes about 10.5 kawhen that drainage was diverted from Erie basin by glacier retreat and opening of northern outlets at lowerelevation. The eastern Lake Erie inconformity recorded in the seismic profile (Figure 2b) extends down to about27 m or more bpl, using an estimated sound velocity of 1500 m/s. The deepest erosion is interpreted as a paleo-shoreface with shorelines inferred approximately 4-7 m higher where a sandy terrace (beach) is found. Eastward,this shore zone projects to about 10 m± below the elevation of possible outlet sills to the Niagara River, indicatingthe existence of past closed-basin conditions.
Differential rebound progressively uptilted the Lake Erie basin in a northeastward direction throughout its earlyHolocene and much of its later history. This movement was a result of glacio-isostatic adjustment of the earth’scrust to the former load of the Laurentide Ice Sheet centered over Hudson Bay. Hence, Lake Erie’s outlet acrossthe Niagara Peninsula to Lake Ontario was uplifted faster than other parts of its basin, and the capacity of thebasin increased with time as the basin tilted upward to the northeast. Under climatic conditions of a water surplus,the lake would overflow its outlet, and the water level in this “open lake” would rise with the outlet elevation,causing the lakewater to backflood its basin and increase the lake area and volume. The rate of rise decreased withtime, and the rising outlet elevation is generally expressed mathematically as a negative exponential function ofshoreline age, as for the Lake Winnipeg basin. Using this function, the degree of basin uptilt for any desired age is
Figure 1e. Lake WinnipegSouth Basin lake area vsage plot for bothcomputed open-lakeconditions and areassupportable by the basinclimate.
12
readily calculated from the evidence of uptilted former glacial lake shorelines (Barnett, 1979; Coakley and Lewis,1985; Calkin and Feenstra, 1985). The theoretical open-lake areas have been recently computed by Gareau et al.(1999) for the period 11.3 to 7.7 ka and are shown in Figure 3.
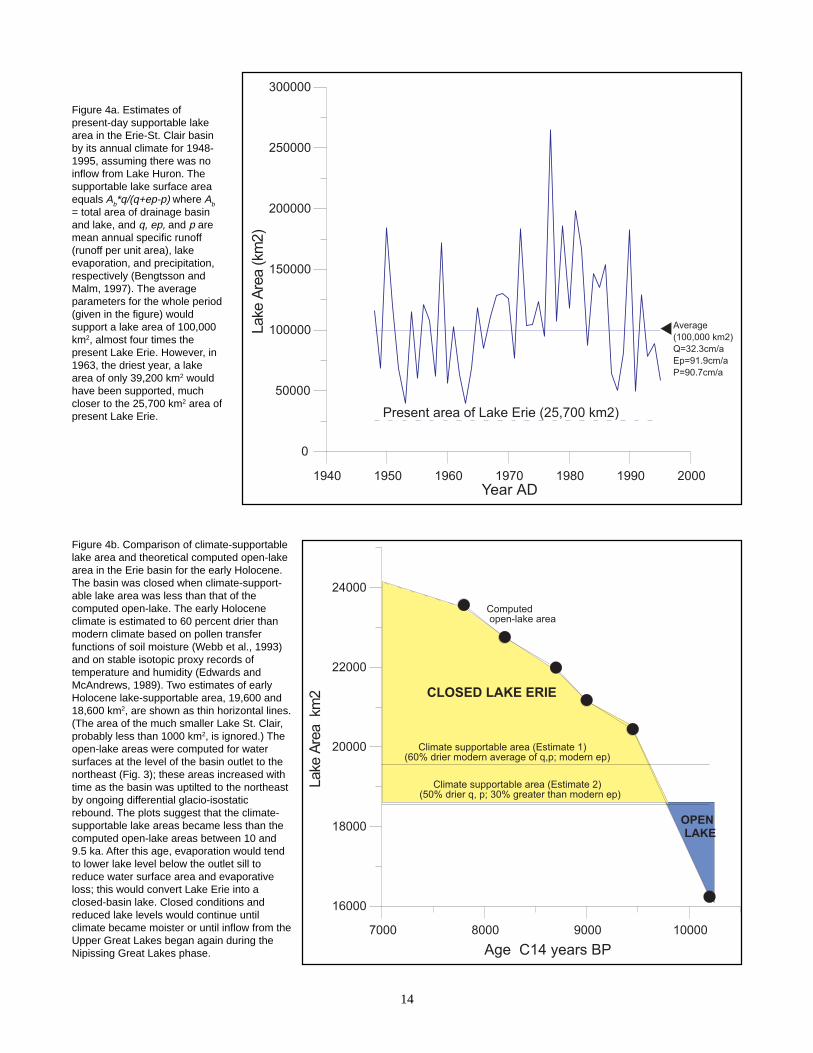
Even in the present-day climate, the water balance of the Erie basin is barely positive if the inflow from the upperGreat Lakes were absent. Water balance calculations, based on the driest modern conditions between 1948 and1995 indicate the basin was nearly closed in 1963 (q = 16.2 cm/a; e = 86.3 cm/a; p = 59.6 cm/a) (Figure 4a). If thedriest values in the same period had occurred together in one year (1963 values for q and p, and e = 110.1 cm/a in1991), the climate-supportable water surface area would have fallen to 25,200 km2. This is 1,600 km2 less than thecurrent combined area of Lake Erie (25,700 km2) and Lake St. Clair (1,100 km2). The basin would have thenexperienced a water deficit.
Water supply to the basin was likely reduced in the early Holocene by enhanced evaporation owing to higherinsolation, and different atmospheric circulation patterns while upper Great Lakes discharge was diverted awayfrom the Erie basin as mentioned above. More evaporative lake conditions than at present are possibly alsoindicated by relatively heavy 18O isotopic composition of offshore ostracodes and molluscs about 10-7.5 ka (Fritz
Figure 2b. High-resolution seismic profile showing a mud-buried erosion surface more than 36 ms (about 27 m for a soundvelocity of 1500 m/s) below the present lake surface. From Coakley and Lewis, 1985; Figure 5, courtesy GeologicalAssociation of Canada.
Figure 2a. Map of Lake Erie bathymetry showing the location of the seismic profile (thick line) in Figure 2b.

13
Figure 3. Shaded-relief images of the Lake Erie drainage basin showing computed open lakes (overflowing the outlet sill towards thenorth east) at eight stages of Lake Erie from 11.3 to 7.7 ka. Open lake areas are given for each stage. Drainage basin colors changeat 100 m elevation intervals; dark green denotes areas between elevations of 200 and 300 m asl. From Gareau et al. (1999).
14
Figure 4a. Estimates ofpresent-day supportable lakearea in the Erie-St. Clair basinby its annual climate for 1948-1995, assuming there was noinflow from Lake Huron. Thesupportable lake surface areaequals Ab*q/(q+ep-p) where Ab
= total area of drainage basinand lake, and q, ep, and p aremean annual specific runoff(runoff per unit area), lakeevaporation, and precipitation,respectively (Bengtsson andMalm, 1997). The averageparameters for the whole period(given in the figure) wouldsupport a lake area of 100,000km2, almost four times thepresent Lake Erie. However, in1963, the driest year, a lakearea of only 39,200 km2 wouldhave been supported, muchcloser to the 25,700 km2 area ofpresent Lake Erie.
Figure 4b. Comparison of climate-supportablelake area and theoretical computed open-lakearea in the Erie basin for the early Holocene.The basin was closed when climate-support-able lake area was less than that of thecomputed open-lake. The early Holoceneclimate is estimated to 60 percent drier thanmodern climate based on pollen transferfunctions of soil moisture (Webb et al., 1993)and on stable isotopic proxy records oftemperature and humidity (Edwards andMcAndrews, 1989). Two estimates of earlyHolocene lake-supportable area, 19,600 and18,600 km2, are shown as thin horizontal lines.(The area of the much smaller Lake St. Clair,probably less than 1000 km2, is ignored.) Theopen-lake areas were computed for watersurfaces at the level of the basin outlet to thenortheast (Fig. 3); these areas increased withtime as the basin was uptilted to the northeastby ongoing differential glacio-isostaticrebound. The plots suggest that the climate-supportable lake areas became less than thecomputed open-lake areas between 10 and9.5 ka. After this age, evaporation would tendto lower lake level below the outlet sill toreduce water surface area and evaporativeloss; this would convert Lake Erie into aclosed-basin lake. Closed conditions andreduced lake levels would continue untilclimate became moister or until inflow from theUpper Great Lakes began again during theNipissing Great Lakes phase.

15
et al., 1975; Lewis and Anderson, 1992), as well as from the isotopic evidence in wood cellulose (Edwards andMcAndrews, 1989). The erosion surface signifying the lake lowstand is coeval with the early Holocene pinepollen maximum in the Erie basin (F. McCarthy in Cameron, 1991; T. Anderson in Lewis and Anderson, 1992).This period is marked by a soil moisture reduction of 60 percent near eastern Lake Erie at 9 ka compared withmodern values based on published analyses of regional pollen-inferred paleoclimate (Webb et al., 1993). Twoclimate estimates for the early Holocene are explored here, given the above paleoclimatic setting. Estimate 1retains the same average evaporation as in the 1948-1995 period, but runoff and precipitation are reduced by 60percent. Estimate 2 is 50 percent of modern runoff and precipitation with evaporation 30 percent greater thanaverage values between 1948 and 1995.
Supportable lake areas for the early Holocene climate estimates 1 and 2 (19,600 km2 and 18,600 km2, respec-tively) are compared with computed open-lake areas in Figure 4b. After 10-9.5 ka, the open-lake areas are largerthan can be supported by the early Holocene climate. Hence, it was quite likely the early Holocene water levelwas drawn down by net evaporative water loss into a closed state to form the lake lowstands observed in thesedimentary stratigraphic record. It is possible the lake existed in a closed state into the mid-Holocene untilrebound diverted the Upper Great lakes outflow again through the Erie basin.
Lake Ontario
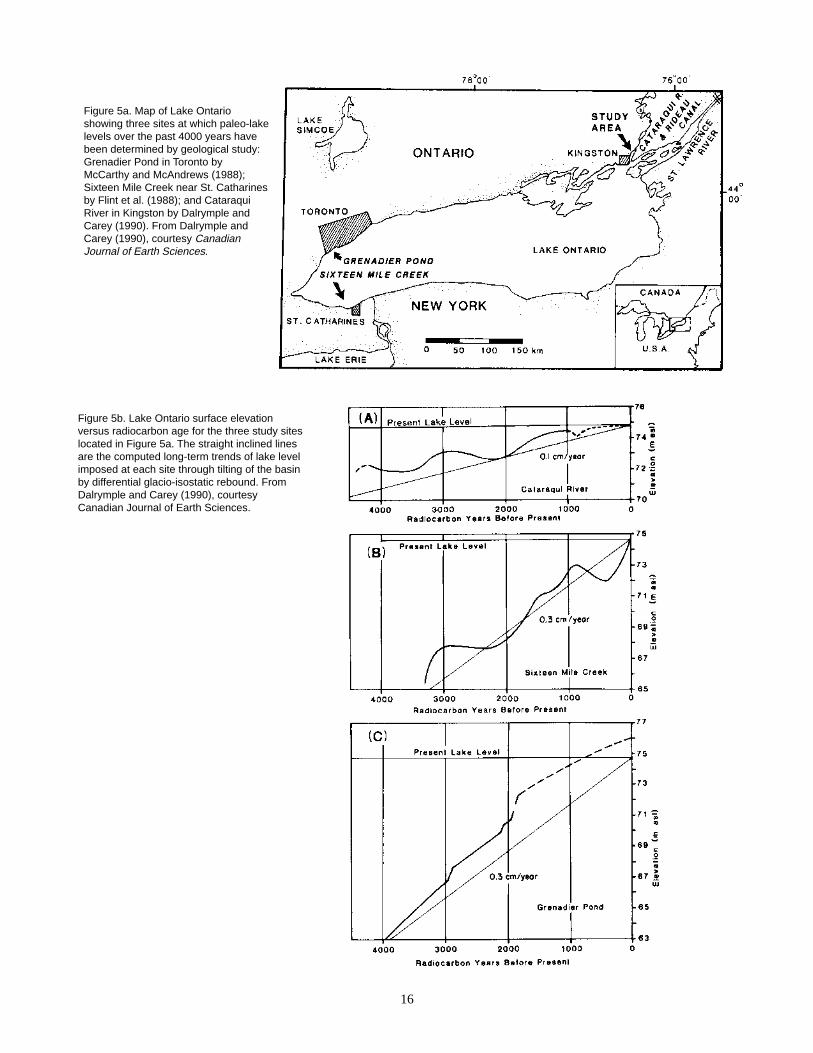
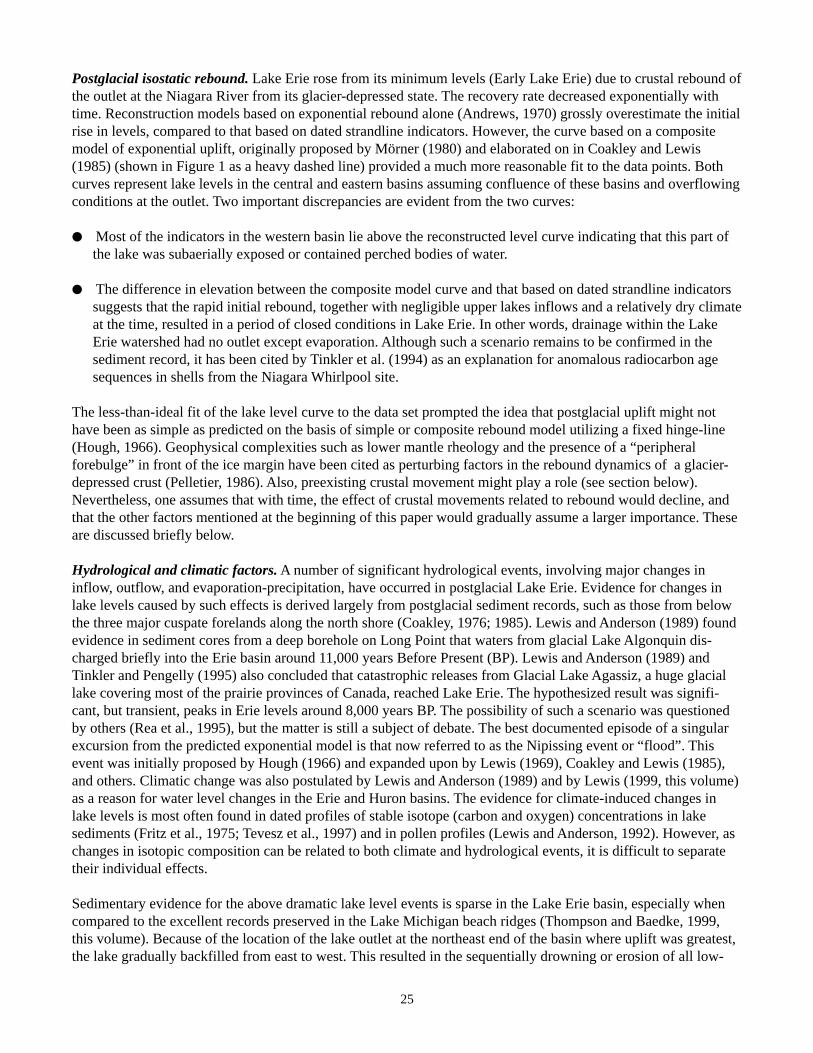
When water supply is sufficient to maintain lakes in an open overflowing state, climate fluctuations would stillaffect water level but to a much lesser degree than when lakes are closed (Bengtsson and Malm, 1997). This wasthe probable situation for Lake Ontario (and the other Great Lakes) during the late Holocene. Lake levels over thepast 4000 years have been interpreted from the sedimentary record in three Lake Ontario lagoons—at Toronto(McCarthy and McAndrews, 1988), west of St. Catharines (Flint et al., 1988), and at Kingston (Dalrymple andCarey, 1990). All records show or imply fluctuations in lake level with amplitudes of about 1-2 m and durations ofabout 1000 years (Figure 5a,b). These results have been correlated by the last authors with higher than averagelevels occurring prior to 4000 BP, from 3100 to 2500 BP, and after 2000 BP. Dalrymple and Carey (1990) alsosuggest the Lake Ontario water level oscillations correlate with climate changes in northeastern North America,rather than with climate changes elsewhere in the Great Lakes basin as in the US midwest and in Lake Michigan(Larsen, 1985).
Recently, however, Yu et al. (1997) presented independent evidence of atmospheric control of effective moisturein the Ontario basin. Reductions in effective moisture and reduced water levels from 4800 to 2000 BP weredetected in the lithostratigraphic and mollusc isotopic record within the sediments of Crawford Lake, a smallisolated, atmosphere-controlled lake basin on the Niagara Escarpment, 25 km northwest of western Lake Ontario.They found a co-occurrence of lowered lake level (implying reduced moisture supply) and lighter 18O ratios.These observations are most readily explained by a change in air mass circulation which brought drier air (with alower 18O signature) into the region more frequently than before. The alternate explanation of lowered levels inthis lake, increased evaporation, is not tenable as heavier 18O ratios would result, and these were not observed. Inthe US midwest, Baker et al. (1992) have suggested that variations in the relative presence of three air masses(warm dry Pacific air, warm moist tropical air from the Gulf of Mexico, and dry Arctic air) could account forshifts in the position of the prairie-forest border during the Holocene. Thus, it seems probable that if shifts in airmass distribution could change moisture-sensitive vegetation zones and small-lake water supply in the past, itcould also change the hydrological water balances and water levels in the Great Lakes basins. These studiessuggest that additional research of the paleo-record is warranted to better determine the mechanisms of the linksbetween climate and lake level for application to achieving better understanding of potential future levels.
Summary
Lake Winnipeg. The paleogeography of Lake Winnipeg, inferred from glacial rebound, indicates the early Ho-locene basin was downtilted to the north such that separate impoundments existed in at least southern and north-
16
Figure 5a. Map of Lake Ontarioshowing three sites at which paleo-lakelevels over the past 4000 years havebeen determined by geological study:Grenadier Pond in Toronto byMcCarthy and McAndrews (1988);Sixteen Mile Creek near St. Catharinesby Flint et al. (1988); and CataraquiRiver in Kingston by Dalrymple andCarey (1990). From Dalrymple andCarey (1990), courtesy CanadianJournal of Earth Sciences.
Figure 5b. Lake Ontario surface elevationversus radiocarbon age for the three study siteslocated in Figure 5a. The straight inclined linesare the computed long-term trends of lake levelimposed at each site through tilting of the basinby differential glacio-isostatic rebound. FromDalrymple and Carey (1990), courtesyCanadian Journal of Earth Sciences.

17
ern sub-basins with outlets over their northern rims from about 7.7 to 2 ka. After 2 ka the northern basin level hadtransgressed and backflooded southern basins to form the present large lake. However, observations of sedimentcores indicate that the long-term water level is not fully explained by a theoretical, open (overflowing) lake modelbased on rebound. Instead, the evidence shows that North Basin was closed from about 6.7-4.7 ka, and that theSouth Basin was dry from about 7.5 to 4 ka. The closed and dry conditions reflect a regional deficit in the waterbalance of the lake basin that is consistent with a drier-than-present paleoclimate in the mid-Holocene.
Lake Erie. Sediment stratigraphy in the eastern basin indicates an early Holocene lowstand, evidenced by aninconformity and mud-buried shore-zone morphology. This paleo-lake level which lies below the basin outletindicates closed conditions and a regional deficit in the water balance of the lake basin as for mid-Holocene LakeWinnipeg. This condition is consistent with a dry pine paleoclimate and the lack of inflow from the upper GreatLakes at the time. Calculations based on estimates of early Holocene paleoclimate show that supportable lakeareas were all less than computed open-lake areas, thereby confirming the basin was in a closed condition duringthe early Holocene, and possibly into the mid-Holocene.
Lake Ontario. A review of studies of shallow-water sediment stratigraphy in three lagoons around the lake indi-cate that lake-level oscillations of 1-2 m amplitude with durations about 1000 years occurred during the last 4000years. New data from Crawford Lake near western Lake Ontario suggest that oscillations in Ontario levels couldbe linked to climate/hydrology changes, and that these changes could be driven by changes in atmosphericcirculation and air mass humidity. Additional research is warranted to better understand the connections betweenpaleoclimate and former lake levels as a step towards improved forecasting of future levels.
Acknowledgements
The Lake Winnipeg results would not be possible without the cooperative work of the many participants of theLake Winnipeg Project led by the Geological Survey of Canada. The NOAA Great Lakes Environmental ResearchLaboratory kindly provided the modern hydrological parameters for comparison with evidence of closed condi-tions in early Holocene Lake Erie. Discussions with Thane Anderson (Canadian Museum of Nature) and ZichengYu (Natural Resources Canada) were helpful concerning early-mid Holocene paleoclimate and the atmosphericcirculation model, respectively.
References
Baker, R.G., L.J. Maher, C.A. Chumbley, and K.L. Van Zant. 1992. Patterns of Holocene environmental change inthe midwestern United States. Quaternary Research 37, 379-389.
Barnett, P.J. 1979. Glacial Lake Whittlesey: the probable ice frontal position in the eastern end of the Erie basin.Canadian Journal of Earth Sciences 16:568-574.
Bengtsson, L., and J. Malm. 1997. Using rainfall-runoff modeling to interpret lake level data. Journal ofPaleolimnology 18:35-248.
Calkin, P.E. and B.H. Feenstra. 1985. Evolution of the Erie-Basin Great Lakes. In Karrow, P.F. and Calkin, P.E.(eds.) Quaternary Evolution of the Great Lakes. Geological Association of Canada Special Paper 30, 149-170.
Cameron, G.D.M. 1991. Seismostratigraphy of Late Quaternary sediments and lake level history, eastern LakeErie. Unpublished MSc thesis, Dalhousie University, Halifax, Nova Scotia.
Coakley, J.P. and C.F.M. Lewis. 1985. Postglacial lake levels in the Erie basin. In Karrow, P.F. and Calkin, P.E.(eds.) Quaternary Evolution of the Great Lakes. Geological Association of Canada, Special Paper 30:195-212.

18
Dalrymple, R.W. and J.S. Carey. 1990. Water-level fluctuations in Lake Ontario over the last 4000 years asrecorded in the Cataraqui River lagoon, Kingston, Ontario. Canadian Journal of Earth Sciences 27:1330-1338.
Edwards, T.W.D. and J.H. McAndrews. 1989. Paleohydrology of a Canadian Shield lake inferred from18O insediment cellulose. Canadian Journal of Earth Sciences 26:1850-1859.
Flint, J.E., R.W. Dalrymple, and J.J. Flint. 1988. Stratigraphy of the Sixteen Mile Creek lagoon, and its implica-tions for Lake Ontario water levels. Canadian Journal of Earth Sciences 25:1175-1183.
Fritz, P., T.W. Anderson, and C.F.M. Lewis. 1975. Late-Quaternary climatic trends and history of Lake Erie fromstable isotope studies. Science 190:267-269.
Gareau, P., C.F.M. Lewis, T.C. Moore, D.K. Rea, A.J. Smith, and L.C.M. Shane. 1999. Digital reconstruction ofthe areas, volumes and geography of the paleo-Great Lakes 11.3-7.7 ka. Geological Survey of Canada Open File(in review).
Hough, J.L. 1958. Geology of the Great Lakes. University of Illinois Press, Urbana IL, 313 p.
Larsen, C.E. 1985. Lake level, uplift and outlet incision, the Nipissing and Algoma Great Lakes. In QuaternaryEvolution of the Great Lakes, P.F. Karrow, and P.E. Calkin, (eds.). Geological Association of Canada, SpecialPaper 30:63-75.
Lewis, C.F.M., and T.W. Anderson. 1989. Oscillations of levels and cool phases of the Laurentian Great Lakescaused by inflows from glacial Lakes Agassiz and Barlow-Ojibway. Journal of Paleolimnology 2:99-146.
Lewis, C.F.M., and T.W. Anderson. 1992. Stable isotope (O and C) and pollen trends in eastern Lake Erie, evi-dence for a locally-induced climatic reversal of Younger Dryas age in the Great Lakes basin. Climate Dynamics6:241-250.
Lewis, C.F.M., D.L. Forbes, E. Nielsen, L.H. Thorleifson, A.M. Telka, R.E. Vance, and B.J. Todd. 1998a. Mid-Holocene Lake Winnipeg: where was it? Geological Society of America Abstracts with Programs 30(7):A-168.
Lewis, C.F.M., D.L. Forbes, J.W. King, C. Gibson, E. Nielsen, C.G. Rodrigues, L.H. Thorleifson, P.J. Henderson,and B.J. Todd. 1998b. Lake Winnipeg, Manitoba, Canada: new sediment records of early Holocene proglacialrhythmites from Lake Agassiz and mid-Holocene closed lake conditions. Supplement to EOS Transactions AGU79, F477.
Lewis, C.F.M., D.L. Forbes, B.J. Todd, E. Nielsen, L.H. Thorleifson, T.W. Anderson, R.N. Betcher, W.M. Buhay,S.M. Burbidge, C. Gibson, P.J. Henderson, C.A. Jarrett, J.W. King, H.J. Kling, W.M. Last, W.L. Lockhart, G.Matile, I. McMartin, K. Moran, J. Risberg, C.G. Rodrigues, C.J. Schröder-Adams, A.M. Telka, R.E. Vance. 1999.Lake Winnipeg reveals Holocene climate-driven change in large-lake extent and status. Report in preparation.
McCarthy, F.G. and J.W. McAndrews. 1988. Water levels in Lake Ontario 4230-2000 BP: evidence from Grena-dier Pond, Toronto, Canada. Journal of Paleolimnology 1:99-113.
National Atlas of Canada. 1985. Canada Drainage Basins, Map 5.1. The National Atlas of Canada, Energy Minesand Resources Canada, Ottawa, Map MCR 4055, Scale 1: 7 500 000.
National Hydrological Atlas. 1978. Annual Precipitation - Plate 3, Mean Annual Lake Evaporation - Plate 17,Annual runoff - Plate 24; Canadian National Committee for the International Hydrological Decade, HydrologicalAtlas of Canada, Fisheries and Environment Canada, Ottawa, Map scales 1:10 000 000.

19
Pengelly, J.W., K.J. Tinkler, W.G. Parkins, and F.G. McCarthy. 1997. 12 600 years of lake level changes, changingsills, ephemeral lakes and Niagara Gorge erosion in the Niagara Peninsula and eastern Lake Erie basin. Journal ofPaleolimnology 17:377-402.
Ritchie, J.C. 1976. The late-Quaternary vegetational history of the Western Interior of Canada. Canadian Journalof Botany 54:1793-1818.
Sanford, B.V., F.J. Thompson, and G.H. McFall. 1985. Plate-tectonics - a possible mechanism in the developmentof hydrocarbon traps in southwestern Ontario. Bulletin of Canadian Petroleum Geology 33:52-71.
Todd, B.J., C.F.M. Lewis, L.H. Thorleifson, and E. Nielsen (eds). 1996. Lake Winnipeg Project: cruise report andscientific results, Geological Survey of Canada Open File Report 3113, 656 p.
Todd, B.J., C.F.M. Lewis, D.L. Forbes, L.H. Thorleifson, and E. Nielsen (eds). 1999. 1996 Lake WinnipegProject: cruise report and scientific results, Geological Survey of Canada Open File Report 3470, (in press).
Wallach, J.L., A.A. Mohajer, and R.L. Thomas, 1998. Linear zones, seismicity, and the possibility of a majorearthquake in the intraplate western Lake Ontario area of eastern North America. Canadian Journal of EarthSciences 35:762-786.
Webb, R.S., K.H. Anderson, and T. Webb III. 1993. Pollen response-surface estimates of late-Quaternary changesin the moisture balance of the northeastern United States. Quaternary Research 40:213-227.
Yu, Z., J.H. McAndrews, and U. Eicher. 1997. Middle Holocene dry climate caused by changes in atmosphericcirculation patterns: Evidence from lake levels and stable isotopes. Geology 25:251-254.

20
~ Paleo Lake Levels — The Last Four-Thousand Years ~
RECONSTRUCTING HOLOCENE LAKE-LEVEL FLUCTUATIONS IN THE LAKE SUPERIOR BASIN
Curtis LarsenU.S. Geological Survey
12201 Sunrise Valley Drive, MS 955Reston, VA [email protected]
Lake Superior is the largest lake of the five Great Lakes and overflows directly into Lake Huron. The mean waterlevels of the two lakes are at approximately 183.4 m and 176.3 m above sea level, respectively. Isostatic uplift isactive across the entire Great Lakes basin and with rates of vertical movement increasing from southwest tonortheast across the region (Coordinating Committee, 1977); thus, differential tilting continues to raise thebedrock-floored outlet channel from Lake Superior above the level of Lake Huron. The current rate of uplift at theoutlet is about 0.33 m/century relative to the southern shore of Lake Michigan (Larsen, 1994). Between 5,000 and2,100 years ago, Lake Superior was joined with Lake Huron and Lake Michigan and formed a single lake sup-plied by precipitation and evaporation over its drainage basin and governed by overflow through a single outletchannel at the south shore of Lake Huron (Hough, 1958; Farrand and Drexler, 1985). About 2,100 years ago,differential tilting began to raise the outlet channel from Lake Superior above the level of Lake Huron (Larsen,1994). The present separation between lake surfaces was attained over the subsequent 21 centuries. Since separa-tion from Lake Huron, Lake Superior has fluctuated due to its own hydroclimatic mass balance, with its meanlevel controlled (prior to construction of the Soo Locks) by the threshold altitude of the St. Marys rapids at about182 m. The range of lake-level variation over the past century has been + 0.5 m, reflecting variations in precipita-tion, evaporation and the outflow through the locks and St. Marys River at the eastern end of the lake.
Both isostatic tilting and climate change continue to significantly affect the relative levels of Lake Superior asthey have over the past 5,000 years as evidenced by raised and drowned paleo-shorelines. Differential tilting ofthe Lake Superior basin has rearranged the attitude of the lake shores relative to the mean level of the lake at itsoutlet. Between 5,000 and 2,100 years ago, the mean level of Lake Superior was maintained by its previous outlet,the St Clair River, at the south shore of Lake Huron. Beaches formed simultaneously, when the combined threeupper lakes were joined, are now uplifted relative to the level at that outlet. But, uplift of the St. Marys rapidsabove Lake Huron 2,100 years ago changed the pattern of relative shoreline positions and their land forms. Beachfeatures deposited along the shores of Lake Superior since separation of the lakes continue to be uplifted along thenorth shore of the lake but relative to the new and present outlet (Larsen, 1987, 1994, 1999a). The northern shoreof Lake Superior rises more rapidly than does the outlet due to tilting, while the southern shore experiencesprogressive submergence as the outlet rises more rapidly than this shore. Duluth harbor, for example, has under-gone about 5.8 m of submergence over the past 2,100 years, evidenced by submerged tree stumps and thedrowned channel of the St. Louis River. Correlated coastal landforms track the progressive submergence throughtime. Beach ridges deposited by contemporaneous lake levels are found near present mean lake level in the east,but descend in altitude to the west to where they are submerged near the Apostles Islands and at Duluth harbor.The earliest landforms from the previous three-lake system—the Nipissing phase shore deposits—now exposed atan altitude of 195 m near the outlet, are near or below lake level near Duluth (Larsen, 1999a, Larsen et al., 1999).
A new suite of radiocarbon dates from basal peat deposits lying on submerged beach deposits near the ApostlesIslands defines the rate of uplift of the St. Marys rapids relative to Chequamegon Bay during the past 2,100 years.That rate is between 0.18 and 0.21 m/century, consistent with the observed historic rate of uplift of the outletrelative to this site. Other radiocarbon ages from stratified organics near the Apostles Islands outline broad

21
fluctuating episodes of higher and lower climate-related lake levels superimposed on the rising mean level con-trolled by uplift at the outlet (Fig 1). High levels occurred at about 1,100, 400, and 200 radiocarbon years agowith low-level episodes at about 650 and 350 years ago. The implied range of lake level variation is greater than +1.0 m about the long term mean level of the lake. Dated sediments in vibracores from beach ridges on Long Islanddetail the most recent lake-level history. Lake level was high during the early 18th century and then fell to belowthe present mean level for periods between 1770 and 1825. The episodes of the 18th and early 19th centuries werealso on the order of + 1.0 m about the mean level. Since the mid 19th century the levels of Lake Superior appear tohave fluctuated within the historic range of + 0.5 m. The high-level episodes of the past tend to correspond with ahigh episode in evidence for eastern Lake Superior as well as southern Lake Michigan (Larsen, 1994). The highspreceding the historic period appear to reflect climate change related to the “Little Ice Age”. A major low episodein lake level corresponds with a 13th century maximum of solar activity commonly associated with the “MedievalWarm Period” of northern Europe (Lean and Rind, 1998). The low-level interval of 350 years ago took placebetween periods of higher lake level. The low level interval tends to relate temporally with the “Maunder Mini-mum” sunspot interval recorded in Europe between 1614 and 1741 which was associated with cooler summertemperatures in Europe (Lean and Rind, 1998). The connection with historically-documented climate intervals inEurope is still unclear. We are cautioned that these events seem not to have been synchronous or in phase else-where.
Figure 1. Paleo lake level record for the Apostles Island area, Lake Superior. Climate-related fluctuations inLake Superior level are superimposed on a rising mean level caused by uplift of the St. Marys Rapidsrelative to the Apostles Islands. Red line shows a linear regression calculated on basal peat dates andsuggests an uplift rate of at least 16 cm/century at the outlet. The historic rates of uplift of the outlet relativeto the Apostles Islands (Coordinating Committee, 1977) are shown for comparison. Together these illustratethe rising mean level at this location. High and low level episodes on the order of 1-1.5 m above and belowtheir contemporaneous mean levels are shown. Lows occurred during the “Medieval Warm Period” andwithin the “Little Ice Age.” High levels of similar magnitude occurred during the “Little Ice Age” andpreceeding the “Medieval Warm Period.”

22
Submerged land forms at the opposite end of the lake at Bay Mills, MI indicate anomalous low lake-level standsof Lake Superior (Larsen, 1999b). Here, near the outlet, the measurable effects of differential uplift are minimal.A spit complex at Bay Mills has prograded eastward across the mouth of Waiska Bay, built by longshore driftsupplied by the erosion of bluffs to the west (Figure 2). The present spit (and the most recent in the sequence ofspits) is clearly shown on early 19th century navigation charts prepared by the Royal Navy. Two earlier recurvedspits were deposited across the bay mouth, but now lie submerged below lake level. Radiocarbon ages fromdetrital wood recovered from the bases of the submerged spits show limiting ages of 1530 + 60 years BP (beforepresent) for deposition of the earliest spit and 1240 + 60, 1250 + 60, 1080 + 60, and 970 + 60 years BP fordeposition of the younger of the submerged spits. Bathymetric profiles across the bay show a preserved offshorebar system lying in 3 m of water on the lakeward (north) flank of the younger submerged spit. A comparison with
Figure 2. Submerged spit sequence at Bay Mills, MI. The map shows the positions of bathymetricprofiles and core locations within the bay. The shaded area of the map outlines two spits, nowsubmerged, that were deposited between 1500 and 1000 years ago. The sample locations andradiocarbon ages of detrital wood are also shown. A submerged offshore bar system associatedwith the lakeward edge of the middle spit along Line 6 shows it had an active shore face at a lakelevel 12.5 m below the present mean level between 1000 A.D. and the 18th and 19th centurieswhen the modern spit was destroyed.

23
an analogous offshore bar system along the active shoreface of the modern spit at Bay Mills shows that thepreserved bar system was deposited at a water depth 1.5 m below the present mean level of Lake Superior (183.4m). This same depth corresponds with the bedrock spillway of the St. Marys rapids that formerly controlled thelevel of the lake. The limiting ages of the submerged spits and the earliest map of the present active spit show thatthe preserved offshore bar system was deposited between 970 + 60 years BP and the early 19th century. Spit-building activity is thought to correspond with episodes of higher lake level when bluff erosion supplied greatersediment loads to the littoral system. The drowned offshore bar system relates to a low-level episode that occurredbetween 1,000 AD and 1824 AD that allowed reworking of the active face of the spit. Subsequent high levels andconcomitant bluff erosion contributed sediment to the present spit which then served as a protective barrier to theprevious spits.
The indicated low level 1.5 m below the modern mean level of Lake Superior suggests that the lake fell to thethreshold depth of the spillway to the St. Marys River and that little or no outflow from Lake Superior took placeat that time. Given the range and timing of the low lake-level episodes recorded near the Apostles Islands, eitherthe Medieval Warm Period low or the low stand mid way through the Little Ice Age could account for the anoma-lous submerged bar system at Bay Mills.
These reconstructions of past lake levels in Lake Superior are derived from independent data sets. As the upper-most lake in the Great Lakes system, Lake Superior is the lake most directly controlled by changes in precipita-tion and evaporation in the region. Assuming constant outflow, high and low episodes of the past most certainlyreflect climate change on a century and sub century range.
References
Coordinating Committee on Basic Hydraulic and Hydrologic Data. 1977. Apparent Vertical Movement over theGreat Lakes, Detroit District, U.S. Army Corps of Engineers, 70 p.
Farrand, W.R., and C. W. Drexler, 1985. Late Wisconsinan and Holocene history of the Lake Superior basin. InQuaternary Evolution of the Great Lakes, P.F. Karrow, and P.E. Calkin, (eds), Geological Association of CanadaSpecial Paper 30:17-32.
Hough, J. L. 1958. Geology of the Great Lakes, University of Illinois Press, Urbana, 313 p.
Larsen, C.E. 1994. Beach ridges as monitors of isostatic uplift in the upper Great Lakes, Journal of Great LakesResearch, 20:108-134.
Larsen, C.E. 1987. Geological History of Glacial Lake Algonquin and the Upper Great Lakes, U.S. GeologicalSurvey Bulletin 180l, 36 p.
Larsen, C.E. 1999a. Submergence along the south and western shore of Lake Superior since 2,100 B.P. Programwith Abstracts, International Association for Great Lakes Research, 42nd Annual Meeting, p. A-66
Larsen, C.E. 1999b. Evidence for anomalous climate-related low lake level stands of Lake Superior at Bay Mills,MI. Program and Abstracts, International Association for Great Lakes Research, 42nd Annual Meeting, p. A-66.
Larsen, C.E., C.C. Cameron, (deceased), and E.I. Robbins. 1999. The reconstructed Late Holocene lake-levelhistory of the Apostles Islands National Lakeshore, Lake Superior., Program and Abstracts, International Associa-tion for Great Lakes Research, 42nd Annual Meeting, p. A-66.
Lean, J., and D. Rind. 1998. Climate forcing by changing solar radiation. Journal of Climate 11:3069-3094.

24
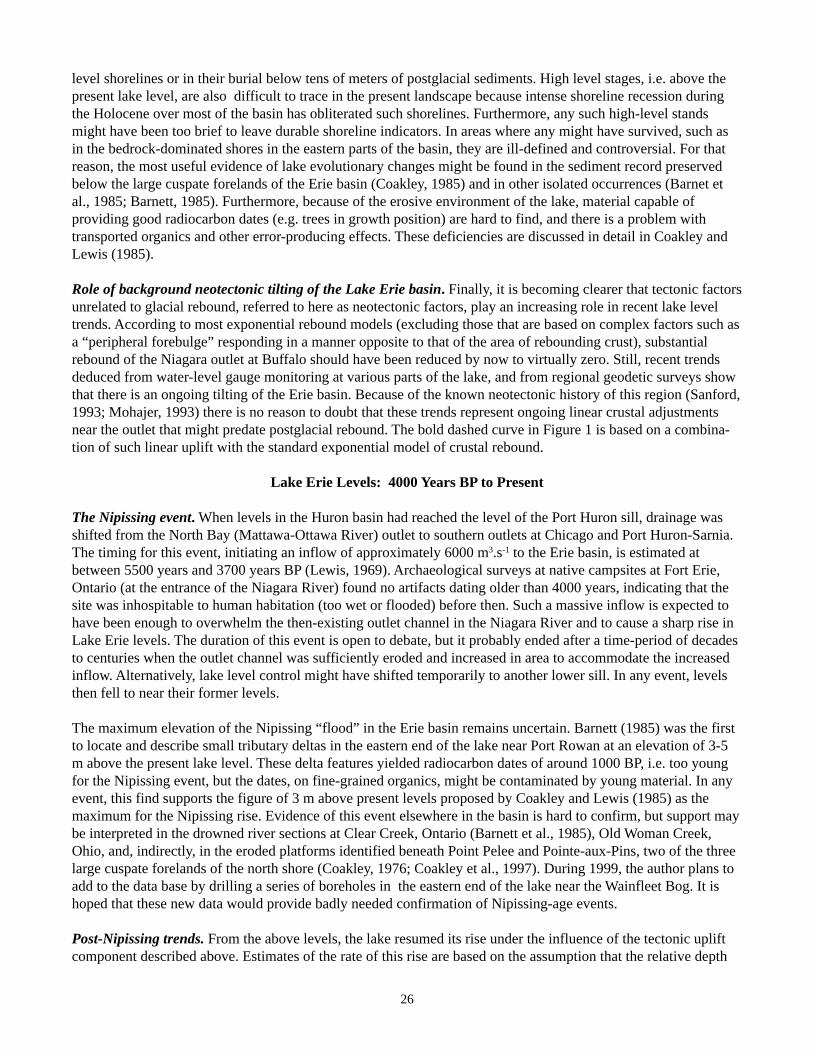
Figure 1. Reconstructed history of postglacial Lake Erie levels (heavy solid line) based on over 50radiocarbon-dated level indicators reproduced from Coakley and Lewis (1985). The heavy dashed lineis an hypothesized level curve assuming a composite model of uplift and overflowing conditions at theoutlet; the light dotted line is the upper fit envelope in Lewis (1969). The curve is applicable to thecentral and eastern basins only. The radiocarbon dated references used in the curve are listed inTable 1 in Coakley and Lewis (1985).
~ Paleo Lake Levels — The Last Four-Thousand Years ~
LAKE LEVELS IN THE ERIE BASIN: DRIVING FACTORS AND RECENT TRENDS
John P. CoakleyNational Water Research InstituteCanada Centre for Inland Waters
Burlington, [email protected]
Introduction
Three major factors control lake levels in the Erie basin. They are: postglacial isostatic rebound of the crust at itsoutlet, regional hydrological and climatic changes, and to a less dramatic extent, long-term neotectonic move-ments. Under the influence of the above factors, Lake Erie has undergone a complex history of rises, declines, andstability since the close of the glacial period some 12 000 years ago. From a low-level stage more than 50 mbelow present levels, the lake has risen to its present stage. The heavy solid line in Figure 1 represents a recon-struction of postglacial lake levels in the Lake Erie basin. It is based on over 50 radiocarbon-dated strandlineindicators collected by the author and others at sites around the lake basin (see Table 1 in Coakley and Lewis,1985). The upper limits of the original envelope of probable levels proposed by Lewis (1969) are shown as a lightdotted line. A useful discussion of lake levels in the Erie basin over the past 12 000 years is also presented inPengelly et al. (1997).
25
Postglacial isostatic rebound. Lake Erie rose from its minimum levels (Early Lake Erie) due to crustal rebound ofthe outlet at the Niagara River from its glacier-depressed state. The recovery rate decreased exponentially withtime. Reconstruction models based on exponential rebound alone (Andrews, 1970) grossly overestimate the initialrise in levels, compared to that based on dated strandline indicators. However, the curve based on a compositemodel of exponential uplift, originally proposed by Mörner (1980) and elaborated on in Coakley and Lewis(1985) (shown in Figure 1 as a heavy dashed line) provided a much more reasonable fit to the data points. Bothcurves represent lake levels in the central and eastern basins assuming confluence of these basins and overflowingconditions at the outlet. Two important discrepancies are evident from the two curves:
● Most of the indicators in the western basin lie above the reconstructed level curve indicating that this part ofthe lake was subaerially exposed or contained perched bodies of water.
● The difference in elevation between the composite model curve and that based on dated strandline indicatorssuggests that the rapid initial rebound, together with negligible upper lakes inflows and a relatively dry climateat the time, resulted in a period of closed conditions in Lake Erie. In other words, drainage within the LakeErie watershed had no outlet except evaporation. Although such a scenario remains to be confirmed in thesediment record, it has been cited by Tinkler et al. (1994) as an explanation for anomalous radiocarbon agesequences in shells from the Niagara Whirlpool site.
The less-than-ideal fit of the lake level curve to the data set prompted the idea that postglacial uplift might nothave been as simple as predicted on the basis of simple or composite rebound model utilizing a fixed hinge-line(Hough, 1966). Geophysical complexities such as lower mantle rheology and the presence of a “peripheralforebulge” in front of the ice margin have been cited as perturbing factors in the rebound dynamics of a glacier-depressed crust (Pelletier, 1986). Also, preexisting crustal movement might play a role (see section below).Nevertheless, one assumes that with time, the effect of crustal movements related to rebound would decline, andthat the other factors mentioned at the beginning of this paper would gradually assume a larger importance. Theseare discussed briefly below.
Hydrological and climatic factors. A number of significant hydrological events, involving major changes ininflow, outflow, and evaporation-precipitation, have occurred in postglacial Lake Erie. Evidence for changes inlake levels caused by such effects is derived largely from postglacial sediment records, such as those from belowthe three major cuspate forelands along the north shore (Coakley, 1976; 1985). Lewis and Anderson (1989) foundevidence in sediment cores from a deep borehole on Long Point that waters from glacial Lake Algonquin dis-charged briefly into the Erie basin around 11,000 years Before Present (BP). Lewis and Anderson (1989) andTinkler and Pengelly (1995) also concluded that catastrophic releases from Glacial Lake Agassiz, a huge glaciallake covering most of the prairie provinces of Canada, reached Lake Erie. The hypothesized result was signifi-cant, but transient, peaks in Erie levels around 8,000 years BP. The possibility of such a scenario was questionedby others (Rea et al., 1995), but the matter is still a subject of debate. The best documented episode of a singularexcursion from the predicted exponential model is that now referred to as the Nipissing event or “flood”. Thisevent was initially proposed by Hough (1966) and expanded upon by Lewis (1969), Coakley and Lewis (1985),and others. Climatic change was also postulated by Lewis and Anderson (1989) and by Lewis (1999, this volume)as a reason for water level changes in the Erie and Huron basins. The evidence for climate-induced changes inlake levels is most often found in dated profiles of stable isotope (carbon and oxygen) concentrations in lakesediments (Fritz et al., 1975; Tevesz et al., 1997) and in pollen profiles (Lewis and Anderson, 1992). However, aschanges in isotopic composition can be related to both climate and hydrological events, it is difficult to separatetheir individual effects.
Sedimentary evidence for the above dramatic lake level events is sparse in the Lake Erie basin, especially whencompared to the excellent records preserved in the Lake Michigan beach ridges (Thompson and Baedke, 1999,this volume). Because of the location of the lake outlet at the northeast end of the basin where uplift was greatest,the lake gradually backfilled from east to west. This resulted in the sequentially drowning or erosion of all low-
26
level shorelines or in their burial below tens of meters of postglacial sediments. High level stages, i.e. above thepresent lake level, are also difficult to trace in the present landscape because intense shoreline recession duringthe Holocene over most of the basin has obliterated such shorelines. Furthermore, any such high-level standsmight have been too brief to leave durable shoreline indicators. In areas where any might have survived, such asin the bedrock-dominated shores in the eastern parts of the basin, they are ill-defined and controversial. For thatreason, the most useful evidence of lake evolutionary changes might be found in the sediment record preservedbelow the large cuspate forelands of the Erie basin (Coakley, 1985) and in other isolated occurrences (Barnet etal., 1985; Barnett, 1985). Furthermore, because of the erosive environment of the lake, material capable ofproviding good radiocarbon dates (e.g. trees in growth position) are hard to find, and there is a problem withtransported organics and other error-producing effects. These deficiencies are discussed in detail in Coakley andLewis (1985).
Role of background neotectonic tilting of the Lake Erie basin. Finally, it is becoming clearer that tectonic factorsunrelated to glacial rebound, referred to here as neotectonic factors, play an increasing role in recent lake leveltrends. According to most exponential rebound models (excluding those that are based on complex factors such asa “peripheral forebulge” responding in a manner opposite to that of the area of rebounding crust), substantialrebound of the Niagara outlet at Buffalo should have been reduced by now to virtually zero. Still, recent trendsdeduced from water-level gauge monitoring at various parts of the lake, and from regional geodetic surveys showthat there is an ongoing tilting of the Erie basin. Because of the known neotectonic history of this region (Sanford,1993; Mohajer, 1993) there is no reason to doubt that these trends represent ongoing linear crustal adjustmentsnear the outlet that might predate postglacial rebound. The bold dashed curve in Figure 1 is based on a combina-tion of such linear uplift with the standard exponential model of crustal rebound.
Lake Erie Levels: 4000 Years BP to Present
The Nipissing event. When levels in the Huron basin had reached the level of the Port Huron sill, drainage wasshifted from the North Bay (Mattawa-Ottawa River) outlet to southern outlets at Chicago and Port Huron-Sarnia.The timing for this event, initiating an inflow of approximately 6000 m3.s-1 to the Erie basin, is estimated atbetween 5500 years and 3700 years BP (Lewis, 1969). Archaeological surveys at native campsites at Fort Erie,Ontario (at the entrance of the Niagara River) found no artifacts dating older than 4000 years, indicating that thesite was inhospitable to human habitation (too wet or flooded) before then. Such a massive inflow is expected tohave been enough to overwhelm the then-existing outlet channel in the Niagara River and to cause a sharp rise inLake Erie levels. The duration of this event is open to debate, but it probably ended after a time-period of decadesto centuries when the outlet channel was sufficiently eroded and increased in area to accommodate the increasedinflow. Alternatively, lake level control might have shifted temporarily to another lower sill. In any event, levelsthen fell to near their former levels.
The maximum elevation of the Nipissing “flood” in the Erie basin remains uncertain. Barnett (1985) was the firstto locate and describe small tributary deltas in the eastern end of the lake near Port Rowan at an elevation of 3-5m above the present lake level. These delta features yielded radiocarbon dates of around 1000 BP, i.e. too youngfor the Nipissing event, but the dates, on fine-grained organics, might be contaminated by young material. In anyevent, this find supports the figure of 3 m above present levels proposed by Coakley and Lewis (1985) as themaximum for the Nipissing rise. Evidence of this event elsewhere in the basin is hard to confirm, but support maybe interpreted in the drowned river sections at Clear Creek, Ontario (Barnett et al., 1985), Old Woman Creek,Ohio, and, indirectly, in the eroded platforms identified beneath Point Pelee and Pointe-aux-Pins, two of the threelarge cuspate forelands of the north shore (Coakley, 1976; Coakley et al., 1997). During 1999, the author plans toadd to the data base by drilling a series of boreholes in the eastern end of the lake near the Wainfleet Bog. It ishoped that these new data would provide badly needed confirmation of Nipissing-age events.
Post-Nipissing trends. From the above levels, the lake resumed its rise under the influence of the tectonic upliftcomponent described above. Estimates of the rate of this rise are based on the assumption that the relative depth
27
changes noted in the gauges since the mid 1800’s are caused by a rise at the Buffalo end of the lake and not asubsidence in the western end. The latter would not lead to a true rise in lake levels elsewhere in the lake. Themost comprehensive treatment of the gauge data is presented in Clark and Persoage (1970), in recent reports ofthe Coordinating Committee on Lake Levels (1977), and in Tushingham (1992). In the latter, the rate of change ingauge readings between Buffalo and points in the western end of the lake (deepening with respect to the Buffalogauge) varies between 9 cm.century-1 (Buffalo-Cleveland and Buffalo-Kingsville) and 7 cm.century-1 (Buffalo-Marblehead). However, rates for other comparable pairs of gauges, for example, 4.5 cm.century -1 for Buffalo-Toledo, are anomalously low and thus raise questions as their accuracy. Nevertheless, a figure of 8 cm. century-1
was used in Coakley and Lewis (1985) as the underlying linear component in a composite model of lake level rise(Figure 1).
Summary
The causes of postglacial lake level rise in the Erie basin are varied and thus, predicting future trends is difficultwithout more research and data. However, using past trends as a guide for the future, levels will continue to rise atrates of approximately 5-10 cm.century-1, driven primarily by neotectonic processes. Such a prediction is validonly if all other factors, such as regional hydrology and climate remain unchanged. This is an important qualifica-tion, however, as there are increasing fears of climate changes taking place on a global scale. Another imponder-able in the prediction of future lake levels is the effect of increased pressure on Lake Erie water resources forconsumptive water uses, irrigation, and the drive for greater efficiency in navigation and shipping. All theseactivities have the potential for lowering lake levels, especially when coupled by trends to a warmer and drierregional climate. Of all possible scenarios, dramatic lowering of Lake Erie would have the most serious impact.The negative impact on coastal wetlands, shipping tonnages, and the increased potential for resuspension ofshallow-water contaminated sediment deposits by wave action and increased navigational dredging, could bedevastating. The flip side of the coin is the economic impact of shore erosion and shoreline flooding if the lakerises above present levels.
As is evident from the list of references below, there is a scarcity of recent research into long-term lake leveltrends. Hopeful developments are the borehole drilling at Wainfleet by the National Water Research Institute, andplans for further archaeological investigations in the eastern part of the lake. These efforts, and others yet to beannounced, will no doubt add considerably to our understanding of late Holocene lake levels in the Erie basin.
References
Andrews, J.T. 1970. Present and postglacial rates of uplift for glaciated northern and eastern North America basedderived from postglacial uplift curves. Canadian Journal of Earth Sciences 7:703-727.
Barnett, P.J. 1985. Glacial retreat and lake levels, north central Lake Erie Basin, Ontario. In Quaternary Evolutionof the Great Lakes, P.F. Karrow and P.E. Calkin (Eds.), Geological Association of Canada Special Paper 30:185-194.
Barnett, P.J., J.P. Coakley, J. Terasmae, AND C.E. Winn. 1985. Chronology and significance of a Holocenesedimentary profile from Clear Creek, Lake Erie shoreline. Canadian Journal of Earth Sciences 22(8):1133-1138.
Clark, R.H., and N.P. Persoage. 1970. Some implications of crustal movement in engineering planning. CanadianJournal of Earth Sciences 7:628-633.
Coakley, J.P. 1976. The formation and evolution of Point Pelee, western Lake Erie. Canadian Journal of EarthSciences 13(1):136-144.
Coakley J.P. 1985. Evolution of Lake Erie based on the postglacial sedimentary record below the Long Point,
28
Point Pelee and Pointe-aux-Pins forelands. Unpubl. Ph.D. Thesis, Dept. Earth Sciences, Univ. of Waterloo, 362pp.
Coakley, J.P., and C.F.M. Lewis. 1985. Postglacial lake levels in the Erie basin. Quaternary Evolution of the GreatLakes, P.F. Karrow and P.E. Calkin (Eds.), Geological Association of Canada Special Paper 30:195-212.
Coakley, J.P., A.S. Crowe, and P.A. Huddart. 1997. Subsurface sediment profiles below Point Pelee, indicators ofpostglacial evolution in western Lake Erie. Canadian Journal of Earth Sciences 35:88-99.
Coordinating Committee on Great Lakes Basic Hydraulic and Hydrologic Data. 1977. Apparent Vertical Move-ment Over the Great Lakes. Chicago, Illinois, and Cornwall, Ontario. Printed by the Detroit District, US ArmyCorps of Engineers, July 1977.
Fritz, P., T.W. Anderson, and C.F.M. Lewis. 1975. Late Quaternary climatic trends and history of Lake Erie fromstable isotope studies. Science 190:267-269.
Hough, J.L. 1966. Correlation of glacial lake stages in the Huron - Erie and Michigan basins. Journal of Geology74: 62-67.
Lewis, C.F.M. 1969. Late Quaternary of lake levels in the Huron and Erie basins. Proc. 12th. Conference on GreatLakes Research, p. 250-270.
Lewis, C.F.M. 1999. Holocene lake levels and climate, Lakes Winnipeg, Erie, and Ontario. In Paleo Lake Levels -The Last Four Thousand Years, a workshop held at Great Lakes Environmental Research Laboratory, Ann Arbor,MI, April 13-14, 1999 (this volume).
Lewis, C.F.M., and T.W. Anderson. 1989. Oscillations of levels and cool phases of the Laurentian Great Lakescaused by inflows from glacial Lakes Agassiz and Barlow-Ojibway. Journal of Paleolimnology 2:99-146.
Lewis, C.F.M. and T.W. Anderson. 1992. Stable isotope (O and C) and pollen trends in eastern Lake Erie, evi-dence for a locally-induced climatic reversal of Younger Dryas age in the Great Lakes basin. Climate Dynamics6:241-250.
Mohajer, A.A. 1993. Seismicity and seismotectonics of the western Lake Ontario region. Géographie physique etQuaternaire 47:353-362.
Mörner, N.-A. 1980. The Fennoscandinavian uplift: geological data and their geodynamic implications. In EarthRheology, Isostasy, and Eustacy, N.-A. Mörner, (Ed.). Int. Union of Geological Sciences Geodynamics Proj.,Report no. 49, 251-284.
Pelletier, W.R. 1986. Deglaciation-induced vertical motion of the North American continent and transient lowermantle rheology. Journal of Geophysical Research 91:9099-9123.
Pengelly, J.W., K.J. Tinkler, W.G. Parkins, and F.M. McCarthy. 1997. 12,600 Years of Lake Level Changes,Changing Sills, Ephemeral Lakes and Niagara Gorge Erosion in the Niagaran Peninsula and Eastern Lake ErieBasin. Journal of Paleolimnology 17:377-402.
Rea, D.K., T.C. Moore, T.W. Anderson, D.M. Dodson, D.L. Dettman, A.J. Smith, and L.A. Mayer. 1995. GreatLakes paleohydrology: complex interplay of glacial meltwater, lake levels, and sill depths. Geology 22:1059-1062.

29
Sanford, B.V. 1993. St. Lawrence Platform — Geology: Chapter 11. In Sedimentary Cover of the Craton inCanada, D.F. Stott, and J.D. Aitken (Eds.). Geology of Canada 5:723-786 (also Geological Society of America,The Geology of North America, D-1).
Tevesz, M.J.S., J.E. Smith, J.P. Coakley, and M.J. Risk. 1997. Stable isotope records (C and O) from Lake Eriesediment cores: mollusk aragonite 3500 BP - 500 BP. Journal of Great Lakes Reserach 23(3): 307-316
Thompson, T.A., and S.J. Baedke. 1999. Strandplain evidence for reconstructing Late Holocene lake level in theLake Michigan basin. In Paleo Lake Levels - The Last Four Thousand Years, a workshop held at Great LakesEnvironmental Research Laboratory, Ann Arbor, MI, April 13-14, 1999 (this volume).
Tinkler, K.J., J.W. Pengelly, W.G. Parkins, and G. Asselin. 1994. Postglacial recession of Niagara Falls in relationto the Great Lakes. Quaternary Research 42:20-29.
Tinkler, K.J., and J.W. Pengelly. 1995. Great Lakes response to catastrophic inflows from Lake Agassiz: somesimulations of a hydraulic geometry for chained lake systems. Journal of Paleolimnology 13:251-266.
Tushingham, A.M. 1992. Postglacial uplift predictions and historical water levels of the Great Lakes. Journal ofGreat Lakes Research 18:440-455.

30
~ Paleo Lake Levels — The Last Four-Thousand Years ~
STRANDPLAIN EVIDENCE FOR RECONSTRUCTING LATE HOLOCENE LAKE LEVEL IN THELAKE MICHIGAN BASIN
Todd A. ThompsonIndiana Geological Survey, Indiana University
Bloomington, IN 47405
Steve J. BaedkeDept. of Geology and Environmental Science, James Madison University
Harrisonburg, VA 22807
Establishing Past Lake Level
The reconstruction of late Holocene lake-level changes in the Lake Michigan basin requires information to becollected that indicates the elevation of the lake and the particular time that the water was at that elevation. Onegeologic approach is to collect paleo-elevation and paleo-age information from coastal and paralic (environmentsbordering the coast) features and sediments along the lake’s margins (Table 1). Two methods are commonlyemployed to establish the lake’s past elevation using coastal and paralic deposits and features. The first is geomor-phic; it approximates the paleo-elevation of the lake by measuring the elevation of a geomorphic feature. Suchfeatures include wave and stream-cut terraces, delta platforms, stream and valley fills, spits, dunes, barrierbeaches, and beach ridges. Examples of this type of approach are topographic surveys across a series of beachridges (e.g., Johnson et al., 1990; Lichter, 1995; Petty et al., 1996), where elevation changes between the crests ofthe ridges are assumed to represent the magnitude of lake level change through time. A correction is then neededfrom the elevation of the dune crest of each ridge to where the elevation of actual lake level was when the ridgeformed. The geomorphic approach is the most commonly used technique for estimating the elevation of past lakelevels throughout the entire Great Lakes, its legacy extends back into the late 1800s (e.g., Leverett, 1897;Goldthwait, 1908).
Table 1. Types of elevation and age data that can be used to reconstruct pastlake levels in the Lake Michigan basin.
Elevation Data Age Data
Geomorphic Relative- Terraces and wave-washed platforms - Geomorphic relationships- Fluvial - Stratigraphic sequences- Coastal- Beach ridges, spits, barrier beaches, etc. Radiocarbon- Delta platforms - Wood, peat, bones, shells, etc.
Sedimentologic/Stratigraphic Other Radiometric- Facies- Facies contacts Incremental- Stratigraphic sequences

31
The second method of determining lake level elevation is sedimentologic and stratigraphic, where the elevation ofthe lake is determined by measuring the elevation of sedimentary deposits in coastal and paralic features andsediments. In this method, cores or outcrops are used to determine the elevation of the sedimentary deposits or theelevation of contacts between sedimentary deposits. Like the geomorphic method, a correction may be needed toyield the actual elevation of the lake from the elevation of the sedimentary deposits. Adding approximately 4meters to the elevation of the contact between upper shoreface and lower shoreface deposits in a progradational ordepositional regression sequence is an example of using this technique. Although imprecise, the base of the uppershoreface (fair-weather wave-base) is about 4 meters below lake level (Fraser and Hester, 1977).
Often sedimentary deposits do not have a clear-cut relationship to lake level. Sequences of sedimentary deposits,however, may be used to determine whether lake level was rising or falling while the deposits were accumulating.An example of this stratigraphic approach is determining lake level behavior from a sequence of palustrine(swamp) deposits landward of a beach ridge, barrier beach, or spit (e.g., Fraser et al., 1990). If the sequenceindicates that the swale has become flooded through time and if a connection between the groundwater table andthe lake can be established, then one could interpret that lake level was rising and causing the groundwater tableto rise in the wetland. Regardless of which sedimentologic approach is used, both require a thorough understand-ing of facies characteristics within the myriad of coastal and paralic depositional environments that surround thelakes. Just as important, however, is a thorough understanding of how the entire depositional system behaves inresponse to lake level fluctuations.
Prior to the introduction of radiometric dating, the age of geomorphic features and sedimentary deposits wasestimated by using their relative position to each other and the lake proper. For geomorphic features, these includeelevation and distance landward from the modern shoreline. Elevation and distance landward can be also used forsedimentary deposits, but stratigraphic position and cross-cutting relationships are more useful. Relative position-ing is normally the first technique used in interpreting age relationships, producing a relative time scale. Radio-metric dating, commonly C14, has transformed the relative time scale into an “absolute” one. C14 dating of organicdeposits, however, is often opportunistic in that organic samples are dated when they are found. The age relation-ship between opportunistic organic deposits and a geomorphic feature or sedimentary deposit that can estimatelake level should be well known before it is dated.
Collecting Lake-Level Data in Lake Michigan
Beach ridges are shore-parallel ridges of sand that contain a core of water-laid sediment. They are formed in thefinal stages of a water-level rise in areas where there is a net positive supply of sediment to the nearshore system(Thompson and Baedke, 1995). They commonly occur in embayments as a series of ridges and wetland-filledswales — a strandplain. Strandplains may contain the most complete records of past lakelevel fluctuation ofcoastal and paralic features and deposits that surround Lake Michigan. Additionally, the beach ridges containforeshore (swash zone) deposits that accumulate at or very near lake level. Of particular interest is the gravelyplunge point at the base of the foreshore deposits (Figure 1). These sediments are the closest approximations ofactual lake level that can be obtained within the nearshore system. By collecting these sediments within astrandplain, the upper limit of lake level during the development of the strandplain can be determined. Anotheradvantage of studying strandplains is that the wetlands in the swales of beach ridges can be used to date the age ofthe ridges. That is, the age of the basal organic sediments in each wetland is a close approximation of the age ofthe ridge lakeward of each wetland. This relationship, however, is probably only valid where the strandplain hasan elevated groundwater table, possibly from ground water focusing into the strandplain from surroundinguplands.
Five strandplains, differing in dimension, orientation, sediment supply, wave climate, and geographic location,were studied in the Lake Michigan basin (Figure 2) (Thompson and Baedke, 1997). Foreshore deposits werecollected for most ridges by vibracoring the lakeward margin of each ridge. Foreshore deposits were identified bytheir grain-size characteristics and sedimentary structures. Their elevations were determined by leveling the coresites to the nearest 0.003 m, using the International Great Lakes Datum of 1985 (IGLD 1985) as a reference.

32
Where suitable, basal organic sediments were collected from swales between the ridges. These samples wereradiocarbon dated with a *C13 correction and calibrated to calendar years (Stuiver and Reimer, 1993). Five relativelake-level curves were created (Thompson and Baedke, 1997).
Beach ridges at the five sites developed at an average rate between 29 and 38 years/ridge (33 yr/ridge average). Apair-wise t-test indicates that none of the average timings of beach-ridge development are statistically differentthan each other. The similarity in average timing suggests a periodic, or more likely quasi-periodic, lake-levelfluctuation of about 33 years occurred in the Lake Michigan basin during the late Holocene (Thompson andBaedke, 1997). The five sites also contain groups of ridges that show a rise and fall in foreshore elevation acrossfour to six ridges (commonly five). These groups of ridges indicate another quasi-periodic lake-level fluctuation atbetween 120 and 190 years (~150 years). Both of these quasi-periodic fluctuations are superimposed on long-termlake-level change associated with water volume changes in the basin and isostatic rebound. When rebound isremoved from the five relative lake level curves and the data generalized using a Fast Fourier Transfer (FFT)smoothing, the resulting, “eustatic,” lake level curve shows the upper limit of late Holocene lake level for theLakes Michigan/Huron basin that was observed at the Port Huron outlet and, for a short period of time, theChicago outlet during the late Holocene (Figure 3).
The curve shows that lake level was very high 4,500 years ago. This high stage is often called the Nipissing IIphase of ancestral Lake Michigan. Between 4,500 and 3,500 years ago, lake level fell about 4.5 meters to an
Figure 1. Graphs of beach profile (upper) and grain size (lower) for Lake Street Beach in theIndiana Dunes National Lakeshore. The graphs show that the coarsest and most poorlysorted part of the nearshore are at the plunge point (base of the swash zone). Similarrelationships occur at all of the study areas. Note: Coarser sediments are more negative; andpoorly sorted sediments are more positive.

33
Figure 2. - Map of Lake Michigan showingareas studied (boxes). See Thompson andBaedke (1997) for detailed maps of each area.
elevation that is similar to the mean elevationof the historical record from 1819 to 1990.From 3,500 to the present, the upper limit oflake level reached elevations from .5 to 1 mabove and about .5 m below the historicalaverage. Two notable high phases occurredfrom 2,300 to 3,100 and from 1,100 to 1,900calendar years ago. The older high lake levelperiod corresponds to a lake level phaseknown as the Algoma phase of ancestral LakeMichigan. The younger high lake level periodis currently unnamed.
Pervasive in the curve from 3,100 to thepresent are the 150-year quasi-periodic lakelevel fluctuations. Although present in the rawdata, this fluctuation is not seen in the curveolder than 3,100 because the FFT smoothingcould not pick it out from the single data setthat defines this part of the graph. It is impor-tant to note that the most recent 150-yearfluctuation can be connected directly to thehistorical record, suggesting that the entire
historical record also represents one 150-year quasi-periodic fluctuation. It should be noted that Figure 3 does notshow the 30-year quasi-periodic fluctuations. The upper limits of these fluctuations are the points that define the150-year events. The 30-year fluctuations, however, are observable in the historical record for Lake Michigan.
References
Fraser, G.S., and N.C Hester. 1977. Sediments and sedimentary structures of a beach-ridge complex, southwesternshore of Lake Michigan, 47:1187-1200.
Fraser, G.S., C.E. Larsen, and N.C Hester. 1990. Climatic control of lake levels in Lake Michigan and LakeHuron basins. Geological Society of America, Special Paper 251, p. 75-89.

34
Goldthwait, J.W. 1908. A reconstruction of water planes of the extinct glacial lakes in the Lake Michigan basin.Journal of Geology 16: 459-476.
Johnson, T.C., R.D. Stieglitz, and A.M. Swain. 1990. Age and paleoclimatic significance of Lake Michigan beachridges at Baileys Harbor, Wisconsin. Geological Society of America, Special Paper 251, p. 67-74.
Leverett, F. 1897. Pleistocene features and deposits of the Chicago area. Chicago Academy of Arts and Sciences,Bulletin II, 87 p.
Lichter, J. 1995. Lake Michigan beach-ridge and dune development, lake level, and variability in regional waterbalance. Quaternary Research 44:181-189.
Petty, W.H., P.A. Delcourt, and H.R. Delcourt. 1996. Holocene lake-level fluctuations and beach-ridge develop-ment along the northern shore of Lake Michigan, USA. Journal of Paleolimnology 15:147-169.
Stiuver, M., and P.J. Reimer. 1993. Extended 14C data base and revised Calib 3.0 14C age calibration program.Radiocarbon 35:215-230.
Thompson, T.A., and S.J. Baedke. 1995. Beach-ridge development in Lake Michigan: shoreline behavior inresponse to quasi-periodic lake-level events. Marine Geology 129:163-174.
Thompson, T.A., and S.J. Baedke. 1997. Strandplain evidence for late Holocene lake-level variations in LakeMichigan. Geological Society of America, Bulletin 109:666-682.
Figure 3. A. Graph of late Holocene and historical lake level for Lake Michigan. Historical events, solar sunspotminimums, and an archeological timescale are plotted for comparison to the curve. B. Expansion of part of the lateHolocene lake level curve, showing the relationship of 150-year (dark red line) and 30-year quasi-periodic (light redline) fluctuations.
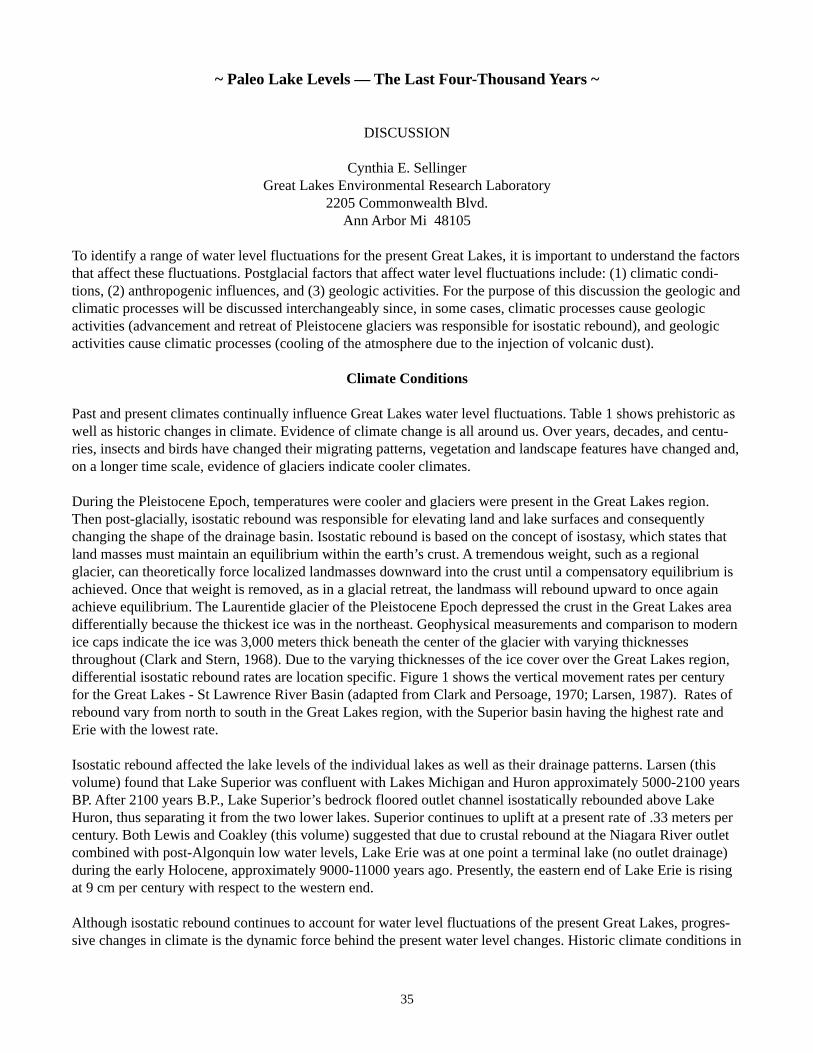
35
~ Paleo Lake Levels — The Last Four-Thousand Years ~
DISCUSSION
Cynthia E. SellingerGreat Lakes Environmental Research Laboratory
2205 Commonwealth Blvd.Ann Arbor Mi 48105
To identify a range of water level fluctuations for the present Great Lakes, it is important to understand the factorsthat affect these fluctuations. Postglacial factors that affect water level fluctuations include: (1) climatic condi-tions, (2) anthropogenic influences, and (3) geologic activities. For the purpose of this discussion the geologic andclimatic processes will be discussed interchangeably since, in some cases, climatic processes cause geologicactivities (advancement and retreat of Pleistocene glaciers was responsible for isostatic rebound), and geologicactivities cause climatic processes (cooling of the atmosphere due to the injection of volcanic dust).
Climate Conditions
Past and present climates continually influence Great Lakes water level fluctuations. Table 1 shows prehistoric aswell as historic changes in climate. Evidence of climate change is all around us. Over years, decades, and centu-ries, insects and birds have changed their migrating patterns, vegetation and landscape features have changed and,on a longer time scale, evidence of glaciers indicate cooler climates.
During the Pleistocene Epoch, temperatures were cooler and glaciers were present in the Great Lakes region.Then post-glacially, isostatic rebound was responsible for elevating land and lake surfaces and consequentlychanging the shape of the drainage basin. Isostatic rebound is based on the concept of isostasy, which states thatland masses must maintain an equilibrium within the earth’s crust. A tremendous weight, such as a regionalglacier, can theoretically force localized landmasses downward into the crust until a compensatory equilibrium isachieved. Once that weight is removed, as in a glacial retreat, the landmass will rebound upward to once againachieve equilibrium. The Laurentide glacier of the Pleistocene Epoch depressed the crust in the Great Lakes areadifferentially because the thickest ice was in the northeast. Geophysical measurements and comparison to modernice caps indicate the ice was 3,000 meters thick beneath the center of the glacier with varying thicknessesthroughout (Clark and Stern, 1968). Due to the varying thicknesses of the ice cover over the Great Lakes region,differential isostatic rebound rates are location specific. Figure 1 shows the vertical movement rates per centuryfor the Great Lakes - St Lawrence River Basin (adapted from Clark and Persoage, 1970; Larsen, 1987). Rates ofrebound vary from north to south in the Great Lakes region, with the Superior basin having the highest rate andErie with the lowest rate.
Isostatic rebound affected the lake levels of the individual lakes as well as their drainage patterns. Larsen (thisvolume) found that Lake Superior was confluent with Lakes Michigan and Huron approximately 5000-2100 yearsBP. After 2100 years B.P., Lake Superior’s bedrock floored outlet channel isostatically rebounded above LakeHuron, thus separating it from the two lower lakes. Superior continues to uplift at a present rate of .33 meters percentury. Both Lewis and Coakley (this volume) suggested that due to crustal rebound at the Niagara River outletcombined with post-Algonquin low water levels, Lake Erie was at one point a terminal lake (no outlet drainage)during the early Holocene, approximately 9000-11000 years ago. Presently, the eastern end of Lake Erie is risingat 9 cm per century with respect to the western end.
Although isostatic rebound continues to account for water level fluctuations of the present Great Lakes, progres-sive changes in climate is the dynamic force behind the present water level changes. Historic climate conditions in
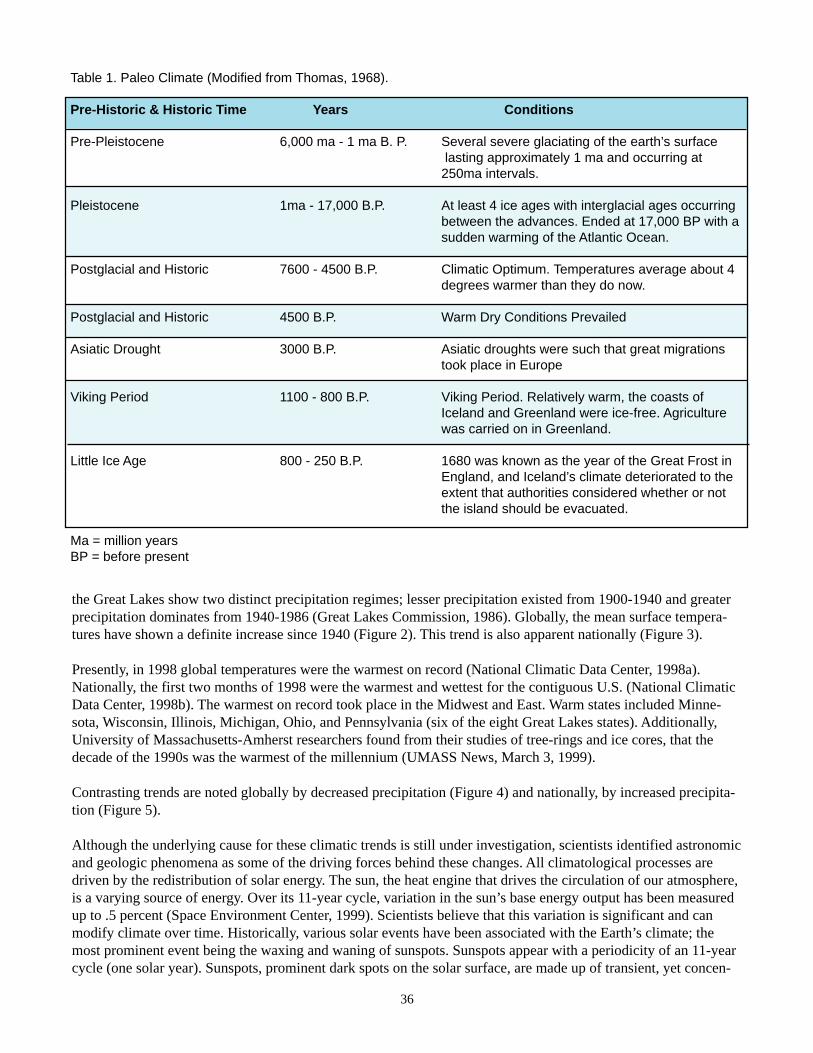
36
the Great Lakes show two distinct precipitation regimes; lesser precipitation existed from 1900-1940 and greaterprecipitation dominates from 1940-1986 (Great Lakes Commission, 1986). Globally, the mean surface tempera-tures have shown a definite increase since 1940 (Figure 2). This trend is also apparent nationally (Figure 3).
Presently, in 1998 global temperatures were the warmest on record (National Climatic Data Center, 1998a).Nationally, the first two months of 1998 were the warmest and wettest for the contiguous U.S. (National ClimaticData Center, 1998b). The warmest on record took place in the Midwest and East. Warm states included Minne-sota, Wisconsin, Illinois, Michigan, Ohio, and Pennsylvania (six of the eight Great Lakes states). Additionally,University of Massachusetts-Amherst researchers found from their studies of tree-rings and ice cores, that thedecade of the 1990s was the warmest of the millennium (UMASS News, March 3, 1999).
Contrasting trends are noted globally by decreased precipitation (Figure 4) and nationally, by increased precipita-tion (Figure 5).
Although the underlying cause for these climatic trends is still under investigation, scientists identified astronomicand geologic phenomena as some of the driving forces behind these changes. All climatological processes aredriven by the redistribution of solar energy. The sun, the heat engine that drives the circulation of our atmosphere,is a varying source of energy. Over its 11-year cycle, variation in the sun’s base energy output has been measuredup to .5 percent (Space Environment Center, 1999). Scientists believe that this variation is significant and canmodify climate over time. Historically, various solar events have been associated with the Earth’s climate; themost prominent event being the waxing and waning of sunspots. Sunspots appear with a periodicity of an 11-yearcycle (one solar year). Sunspots, prominent dark spots on the solar surface, are made up of transient, yet concen-
Table 1. Paleo Climate (Modified from Thomas, 1968).
Pre-Historic & Historic Time Years Conditions
Pre-Pleistocene 6,000 ma - 1 ma B. P. Several severe glaciating of the earth’s surface lasting approximately 1 ma and occurring at250ma intervals.
Pleistocene 1ma - 17,000 B.P. At least 4 ice ages with interglacial ages occurringbetween the advances. Ended at 17,000 BP with asudden warming of the Atlantic Ocean.
Postglacial and Historic 7600 - 4500 B.P. Climatic Optimum. Temperatures average about 4degrees warmer than they do now.
Postglacial and Historic 4500 B.P. Warm Dry Conditions Prevailed
Asiatic Drought 3000 B.P. Asiatic droughts were such that great migrationstook place in Europe
Viking Period 1100 - 800 B.P. Viking Period. Relatively warm, the coasts ofIceland and Greenland were ice-free. Agriculturewas carried on in Greenland.
Little Ice Age 800 - 250 B.P. 1680 was known as the year of the Great Frost inEngland, and Iceland’s climate deteriorated to theextent that authorities considered whether or notthe island should be evacuated.
Ma = million yearsBP = before present

37
Figure 1. Vertical movement rates per century for the Great Lakes-St. Lawrence River Basin (adapted from Clark andPersoage, 1970; Larsen, 1987). For example, Michipicoten,Ontario is rising relative to Chicago, IL at a rate of approxi-mately 535 mm (1.75 feet per 100 years.)
Figure 2. Annual Global Surface Mean Temperature Anomalies. NOAA, National Climatic Data Center (1999).

38
Figure 3. Annual U.S. Surface Mean Temperature Anomalies. NOAA, National Climatic Data Center (1999).
Figure 4. Annual Global Precipitation Anomalies. NOAA, National Climatic Data Center (1999).

39
trated magnetic fields. The amount of solar activities, such as solar flares and coronal mass ejections, whichintroduce massive amounts of solar materials into the solar system, are closely related to the typical number ofsunspots that are visible (The Regents of the University of Michigan, 1999). Although the solar cycle has beenquite regular for the last 300 years (Space Environment Center, 1999), in the 17th and 18th centuries there werefewer than average sunspots. This period coincides with “The Little Ice Age” in Europe. Alexander (1995) cited acorrelation between the deviations of the mean annual river flow and mean annual sunspot numbers. He suggeststhat the perturbations in solar activity affect the phenomena that control the extreme events of floods. Morner(1993) contributes global climate change in part to four sunspot minima that occurred in the last 500 years.Presently, the last solar maximum was in 1989; the next will be in the year 2000.
Redistribution of solar radiation isn’t only dependent on solar activity, but also the earth’s atmosphere. Theatmosphere shields us from solar radiation and variations in its transmissivity due to the relative presence orabsence of dust, carbon dioxide, vapor pressure, ozone, and clouds, has an effect on the earth’s climate. Forexample, in 1883, the eruption of the Krakatoa Volcano blanketed the upper atmosphere with volcanic dust andwas blamed for the cooler conditions of the 1800s. Additionally, the presence of carbon dioxide in the atmosphereprevents the loss of terrestrial radiation into space, causing a rise in overall temperatures (the greenhouse effect).
Overall, the Holocene has been warmer than the majority of the past million years (Eichenlaub, 1979). However,some think that this warm period may be an interglacial period. Although the Holocene was globally marked by awarming of the Atlantic Ocean, in the Great Lakes region, it was identified when westerly air masses from thePacific became more frequent, and July temperatures increased (Webb and Byron, 1972). The present climate ofthe Great Lakes is dominated by three air masses: maritime tropical (mT), maritime pacific (mP), and continentalpolar (cP), Figure 6.
Lewis (this volume) recently found that dry climates of the Holocene progressed eastward across the southernGreat Lakes basin, appearing in the Ontario basin as late as 2000 years ago. He explains these climatic phases aschanges in air mass circulation. Lewis further points out that the water balance is an important factor in thedrainage basin. He states that a negative water balance can switch a lake from an open overflowing system to aclosed one, driven by evaporation. For instance, Lewis indicates that the Lake Erie basin was closed in the early
Figure 5. Annual U.S. Total Precipitation Anomalies. NOAA, National Climatic Data Center (1999).

40
mid Holocene possibly due to no inflow from theupper lakes and high evaporation caused by a changein air mass circulation.
Larsen (this volume) attributes high and low prehis-toric levels of Lake Superior and Michigan tochanges in climate. Larsen cites periods of high levelsthat occurred about 1,100, 400, and 200 years agowith low level episodes about 650 and 350 years agowith a range of more than ±1.0 meter that is centeredabout a long term mean for Lakes Superior andMichigan. These high and low lake levels are furthercorrelated with weather related events. Larsen associ-
ates the “Little Ice Age” with the highs preceding historic record, and one major low period is associated with the“Medieval Warm Period” of northern Europe.
Larsen (1973) compared the Camp Century Climate Trend (Dansgaard et al., 1971) to 5-year mean Lakes Michi-gan-Huron water levels. Results of this comparison suggested a projected cooler period (associated with higherlake levels) to take place from 1983-1988. Since Lakes Michigan-Huron levels reached record highs for a fewmonths in 1986, this projection was quite accurate. Additionally, his results suggested lower lake levels by theyear 2015 when the air temperatures are projected to reach a thermal maximum.
From the above discussion it is apparent that not only does climate play an important role in lake level changes,but also the scale of climate fluctuations are equally important. Therefore, in order to predict a range in waterlevels for the next 100 years, it is not only important to take into consideration the recorded historic data, but it isequally important to interpret climate on the mesoscale (previous 4000 years) to identify the overall trends.Accomplishment of this task requires scientists to interpret non-traditional data such as tree-rings, buried reefs,and sunspots, to name a few.
Anthropogenic Changes
Although nature has had major effects on lake level fluctuations, humans have also made changes in the lakes’regime. Changes that increased runoff to the lakes range from the clear-cutting of the State of Michigan to theurbanization of the northern Lake Erie shoreline. Changes such as deepening the navigation channels of the St.Clair and Detroit Rivers were responsible for lowering Lakes Michigan-Huron by .18 meter (Derecki, 1985).Additional changes imposed due to diversions, irrigation, hydropower, and water level regulations must beconsidered in the overall water balance of the Great Lakes.
Water Level Fluctuations and Range
Considering the forces acting on fluctuating water levels, it seems difficult to attribute cyclical patterns to thesewater level variations. However, through various methods researchers have attempted to associate these patterns
Figure 6. Air massesaffecting the GreatLakes.

41
with atmospheric and solar events. Thompson (this volume) created a long-term record of these events in whichhe discovered water levels fluctuating at a 33-year interval that was superimposed on a 150-year interval. Thomp-son summarizes that lake levels are at the peak of the 150-year fluctuation and are headed back to a low period.Thompson estimated Lake Michigan’s water level range for the last 3500 years to be .5-1.0 meters above and .5meter below the historical average. Larsen (this volume) estimated fluctuations on Lake Superior for the last 2500years ranged from 1 to 1.5 meters. Lewis (this volume) said that Lake Ontario’s water levels fluctuated between 1and 2 meters for about 1000 years within the last 4000 years.
Future Research Needs
Paleo lake level research should be conducted on all Great Lakes to determine the physical limits and timing ofpast lake level fluctuations. It was agreed that there should be further research examining the relationship betweenlong term climatic patterns and paleo-lake levels, the following research topics were suggested:
● Look at past air-mass movements with respect to environmental changes. Instead of focusing on the North-South shift, look at the East-West shift in Great Lakes climate patterns.
● Generate lake level responses to climate change.● Develop global warming scenarios.● Identify the climatic regime for each lake.● Research submerged tree-stumps in the Straits of Mackinaw with respect to what they reveal about prehistoric
precipitation patterns.● Understand the ages of submerged reefs in Lake Superior.● Determine the effects of deforestation on lake levels.● Develop methods to accurately determine low lake levels.
Findings
● Evidence indicates that the range in historical water levels has been exceeded over the last 3000 years for bothLake Superior and Lakes Michigan-Huron.
● Paleo lake levels for Lakes Ontario and Erie are much harder to quantify but have probably varied around thehistorical range.
● The geologic record indicates runs of above average and below average lake levels with a quasi-periodicvariation around 150 years. There is some belief that we may be moving from the high end of the rangetowards the low end of the range.
● The research into Great Lakes paleo water levels is very productive and useful for water resource studies. Itshould be continued with high priority given to Lakes Superior and Michigan-Huron.
● There may be a significant correlation between longer-term atmospheric circulation patterns and lake levelfluctuations.
References
Alexander, W.J.R. 1995. Floods, droughts and climate change. S. Afr. Journal of Science/SUID-AFR. TYDSKRWET, 90,(8):403-408.
Clark, R.H., and N.P. Persoage. 1970. Some implications of crustal movement in engineering planning. CanadianJournal of Earth Sciences 7:628-633.
Clark, R.H., and C.W. Stern. 1968. Geological Evolution of North America, pp. 367-391. New York: The RonaldPress Company.

42
Dansgaard, W., S.J. Johensen, H.B. Clausen, and C.C. Langway, Jr. 1971. Climate record revealed by CampCentury Ice Core. In The Late Cenozoic Glacial Ages, K.K. Turekian (ed.), Yale Univ Press, New Haven.
Derecki, J.A. 1985. Effects of channel changes in the St. Clair River during the present century. Journal of GreatLakes Research 11(3):201-207.
Eichenlaub, V.L. 1979. Weather and Climate of the Great Lakes Region. The University of Notre Dame Press,Notre Dame, Indiana 46556, 335 p.
Great Lakes Commission, 1986. Water Level Changes—factors influencing the Great Lakes. Great Lakes Com-mission, 2200 Bonisteel Boulevard, Ann Arbor, Mi 48109.
Larsen, C.E. 1973. Prehistoric Levels of Lake Michigan-Huron: Their potential in shoreline planning. Proceedingsof the 1973 Shoreland Planning Conference, Lake Michigan Federation, Chicago, Illinois.
Larsen, C.E. 1987. Geological History of Glacial Lake Algonquin and the Upper Great Lakes, U.S. GeologicalSurvey Bulletin 180l, 36 p.
Morner, N.A. 1993. Global Change: The Last Millennia. Global and Planetary Change GPCHE4; 7(13):211-127.
National Climatic Data Center, 1998a. Climate Extremes of the Summer of 1998. Technical Report 98-03.
National Climatic Data Center, 1998b. The El Nino Winter. Technical Report 98-02.
Regents of the University of Michigan, 1999. Sun Spots. http://www.windows.umich.edu/cgi-bin/tour_def/sun/atmosphere/sunspots.html
Space Environment Center, 1999. A Primer on the Space Environment—Our Star, the Sun. National Oceanic andAtmospheric Administration, Department of Commerce. http://sec.noaa.gov/primer/primer.html
Thomas, M.K. 1968. Some notes on the climatic history of the Great Lakes Region. Society of Ontario, 99: 21-31.
UMAS News, March 3, 1999. 1998 Was Warmest Year of the Millennium. UMAS Climate Researchers Report.University of Massachusetts-Amherst. http://www.umass.edu/newsoffice/press/99/0303climate.html
Webb, T., and R.A. Bryson. 1972. Lake and postglacial climate change in the northern Midwest: Quantitativeestimates derived from fossil pollen spectra and multivariate statistical analysis. Quaternary Research 2(1972):70-115.

43
Ms. Anne ClitesGreat Lakes Environmental Research Laboratory2205 Commonwealth Blvd.Ann Arbor, MI 48105
Dr. John P. CoakleyEnvironment CanadaLakes Assessment and Restoration867 Lakeshore RoadPO Box 5050Burlington, OntarioCANADA L7R [email protected]
Dr. Phillip KeillorUniversity of Wisconsin-Madison Sea Grant1800 University AvenueMadison, WI [email protected]
Dr. Curtis LarsenU.S. Geological Survey12201 Sunrise Valley Drive, MS 955Reston, VA [email protected]
Dr. C.F.M. LewisGeological Survey of CanadaP.O. Box 1006Dartmouth, N.S.CANADA B2Y 4A2902 426 7738 voice902 426 4104 [email protected]@agc.bio.ns.ca
Ms. Joan PopeChief, Coastal Evaluation and Design BranchCoastal and Hydraulics LaboratoryU.S. Army Engineer Research and DevelopmentCenter3903 Halls Ferry Rd.Vicksburg, MS [email protected]
Dr. Frank QuinnGreat Lakes Environmental Research Laboratory2205 Commonwealth Blvd.Ann Arbor MI 48105
Ms. Cynthia SellingerGreat Lakes Environmental Research Laboratory2205 Commonwealth Blvd.Ann Arbor, MI 48105
Mr. Chuck Southam P.EngAEB-OR, WIDEnvironment CanadaP.O. Box 5050, 867 Lakeshore Rd.Burlington, Ontario, Canada L7R 4A6Phone: (905) 336-4955Fax: (905) [email protected]
Dr. Todd A. ThompsonIndiana Geological SurveyIndiana University611 North Walnut GroveBloomington, IN 47405812-855-4400 off (rolls to sec)812-855-5412 sec812-855-2862 faxmailto:[email protected]://www.indiana.edu/~igshttp://php.indiana.edu/~tthomps/
Dr. Douglas WilcoxUSGSGreat Lakes Science Center1451 Green Rd.Ann Arbor, MI [email protected]
Mr. Carl Woodruff, CELRE-EP-HWU.S. Army Corp of Engineers, Detroit DistrictGreat Lakes Hydraulics and Hydrology BranchP.0. Box 1027Detroit Michigan [email protected]
List of Attendees


![Easy paleo spaghetti recipe with tomato sauce [Paleo, Keto]](https://static.fdocuments.in/doc/165x107/58aa1fde1a28abff6b8b5931/easy-paleo-spaghetti-recipe-with-tomato-sauce-paleo-keto.jpg)