Probable maximum flood estimator for BC - British … · PROBABLE MAXIMUM FLOOD ESTIMATOR FOR...
41
PROBABLE MAXIMUM FLOOD ESTIMATOR FOR BRITISH COLUMBIA Prepared For: Agriculture and Agri-Foods Canada Agri-Environment Services Branch Prepared By: B. T. Abrahamson, P. Eng. Reviewed By: R. S. Pentland, Msc, P. Eng. ©HER MAJESTY THE QUEEN IN RIGHT OF CANADA (2010) as represented by the Minister of Agriculture and Agri-Food
Transcript of Probable maximum flood estimator for BC - British … · PROBABLE MAXIMUM FLOOD ESTIMATOR FOR...
PROBABLE MAXIMUM FLOOD
ESTIMATOR FOR
BRITISH COLUMBIA
Prepared For: Agriculture and Agri-Foods Canada Agri-Environment Services Branch
Prepared By: B. T. Abrahamson, P. Eng. Reviewed By: R. S. Pentland, Msc, P. Eng.
©HER MAJESTY THE QUEEN IN RIGHT OF CANADA (2010)as represented by the Minister of Agriculture and Agri-Food
EXECUTIVE SUMMARY
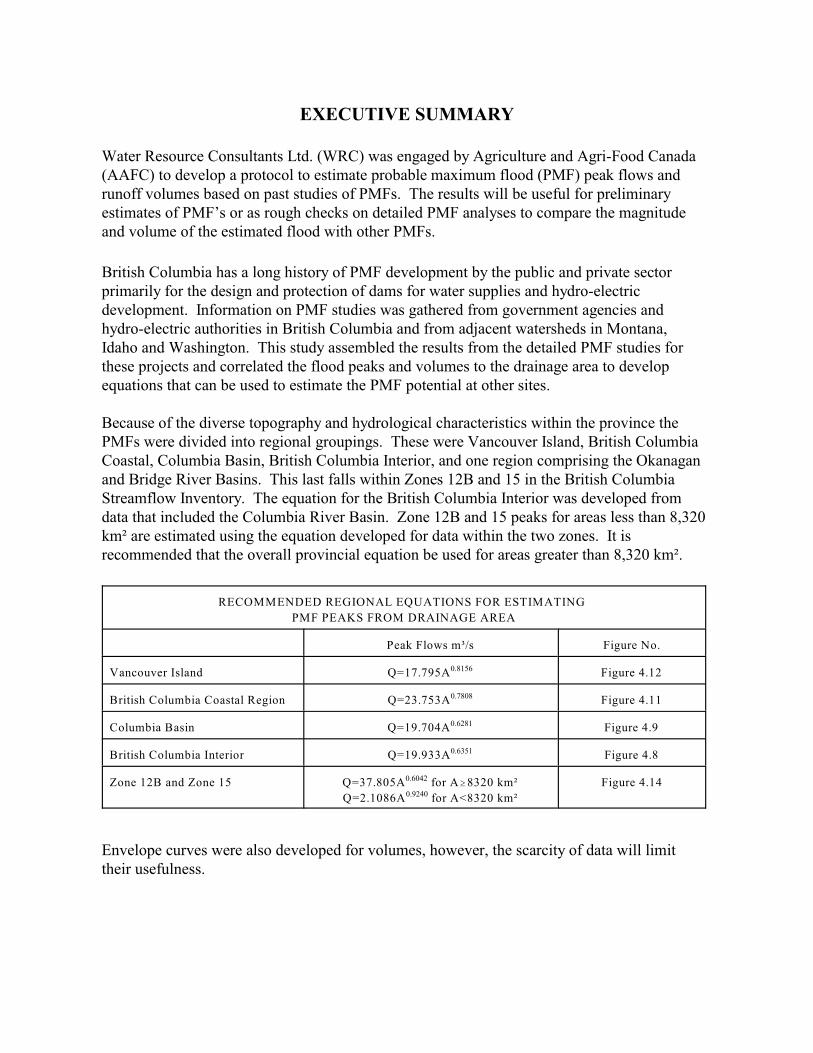
Water Resource Consultants Ltd. (WRC) was engaged by Agriculture and Agri-Food Canada(AAFC) to develop a protocol to estimate probable maximum flood (PMF) peak flows andrunoff volumes based on past studies of PMFs. The results will be useful for preliminaryestimates of PMF’s or as rough checks on detailed PMF analyses to compare the magnitudeand volume of the estimated flood with other PMFs.
British Columbia has a long history of PMF development by the public and private sectorprimarily for the design and protection of dams for water supplies and hydro-electricdevelopment. Information on PMF studies was gathered from government agencies andhydro-electric authorities in British Columbia and from adjacent watersheds in Montana,Idaho and Washington. This study assembled the results from the detailed PMF studies forthese projects and correlated the flood peaks and volumes to the drainage area to developequations that can be used to estimate the PMF potential at other sites.
Because of the diverse topography and hydrological characteristics within the province thePMFs were divided into regional groupings. These were Vancouver Island, British ColumbiaCoastal, Columbia Basin, British Columbia Interior, and one region comprising the Okanaganand Bridge River Basins. This last falls within Zones 12B and 15 in the British ColumbiaStreamflow Inventory. The equation for the British Columbia Interior was developed fromdata that included the Columbia River Basin. Zone 12B and 15 peaks for areas less than 8,320km² are estimated using the equation developed for data within the two zones. It isrecommended that the overall provincial equation be used for areas greater than 8,320 km².
RECOMMENDED REGIONAL EQUATIONS FOR ESTIMATING
PMF PEAKS FROM DRAINAGE AREA
Peak Flows m³/s Figure No.
Vancouver Island Q=17.795A Figure 4.120.8156
British Columbia Coastal Region Q=23.753A Figure 4.110.7808
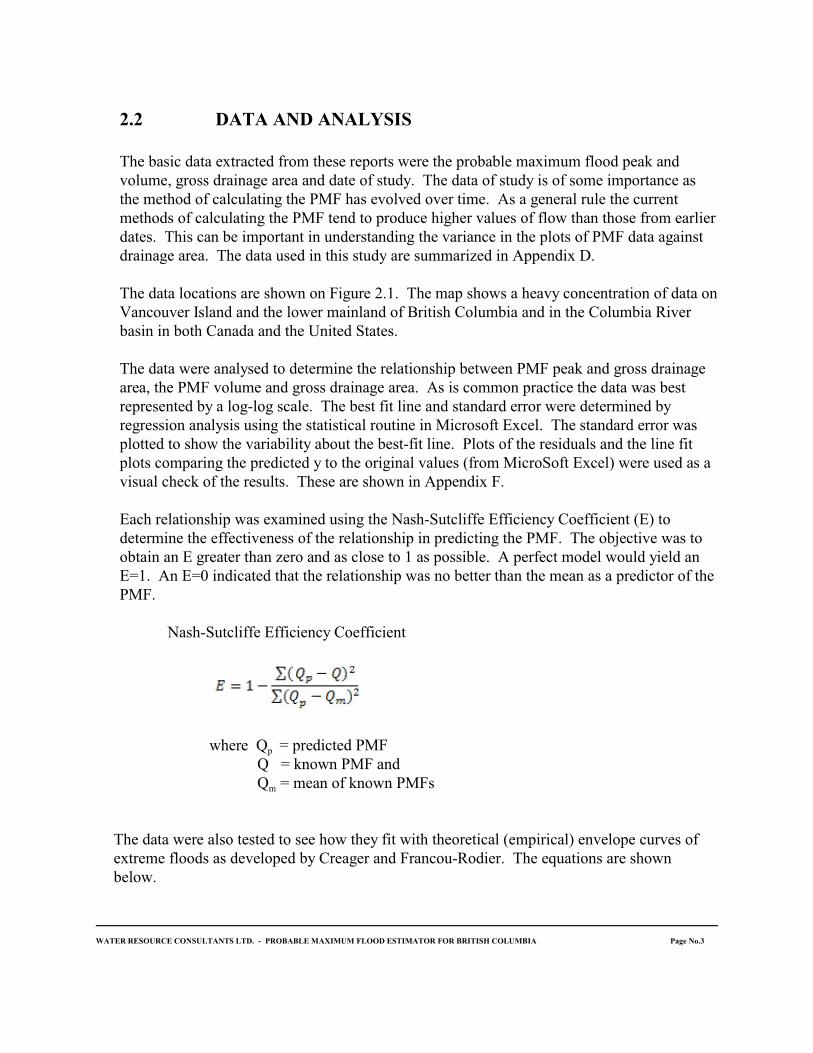
Columbia Basin Q=19.704A Figure 4.90.6281
British Columbia Interior Q=19.933A Figure 4.80.6351
Zone 12B and Zone 15 Q=37.805A for A$8320 km²0.6042
Q=2.1086A for A<8320 km²0.9240
Figure 4.14
Envelope curves were also developed for volumes, however, the scarcity of data will limittheir usefulness.

ACKNOWLEDGMENTS
This project could not have been completed without the contributions of information on probablemaximum floods from water resources agencies and hydroelectric corporations in British Columbia,Washington, Idaho and Montana namely BC Environment, BC Hydro, Avista Corporation, IdahoDepartment of Water Resources, Washington State Dam Safety, the US Army Corps of Engineers(USACE), and the US Bureau of Reclamation. Special thanks go to Will Jolly and colleagues forcoordinating input from British Columbia, for making available paper and electronic copies ofnumerous PMF studies in British Columbia, and for making contacts with state agencies inWashington, Idaho and Montana; to Terry Oswell, Graham Lang and staff at BC Hydro forextracting PMF data from BC Hydro Projects and providing the data to us; and to Steve Fry fromAvista Corporation, Martin Walther, Washington State Dam Safety, Bob Berger, Rob Romocki andRichard Hynes and colleagues with the US Army Corps of Engineers (USACE), and Larry Wolf,US Bureau of Reclamation for path finding and providing access to reports. We would also like tothank Ron Woodvine and Kirby Rietze, Agri Environmental Services Branch, Agriculture andAgriFood Canada for initiating this project.

TABLE OF CONTENTS:
1.0 INTRODUCTION. . . . . . . . . . . . . . . . . . . . . . . . . . . . . . . . . . . . . . . . . . . . . . . . . . . . 11.1 STUDY PURPOSE. . . . . . . . . . . . . . . . . . . . . . . . . . . . . . . . . . . . . . . . . . . . . 11.2 BACKGROUND. . . . . . . . . . . . . . . . . . . . . . . . . . . . . . . . . . . . . . . . . . . . . . . 1
2.0 STUDY METHOD. . . . . . . . . . . . . . . . . . . . . . . . . . . . . . . . . . . . . . . . . . . . . . . . . . . 22.1 GENERAL. . . . . . . . . . . . . . . . . . . . . . . . . . . . . . . . . . . . . . . . . . . . . . . . . . . . 22.2 DATA AND ANALYSIS. . . . . . . . . . . . . . . . . . . . . . . . . . . . . . . . . . . . . . . . 3
3.0 PROBABLE MAXIMUM FLOODS.. . . . . . . . . . . . . . . . . . . . . . . . . . . . . . . . . . . . . 63.1 PEAK FLOWS.. . . . . . . . . . . . . . . . . . . . . . . . . . . . . . . . . . . . . . . . . . . . . . . . 6
3.1.1 Organizing the PMF Data. . . . . . . . . . . . . . . . . . . . . . . . . . . . . . . . . . 63.1.2 Selection of PMFs (Best Fit and Standard Error
For Unit PMF and PMF Peaks). . . . . . . . . . . . . . . . . . . . . . . . . . . . . 63.1.3 Extension of Data Set.. . . . . . . . . . . . . . . . . . . . . . . . . . . . . . . . . . . . 10
3.2 COMPARISON TO OTHER STUDIES. . . . . . . . . . . . . . . . . . . . . . . . . . . . 133.2.1 Probable Maximum Flood Estimator for the
Canadian Prairies (2009).. . . . . . . . . . . . . . . . . . . . . . . . . . . . . . . . . 133.2.2 Comparison to Empirical Extreme Flood Curves. . . . . . . . . . . . . . . 14
3.3 PMF VOLUMES. . . . . . . . . . . . . . . . . . . . . . . . . . . . . . . . . . . . . . . . . . . . . . 15
4.0 REGIONALISATION. . . . . . . . . . . . . . . . . . . . . . . . . . . . . . . . . . . . . . . . . . . . . . . . 184.1 REGIONAL SCAN. . . . . . . . . . . . . . . . . . . . . . . . . . . . . . . . . . . . . . . . . . . . 184.2 CONSOLIDATED REGIONS.. . . . . . . . . . . . . . . . . . . . . . . . . . . . . . . . . . . 204.3 FURTHER ANALYSIS OF PMFs IN ZONE 12B. . . . . . . . . . . . . . . . . . . . 204.4 IMPACT OF VARIABILITY IN PROBABLE MAXIMUM
PRECIPITATION (PMP). . . . . . . . . . . . . . . . . . . . . . . . . . . . . . . . . . . . . . . 274.5 REGULATED PMFs IN THE COLUMBIA RIVER BASIN. . . . . . . . . . . . 29
5.0 DISCUSSION AND CONCLUSIONS. . . . . . . . . . . . . . . . . . . . . . . . . . . . . . . . . . . 315.1 GEOGRAPHIC LIMITS. . . . . . . . . . . . . . . . . . . . . . . . . . . . . . . . . . . . . . . . 315.2 REGIONALIZATION. . . . . . . . . . . . . . . . . . . . . . . . . . . . . . . . . . . . . . . . . . 315.3 PREDICTION EFFICIENCIES. . . . . . . . . . . . . . . . . . . . . . . . . . . . . . . . . . . 325.4 VARIABILITY IN PROBABLE MAXIMUM
PRECIPITATION (PMP). . . . . . . . . . . . . . . . . . . . . . . . . . . . . . . . . . . . . . . 335.5 COMPARISON TO PREVIOUS STUDIES. . . . . . . . . . . . . . . . . . . . . . . . . 335.6 EMPIRICAL RELATIONSHIPS.. . . . . . . . . . . . . . . . . . . . . . . . . . . . . . . . . 345.7 CONCLUSIONS. . . . . . . . . . . . . . . . . . . . . . . . . . . . . . . . . . . . . . . . . . . . . . 34
6.0 RECOMMENDATIONS. . . . . . . . . . . . . . . . . . . . . . . . . . . . . . . . . . . . . . . . . . . . . . 35
APPENDICES in electronic format on attached CD

LIST OF FIGURES:
Figure 2.1 Location of Probable Maximum Floods. . . . . . . . . . . . . . . . . . . . . . . . . . . . . 4
Figure 3.1 Unit PMF vs Drainage Area - Using Instantaneous Data. . . . . . . . . . . . . . . . 7Figure 3.2 Hyrological Zones. . . . . . . . . . . . . . . . . . . . . . . . . . . . . . . . . . . . . . . . . . . . . . 8Figure 3.3 Unit PMF Peak vs Drainage Area for Locations with Minimum
Upstream Regulations. . . . . . . . . . . . . . . . . . . . . . . . . . . . . . . . . . . . . . . . . . . 9Figure 3.4 Relationship Between 6 Hour and 1 Hour PMFs.. . . . . . . . . . . . . . . . . . . . . 11Figure 3.5 Relationship Between 24 Hour and 1 Hour PMF Peaks. . . . . . . . . . . . . . . . 11Figure 3.6 Unit PMF Peak vs Drainage Area. . . . . . . . . . . . . . . . . . . . . . . . . . . . . . . . . 12Figure 3.7 PMF Peak vs Drainage Area Using Extended Data Set.. . . . . . . . . . . . . . . . 12Figure 3.8 Comparison of BC PMFs with Mountain Fed Prairie PMFs. . . . . . . . . . . . . 13Figure 3.9 Unit PMP vs Drainage Area Showing Creager Envelope Curves. . . . . . . . . 14Figure 3.10 Comparison of BC PMF Peaks with Francou-Rodier Envelope Curves. . . . 15Figure 3.11 Unit PMF Volume vs Drainage Area.. . . . . . . . . . . . . . . . . . . . . . . . . . . . . . 17Figure 3.12 PMF Volume vs Drainage Area.. . . . . . . . . . . . . . . . . . . . . . . . . . . . . . . . . . 17
Figure 4.1 PMF vs Area Showing Possible Regional Groupings. . . . . . . . . . . . . . . . . . 19Figure 4.2 Consolidated Regional Grouping of PMF Peaks. . . . . . . . . . . . . . . . . . . . . . 19Figure 4.3 Regional Groupings of PMF Data for Columbia Basin & BC Interior. . . . . 21Figure 4.4 Regional Grouping of PMF Data for Columbia Basin. . . . . . . . . . . . . . . . . 21Figure 4.5 Regional Grouping of Unit PMF Data for BC Coastal Region Including
Vancouver Island/NW Washington. . . . . . . . . . . . . . . . . . . . . . . . . . . . . . . . 22Figure 4.6 Regional Grouping of Unit PMF for BC Coastal Region. . . . . . . . . . . . . . . 22Figure 4.7 Unit PMF vs Drainage Area for Vancouver Island. . . . . . . . . . . . . . . . . . . . 23Figure 4.8 PMF Peak vs Drainage Area for Columbia Basin/BC Interior. . . . . . . . . . . 23Figure 4.9 PMF Peak vs Drainage Area - Columbia Basin.. . . . . . . . . . . . . . . . . . . . . . 24Figure 4.10 PMF Peak vs Drainage Area - BC Coastal Region Including Vancouver
Island/NW Washington. . . . . . . . . . . . . . . . . . . . . . . . . . . . . . . . . . . . . . . . . 24Figure 4.11 PMF Peak vs Drainage Area - BC Coastal Region. . . . . . . . . . . . . . . . . . . . 25Figure 4.12 PMF Peak vs Drainage Area for Vancouver Island. . . . . . . . . . . . . . . . . . . . 25Figure 4.13 Unit PMF vs Drainage Area Zones 12B and 15. . . . . . . . . . . . . . . . . . . . . . 26Figure 4.14 PMF Peak vs Drainage Area Zones 12B and 15 Shown with Envelope Curves
for All of BC. . . . . . . . . . . . . . . . . . . . . . . . . . . . . . . . . . . . . . . . . . . . . . . . . 26Figure 4.15 PMF Peak vs Drainage Area - Zones 12B & 15 Shown with Envelope Curves
for the Columbia/BC Interior.. . . . . . . . . . . . . . . . . . . . . . . . . . . . . . . . . . . . 28Figure 4.16 PMF vs Drainage Area with 24 Hour PMP for Selected Watersheds in the
Coastal, Island & Bridge River Regions. . . . . . . . . . . . . . . . . . . . . . . . . . . . 28Figure 4.17 Unit PMF vs Drainage Area for Locations in the Columbia River Basin with
Upstream Regulation. . . . . . . . . . . . . . . . . . . . . . . . . . . . . . . . . . . . . . . . . . . 30Figure 4.18 PMF Peak vs Drainage Area for Locations in the Columbia River Basin With
Upstream Regulation. . . . . . . . . . . . . . . . . . . . . . . . . . . . . . . . . . . . . . . . . . . 30

LIST OF TABLES:
Table 5.1 Efficiency in Predicting Probable Maximum flows from Drainage Area UsingRegression Equations.. . . . . . . . . . . . . . . . . . . . . . . . . . . . . . . . . . . . . . . . . . 32
Table 6.1 Recommended Regional Equations for Estimating PMP Peaks from DrainageArea. . . . . . . . . . . . . . . . . . . . . . . . . . . . . . . . . . . . . . . . . . . . . . . . . . . . . . . . 35

1.0 INTRODUCTION
1.1 STUDY PURPOSE
Water Resource Consultants Ltd. (WRC) has been engaged by Agriculture and Agri-FoodCanada (AAFC) to develop a protocol to estimate Probable Maximum Food (PMF) peakflows and runoff volumes for streams in British Columbia. Appendix A is the study Termsof Reference.
1.2 BACKGROUND
Envelope curves of PMF peak flows and runoff volumes have proven useful over the yearsfor preliminary estimates of PMFs or as rough checks on detailed PMF analyses to comparethe magnitude and volume of the estimated flood with other PMFs.
British Columbia has a long history of PMF development. A record of PMFs provided byBC Hydro for this project contains data from 1964 to 2005. The literature gathered for thestudy included data from reports that were prepared as recently as 2009.
The procedure for the development of the PMF has changed considerably over that time. Current practice utilizes sophisticated analyses of atmospheric physics to determine thelargest storm or probable maximum precipitation (PMP) that could occur in a particularbasin. This storm is applied to a dynamic rainfall-runoff model which simulates a runoff andstream flow. Earlier methods were less deterministic.
Despite the more sophisticated and standardized procedures, considerable variability can stillexist between estimated PMFs. For example the hydrologist completing the PMF study mustmake judgements regarding the criteria for antecedent conditions such as initial soil moisture,storage in existing reservoirs, and the relative contribution from rainfall and snow melt, andin the calibration of the runoff model.
An examination of PMFs in Alberta conducted by Alberta Environment in 2008 concludedthat there was no standard for the development of the PMF other than the generally acceptedprocess of using PMP and a runoff model which can simulate flow in the various regions ofthe catchment and route it through the stream network to the required location of the PMFestimate.
WATER RESOURCE CONSULTANTS LTD. - PROBABLE MAXIMUM FLOOD ESTIMATOR FOR BRITISH COLUMBIA Page No.1

2.0 STUDY METHOD
2.1 GENERAL
The basic procedure was to:
1) gather together information on the PMF studies that have been done in BritishColumbia as well as those in the northwestern region of the United States,namely Idaho, Montana and Washington;
2) extract data on PMFs including peak, volume, drainage areas and otherpertinent data for each study;
3) assemble the information into a data base for use in subsequent analysis;
4) calculate the unit PMF peak and unit volume for each location;
5) arrange the data by regions with similar geographic and hydrologiccharacteristics for analysis at the regional level;
6) for each region and the province as a whole, plot the unit values againstdrainage area and determine the best fit line through the data using regressionanalysis;
7) develop the standard error for each regression relationship;
8) compare plots of peak flow to relationships developed for the Canadianprairies in a previous study, and to empirical relationships using the Creagerand Francou-Rodier formulae; and
9) select the most suitable relationships for use in estimating PMFs in BritishColumbia.
Agencies responsible for dams in British Columbia and in the northwest Pacific region of theUnited States (Washington, Idaho and Montana) were contacted to gather information aboutPMFs in their jurisdiction. These were generally government agencies (provincial, state andfederal) and hydroelectric authorities. A sample of the initial letter of request to each of theseagencies is given in Appendix B. Additional information was gathered through an Internetsearch. A list of reports referenced is given in Appendix C.
WATER RESOURCE CONSULTANTS LTD. - PROBABLE MAXIMUM FLOOD ESTIMATOR FOR BRITISH COLUMBIA Page No.2
2.2 DATA AND ANALYSIS
The basic data extracted from these reports were the probable maximum flood peak andvolume, gross drainage area and date of study. The data of study is of some importance asthe method of calculating the PMF has evolved over time. As a general rule the currentmethods of calculating the PMF tend to produce higher values of flow than those from earlierdates. This can be important in understanding the variance in the plots of PMF data againstdrainage area. The data used in this study are summarized in Appendix D.
The data locations are shown on Figure 2.1. The map shows a heavy concentration of data onVancouver Island and the lower mainland of British Columbia and in the Columbia Riverbasin in both Canada and the United States.
The data were analysed to determine the relationship between PMF peak and gross drainagearea, the PMF volume and gross drainage area. As is common practice the data was bestrepresented by a log-log scale. The best fit line and standard error were determined byregression analysis using the statistical routine in Microsoft Excel. The standard error wasplotted to show the variability about the best-fit line. Plots of the residuals and the line fitplots comparing the predicted y to the original values (from MicroSoft Excel) were used as avisual check of the results. These are shown in Appendix F.
Each relationship was examined using the Nash-Sutcliffe Efficiency Coefficient (E) todetermine the effectiveness of the relationship in predicting the PMF. The objective was toobtain an E greater than zero and as close to 1 as possible. A perfect model would yield anE=1. An E=0 indicated that the relationship was no better than the mean as a predictor of thePMF.
Nash-Sutcliffe Efficiency Coefficient
p where Q = predicted PMFQ = known PMF and
mQ = mean of known PMFs
The data were also tested to see how they fit with theoretical (empirical) envelope curves ofextreme floods as developed by Creager and Francou-Rodier. The equations are shownbelow.
WATER RESOURCE CONSULTANTS LTD. - PROBABLE MAXIMUM FLOOD ESTIMATOR FOR BRITISH COLUMBIA Page No.3

WATER RESOURCE CONSULTANTS LTD. - PROBABLE MAXIMUM FLOOD ESTIMATOR FOR BRITISH COLUMBIA Page No.4

Creager Equation
where Q = Peak flow in ft³/sec A = Drainage area in mi² C = Creager’s coefficient
Francou-Rodier Equation
where Q = Peak flow in m³/sec A = Drainage area in km² K = coefficient based on the slope of the line
WATER RESOURCE CONSULTANTS LTD. - PROBABLE MAXIMUM FLOOD ESTIMATOR FOR BRITISH COLUMBIA Page No.5

3.0 PROBABLE MAXIMUM FLOODS
3.1 PEAK FLOWS
3.1.1 Organizing the PMF Data
The data gathered for this project included instantaneous, one hour, six hour and 24 hour(mean daily) flood peaks. The data set also includes peaks from sites with substantialupstream controls such as the Columbian River Basin in Canada and the United States, andsome of the water supply and hydro-electric dams on Vancouver Island and the lowermainland of British Columbia.
To facilitate the subsequent analysis it was necessary to take all of these PMFs and developthem into a database with reasonably similar characteristics, preferably one withinstantaneous peak flows with minimum influence from upstream controls.
Organizing the database was conducted in three steps: 1) develop a basic data set with acommon time unit for the PMF analysis i.e. instantaneous or mean daily, 2) separate the datainto regulated and unregulated PMFs; and 3) sort the data into regional subsets. This last stepalso involved examining the data set for anomalies (outliers) which could be explained byregional differences.
3.1.2 Selection of PMFs (Best Fit and Standard Error for Unit PMF and PMF Peaks)
The instantaneous peaks were selected as the basic data set for analysis. For the purposes ofthis study instantaneous and one hour were assumed to be the same. Where reports did notspecify the duration of the PMF, it was assumed that the peaks were instantaneous. Wherepossible this was verified by examination of the plotted hydrographs.
Figure 3.1 shows the unsorted probable maximum flood (PMF) data for all locationsexpressed in m³/s/km² plotted against drainage area in km². A regression analysis wasperformed on the data to determine the best fit relationship between the unit PMF and thetotal area, and to determine the Standard Error. The R² value was 0.744 for the unadjusteddata set. This provided the base against which subsequent improvements to the data set couldbe measured.
Examination of Outliers - Figure 3.1 shows several outliers that are fairly extreme. There areseveral possible reasons for this such as the selection of method used to determine the PMF
WATER RESOURCE CONSULTANTS LTD. - PROBABLE MAXIMUM FLOOD ESTIMATOR FOR BRITISH COLUMBIA Page No.6

or the influence of natural factors such as topography and or regional climate variation. An examination of the reports did not uncover any specific problems with the methodology.
Four of the most extreme outliers are in the Okanagan in the area corresponding toHydrologic Zone 12B in British Columbia’s Streamflow Inventory (See Figure 3.2). TheOkanagan Valley is in a zone of lower precipitation, having the lowest rainfall in the provincefor durations of 24 hours or less as shown in the Rainfall Frequency Atlas of Canada. Whileit is beyond the scope of this study to do a detailed analysis of the outliers, it seemedreasonable to remove these outliers on the assumption that the relationship was influenced byregional climatic factors.
Two of the Zone 12B PMFs fit within the lower boundary of the standard error of the best fitline for the overall data set. Perhaps this is because they are in the more northern portion ofHydrologic Zone 12B. However, as there was no clear-cut way of differentiating these PMFsfrom the other four, it was decided to remove all six Zone 12B PMFs from the data set.Removing these data increased the coefficient of determination to R² = 0.886.
Removing the impacts of regulation on the PMF - The study required a data set that wasrelatively free from influences of upstream control structures. Information from a studyconducted for Brilliant Creek Dam on the Kootenay River estimated that upstream regulationreduced the PMF at that location by 68 percent of what would have occurred without
WATER RESOURCE CONSULTANTS LTD. - PROBABLE MAXIMUM FLOOD ESTIMATOR FOR BRITISH COLUMBIA Page No.7

FIGURE 3.2 HYDROLOGICAL ZONES
WATER RESOURCE CONSULTANTS LTD. - PROBABLE MAXIMUM FLOOD ESTIMATOR FOR BRITISH COLUMBIA Page No.8

regulation. The amount of reduction would differ for each location depending upon theportion of the basin controlled and the type and volume of the control. The next step thenwas to separate the PMFs from watersheds with substantial regulation from those that werefelt to be minimally influenced by upstream regulation.
The study reports were examined to determine if upstream controls existed and to what extentthey might influence the PMF. As well each PMF site was located on Google Earth and thearea upstream examined for control structures. Only those with major upstream works weredeemed to be “regulated”. Dams on the Columbia River system, except for those in theheadwaters, would fall into this category. PMF sites on watersheds with run-of-the riverdams, dams controlling a small portion of the area, and other small storage projects weredesignated as having “minimum regulation”.
Following these criteria the data were sorted into two groups; one for basins with only minorinfluence from upstream controls, and the second for those known to be substantiallyinfluenced by upstream storage. Data from the regulated basins were discarded leavinginstantaneous PMFs for basins with no or minor regulation as the principal data set.
Several (10) data points for the Columbia River basin in Canada and the United States wereremoved from the data set. These are shown in green in Figure 3.1. It should be noted thatremoval of these PMFs reduced the R² to 0.86 reflecting the influence of removing a large clustering of data with similar characteristics on the regression analysis.
WATER RESOURCE CONSULTANTS LTD. - PROBABLE MAXIMUM FLOOD ESTIMATOR FOR BRITISH COLUMBIA Page No.9

Fraser River - The data set contained a PMF for the Fraser River at Mission, BritishColumbia which has the largest drainage area in the data set (228,000 km²). The Fraser River does have some upstream controls, the largest being the Kenny Dam on the Nechako River. The Kenny Dam controls about 6 percent of the drainage area. As well the hydroelectricprojects on the Bridge and Stave River systems, located on the lower portion of the basin,control another 2 to 3 percent of the area. Given the overall size of the basin it was felt thatthese structures would not have a major influence on the PMF.
Regression analyses were undertaken on the unregulated data set with and without the FraserRiver PMF to determine the effect of the Fraser River on the relationship between PMF anddrainage area. The coefficient of determination was slightly higher when the Fraser RiverPMF was included. It was therefore concluded that for the purpose of this study the FraserRiver PMF would be included in the data set with minimum upstream regulation.
A basic data set comprising 33 PMFs was then assembled from the instantaneous and onehour peak data for those stations having minimum effects from upstream regulation. Thedata sets used subsequently in this report are sites with minimum regulation. These data andthe best-fit regression line are shown on Figure 3.3. There is a reasonably good fit betweenthe unit runoff (q) and the watershed area. The R² value is 0.846. More data points would bepreferred if the data is to support the development of regional relationships as that woulddivide the data set into smaller sets which would have less statistical validity.
3.1.3 Extension of Data Set
The data set was increased to 46 stations using the six hour and 24 hour data. The primarysource of this information was the data provided by BC Hydro. Relationships weredeveloped between the one hour PMF and the six hour and 24 hours PMFs for those projectswith overlapping data. These are shown in Figures 3.4 and 3.5. Although there were veryfew points there was a very good relationship between the one hour PMFs and the six and 24hour PMFs with R² values of close to 1.0 (0.999). This provided a means of estimating theinstantaneous or one hour peak based on the reported six or 24 hour values. The process wasto first fill the missing data points using the six hour data. One hour peaks were estimated byapplying the power relationship in Figure 3.4 to the six hour peaks. (The linear relationshipwould have produced similar results.) The 24 hour data were then used to fill the remainingpoints as shown on Figure 3.5. The extended data set is listed in Appendix E.
The resulting data sets were compared to the original unregulated data set by comparing R²values for each set. The R² was reduced slightly to 0.836 but essentially unchanged. However, a longer data set would provide additional points for use in regionalisation. A plotof unit PMF versus area using the extended data set is shown in Figure 3.6. Similarly PMFpeaks for the extended data set were plotted against drainage area in Figure 3.7.
WATER RESOURCE CONSULTANTS LTD. - PROBABLE MAXIMUM FLOOD ESTIMATOR FOR BRITISH COLUMBIA Page No.10

WATER RESOURCE CONSULTANTS LTD. - PROBABLE MAXIMUM FLOOD ESTIMATOR FOR BRITISH COLUMBIA Page No.11

WATER RESOURCE CONSULTANTS LTD. - PROBABLE MAXIMUM FLOOD ESTIMATOR FOR BRITISH COLUMBIA Page No.12

3.2 COMPARISON TO OTHER STUDIES
3.2.1 Probable Maximum Flood Estimator for the Canadian Prairies (2009)
A study of probable maximum flood peaks for the Canadian prairies, completed in 2009,developed curves showing the relationships between the unit PMF and drainage area forMountain fed and Prairie streams. These curves have been superimposed on a plot of theBritish Columbia data as shown on Figure 3.8. The Prairie curves have a much steeper slopethan the British Columbia curve. The Mountain fed curve is closer to the British Columbiacurve although still with a slightly steeper slope.
The Prairie region curves are higher for the small drainage areas reflecting the influence ofconvective storms. The flatter slope for the Mountain-fed curve is partially attributable to theattenuation of flood peaks in the larger basins of the Saskatchewan River system which is dueto floods originating in the mountains and flowing across a large area with very little inflow. This results in a low unit yield over a very large drainage area. It is interesting to note thatthe point for the Fraser River at Mission falls close to the Mountain fed line suggesting asimilar attenuation due to the distance between the source and the study location, and therelative timing of peaks in the lower and upper parts of the basin. Since the British Columbiadata and the Mountain fed data originate from the same mountain range the similarity is notsurprising.
WATER RESOURCE CONSULTANTS LTD. - PROBABLE MAXIMUM FLOOD ESTIMATOR FOR BRITISH COLUMBIA Page No.13

3.2.2 Comparison to Empirical Extreme Flood Curves
Two empirical relationships were considered: Creager and Francou-Rodier. The Creagerenvelope curve is commonly used as a check on PMFs in Canada. The Francou-Roudiermethod is not commonly used in Canada, however, it was noted by one of the contributors tothis study. For that reason it was included for a brief look at how it might apply to PMFs inBritish Columbia. The envelope curves for both methods where superimposed upon the dataand compared to the best fit regression line developed in this study. Comparisons using bothmethods are discussed in the following paragraphs.
Creager - The shape of the Creager curve showed a good relationship with the BritishColumbia data. As shown in Figure 3.9, the Creager equation with C = 70 provides areasonable approximation of the upper boundary while C = 20 approximates the lowerboundary.
A best fit Creager curve with C = 37.7 was determined using least squares analysis. TheCreager formula with C = 37.7 was then used to estimate the PMF peaks for each of theareas. The efficiency in predicting the peak flow was quite high with a Nash-Sutcliffe
WATER RESOURCE CONSULTANTS LTD. - PROBABLE MAXIMUM FLOOD ESTIMATOR FOR BRITISH COLUMBIA Page No.14

efficiency coefficient of 0.75. While this is very good it is less than that using the log-logregional relationships discussed later in this report.
Francou-Rodier - The literature gives the Francou-Rodier equation as Q/10 =[A/10 ]6 8 1-0.1k
where Q is the PMF and A is the corresponding watershed area. K=tan(1-a) where arepresents the slope of the line when plotted on log-log scale. K varies from 0 to 6 with 6being the “world maximum” for extreme events. Figure 3.10 shows plots of the Francou-Rodier superimposed on a plot of the British Columbia data for PMF peaks. For the BritishColumbia data the k is between 4 and 5. The Francou-Rodier curves do not fit the data aswell as the Creager curves and are steeper than the best fit lines developed for this study.
It should be noted that both empirical methods were developed using recorded extremes. TheCreager curves, however, are commonly used as a check of PMF data. PMF data generallyfits well within the range covered by the Creager equation.
3.3 PMF VOLUMES
There were very few data points available for PMF volumes which precludes doing a regionalanalysis. Some data were available in the information provided by BC Hydro and in thereports provided by the BC Ministry of the Environment. With so few data points the
WATER RESOURCE CONSULTANTS LTD. - PROBABLE MAXIMUM FLOOD ESTIMATOR FOR BRITISH COLUMBIA Page No.15

analysis was limited to examining the relationship between PMF volume and drainage areaon a provincial basis.
Figure 3.11 shows the unit runoff volume versus drainage area. The slope is much flatterthan for peaks showing a slight reduction in unit volume as the area increases. The verysmall R² value shows a weak statistical relationship.
In a regression analysis on a small number of points one outlier can exert considerableinfluence on the results. Such is the case with the PMF volume for Jump River (VancouverIsland) shown on Figure 3.11. Removal of this point would increase the R² value to 0.54,however, there is no obvious physical justification for doing so.
Figure 3.12 shows the total volume versus area, providing a simple basis for estimatingvolume from drainage area. The apparent high R² value is somewhat misleading because, ineffect, this relationship correlates drainage area against drainage area multiplied by a unitrunoff. Since the unit runoff is almost constant, the equation is almost area versus area.
It was also observed that the conditions producing each PMF were quite different whichwould likely influence the relationship with drainage area, particularly for the small sampleavailable for this study. For example the Fulton Dam PMF volume (1,563,000 dam ) was3
derived from the 1:100 year 24-hour spring rain storm combined with the ProbableMaximum Snow Accumulation (PMSA). The PMSA was assumed to produce the 1:10,000year snowmelt which accounted for almost 95% of the total runoff. On the other extreme, thePMF for Stamp River was calculated using the 96-hour fall PMP event with no snowmelt. The 96-hour PMP was 907 mm compared to the 24-hour PMP of 366 mm. Other sites hadvarying combinations of rainfall and snowmelt.
Additional data would be required to provide useable volume relationships. As can be seenlater in this report in the examination of PMF peaks the regional relationships alloutperformed the province wide relationship in predicting peaks. It would be reasonable toassume that the same would hold for PMF volumes if more data was available.
WATER RESOURCE CONSULTANTS LTD. - PROBABLE MAXIMUM FLOOD ESTIMATOR FOR BRITISH COLUMBIA Page No.16

WATER RESOURCE CONSULTANTS LTD. - PROBABLE MAXIMUM FLOOD ESTIMATOR FOR BRITISH COLUMBIA Page No.17

4.0 REGIONALISATION
4.1 REGIONAL SCAN
BC Environment’s Streamflow Inventory uses 17 Hydrological Zones, each having its ownhydrologic characteristics which theoretically would suggest that a different PMF relationshipmight be developed for each zone. As well the PMF data provided by BC Hydro was dividedinto seven regions: Vancouver Island, Costal, Bridge River, Okanagan, Kootenay, Columbiaand Peace River.
The small size of the data set precludes dividing it to that many portions. However, both theBC Hydro regions and BC Environment’s hydrological zones provided a rough guideline forthe initial attempts at regionalisation. As discussed earlier, the hydrological zones providedthe rationale for separating out the outliers from the Okanagan data in Zone 12B.
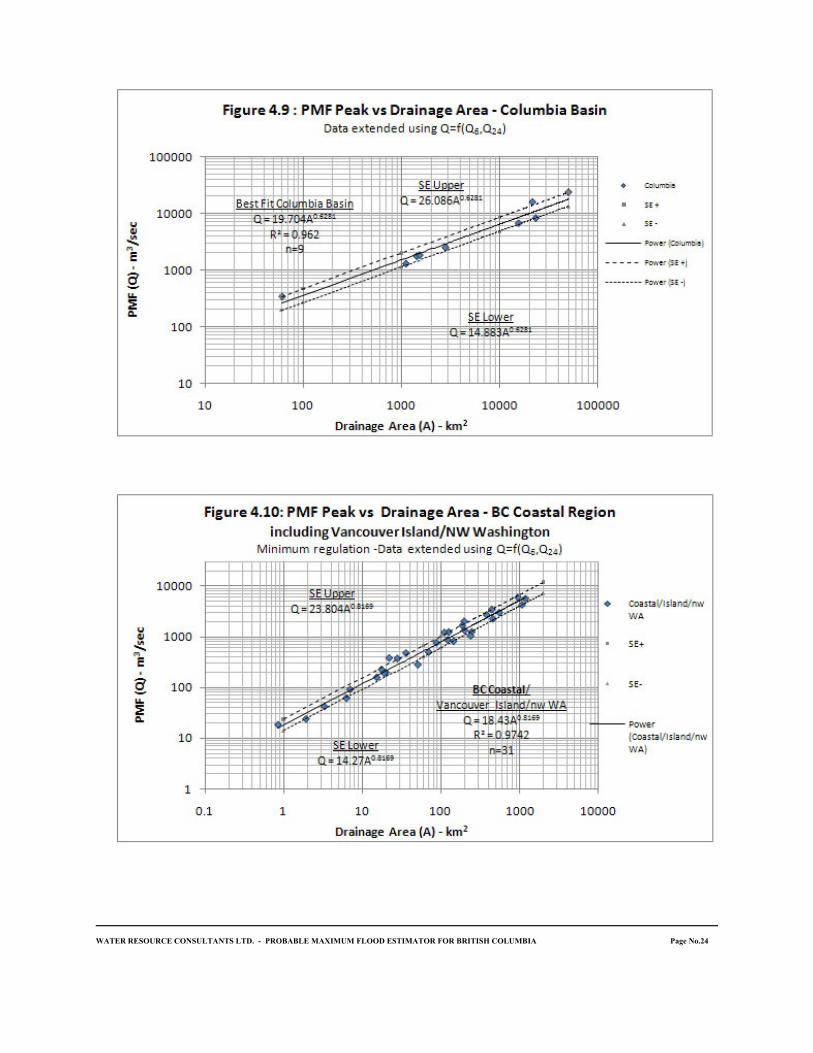
Comparing the location of the PMF data in Figure 2.1 with the hydrological zones in Figure3.2 suggests that possible subgroups for the study would include Vancouver Island (Island),the costal region (Coastal), the Columbia River basin including the Kootenay and U.S.tributaries of Pend d’Oreille and Clark Fork (Columbia) and the BC Interior (BCI). These areillustrated in the plot of PMF versus drainage area in Figure 4.1. Note that there were twopoints in north west Washington State (NW WA), one on the upper Skagit River basin andthe other a PMF developed from local drainage to Lake Whatcom. After some testing bothwere included with the coastal data in the next section.
A best fit regression line was developed for PMF peaks and drainage area for the Island,Coastal and Columbia groups. The R² values were Island (0.97), Coastal (0.96) as shown inFigure 4.2. All of these are higher than the R² = 0.92 calculated for the larger data setcomprising all of the PMFs, supporting the case for regionalisation. The remaining groupsdid not have sufficient data to do a statistical analysis. They would be considered in theconsolidation of groups in the next section.
WATER RESOURCE CONSULTANTS LTD. - PROBABLE MAXIMUM FLOOD ESTIMATOR FOR BRITISH COLUMBIA Page No.18

WATER RESOURCE CONSULTANTS LTD. - PROBABLE MAXIMUM FLOOD ESTIMATOR FOR BRITISH COLUMBIA Page No.19

4.2 CONSOLIDATED REGIONS
Attempts were made to improve the statistical relationships between PMF peaks and drainagearea, and include the smaller data sets for the BC Interior, Bridge River, the Okanagan(Zone 12B) and north west Washington by consolidating the data into larger groups. Theimprovement was measured by the change in the coefficient of determinations (R²). Severalcombinations were tried leading to the formation of two groups - Columbia/BC Interior, andCoastal/Island/NW WA (two stations in northwest Washington) as shown in Figure 4.2. Thecoefficients of determination for both groups were better than that for the overall data set.
The R² for the Columbia/BC interior group did not change significantly from that for theColumbia basin by itself suggesting that the consolidated grouping could be used to representPMFs for both regions.
The Coastal/Island/NW WA group performed about the same as the Island by itself. Therewas however a small improvement in the R² for the coastal region. The inclusion of the twodata points from Washington State further strengthened this relationship.
The unit PMF for the two consolidated groupings, Columbia/BC interior andCoastal/Island/NW Washington, and the Island, Coastal and Columbian Basin groups bythemselves were plotted against drainage area. These are shown in figures 4.3 to 4.7. Figures 4.8 to 4.12 show the peak flow (Q) versus drainage area.
The Columbia/BC interior and the Columbia groups showed an excellent correlation betweenthe PMF and drainage area with R² = 0.883 and 0.898 respectively. These are both higherthan that for the overall minimum regulated data set (R² = 0.846). The values for the otherthree groupings were much lower with R² ranging between 0.65 and 0.67. However, giventhat the relationship between PMF peak and drainage area was very good, these relationshipsstill might provide useful information as they represent more local areas.
4.3 FURTHER ANALYSIS OF PMFs IN ZONE 12B
An attempt was made to develop a relationship that would include the PMFs in Zone 12B. An examination of data in adjacent areas showed that two stations that were originallyincluded in the Coastal region, Seton and Lajoie in BC Hydro’s Bridge River system, mightbe combined with the data in Zone 12B. The Bridge River data fell within Zone 15 whichwas adjacent to Zone 12B. As well both zones were located within the boundaries of theBritish Columbian Interior low flow zone defined by BC Environment.
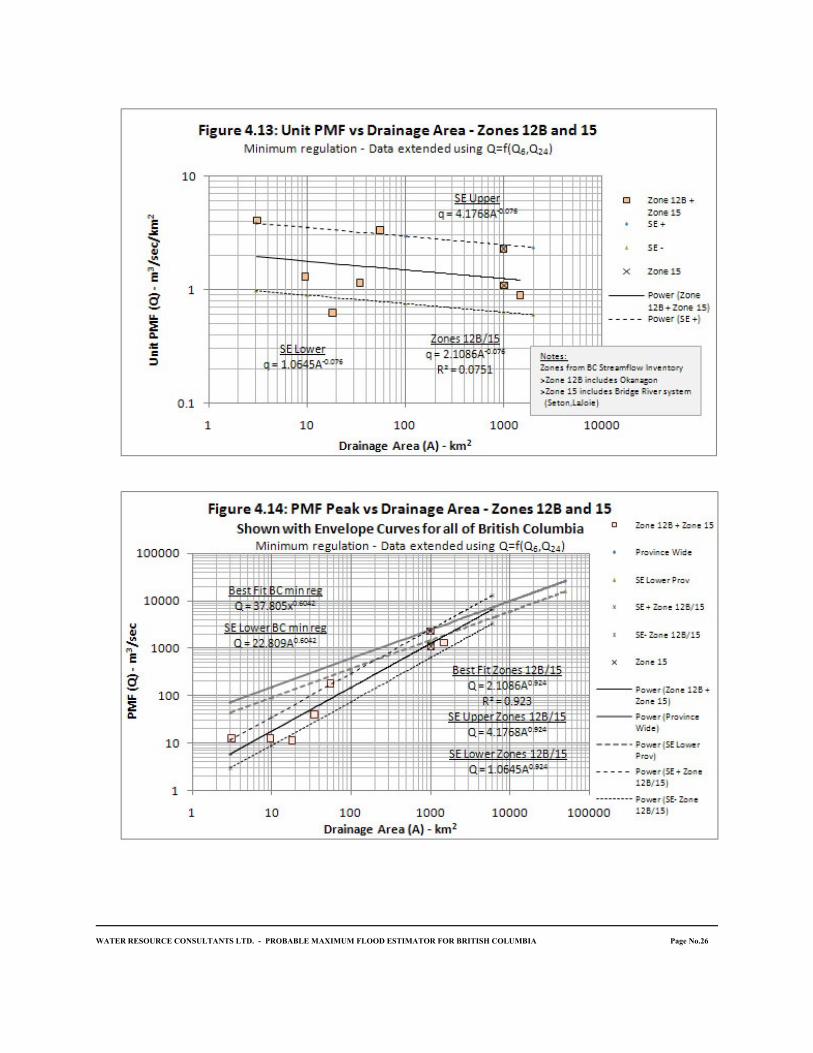
The data for the two zones were plotted against the drainage area on Figures 4.13 and 4.14. While the unit PMF showed virtual no dependence on drainage area the PMF peak had areasonably good relationship with R² = 0.92.
WATER RESOURCE CONSULTANTS LTD. - PROBABLE MAXIMUM FLOOD ESTIMATOR FOR BRITISH COLUMBIA Page No.20

WATER RESOURCE CONSULTANTS LTD. - PROBABLE MAXIMUM FLOOD ESTIMATOR FOR BRITISH COLUMBIA Page No.21

WATER RESOURCE CONSULTANTS LTD. - PROBABLE MAXIMUM FLOOD ESTIMATOR FOR BRITISH COLUMBIA Page No.22

WATER RESOURCE CONSULTANTS LTD. - PROBABLE MAXIMUM FLOOD ESTIMATOR FOR BRITISH COLUMBIA Page No.23
WATER RESOURCE CONSULTANTS LTD. - PROBABLE MAXIMUM FLOOD ESTIMATOR FOR BRITISH COLUMBIA Page No.24

WATER RESOURCE CONSULTANTS LTD. - PROBABLE MAXIMUM FLOOD ESTIMATOR FOR BRITISH COLUMBIA Page No.25
WATER RESOURCE CONSULTANTS LTD. - PROBABLE MAXIMUM FLOOD ESTIMATOR FOR BRITISH COLUMBIA Page No.26

The provincial relationship between PMF and drainage area was plotted on Figure 4.14 andcompared to the PMF versus drainage area relationships for the Zone 12B and Bridge Riverdata. The Zone 12B/15 curves were much steeper intercepting the provincial curves at theArea and PMF coordinates of 8,320 km² and 8,830 m³/s respectively. Considering the threelargest PMFs from Zone 12B/15, one falls close to the provincial curve while the other twofall just below the lower bounds of the Standard Error of the provincial relationship.
A similar test was done using the Columbia/BC Interior relationships between PMF peak anddrainage area. The intersection point was much lower (2,400 km² and 2,800 m³/s) as shownon Figure 4.15. Both Zone 15 values (Bridge River) plotted within the bounds of standarderror with the LaJoie data plotting on the upper boundary. One of the Zone 12B data points(Nicola Lake) also plotted within the bounds of the Standard Error.
It might be possible to combine the Zone 12B/15 curve with either the provincial orColumbia/BC Interior curves to form an envelope curve for Zone 12B/15 . While theprovincial curve would provide the more conservative estimate of the PMF the Columbia/BCInterior curve should also be given consideration.
4.4 IMPACT OF VARIABILITY IN PROBABLE MAXIMUMPRECIPITATION (PMP)
Figure 4.16 shows the Coastal/Island unit PMF and selected PMP data plotted againstdrainage area. The values for Seton and La Joie (Bridge River system) plotted well outsidethe expected standard error. The resulting analysis led to the removal of the Bridge Riverstations from the Coastal group and inclusion with the Zone 12B data as discussed in theprevious section. Their inclusion in the Coastal group did lead to an examination of theimpact of variability of PMPs on the PMF.
PMP data from the Analysis of Probable Maximum Precipitation for Southwest BritishColumbia shows a wide variation in average point 24 hour PMP values for 16 BC Hydro1
watersheds in southwestern British Columbia. Eleven of these correspond to watershedsused for the Coastal/Island region in this study. The PMFs for these watersheds have been2
plotted as labels on their respective data points in Figure 4.16.
Analysis of Probable Maximum Precipitation in Southwest British Columbia - Prepared for British Columbia Hydro and Power 1
Authority by Water Management Consultants, February, 2003.
The original analysis in this study included the Bridge River locations with the Coastal data. These were subsequently moved to 2
the Zone 12B/15 group.
WATER RESOURCE CONSULTANTS LTD. - PROBABLE MAXIMUM FLOOD ESTIMATOR FOR BRITISH COLUMBIA Page No.27

The average point 24 hour PMP for the 11 stations plotted ranged from 260 mm for SetonDam to 520 mm for Coquitlam Dam. When these PMPs were used as labels for the data
WATER RESOURCE CONSULTANTS LTD. - PROBABLE MAXIMUM FLOOD ESTIMATOR FOR BRITISH COLUMBIA Page No.28
points it indicated a pattern in which the PMFs for an area with a higher PMP would plotabove the trend line while PMFs for lower PMPs would plot below the line. This couldprove useful in using the relationship as predictors of preliminary PMF values.
A multiple regression analysis was conducted (PMF = f (Area , PMP)) using data from the 11watersheds having PMP data. The R² was 0.76. A second multiple regression analysis wascarried out with more data points. The resulting R² was 0.67.
A more detailed analysis of the additional PMPs similar to that done by BC Hydro insouthwest British Columbia would be required to take this analysis further. Nevertheless thebrief analysis indicates that local variations in PMP should be one of the considerations thatwould influence the estimation of PMFs from the graphical relationships presented in thisstudy.
4.5 REGULATED PMFs IN THE COLUMBIA RIVER BASIN
PMF data were available for 10 locations in the heavily regulated watersheds along the Pendd’Oreille, Clark-Fork, Kootenay and upper Columbia Rivers. Because the PMFs for theselocations appeared in a definable group in Figure 3.1, it was investigated further as shown inFigures 4.17 and 4.18. Even though these basins were highly regulated the unit PMF shows aslight inverse relationship to drainage area (R² = 0.72) possibly due to the cumulative effectsof regulation as you move from upstream to downstream.
The peak PMF on the other hand was completely independent of the drainage area. A plot ofthe PMF peak against drainage area shows that most peaks lie between 8,500 and 11,000 m³/swith a mean PMF of 10,100 m³/s. This reflects the influence of the operation of upstreamreservoirs to meet the operational requirements for flows in the Columbia river Basin. Theeffect of operational assumptions is illustrated by the high and low ranges of PMF peak forNoxon Rapids and Cabinet Gorge on the Clark Fork River which range between 8,500 and11,800 m³/s.
This might have some utility for comparing the PMFs within this highly regulated regime.
WATER RESOURCE CONSULTANTS LTD. - PROBABLE MAXIMUM FLOOD ESTIMATOR FOR BRITISH COLUMBIA Page No.29

WATER RESOURCE CONSULTANTS LTD. - PROBABLE MAXIMUM FLOOD ESTIMATOR FOR BRITISH COLUMBIA Page No.30
5.0 DISCUSSION AND CONCLUSIONS
5.1 GEOGRAPHIC LIMITS
PMF data gathered for this study tended to be clustered in areas around Vancouver Island, thecoastal region, and the Columbia Basin reflecting the concentrations of hydroelectricdevelopment in those areas as well as the heavily developed water supply systems for theCity of Vancouver, and the Cities of Victoria and Nanaimo on Vancouver Island. This leadsto the conclusion that the curves would be more reliable for those regions. The extension ofthe Columbia River curves to include the more northern locations such as the Peace Rivershows promise, however, this needs to be used with caution considering the scarcity of datathat went into developing the relationships.
The extended data sets in Figures 3.6 and 3.7 show a very good relationship between unitPMF and drainage area (R² = 0.84) and PMF peak and drainage area (R² =0.92). From avisual inspection, unit PMF values appear to be clustered above the trend line for areasbetween 20 and 1000 km². This would lead to low estimates if Figure 3.6 was used as apredictor. An examination of the residuals (predicted q and actual q shown in Appendix F)supports this. For areas less than 20 km² and greater than 1000 km² the values tend to plotbelow the line resulting in higher predictions. Figure 3.7, peak flow versus drainage area,exhibit similar characteristics.
5.2 REGIONALIZATION
The regional analyses illustrated in the Figures 4.3 to 4.12 show a visually better fit with noobvious groupings above and below the trend line. This is supported by examination of theresiduals. The best fit line for the Columbia region has a high R² for both the unit PMFversus area and the peak PMF versus area (R² equal 0.90 and 0.96 respectively), showing ahigh dependency of the PMF on area.
The best fit line for the regional data for Vancouver Island and the coastal region has a flatterslope and a much lower R² for the unit runoff, R² = 0.65 for the coastal/Island regioncompared to R² = 0.84 for the province overall. The PMF peak versus area relationship for the coastal/island data shown on Figures 4.10 to4.12, however, shows a reasonably good relationship with R² between 0.96 and 0.97. Thissuggests that despite the low R² for the regional unit PMF data for the island and coastalregions, the resulting peak PMF may be more appropriate than that developed using theprovincial relationship. This conclusion is further supported by the analysis of predictionefficiency in the follow section.
WATER RESOURCE CONSULTANTS LTD. - PROBABLE MAXIMUM FLOOD ESTIMATOR FOR BRITISH COLUMBIA Page No.31
5.3 PREDICTION EFFICIENCIES
The regional relationships and the overall provincial relationships were tested to determinetheir ability to reproduce the original peak flow data using the relationships y = axb
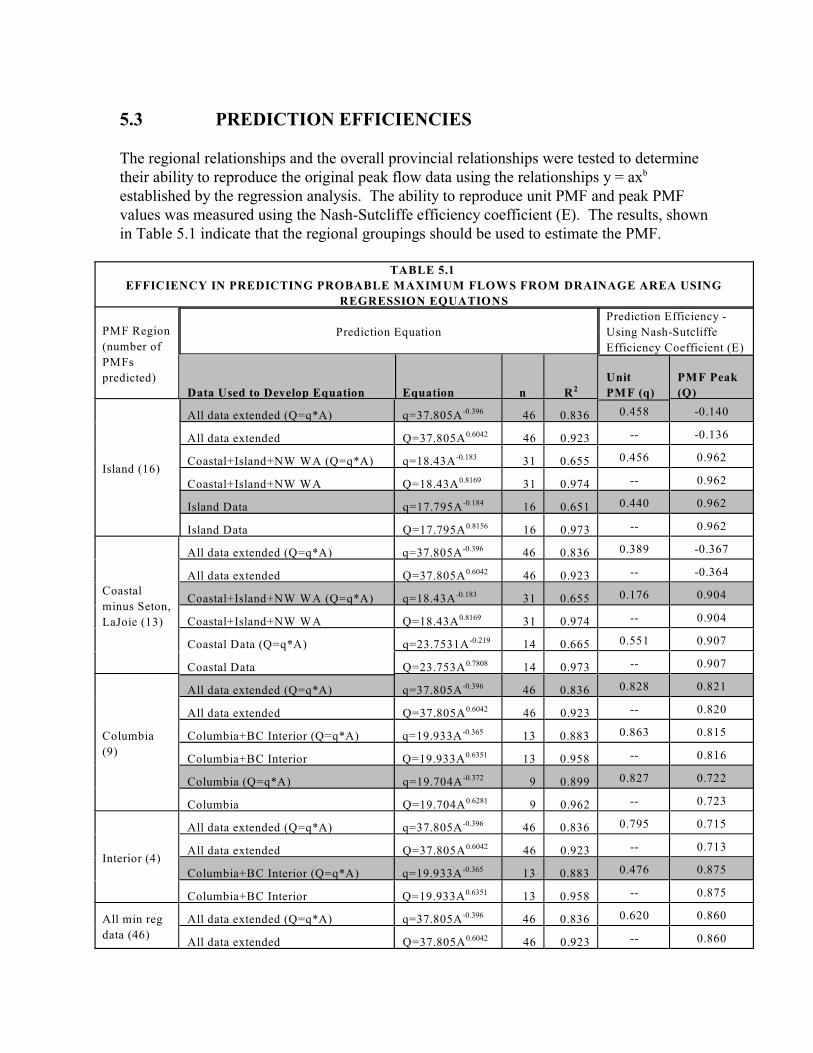
established by the regression analysis. The ability to reproduce unit PMF and peak PMFvalues was measured using the Nash-Sutcliffe efficiency coefficient (E). The results, shownin Table 5.1 indicate that the regional groupings should be used to estimate the PMF.
TABLE 5.1
EFFICIENCY IN PREDICTING PROBABLE MAXIMUM FLOWS FROM DRAINAGE AREA USING
REGRESSION EQUATIONS
PMF Region
(number of
PMFs
predicted)
Prediction Equation
Prediction Efficiency -
Using Nash-Sutcliffe
Efficiency Coefficient (E)
Data Used to Develop Equation Equation n R2
Unit
PMF (q)
PMF Peak
(Q)
Island (16)
All data extended (Q=q*A) q=37.805A 46 0.836-0.396 0.458 -0.140
All data extended Q=37.805A 46 0.9230.6042 -- -0.136
Coastal+Island+NW WA (Q=q*A) q=18.43A 31 0.655-0.183 0.456 0.962
Coastal+Island+NW WA Q=18.43A 31 0.9740.8169 -- 0.962
Island Data q=17.795A 16 0.651-0.184 0.440 0.962
Island Data Q=17.795A 16 0.9730.8156 -- 0.962
Coastal
minus Seton,
LaJoie (13)
All data extended (Q=q*A) q=37.805A 46 0.836-0.396 0.389 -0.367
All data extended Q=37.805A 46 0.9230.6042 -- -0.364
Coastal+Island+NW WA (Q=q*A) q=18.43A 31 0.655-0.183 0.176 0.904
Coastal+Island+NW WA Q=18.43A 31 0.9740.8169 -- 0.904
Coastal Data (Q=q*A) q=23.7531A 14 0.665-0.219 0.551 0.907
Coastal Data Q=23.753A 14 0.9730.7808 -- 0.907
Columbia
(9)
All data extended (Q=q*A) q=37.805A 46 0.836-0.396 0.828 0.821
All data extended Q=37.805A 46 0.9230.6042 -- 0.820
Columbia+BC Interior (Q=q*A) q=19.933A 13 0.883-0.365 0.863 0.815
Columbia+BC Interior Q=19.933A 13 0.9580.6351 -- 0.816
Columbia (Q=q*A) q=19.704A 9 0.899-0.372 0.827 0.722
Columbia Q=19.704A 9 0.9620.6281 -- 0.723
Interior (4)
All data extended (Q=q*A) q=37.805A 46 0.836-0.396 0.795 0.715
All data extended Q=37.805A 46 0.9230.6042 -- 0.713
Columbia+BC Interior (Q=q*A) q=19.933A 13 0.883-0.365 0.476 0.875
Columbia+BC Interior Q=19.933A 13 0.9580.6351 -- 0.875
All min reg
data (46)
All data extended (Q=q*A) q=37.805A 46 0.836-0.396 0.620 0.860
All data extended Q=37.805A 46 0.9230.6042 -- 0.860
Equations for the Columbia/BC Interior produced better results than those for theColumbia Basin by itself. The efficiency for the combined Columbia/BC Interior was0.82 compared to 0.72 for the Columbia Basin by itself. Predictions using all of theBritish Columbia data were equally as good achieving an efficiency of 0.82.
Columbia/BC Interior equation predicted the PMF peaks for the BC Interior with anefficiency of E = 0.875. It should be noted that there were only four points predicted. Nevertheless this relationship is better than that using the province wide equation.
Similarly the Vancouver Island and Coastal equations performed slightly better than thecombination of Island/Coastal/NW WA.
The overall result of the efficiency analysis is that either the more localized regionalrelationship or the broader regional relationships could be used to predict PMFs for thecoastal, Island and Columbia regions with relatively equal confidence. Intuitively thesmaller regions would be more sensitive to local variability in hydrology and geography.
5.4 VARIABILITY IN PROBABLE MAXIMUMPRECIPITATION (PMP)
Consideration of the PMP can explain some of the variability of the PMF about the trendline. Using data from the Analysis of Probable Maximum Precipitation for SouthwestBritish Columbia shows a wide variation in average point 24 hour PMP values for 16 BC3
Hydro watersheds in southwestern British Columbia. Eleven of these correspond towatersheds used in this study. PMPs varied from 260 mm to over 500 mm.
A multiple regression analysis yielded and R² of 0.76 using the PMP data provided in theBC Hydro and corresponding PMF and drainage area data gathered for this study. Attempts to expand this with additional PMP data extracted from various reports used inthis study resulted in a lower R².
It was concluded that a more detailed evaluation of the PMP data was required. The briefanalysis did, however, show that local variations in PMP should be considered wheninterpreting the results of the PMF envelope curves developed for this study.
5.5 COMPARISON TO PREVIOUS STUDIES
Envelope curves for probable maximum flood peaks for the Canadian prairies weresuperimposed on a plot of the British Columbia data as shown on Figure 3.8. The Prairie
Analysis of Probable Maximum Precipitation in Southwest British Columbia - Prepared for British Columbia Hydro and Power 3
Authority by Water Management Consultants, February, 2003
WATER RESOURCE CONSULTANTS LTD. - PROBABLE MAXIMUM FLOOD ESTIMATOR FOR BRITISH COLUMBIA Page No. 33

curves have a much steeper slope than the British Columbia curve reflecting the influenceof convective storms on the prairies. The Mountain fed curve is closer to the BritishColumbia curve although still with a slightly steeper slope. The shape of the Mountainfed curve is influenced by the attenuation of flood peaks in the larger basins of theSaskatchewan River system which is due to floods originating in the mountians andflowing across a large area with very little inflow. The point for the Fraser River atMission falls close to the Mountain fed line suggesting a similar attenuation due to thedistance between the source and the study location and the relative timing of peaks in thelower and upper parts of the basin.
5.6 EMPIRICAL RELATIONSHIPS
As discussed earlier in Chapter 3 this study briefly examined the use of two empiricalrelationships for estimating extreme floods; the first developed by Creager and the secondby Francou-Rodier.
An examination of Figure 3.9 shows that the shape of the Creager curves fairly closelyapproximates the visual trend in the plot of unit PMF versus drainage area for theprovince. The curve with Creager C = 70 shows a good approximation of the extremeboundary for areas between 20 km² and 200,000 km² and one with C = 20 would providea reasonable approximation of the lower boundary. This leads to the conclusion thatfurther consideration should be given to the Creager curves.
No conclusions have been arrived at regarding the Francou-Rodier curves shown onFigure 3.10.
5.7 CONCLUSIONS
Figures 4.3 to 4.12 provide a basis for estimating the peak PMF based on drainage areaand location. The best fit curve provides an average condition and the standard errorrange provides guidance for users to apply in evaluating the special features of thespecific drainage basin under consideration and the degree of safety factor to beconsidered to the project under investigation.
The results of the study include the digital data spreadsheets for each of the resultinggraphs which will permit the addition of new data when it becomes available and willallow hydrologist to easily plot the results of the PMP studies as simple check againstother results. It also provides a good basis for further analysis.
WATER RESOURCE CONSULTANTS LTD. - PROBABLE MAXIMUM FLOOD ESTIMATOR FOR BRITISH COLUMBIA Page No. 34

6.0 RECOMMENDATIONS
It is recommended that the best fit equation in Table 6.1 be used to estimate probablemaximum flood peaks for British Columbia.
TABLE 6.1RECOMMENDED REGIONAL EQUATIONS FOR ESTIMATING
PMP PEAKS FROM DRAINAGE AREA
Peak Flows m³/s Figure No.
Vancouver Island Q = 17.795A Figure 4.120.8156
BC Costal Region Q = 23.753A Figure 4.110.7808
Columbia Basin Q = 19.704A Figure 4.90.6281
BC Interior Q = 19.933A Figure 4.80.6351
Zone 12B and Zone 15 Q = 37.805A for A$ 8320 km²0.6042
Q = 2.1086A for A< 8320 km²0.9240
Figure 4.14
Adjustments can be made based on the Standard Error limits identified on each figure toadjust for special drainage basin characteristics or to generate more or less conservativeestimates.
Consideration should also be given to the variation in probable maximum precipitation(PMP) that occurs particularly in the Island and Coastal Mountain Regions.
WATER RESOURCE CONSULTANTS LTD. - PROBABLE MAXIMUM FLOOD ESTIMATOR FOR BRITISH COLUMBIA Page No. 35