
Preventive Maintenance Criteria - NCDOT
59
Preventive Maintenance Criteria NCDOT Project 2015-11 FHWA/NC/2015-11 August 2016 John C. Hildreth, PhD Nicholas Tymvios, PhD Dept. of Engineering Technology and Construction Management University of North Carolina at Charlotte 9201 University City Blvd. Charlotte, NC 28223
Transcript of Preventive Maintenance Criteria - NCDOT
Preventive Maintenance Criteria
NCDOT Project 2015-11 FHWA/NC/2015-11 August 2016
John C. Hildreth, PhD Nicholas Tymvios, PhD Dept. of Engineering Technology and Construction Management University of North Carolina at Charlotte 9201 University City Blvd. Charlotte, NC 28223
Preventive Maintenance Criteria
Final Project Report RP 2015-11
by
John C. Hildreth, Ph.D. Associate Professor
Nicholas Tymvios, Ph.D. Assistant Professor
Department of Engineering Technology and Construction Management
9201 University City Boulevard Charlotte, NC 28223
August 2016
i
Technical Report Documentation Page 1. Report No.
FHWA/NC/2015-11 2. Government Accession No.
3. Recipient’s Catalog No.
4. Title and Subtitle Preventive Maintenance Criteria
5. Report Date August 15, 2016
6. Performing Organization Code
7. Author(s) John Hildreth and Nicholas Tymvios
8. Performing Organization Report No.
9. Performing Organization Name and Address Department of Engineering Technology and Construction Management University of North Carolina at Charlotte Smith Building 9201 University City Blvd. Charlotte, NC 28223
10. Work Unit No. (TRAIS)
11. Contract or Grant No.
12. Sponsoring Agency Name and Address North Carolina Department of Transportation Research and Analysis Group 1 South Wilmington Street Raleigh, North Carolina 27601
13. Type of Report and Period Covered Final Report May 16, 2015 – August 15,2016
14. Sponsoring Agency Code
Supplementary Notes:
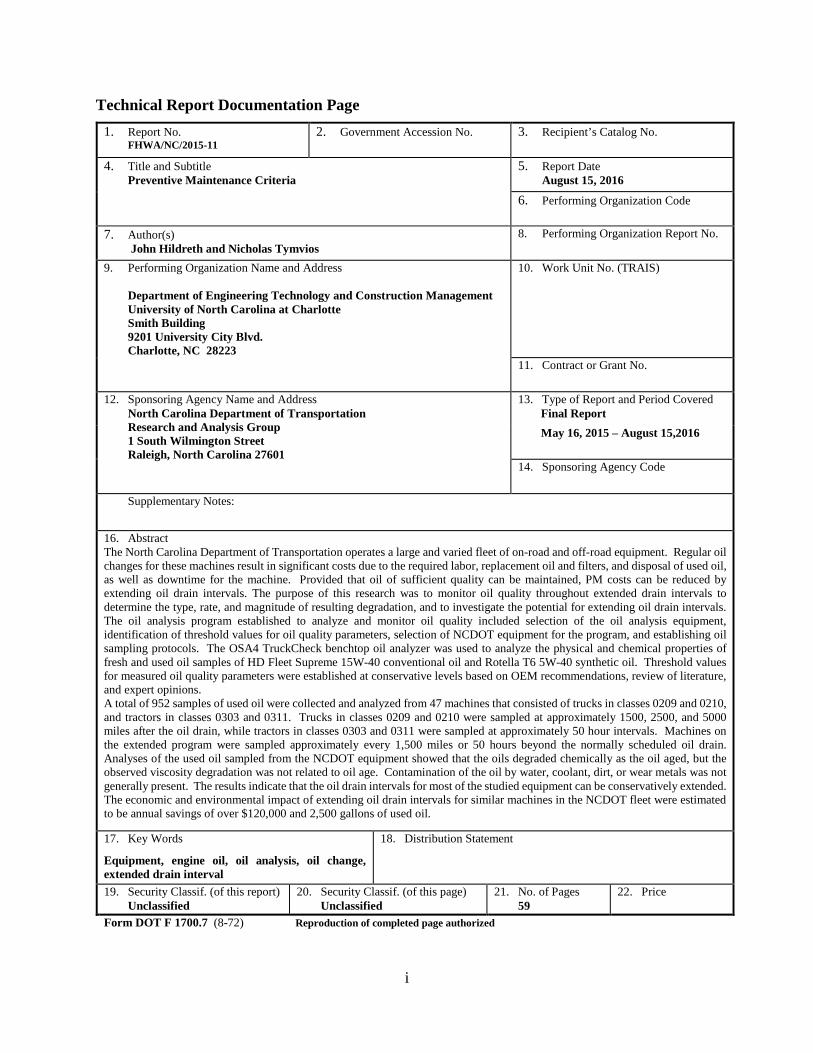
16. Abstract The North Carolina Department of Transportation operates a large and varied fleet of on-road and off-road equipment. Regular oil changes for these machines result in significant costs due to the required labor, replacement oil and filters, and disposal of used oil, as well as downtime for the machine. Provided that oil of sufficient quality can be maintained, PM costs can be reduced by extending oil drain intervals. The purpose of this research was to monitor oil quality throughout extended drain intervals to determine the type, rate, and magnitude of resulting degradation, and to investigate the potential for extending oil drain intervals. The oil analysis program established to analyze and monitor oil quality included selection of the oil analysis equipment, identification of threshold values for oil quality parameters, selection of NCDOT equipment for the program, and establishing oil sampling protocols. The OSA4 TruckCheck benchtop oil analyzer was used to analyze the physical and chemical properties of fresh and used oil samples of HD Fleet Supreme 15W-40 conventional oil and Rotella T6 5W-40 synthetic oil. Threshold values for measured oil quality parameters were established at conservative levels based on OEM recommendations, review of literature, and expert opinions. A total of 952 samples of used oil were collected and analyzed from 47 machines that consisted of trucks in classes 0209 and 0210, and tractors in classes 0303 and 0311. Trucks in classes 0209 and 0210 were sampled at approximately 1500, 2500, and 5000 miles after the oil drain, while tractors in classes 0303 and 0311 were sampled at approximately 50 hour intervals. Machines on the extended program were sampled approximately every 1,500 miles or 50 hours beyond the normally scheduled oil drain. Analyses of the used oil sampled from the NCDOT equipment showed that the oils degraded chemically as the oil aged, but the observed viscosity degradation was not related to oil age. Contamination of the oil by water, coolant, dirt, or wear metals was not generally present. The results indicate that the oil drain intervals for most of the studied equipment can be conservatively extended. The economic and environmental impact of extending oil drain intervals for similar machines in the NCDOT fleet were estimated to be annual savings of over $120,000 and 2,500 gallons of used oil.
17. Key Words
Equipment, engine oil, oil analysis, oil change, extended drain interval
18. Distribution Statement
19. Security Classif. (of this report) Unclassified
20. Security Classif. (of this page) Unclassified
21. No. of Pages 59
22. Price
Form DOT F 1700.7 (8-72) Reproduction of completed page authorized
ii
DISCLAIMER The contents of this report reflect the views of the authors who are responsible for the facts and the accuracy of the data presented herein. The contents of the report do not reflect the official views or policies of the North Carolina Department of Transportation or the Federal Highway Administration. This report does not constitute a standard, specification or regulation.
iii
ACKNOWLEDGEMENTS The authors acknowledge the North Carolina Department of Transportation for supporting and funding this project. We extend our thanks to the following members of the project Steering and Implementation Committee for providing valuable guidance and insight throughout the project:
Mr. Mark Walker (Chair) Mr. Scott Capps, PE Mr. Ronnie Houchens Mr. Richard Mabry Mr. Bruce Thompson Mr. Quince Watson Mr. William Beatty Mr. Neil Mastin, PE Mr. Rasay Abadilla Jr.
The authors express gratitude to the NCDOT Division 10 equipment management personnel who were instrumental in assisting with this project.
The following graduate and undergraduate research assistants at the Department of Engineering Technology and Construction Management at UNC Charlotte made significant contributions to the work:
Mr. Cody Beal Mr. Joe Civaterese Ms. Bhavana Dalia Mr. Jacob Trammel
iv
EXECUTIVE SUMMARY Preventive maintenance (PM) is a key component of effectively managing an equipment fleet in a fully functional and safe working order. Regularly draining and replacing engine oil is a common PM action performed to maintain engine health and prolong engine life. The North Carolina Department of Transportation (NCDOT) operates and maintains a fleet of on-road and off-road equipment that includes approximately 7,900 engine driven machines. Regular oil changes for these machines result in significant costs due to the required labor, replacement oil and filters, and disposal of used oil, as well as downtime for the machine. Provided that oil of sufficient quality can be maintained, PM costs can be reduced by extending oil drain intervals.
The purpose of this research was to monitor oil quality throughout extended drain intervals to determine the type, rate, and magnitude of resulting degradation, and to investigate the potential for extending oil drain intervals. The oil analysis program established to analyze and monitor oil quality included selection of the oil analysis equipment, identification of threshold values for oil quality parameters, selection of NCDOT equipment for the program, and establishing oil sampling protocols.
The OSA4 TruckCheck benchtop oil analyzer was used to analyze the physical and chemical properties of fresh and used oil samples of HD Fleet Supreme 15W-40 conventional oil and Rotella T6 5W-40 synthetic oil. The TruckCheck system uses atomic emission spectroscopy to measure metal levels, infrared spectroscopy to measure physical properties, and a dual temperature viscometer to measure viscosity at both 40C and 100C. Samples of fresh oil were collected from bulk tanks at the NCDOT equipment shop and analyzed to establish baseline properties.
Threshold values for measured oil quality parameters were established at conservative levels based on OEM recommendations, the literature review, and input from Mr. Diego Navarro, a recognized expert in the area of lubricant analysis.
A total of 952 samples of used oil were collected and analyzed from 47 machines that consisted of trucks in classes 0209 and 0210 and tractors in classes 0303 and 0311. Trucks in classes 0209 and 0210 were sampled at approximately 1500, 2500, and 5000 miles after the oil drain, while tractors in classes 0303 and 0311 were sampled at approximately 50 hour intervals. Machines on the extended program were sampled approximately every 1,500 miles or 50 hours beyond the normally scheduled oil drain.
Analyses of fresh oil samples showed that both the conventional HD Fleet Supreme 15W-40 and synthetic Rotella T6 5W-40 are good quality oils with average TBN values of approximately 9.5 mg KOH/g and viscosity within the SAE standard limits for 40 weight oil. The measured TBN and viscosity of the fresh conventional oil was very similar to the typical values published by the manufacturer, while the measured TBN and viscosity of the synthetic oil was lower than the typical values published by the manufacturer.
Analyses of the used oil sampled from the NCDOT equipment showed that the oils degraded chemically as the oil aged, but the observed viscosity degradation was not related to oil age. Contamination of the oil by water, coolant, dirt, or wear metals was not generally present. The results indicate that the oil drain intervals for most of the studied equipment can be conservatively extended. The economic and environmental impact of extending oil drain intervals for similar machines in the NCDOT fleet were estimated to be annual savings of over $120,000 and 2,500 gallons of used oil.
v
TABLE OF CONTENTS 1 INTRODUCTION .............................................................................................................................. 1 2 LITERATURE REVIEW .................................................................................................................. 2
2.1 ENGINE OILS ............................................................................................................................................... 2 2.2 OIL BULK PROPERTIES AND CONTAMINATION ............................................................................................ 3 2.3 EXTENDING DRAIN INTERVALS ................................................................................................................... 5
3 OIL ANALYSIS PROGRAM ......................................................................................................... 10 3.1 OIL ANALYSIS EQUIPMENT ....................................................................................................................... 10 3.2 THRESHOLD VALUES ................................................................................................................................. 10 3.3 BASELINE ANALYSIS OF FRESH OIL .......................................................................................................... 12 3.4 EXPERIMENTAL PM PROGRAM .................................................................................................................. 12
4 OIL ANALYSIS RESULTS ............................................................................................................ 14 4.1 FRESH OIL ANALYSIS RESULTS ................................................................................................................. 14
4.1.1 Conventional Oil .................................................................................................................................. 14 4.1.2 Synthetic Oil......................................................................................................................................... 14
4.2 EXPERIMENTAL PROGRAM RESULTS ......................................................................................................... 16 4.3 EQUIPMENT CLASS 0209 ........................................................................................................................... 16 4.4 EQUIPMENT CLASS 0210 ........................................................................................................................... 20
4.4.1 Synthetic Oil Analysis .......................................................................................................................... 20 4.4.2 Conventional Oil Analysis ................................................................................................................... 22
4.5 EQUIPMENT CLASS 0303 ........................................................................................................................... 24 4.6 EQUIPMENT CLASS 0311 ........................................................................................................................... 28
5 DISCUSSION OF EXPERIMENTAL RESULTS ........................................................................ 32 5.1 FRESH OIL ................................................................................................................................................. 32 5.2 USED OIL .................................................................................................................................................. 32
5.2.1 Equipment Class 0209 ......................................................................................................................... 32 5.2.2 Equipment Class 0210 ......................................................................................................................... 33 5.2.3 Equipment Class 0303 ......................................................................................................................... 33 5.2.4 Equipment Class 0311 ......................................................................................................................... 33
5.3 IMPACT OF EXTENDED OIL DRAIN INTERVALS .......................................................................................... 33 6 REVIEW OF EXISTING OIL ANALYSIS DATA ...................................................................... 35 7 SUMMARY AND CONCLUSIONS ............................................................................................... 41 8 RECOMMENDATIONS ................................................................................................................. 43 9 REFERENCES ................................................................................................................................. 44 APPENDIX A – EQUIPMENT LIST ..................................................................................................... 46 APPENDIX B – BASELINE ANALYSIS RESULTS OF FRESH OIL ............................................... 48
vi
LIST OF FIGURES Figure 2.1: Total base number with respect to hours operated (Hosie and Lawrence 1979) ........................ 6 Figure 2.2: Iron (ppm) with respect to hours operated (Hosie and Lawrence 1979) .................................... 6 Figure 2.3: Iron level wear and trip length in a gasoline engine (Kaleli and Khorramian 1998) ................. 7 Figure 2.4: Total base number and trip length in a gasoline engine (Kaleli and Khorramian 1998) ............ 7 Figure 2.5: Viscosity (100°C) and trip length in a gasoline engine (Kaleli and Khorramian 1998) ............. 7 Figure 2.6: Average viscosity with respect to miles on oil (Jetter et al. 1998) ............................................. 8 Figure 2.7: Average total base number with respect to miles on oil (Jetter et al. 1998) ............................... 8 Figure 2.8: Average iron concentration with respect to miles on oil (Jetter et al. 1998) .............................. 9 Figure 3.1: OSA4 TruckCheck Benchtop Oil Analyzer ............................................................................. 10 Figure 4.1: TBN of Conventional Oil in Class 0209 Trucks ...................................................................... 17 Figure 4.2: Viscosity of Conventional Oil in Class 0209 Trucks ............................................................... 18 Figure 4.3: Oxidation and Nitration of Conventional Oil in Class 0209 Trucks ........................................ 18 Figure 4.4: Wear Metals in Conventional Oil in Class 0209 Trucks .......................................................... 19 Figure 4.5: Aluminum in Truck 215-6883 .................................................................................................. 19 Figure 4.6: TBN of Synthetic Oil in Class 0210 Trucks ............................................................................. 20 Figure 4.7: Viscosity of Synthetic Oil in Class 0210 Trucks ...................................................................... 21 Figure 4.8: Oxidation and Nitration of Conventional Oil in Class 0210 Trucks ........................................ 21 Figure 4.9: Wear Metals in Conventional Oil in Class 0210 Trucks .......................................................... 22 Figure 4.10: TBN of Conventional and Synthetic Oil in Class 0210 6.7L Trucks ..................................... 23 Figure 4.11: Viscosity of Conventional and Synthetic Oil in Class 0210 6.7L Trucks .............................. 23 Figure 4.12: Oxidation and Nitration of Conventional and Synthetic Oil in Class 0210 6.7L Trucks ....... 24 Figure 4:13: Wear Metals in Conventional and Synthetic Oil in Class 0210 6.7L Trucks ......................... 24 Figure 4.14: TBN of Conventional Oil in Class 0303 Tractors .................................................................. 25 Figure 4.15: Viscosity at 100C of Conventional Oil in Class 0303 Tractors .............................................. 26 Figure 4.16: Oxidation and Nitration of Conventional Oil in Class 0303 Tractors .................................... 26 Figure 4.17: Wear Metals in Conventional Oil in Class 0303 Tractors ...................................................... 27 Figure 4.18: Copper in New Tractors in Class 0303 ................................................................................... 28 Figure 4.19: TBN of Conventional Oil in Class 0311 Tractors .................................................................. 29 Figure 4.20: Viscosity at 100C of Conventional Oil in Class 0311 Tractors .............................................. 30 Figure 4.21: Oxidation and Nitration of Conventional Oil in Class 0311 Tractors .................................... 30 Figure 4.22: Wear Metals in Conventional Oil in Class 0311 Tractors ...................................................... 31 Figure 5.1: TBN and Viscosity Measurements from Existing Class 0205 Oil Analyses ............................ 36 Figure 5.2: TBN and Viscosity Measurements from Existing Class 0206 Oil Analyses ............................ 37 Figure 5.3: TBN and Viscosity Measurements from Existing Class 0209 Oil Analyses ............................ 38 Figure 5.4: TBN and Viscosity Measurements from Existing Class 0212 Oil Analyses ............................ 39 Figure 5.5: TBN and Viscosity Measurements from Existing Class 0232 Oil Analyses ............................ 40
vii
LIST OF TABLES Table 3.1: Threshold Values for Measured Oil Quality Parameters ........................................................... 11 Table 3.2: Published Typical Properties of Fresh Oil (Conoco 2015, Shell 2015) ..................................... 12 Table 3.3: Summary of Equipment Classes in Experimental PM Program ................................................ 12 Table 3.4: Summary of NCDOT Equipment in the Experimental Program ............................................... 13 Table 4.1: Fresh Conventional Oil Analysis Results .................................................................................. 14 Table 4.2: Fresh Synthetic Oil Analysis Results ......................................................................................... 15 Table 4.3: Summary of Oil Analyses by Equipment Class ......................................................................... 16 Table 5.1: Summary of NCDOT Equipment by Class and Engine ............................................................. 34 Table 5.2: Estimated Savings from Extended Oil Drain Intervals .............................................................. 34 Table 6.1: Summary of Existing Oil Analysis Data .................................................................................... 35 Table A1: NCDOT Equipment in the Experimental Program .................................................................... 46 Table B1: Bulk Tank HD Fleet Supreme 15W-40 Fresh Oil Analysis Results .......................................... 48 Table B2: Bulk Tank Rotella T6 5W-40 Fresh Oil Analysis Results ......................................................... 49 Table B3: Retail Purchase A Rotella T6 5W-40 Fresh Oil Analysis Results ............................................. 50 Table B4: Retail Purchase B Rotella T6 5W-40 Fresh Oil Analysis Results ............................................. 50
1
1 INTRODUCTION Preventive maintenance (PM) is a key component of effectively managing an equipment fleet in a fully functional and safe working order. Periodic servicing is important to maintaining a reliable high quality fleet and minimizing equipment downtime (Milwaukee 2008). Regularly draining and replacing engine oil is a common PM action performed to maintain engine health and prolong engine life. The North Carolina Department of Transportation (NCDOT) operates and maintains a fleet of on-road and off-road equipment that includes approximately 7,900 engine driven machines. Regular oil changes for these machines result in significant costs due to the required labor, replacement oil and filters, and disposal of used oil, as well as downtime for the machine. Provided that oil of sufficient quality can be maintained, PM costs can be reduced by extending oil drain intervals.
Oil drain intervals are typically scheduled based on machine use and/or calendar days. Oil changes are scheduled for 5,000 miles or 200 hours intervals or annually, whichever comes first, in the current NCDOT PM program. This schedule is generally applied to all classes of equipment in the fleet without regard to type, use, OEM recommendation, or past experience. Regular sampling and analysis of oil is not included in the program and oil quality is not explicitly considered when scheduling oil changes. This is largely due to the approximate two week time lag between oil sampling and receipt of the analysis results when analysis is performed by an independent laboratory.
Engine oil, regardless of the type, decreases in quality throughout its useful life. Degradation may result from physical or chemical changes to the oil or from contamination by impurities. Degradation inhibits the ability of the oil to perform the critical functions of wear protection, thermal management, and corrosion inhibition necessary to maintain performance and maximize useful service life. Because oil provides vital protection to an engine, it is regularly drained and replaced to counter the effects of degradation and contamination.
The purpose of this research was to monitor oil quality throughout extended drain intervals to determine the type, rate, and magnitude of resulting degradation, and to investigate the potential for extending oil drain intervals. This was achieved through the completion of the following tasks:
1. Establish an experimental PM program consisting of:
a. on-site oil analysis equipment necessary to measure oil quality parameters within a short period of time;
b. threshold values for oil quality parameters; c. sampling and analysis procedures necessary to accurately collect and manage the
analysis results; and d. individual machines selected from four equipment classes to be maintained on
extended drain intervals determined by comparing the results with the parameter threshold values.
2. Investigate existing data from oil previously analyzed for the NCDOT to determine whether the data can be used to augment that from the experimental PM program and to aid in understanding how fuel use relates to oil performance.
3. Assess the impact of extended oil drain intervals in terms of oil quality, as well as economic and environmental benefits.
2
2 LITERATURE REVIEW Preventative maintenance plans are commonly predetermined, utilizing parameters measured at fixed intervals to maintain performance based off the equipment manufacture’s specifications or other external sources (Bernspang and Kali 2011). Fleet managers often customize their own personal preventative maintenance intervals based on past performance of similar equipment, with similar demands such as extreme temperature changes and working conditions.
Preventative maintenance schedules can consist of many different intervals, with each maintenance interval reflecting on different aspects of that certain piece of equipment. Keller (2014), identifies that a predetermined preventative maintenance interval is broken down into the following four sections:
• PM A – Safety inspection of components such as brakes, lights, tires, and fluids, including but not limited to, engine oil, hydraulic fluid, antifreeze and transmission fluid. Normal inspection intervals are 1,500 to 2,500 miles for light vehicles and 5,000 to 10,000 miles for heavy vehicles.
• PM B – Includes PM A and inspection of the air filter, engine oil, and oil filter replacement. Typical service intervals are 3,000 to 5,000 miles for light vehicles and 5,000 to 10,000 miles for heavy vehicles.
• PM C – Annual inspection in addition to PMs A and B. Includes front end alignment, scheduled component replacement, and annual department of transportation inspection.
• PM D – PMs A, B, and C, and scheduled rebuild or replacement of major equipment component (engine, transmission, etc.). May include special maintenance such as winterization or summarization.
A primary component of a preventative maintenance plan includes engine oil. Engine oil performs critical functions that are necessary to maintain performance and maximize useful service life. With equipment operating in different environments, engine oil replacement intervals become important in maintaining quality equipment. Optimization of oil change intervals can be an effective way to save money and the environment. Not only can the number of oil changes be decreased and thereby reducing the amount of engine oil used, but the wear of the engine and its components, and the downtime of equipment can be decreased as well. Extending oil drain intervals without a carefully planned program is gambling with the life of the engine, therefore carefully planned programs need to be implemented (MacAllister Machinery 2014).
2.1 Engine Oils Engine oils are complex mixtures of base oils and additives designed to perform a variety of tasks such as reducing engine wear, helping to prevent deposits that form from internal engine components, and lubricating moving parts (PennzOil 2014). Engine oil is a formulated blend of base oils and additives that are designed to meet required performance criteria. The primary component of engine oil is base oil, which typically comprises between 75 and 99 percent of the oil by volume (Basu et al. 2000). Engine oil is termed either mineral or synthetic oil depending on the process by which the base oil is derived. Mineral oil, also known as conventional oil, is a petroleum based oil derived from crude oil. Synthetic oil is derived from a polyalphaolefin (PAO) base oil, which is a synthesized hydrocarbon. Synthetic oils have high viscosity indices and superior cold flow characteristics (Bergstra et al. 1998). To enhance engine oil performance,
3
additives are used. Additives are commonly friction and wear modifiers, antioxidants and corrosion inhibitors, and detergents (Caines and Haycock 1996). Another function of engine oil is to act as a cleaning agent in the engine by flushing contaminants from critical components. Engine oil cleans and disperses sludge and oxidation that can buildup on piston rings and seals (Cummins 2007).
Degradation of engine oil occurs due to changes in the oil chemistry or changes in viscosity. Chemical degradation arises when chemical reactions between the base oils and oxygen, sulfur, and/or nitrogen occur to form harmful compounds, or through depletion of additives from reactions with contaminants such as air, metal particles from engine components, soot, fuel, and glycol (Jun et al. 2006). Viscosity degradation occurs due to either an increase or decrease in viscosity. A decrease in viscosity results from mechanical degradation, where as an increase in viscosity results from the intrusion of soot into the oil from blow-by (Troyer 1999).
The frequency of oil change is determined using one or more of the following parameters (Milwaukee 2008):
• Time – The most frequently used parameter for on-road equipment, where a service is determined using regular time intervals such as daily, monthly, quarterly, semi-annually or annually. Time is used as an indicator for service intervals if equipment travel distance is unknown.
• Mileage – A common method for on-road equipment used for service intervals, with scheduled services after a predetermined distance. Predetermined mileage service intervals are most effective when equipment is used for the same application, or for vehicles that have high mileage applications.
• Hours – A method for off-road equipment, where predetermined service intervals are based off hours of use is for vehicles/equipment that have high hourly rates, without having a demand for high mileage use. Engine hours often indicate trends in wear and are often used for PM intervals.
• Fuel Consumption – The use of fuel consumption is another method to determine service frequency for off-road equipment. This method realistically reflects engine wear, especially when combined with recorded travel distance and operating hours.
2.2 Oil Bulk Properties and Contamination Engine oil has bulk properties that are formulated with a variety of additives to enhance the lubricity and to reduce the tendency for sludge and deposit formations. To access the amount of additives remaining in a used oil sample, the total base number and viscosity are checked. A reduction of the total base number indicates that the additives are being depleted and the oil is becoming acidic. Whereas the measure of degrading viscosity indicates that the oil has reached its useful life (Tribology 2004).
Total base number (TBN) quantifies the alkalinity of an oil. Engine oils have high alkalinity levels to neutralize the acids generated by combustion or blow-by. When the alkalinity of the oil is depleted, the oil can become very acidic and corrode engine parts (Fitch and Troyer 2010). Engine oils that are designed for extended operations to perform in severe conditions are produced with higher alkalinity levels. High alkalinities allow the engine oil to avoid corrosion in oil-wetted parts of the engine.
4
Viscosity is defined as resistance to flow. Viscosity change can result in either physical change or contamination by other fluids (Exxon Mobil 2009). Increase of viscosity can result in loss of wear protection which comes from primarily high-temperatures and high-load service. Decrease in viscosity can cause corrosion or sludge in the engine, which is primarily caused from winter conditions or repeated short-trips. The most common viscosity test is at 100C and is recorded in centistokes (cSt).
Wear metal analysis can indicate which engine components are wearing at an excessive rate to alert when the wearing is becoming significant. Wear metals are represented in parts per million (ppm). The most common elements found in an engine are iron, aluminum, chromium, lead and copper (Tribology 2004). Wear metals vary with the engine type and oil product. They are also dependent on engine speed and air charging. Wear metals should be evaluated for trends such as increasing, decreasing, and sudden or gradual change (Stauffer 2014).
• Iron - Increasing levels of iron may indicate wear from shafts, piston rings, and gears. Iron can originate from the “break-in” of the engine, or from rust particles in the cooling system, causing them to leak into the engine.
• Aluminum - The main sources that cause an increase in aluminum levels are scorning or burning of the aluminum pistons, aluminum bearing wear, or dirt contamination to aluminum parts causing abrasion.
• Chromium – An increase in chromium levels occurs when water is present, or even if there is a cooling leak in the engine. Chrome plated pistons rings or valves can cause an increase in the particle count. This increase can also be caused by engine wear or scoring and scuffing of the piston rings.
• Copper - Increase of copper can come from bearing wear, which may be in conjunction with the main bearing and connecting rods, pistons pins, and camshaft. The presence of glycol attacks the copper components causing them to break down.
Fuel dilution comes primarily from blow-by, which occurs in the crankcase of the engine as well as from extended oil drain intervals, improper operation, or engine malfunction. Fuel dilution can cause premature oxidation, which affects the stable hydrocarbons of the oil. It can lead to the formation of sludge, increased viscosity, or acid increase in the engine. If blow-by occurs and fuel along with soot is present in the oil, oil viscosity may increase due to the heavy soot molecules in the oil. Whereas if raw fuel is being leaked into the oil, the viscosity decreases. If fuel dilution is 10 percent of the engine oil, it will cause a 10 percent loss in any additives to the oil and a reduction in viscosity by more than 36 percent (Fitch and Troyer 2010). Two tests can be performed to obtain information on fuel dilution. The first test is flash point testing. If the flash point has a reduction of 20 to 30C, this means that the oil sample has critical fuel dilution. The second test is with an FTIR spectroscopy, where infrared energy is used to detect the presence of fuel in lubricants (Fitch and Troyer 2010).
Water contamination is one of the most destructive contaminants that can cause engine oil to fail, resulting in engine component failure. When water reacts with additives, it can form precipitants and aggressive chemical by-products through hydrolysis. Water also increases the rate of oxidation, which produces chemically unstable compounds and promotes the creation of corrosive acids, resins, and sludge. These can accumulate in piping, coolers, filters, valves, and oil reservoirs. (Fitch and Troyer 2010). Water contamination weakens the load-bearing strength of
5
the oil; leading to premature wear of bearings, gears, and pistons. (Fitch and Troyer 2010). There are two ways with which to test for water contamination; the Karl Fisher Test (ASTM D1744) and by distillation (ASTM D95) (Kaleli and Khorramian 1998).
Silicon can accumulate from dust, dirt or silicon-based gaskets (Evans 2012). Elevated silicon levels usually come from dirt contamination caused by faulty intake filtration (Cummins 2007). It can also result from low oil levels, contamination from engine work, and leaks in piping (Stauffer 2014). Silicon particles are non-metal, but are abrasive to the engine components (Balmes 2011). Dirt or dust is not purely composed of silicon dioxide, but includes many other compounds. Another compound that is commonly found in dirt is aluminum trioxide. If dirt is identified in an oil analysis reading then an increase in the aluminum particle count should be expected. Since dirt is abrasive, an increase in general wear should be seen in the analysis along with an increase in iron, chromium, lead, and copper. If silicon increases, but aluminum does not increase, then dirt is not the source of silicon (Evans 2012).
Soot is a solid contamination which can be both suspended and non-suspended in the oil. When the soot levels are too high, this can cause the oil’s viscosity to increase or prematurely breakdown and promote engine wear. This breakdown and increase in viscosity can also lead to clogged pipe lines and filters (Stauffer 2014). Soot contamination is caused by irregular injection timing, blow-by, or burning fuel that is mixed with oil on the cylinder liner (Cummins 2007). When the additives are depleted, the soot particles attach to each other to make larger particles. This can influence valve and injection wear to occur at an accelerated rate. When these rates are increased, this can lead to elevated levels of iron in the metal count (Cummins 2007). Soot percentage can be measured using a Fourier Transform Infrared (FTIR) spectroscopy, optical soot meters, or viscosity test. The FTIR spectroscopy test uses infrared energy because soot absorbs it. (Fitch and Troyer 2010).
Glycol, also known as ethylene or propylene glycol, is a combination of antifreeze and water that can enter into the engine system (AMSOIL 2010). It can cause engine seizures, engine failure, and oil starvation if not detected at an early stage. Glycol can enter through the coolant system due to cracks in the engine head and liner, or failures in O-rings and gaskets. This can occur while the engine is running or when the engine is cooling after shutdown (Stauffer 2014). Elevated levels of glycol are not always detected because it can react with certain additives and boil off at operating temperatures. Deteriorated glycol, which forms at normal engine operating temperatures, reacts with bearing and bushing materials to form elevated levels of lead in the oil (Cummins 2007). Glycol can rapidly attack copper, which can be found in bearings, and cause early bearing failure. Glycol also causes increased viscosity, the formation of gels and emulsions, increased oxidation, and the formation of “oil balls” that are hard and abrasive (Fitch and Troyer 2010). Tests that can be used to determine if glycol is present in an oil sample are elemental spectroscopy test, viscosity test and an onsite test using the Schiff’s Reagent Method (ASTM D2982) (Fitch and Troyer 2010).
2.3 Extending Drain Intervals Due to the contaminants that are present in engine oil, it is generally suggested that it should be changed at regular intervals, but there has been little research evaluating the possibility of extending these intervals.
6
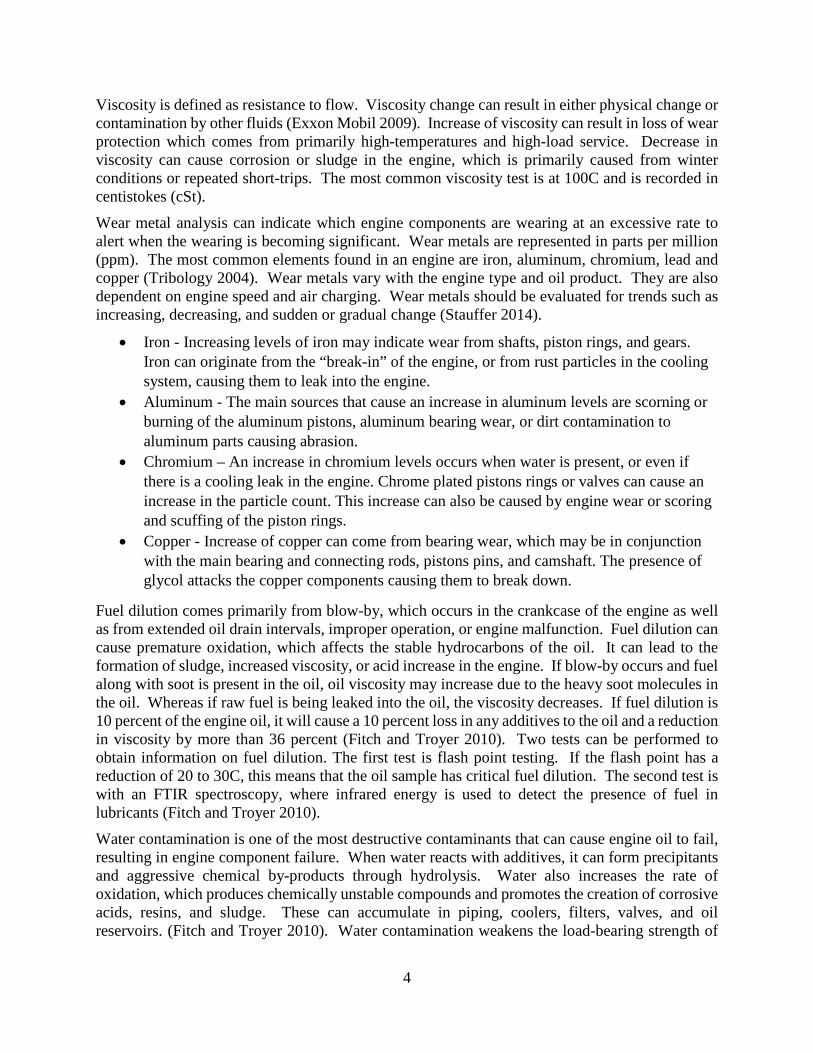
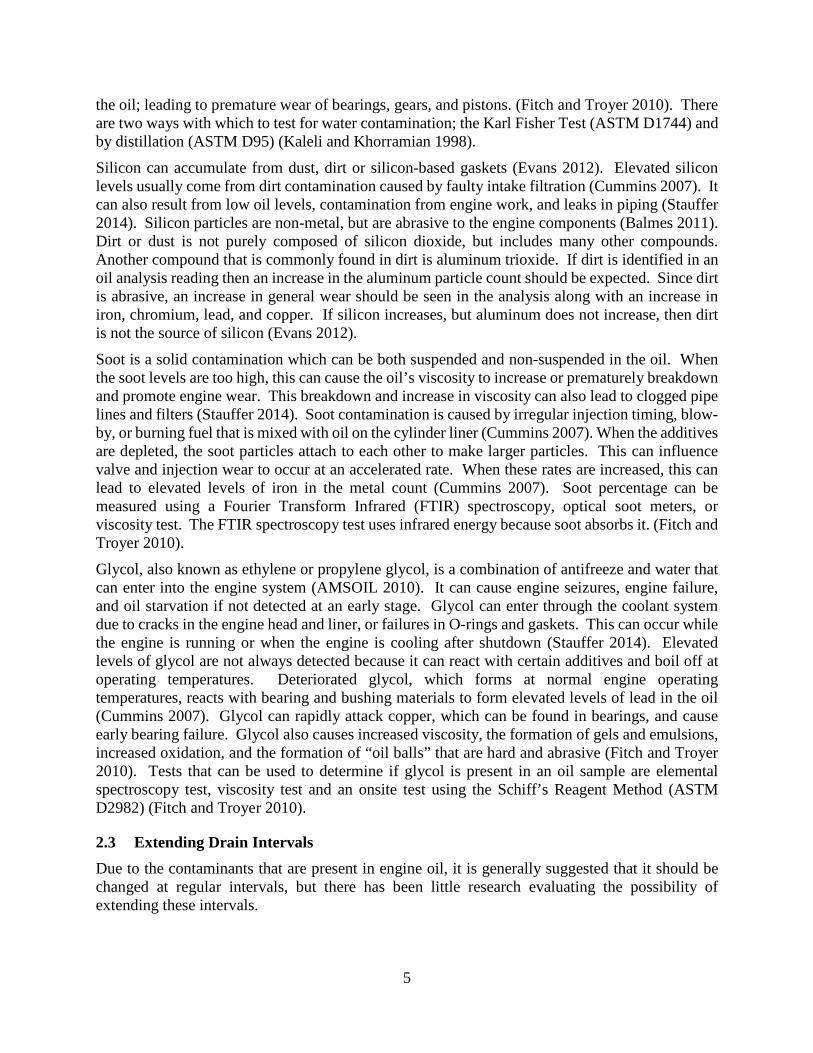
Hosie and Lawrence (1979) investigated extending engine oil drain intervals in a fleet of large off-highway vehicles engaged in open-cast mining operations. The test consisted of using 12 100-ton haul trucks, six with engines that had more than 3,000 hours and six fitted with newly-rebuilt engines. These trucks were operated 1,500 hours without an oil change, five times the original equipment manufacturers service recommendation, with engine oil samples taken every 80 hours while idling. The oil analysis data consisted of the qualitative assessment of alkalinity (total base number), contaminations and viscosity, by oil-spot test, and fuel dilution. Wear metals (iron, chromium, copper, and lead) and air-borne contaminants (silicon) were tested using spectrophotometry (Hosie and Lawrence 1979). Figures 2.1 and 2.2 show the quantitative results from the 12 tested trucks.
Figure 2.1: Total base number with respect to hours operated (Hosie and Lawrence 1979)
The authors concluded that there were no discernable differences in engine performance between the trucks with normal drain intervals and trucks with extended intervals. They further concluded that the severe contamination was caused by fuel dilution, coolant, and abrasion, which are largely controlled by engine maintenance. This reduction of engine oil changes could potentially reduce the annual oil consumption by 50 percent, as well as a reduction in the cost associated with the disposal of waste oil. Other potential savings in maintenance costs and equipment downtime were found in conjunction with the extended oil drain intervals (Hosie and Lawrence 1979).
Figure 2.2: Iron (ppm) with respect to hours operated (Hosie and Lawrence 1979)
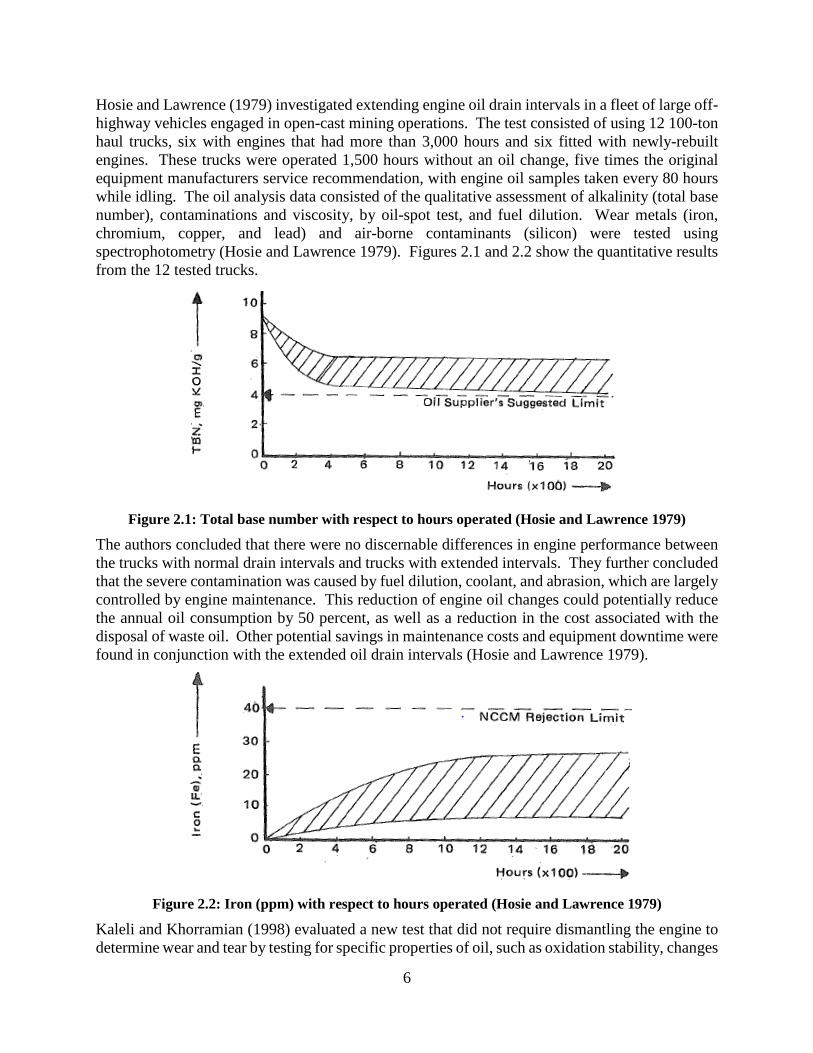
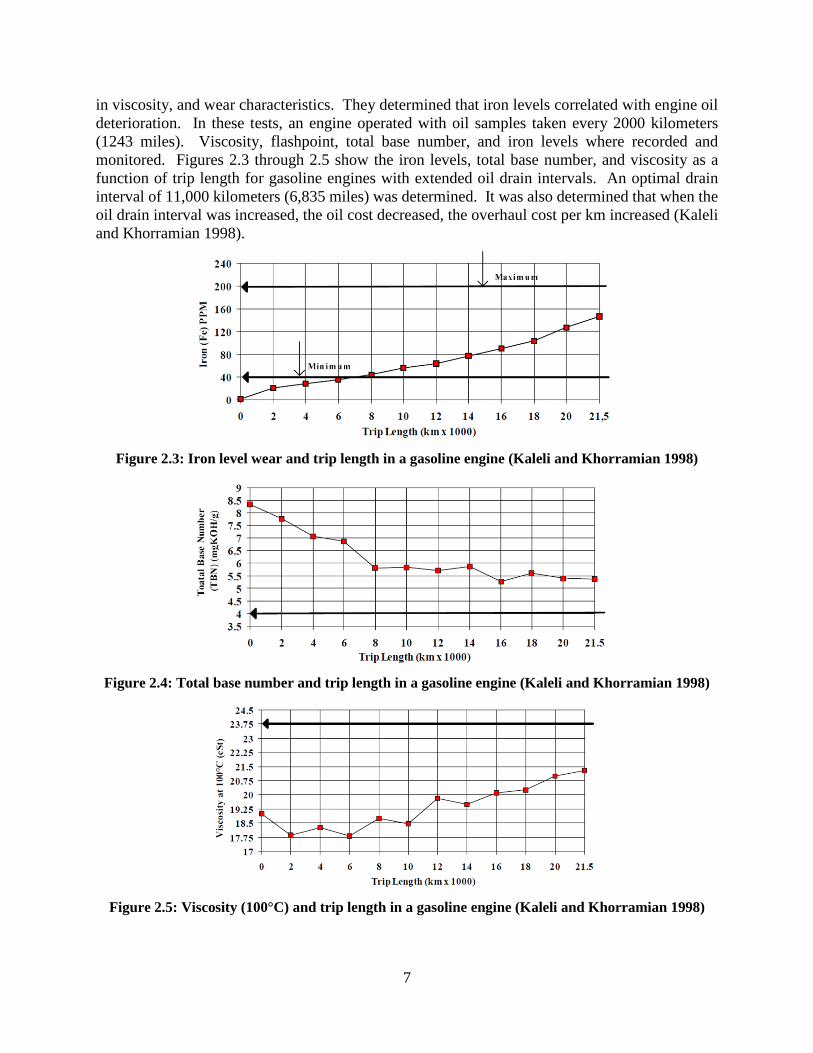
Kaleli and Khorramian (1998) evaluated a new test that did not require dismantling the engine to determine wear and tear by testing for specific properties of oil, such as oxidation stability, changes
7
in viscosity, and wear characteristics. They determined that iron levels correlated with engine oil deterioration. In these tests, an engine operated with oil samples taken every 2000 kilometers (1243 miles). Viscosity, flashpoint, total base number, and iron levels where recorded and monitored. Figures 2.3 through 2.5 show the iron levels, total base number, and viscosity as a function of trip length for gasoline engines with extended oil drain intervals. An optimal drain interval of 11,000 kilometers (6,835 miles) was determined. It was also determined that when the oil drain interval was increased, the oil cost decreased, the overhaul cost per km increased (Kaleli and Khorramian 1998).
Figure 2.3: Iron level wear and trip length in a gasoline engine (Kaleli and Khorramian 1998)
Figure 2.4: Total base number and trip length in a gasoline engine (Kaleli and Khorramian 1998)
Figure 2.5: Viscosity (100°C) and trip length in a gasoline engine (Kaleli and Khorramian 1998)
8
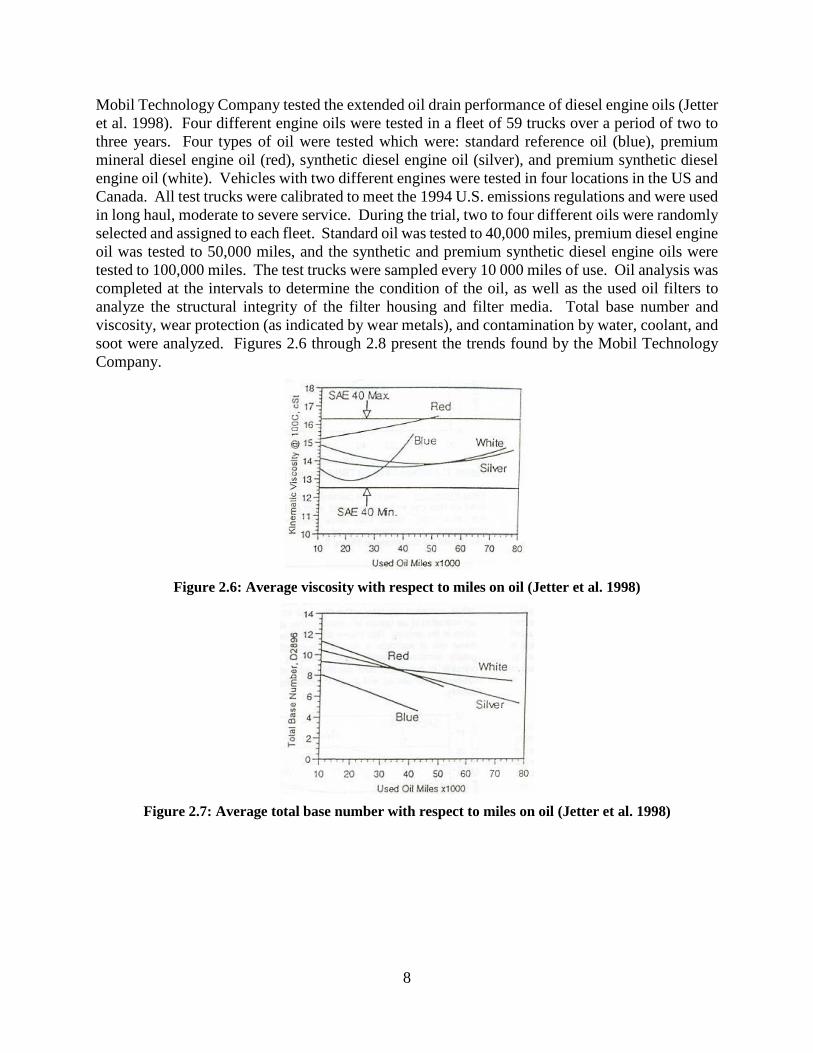
Mobil Technology Company tested the extended oil drain performance of diesel engine oils (Jetter et al. 1998). Four different engine oils were tested in a fleet of 59 trucks over a period of two to three years. Four types of oil were tested which were: standard reference oil (blue), premium mineral diesel engine oil (red), synthetic diesel engine oil (silver), and premium synthetic diesel engine oil (white). Vehicles with two different engines were tested in four locations in the US and Canada. All test trucks were calibrated to meet the 1994 U.S. emissions regulations and were used in long haul, moderate to severe service. During the trial, two to four different oils were randomly selected and assigned to each fleet. Standard oil was tested to 40,000 miles, premium diesel engine oil was tested to 50,000 miles, and the synthetic and premium synthetic diesel engine oils were tested to 100,000 miles. The test trucks were sampled every 10 000 miles of use. Oil analysis was completed at the intervals to determine the condition of the oil, as well as the used oil filters to analyze the structural integrity of the filter housing and filter media. Total base number and viscosity, wear protection (as indicated by wear metals), and contamination by water, coolant, and soot were analyzed. Figures 2.6 through 2.8 present the trends found by the Mobil Technology Company.
Figure 2.6: Average viscosity with respect to miles on oil (Jetter et al. 1998)
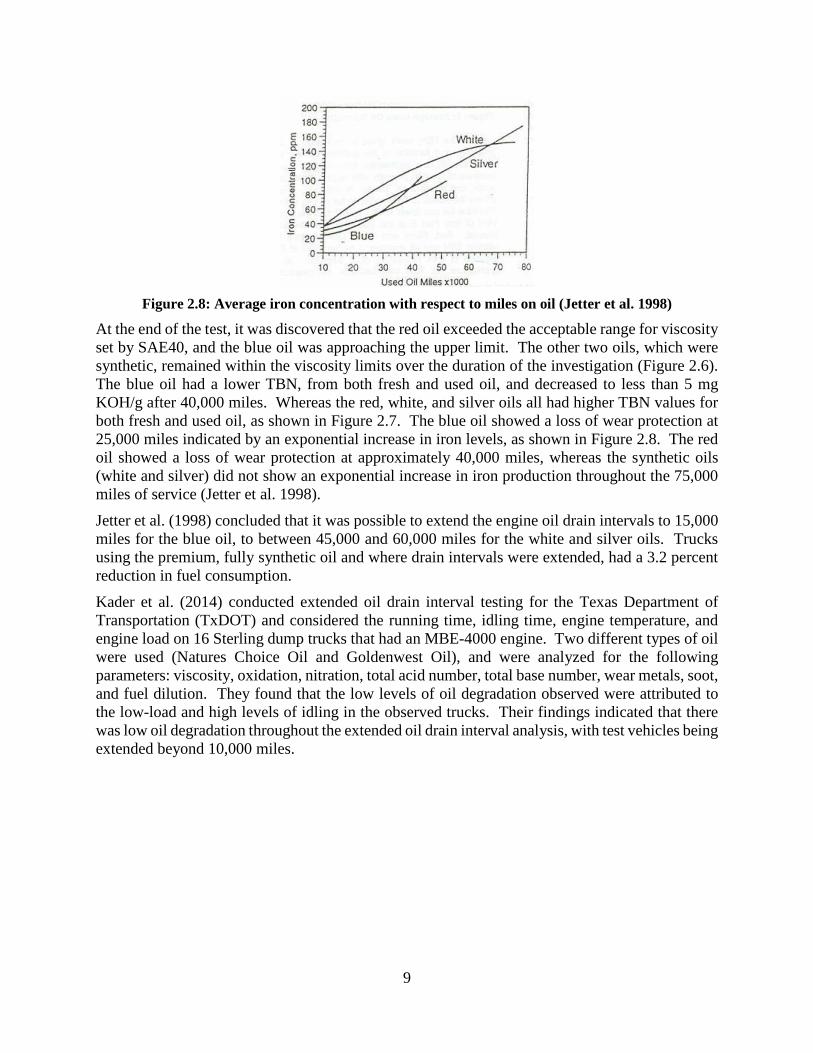
Figure 2.7: Average total base number with respect to miles on oil (Jetter et al. 1998)
9
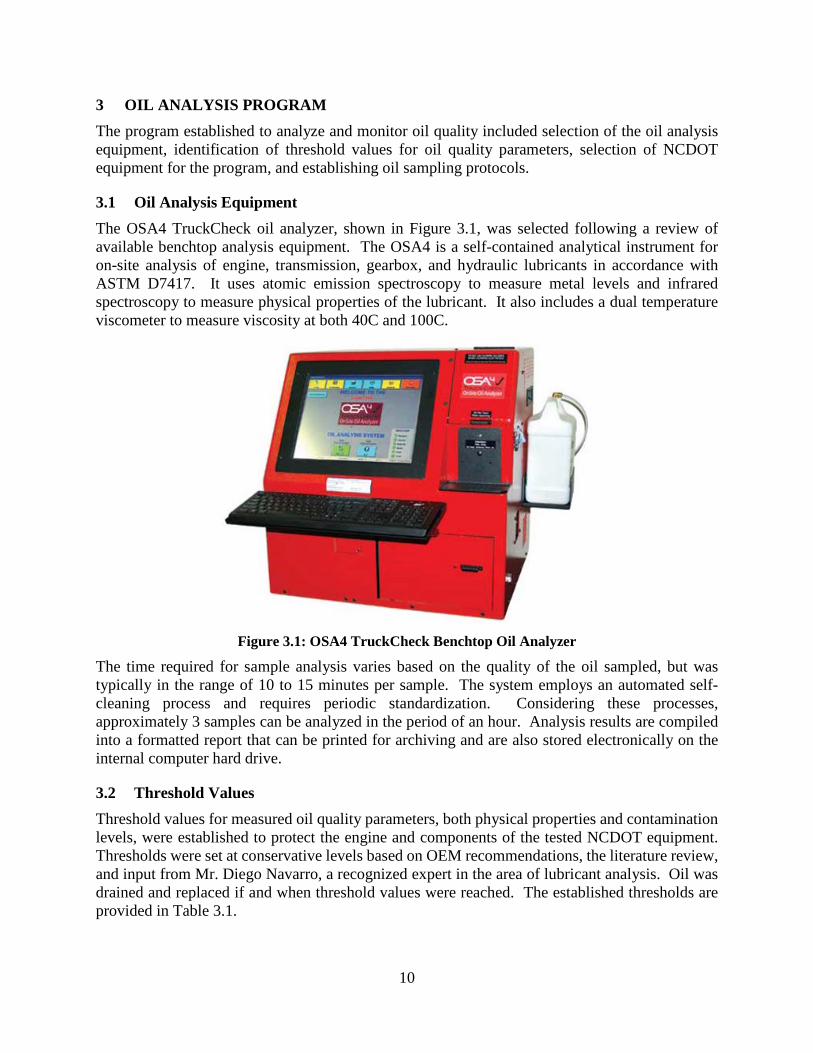
Figure 2.8: Average iron concentration with respect to miles on oil (Jetter et al. 1998)
At the end of the test, it was discovered that the red oil exceeded the acceptable range for viscosity set by SAE40, and the blue oil was approaching the upper limit. The other two oils, which were synthetic, remained within the viscosity limits over the duration of the investigation (Figure 2.6). The blue oil had a lower TBN, from both fresh and used oil, and decreased to less than 5 mg KOH/g after 40,000 miles. Whereas the red, white, and silver oils all had higher TBN values for both fresh and used oil, as shown in Figure 2.7. The blue oil showed a loss of wear protection at 25,000 miles indicated by an exponential increase in iron levels, as shown in Figure 2.8. The red oil showed a loss of wear protection at approximately 40,000 miles, whereas the synthetic oils (white and silver) did not show an exponential increase in iron production throughout the 75,000 miles of service (Jetter et al. 1998).
Jetter et al. (1998) concluded that it was possible to extend the engine oil drain intervals to 15,000 miles for the blue oil, to between 45,000 and 60,000 miles for the white and silver oils. Trucks using the premium, fully synthetic oil and where drain intervals were extended, had a 3.2 percent reduction in fuel consumption.
Kader et al. (2014) conducted extended oil drain interval testing for the Texas Department of Transportation (TxDOT) and considered the running time, idling time, engine temperature, and engine load on 16 Sterling dump trucks that had an MBE-4000 engine. Two different types of oil were used (Natures Choice Oil and Goldenwest Oil), and were analyzed for the following parameters: viscosity, oxidation, nitration, total acid number, total base number, wear metals, soot, and fuel dilution. They found that the low levels of oil degradation observed were attributed to the low-load and high levels of idling in the observed trucks. Their findings indicated that there was low oil degradation throughout the extended oil drain interval analysis, with test vehicles being extended beyond 10,000 miles.
10
3 OIL ANALYSIS PROGRAM The program established to analyze and monitor oil quality included selection of the oil analysis equipment, identification of threshold values for oil quality parameters, selection of NCDOT equipment for the program, and establishing oil sampling protocols.
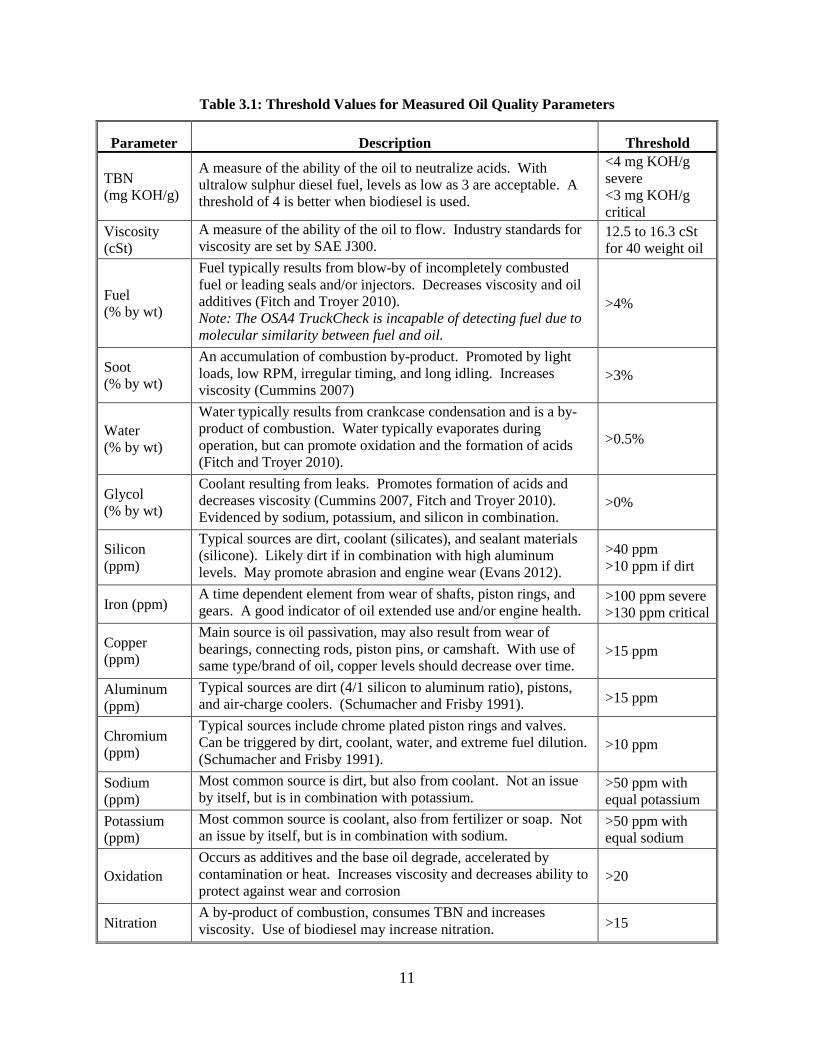
3.1 Oil Analysis Equipment The OSA4 TruckCheck oil analyzer, shown in Figure 3.1, was selected following a review of available benchtop analysis equipment. The OSA4 is a self-contained analytical instrument for on-site analysis of engine, transmission, gearbox, and hydraulic lubricants in accordance with ASTM D7417. It uses atomic emission spectroscopy to measure metal levels and infrared spectroscopy to measure physical properties of the lubricant. It also includes a dual temperature viscometer to measure viscosity at both 40C and 100C.
Figure 3.1: OSA4 TruckCheck Benchtop Oil Analyzer
The time required for sample analysis varies based on the quality of the oil sampled, but was typically in the range of 10 to 15 minutes per sample. The system employs an automated self-cleaning process and requires periodic standardization. Considering these processes, approximately 3 samples can be analyzed in the period of an hour. Analysis results are compiled into a formatted report that can be printed for archiving and are also stored electronically on the internal computer hard drive.
3.2 Threshold Values Threshold values for measured oil quality parameters, both physical properties and contamination levels, were established to protect the engine and components of the tested NCDOT equipment. Thresholds were set at conservative levels based on OEM recommendations, the literature review, and input from Mr. Diego Navarro, a recognized expert in the area of lubricant analysis. Oil was drained and replaced if and when threshold values were reached. The established thresholds are provided in Table 3.1.
11
Table 3.1: Threshold Values for Measured Oil Quality Parameters
Parameter Description Threshold
TBN (mg KOH/g)
A measure of the ability of the oil to neutralize acids. With ultralow sulphur diesel fuel, levels as low as 3 are acceptable. A threshold of 4 is better when biodiesel is used.
<4 mg KOH/g severe <3 mg KOH/g critical
Viscosity (cSt)
A measure of the ability of the oil to flow. Industry standards for viscosity are set by SAE J300.
12.5 to 16.3 cSt for 40 weight oil
Fuel (% by wt)
Fuel typically results from blow-by of incompletely combusted fuel or leading seals and/or injectors. Decreases viscosity and oil additives (Fitch and Troyer 2010). Note: The OSA4 TruckCheck is incapable of detecting fuel due to molecular similarity between fuel and oil.
>4%
Soot (% by wt)
An accumulation of combustion by-product. Promoted by light loads, low RPM, irregular timing, and long idling. Increases viscosity (Cummins 2007)
>3%
Water (% by wt)
Water typically results from crankcase condensation and is a by-product of combustion. Water typically evaporates during operation, but can promote oxidation and the formation of acids (Fitch and Troyer 2010).
>0.5%
Glycol (% by wt)
Coolant resulting from leaks. Promotes formation of acids and decreases viscosity (Cummins 2007, Fitch and Troyer 2010). Evidenced by sodium, potassium, and silicon in combination.
>0%
Silicon (ppm)
Typical sources are dirt, coolant (silicates), and sealant materials (silicone). Likely dirt if in combination with high aluminum levels. May promote abrasion and engine wear (Evans 2012).
>40 ppm >10 ppm if dirt
Iron (ppm) A time dependent element from wear of shafts, piston rings, and gears. A good indicator of oil extended use and/or engine health.
>100 ppm severe >130 ppm critical
Copper (ppm)
Main source is oil passivation, may also result from wear of bearings, connecting rods, piston pins, or camshaft. With use of same type/brand of oil, copper levels should decrease over time.
>15 ppm
Aluminum (ppm)
Typical sources are dirt (4/1 silicon to aluminum ratio), pistons, and air-charge coolers. (Schumacher and Frisby 1991). >15 ppm
Chromium (ppm)
Typical sources include chrome plated piston rings and valves. Can be triggered by dirt, coolant, water, and extreme fuel dilution. (Schumacher and Frisby 1991).
>10 ppm
Sodium (ppm)
Most common source is dirt, but also from coolant. Not an issue by itself, but is in combination with potassium.
>50 ppm with equal potassium
Potassium (ppm)
Most common source is coolant, also from fertilizer or soap. Not an issue by itself, but is in combination with sodium.
>50 ppm with equal sodium
Oxidation Occurs as additives and the base oil degrade, accelerated by contamination or heat. Increases viscosity and decreases ability to protect against wear and corrosion
>20
Nitration A by-product of combustion, consumes TBN and increases viscosity. Use of biodiesel may increase nitration. >15
12
It is important to note that the threshold values for contaminants are general values that may be applied across a fleet of varied equipment. Truly critical values for metals such as iron, aluminum, and chromium are dependent on the sump capacity and normal operating conditions of specific engines.
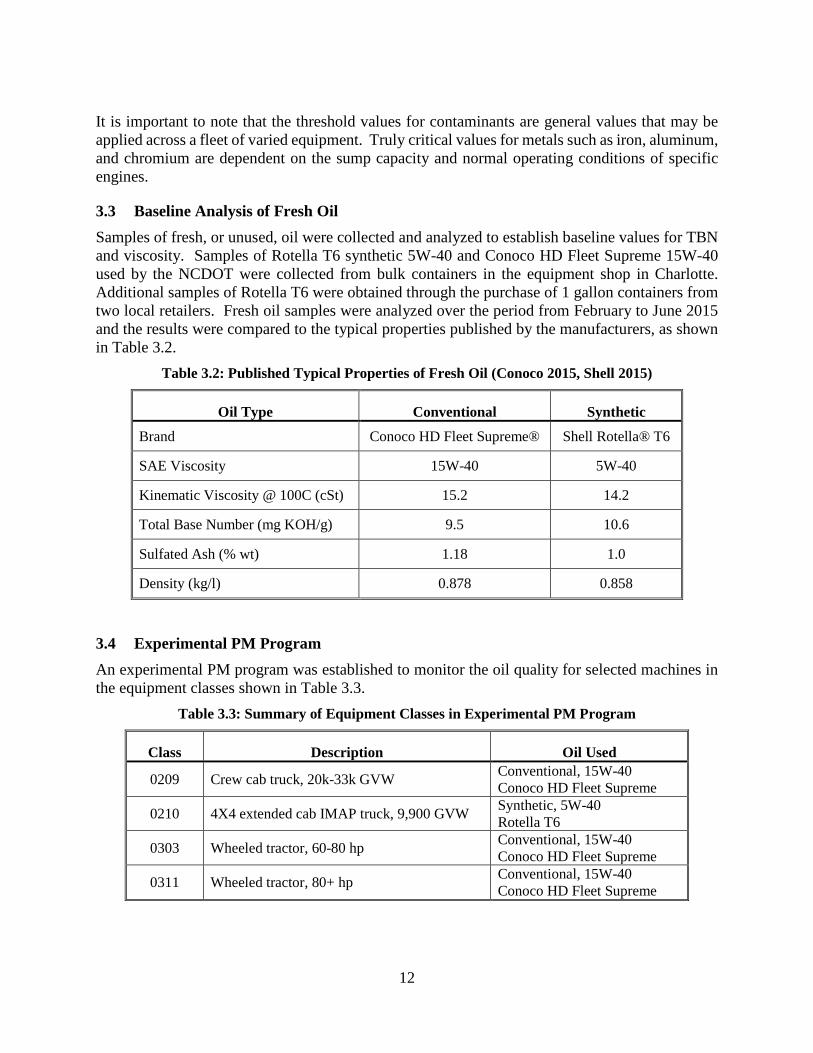
3.3 Baseline Analysis of Fresh Oil Samples of fresh, or unused, oil were collected and analyzed to establish baseline values for TBN and viscosity. Samples of Rotella T6 synthetic 5W-40 and Conoco HD Fleet Supreme 15W-40 used by the NCDOT were collected from bulk containers in the equipment shop in Charlotte. Additional samples of Rotella T6 were obtained through the purchase of 1 gallon containers from two local retailers. Fresh oil samples were analyzed over the period from February to June 2015 and the results were compared to the typical properties published by the manufacturers, as shown in Table 3.2.
Table 3.2: Published Typical Properties of Fresh Oil (Conoco 2015, Shell 2015)
Oil Type Conventional Synthetic
Brand Conoco HD Fleet Supreme® Shell Rotella® T6
SAE Viscosity 15W-40 5W-40
Kinematic Viscosity @ 100C (cSt) 15.2 14.2
Total Base Number (mg KOH/g) 9.5 10.6
Sulfated Ash (% wt) 1.18 1.0
Density (kg/l) 0.878 0.858
3.4 Experimental PM Program An experimental PM program was established to monitor the oil quality for selected machines in the equipment classes shown in Table 3.3.
Table 3.3: Summary of Equipment Classes in Experimental PM Program
Class Description Oil Used
0209 Crew cab truck, 20k-33k GVW Conventional, 15W-40 Conoco HD Fleet Supreme
0210 4X4 extended cab IMAP truck, 9,900 GVW Synthetic, 5W-40 Rotella T6
0303 Wheeled tractor, 60-80 hp Conventional, 15W-40 Conoco HD Fleet Supreme
0311 Wheeled tractor, 80+ hp Conventional, 15W-40 Conoco HD Fleet Supreme
13
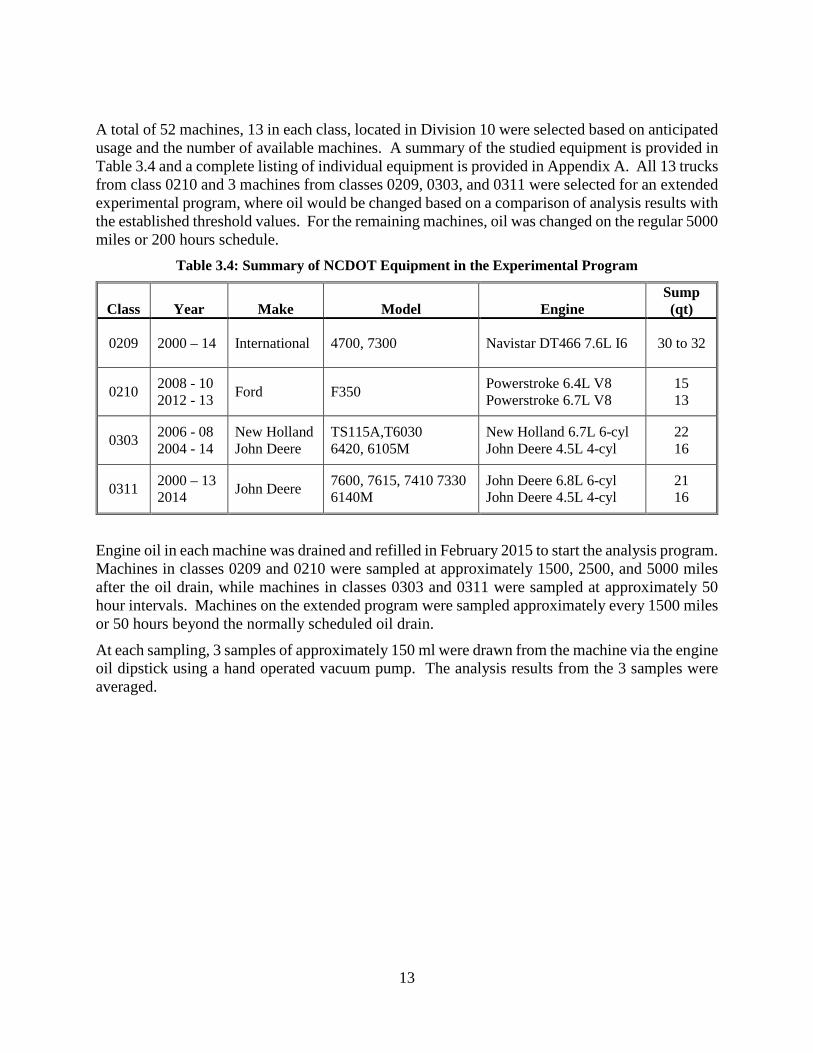
A total of 52 machines, 13 in each class, located in Division 10 were selected based on anticipated usage and the number of available machines. A summary of the studied equipment is provided in Table 3.4 and a complete listing of individual equipment is provided in Appendix A. All 13 trucks from class 0210 and 3 machines from classes 0209, 0303, and 0311 were selected for an extended experimental program, where oil would be changed based on a comparison of analysis results with the established threshold values. For the remaining machines, oil was changed on the regular 5000 miles or 200 hours schedule.
Table 3.4: Summary of NCDOT Equipment in the Experimental Program
Class Year Make Model Engine Sump (qt)
0209 2000 – 14 International 4700, 7300 Navistar DT466 7.6L I6 30 to 32
0210 2008 - 10 2012 - 13 Ford F350 Powerstroke 6.4L V8
Powerstroke 6.7L V8 15 13
0303 2006 - 08 2004 - 14
New Holland John Deere
TS115A,T6030 6420, 6105M
New Holland 6.7L 6-cyl John Deere 4.5L 4-cyl
22 16
0311 2000 – 13 2014 John Deere 7600, 7615, 7410 7330
6140M John Deere 6.8L 6-cyl John Deere 4.5L 4-cyl
21 16
Engine oil in each machine was drained and refilled in February 2015 to start the analysis program. Machines in classes 0209 and 0210 were sampled at approximately 1500, 2500, and 5000 miles after the oil drain, while machines in classes 0303 and 0311 were sampled at approximately 50 hour intervals. Machines on the extended program were sampled approximately every 1500 miles or 50 hours beyond the normally scheduled oil drain.
At each sampling, 3 samples of approximately 150 ml were drawn from the machine via the engine oil dipstick using a hand operated vacuum pump. The analysis results from the 3 samples were averaged.
14
4 OIL ANALYSIS RESULTS The samples of fresh and used oil collected and the OSA4 TruckCheck analyzer used to measure physical and chemical parameters, as well as to assess the level of contamination.
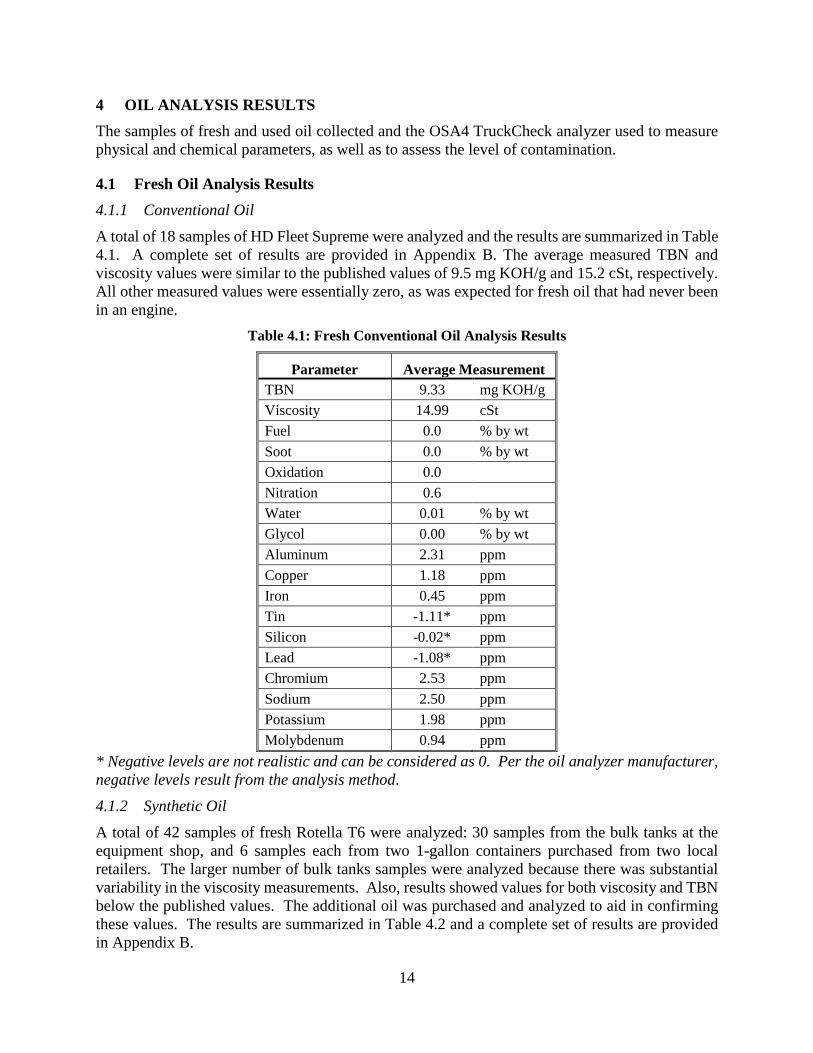
4.1 Fresh Oil Analysis Results 4.1.1 Conventional Oil A total of 18 samples of HD Fleet Supreme were analyzed and the results are summarized in Table 4.1. A complete set of results are provided in Appendix B. The average measured TBN and viscosity values were similar to the published values of 9.5 mg KOH/g and 15.2 cSt, respectively. All other measured values were essentially zero, as was expected for fresh oil that had never been in an engine.
Table 4.1: Fresh Conventional Oil Analysis Results
Parameter Average Measurement TBN 9.33 mg KOH/g Viscosity 14.99 cSt Fuel 0.0 % by wt Soot 0.0 % by wt Oxidation 0.0 Nitration 0.6 Water 0.01 % by wt Glycol 0.00 % by wt Aluminum 2.31 ppm Copper 1.18 ppm Iron 0.45 ppm Tin -1.11* ppm Silicon -0.02* ppm Lead -1.08* ppm Chromium 2.53 ppm Sodium 2.50 ppm Potassium 1.98 ppm Molybdenum 0.94 ppm
* Negative levels are not realistic and can be considered as 0. Per the oil analyzer manufacturer, negative levels result from the analysis method.
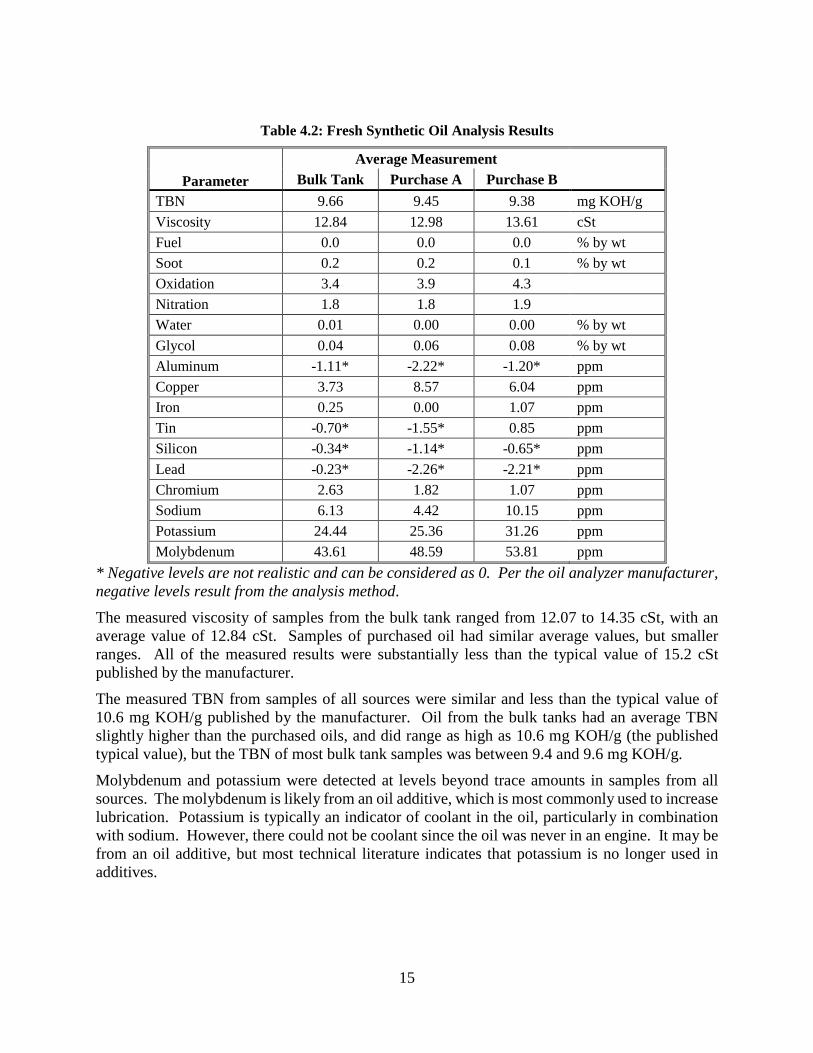
4.1.2 Synthetic Oil A total of 42 samples of fresh Rotella T6 were analyzed: 30 samples from the bulk tanks at the equipment shop, and 6 samples each from two 1-gallon containers purchased from two local retailers. The larger number of bulk tanks samples were analyzed because there was substantial variability in the viscosity measurements. Also, results showed values for both viscosity and TBN below the published values. The additional oil was purchased and analyzed to aid in confirming these values. The results are summarized in Table 4.2 and a complete set of results are provided in Appendix B.
15
Table 4.2: Fresh Synthetic Oil Analysis Results
Parameter Average Measurement
Bulk Tank Purchase A Purchase B TBN 9.66 9.45 9.38 mg KOH/g Viscosity 12.84 12.98 13.61 cSt Fuel 0.0 0.0 0.0 % by wt Soot 0.2 0.2 0.1 % by wt Oxidation 3.4 3.9 4.3 Nitration 1.8 1.8 1.9 Water 0.01 0.00 0.00 % by wt Glycol 0.04 0.06 0.08 % by wt Aluminum -1.11* -2.22* -1.20* ppm Copper 3.73 8.57 6.04 ppm Iron 0.25 0.00 1.07 ppm Tin -0.70* -1.55* 0.85 ppm Silicon -0.34* -1.14* -0.65* ppm Lead -0.23* -2.26* -2.21* ppm Chromium 2.63 1.82 1.07 ppm Sodium 6.13 4.42 10.15 ppm Potassium 24.44 25.36 31.26 ppm Molybdenum 43.61 48.59 53.81 ppm
* Negative levels are not realistic and can be considered as 0. Per the oil analyzer manufacturer, negative levels result from the analysis method.
The measured viscosity of samples from the bulk tank ranged from 12.07 to 14.35 cSt, with an average value of 12.84 cSt. Samples of purchased oil had similar average values, but smaller ranges. All of the measured results were substantially less than the typical value of 15.2 cSt published by the manufacturer.
The measured TBN from samples of all sources were similar and less than the typical value of 10.6 mg KOH/g published by the manufacturer. Oil from the bulk tanks had an average TBN slightly higher than the purchased oils, and did range as high as 10.6 mg KOH/g (the published typical value), but the TBN of most bulk tank samples was between 9.4 and 9.6 mg KOH/g.
Molybdenum and potassium were detected at levels beyond trace amounts in samples from all sources. The molybdenum is likely from an oil additive, which is most commonly used to increase lubrication. Potassium is typically an indicator of coolant in the oil, particularly in combination with sodium. However, there could not be coolant since the oil was never in an engine. It may be from an oil additive, but most technical literature indicates that potassium is no longer used in additives.
16
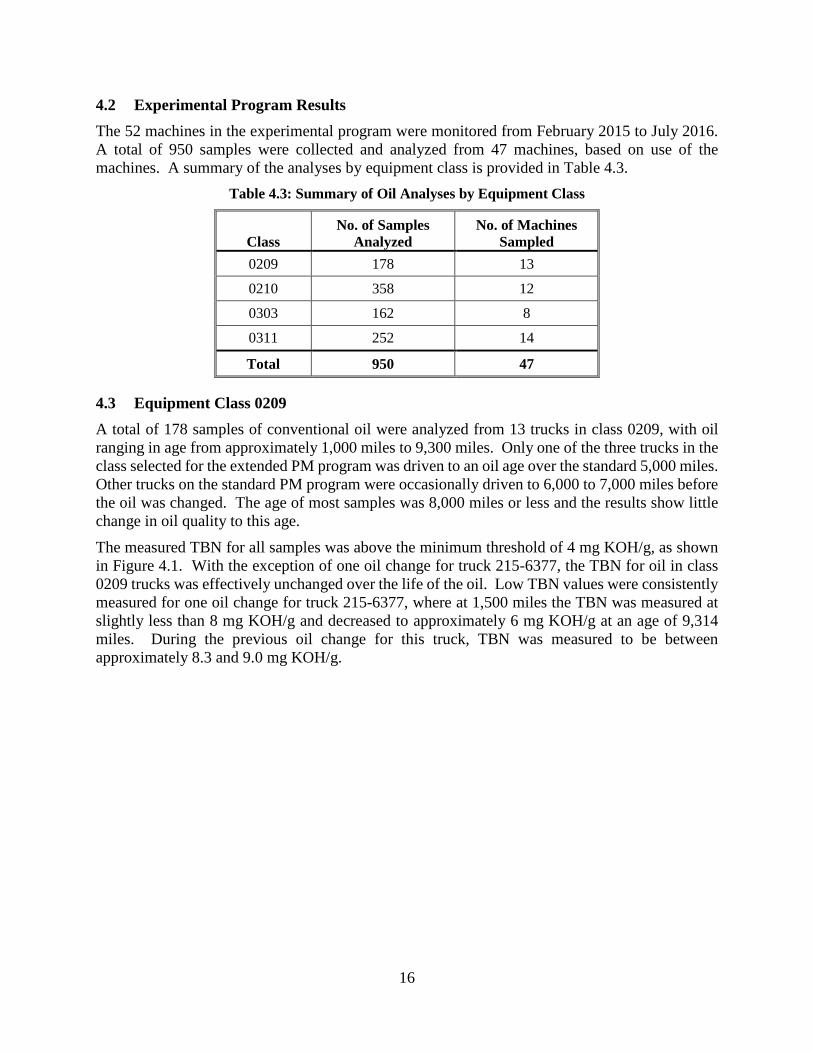
4.2 Experimental Program Results The 52 machines in the experimental program were monitored from February 2015 to July 2016. A total of 950 samples were collected and analyzed from 47 machines, based on use of the machines. A summary of the analyses by equipment class is provided in Table 4.3.
Table 4.3: Summary of Oil Analyses by Equipment Class
Class No. of Samples
Analyzed No. of Machines
Sampled 0209 178 13
0210 358 12
0303 162 8
0311 252 14
Total 950 47
4.3 Equipment Class 0209 A total of 178 samples of conventional oil were analyzed from 13 trucks in class 0209, with oil ranging in age from approximately 1,000 miles to 9,300 miles. Only one of the three trucks in the class selected for the extended PM program was driven to an oil age over the standard 5,000 miles. Other trucks on the standard PM program were occasionally driven to 6,000 to 7,000 miles before the oil was changed. The age of most samples was 8,000 miles or less and the results show little change in oil quality to this age.
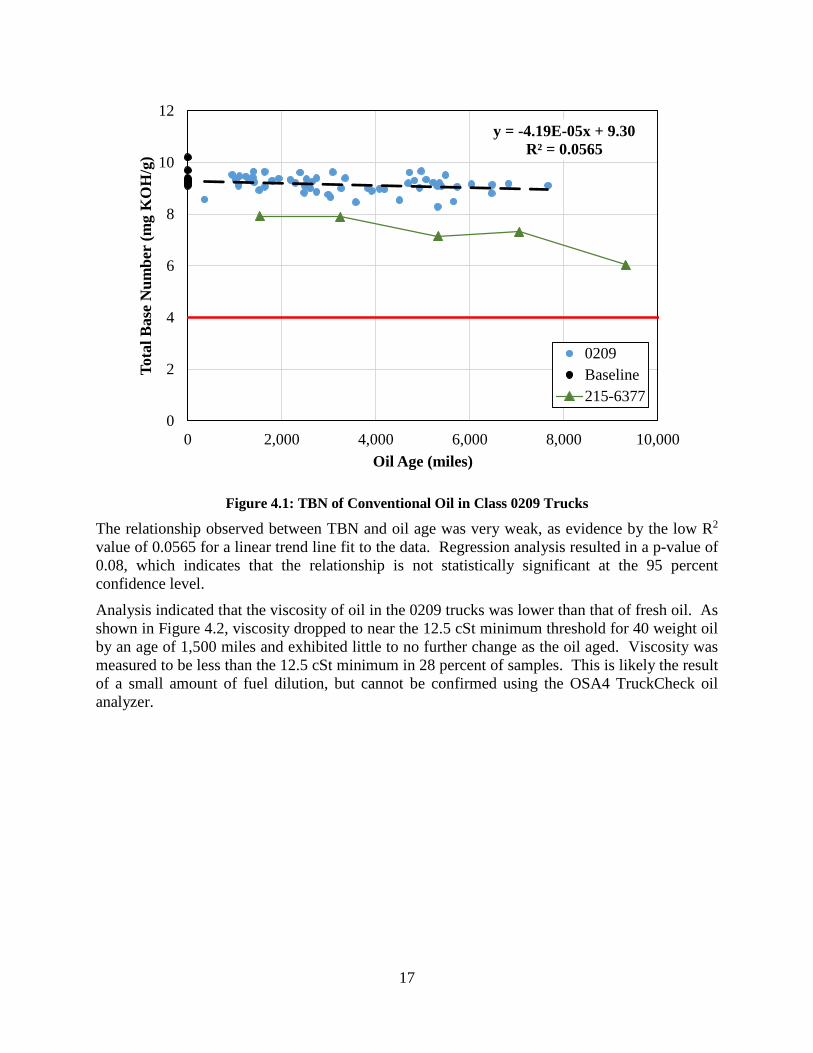
The measured TBN for all samples was above the minimum threshold of 4 mg KOH/g, as shown in Figure 4.1. With the exception of one oil change for truck 215-6377, the TBN for oil in class 0209 trucks was effectively unchanged over the life of the oil. Low TBN values were consistently measured for one oil change for truck 215-6377, where at 1,500 miles the TBN was measured at slightly less than 8 mg KOH/g and decreased to approximately 6 mg KOH/g at an age of 9,314 miles. During the previous oil change for this truck, TBN was measured to be between approximately 8.3 and 9.0 mg KOH/g.
17
Figure 4.1: TBN of Conventional Oil in Class 0209 Trucks
The relationship observed between TBN and oil age was very weak, as evidence by the low R2 value of 0.0565 for a linear trend line fit to the data. Regression analysis resulted in a p-value of 0.08, which indicates that the relationship is not statistically significant at the 95 percent confidence level.
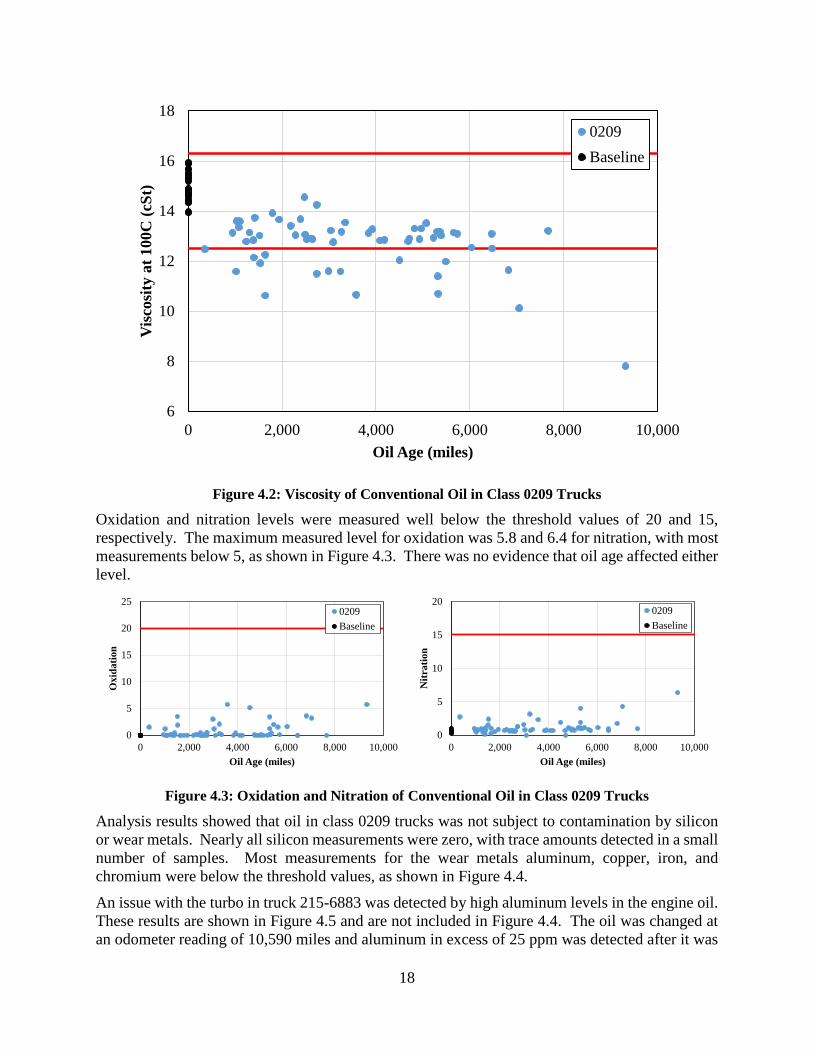
Analysis indicated that the viscosity of oil in the 0209 trucks was lower than that of fresh oil. As shown in Figure 4.2, viscosity dropped to near the 12.5 cSt minimum threshold for 40 weight oil by an age of 1,500 miles and exhibited little to no further change as the oil aged. Viscosity was measured to be less than the 12.5 cSt minimum in 28 percent of samples. This is likely the result of a small amount of fuel dilution, but cannot be confirmed using the OSA4 TruckCheck oil analyzer.
y = -4.19E-05x + 9.30R² = 0.0565
0
2
4
6
8
10
12
0 2,000 4,000 6,000 8,000 10,000
Tota
l Bas
e N
umbe
r (m
g K
OH
/g)
Oil Age (miles)
0209Baseline215-6377
18
Figure 4.2: Viscosity of Conventional Oil in Class 0209 Trucks
Oxidation and nitration levels were measured well below the threshold values of 20 and 15, respectively. The maximum measured level for oxidation was 5.8 and 6.4 for nitration, with most measurements below 5, as shown in Figure 4.3. There was no evidence that oil age affected either level.
Figure 4.3: Oxidation and Nitration of Conventional Oil in Class 0209 Trucks
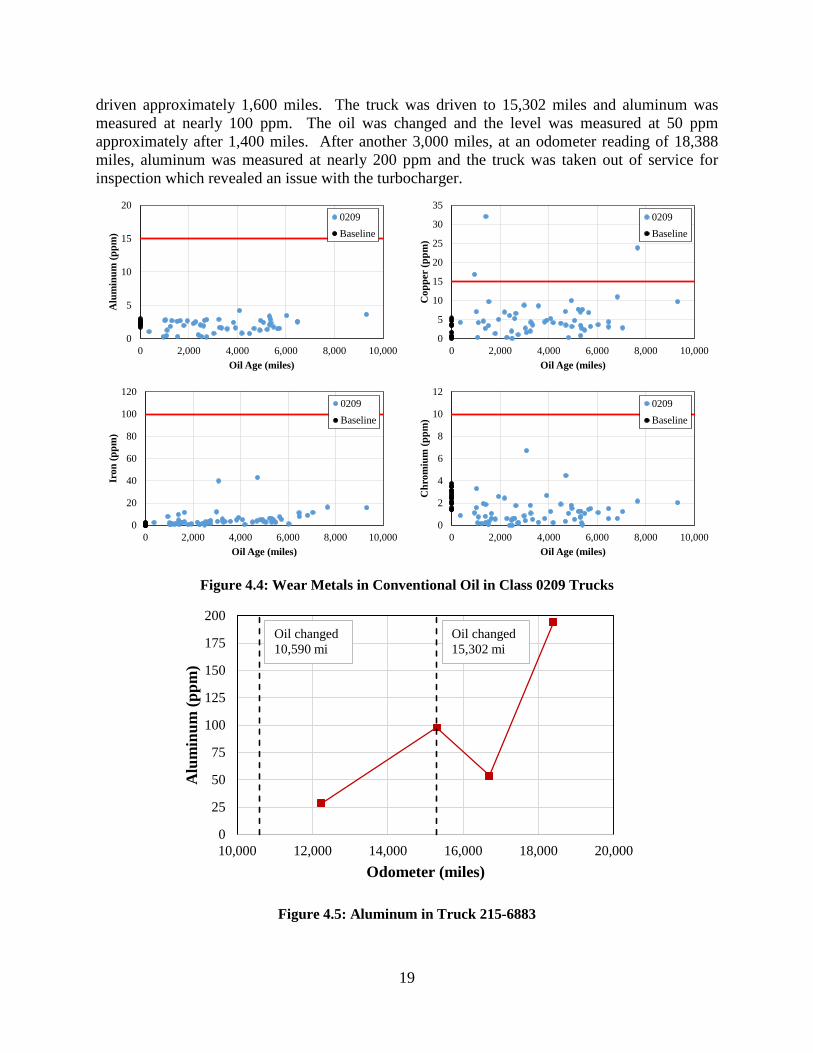
Analysis results showed that oil in class 0209 trucks was not subject to contamination by silicon or wear metals. Nearly all silicon measurements were zero, with trace amounts detected in a small number of samples. Most measurements for the wear metals aluminum, copper, iron, and chromium were below the threshold values, as shown in Figure 4.4.
An issue with the turbo in truck 215-6883 was detected by high aluminum levels in the engine oil. These results are shown in Figure 4.5 and are not included in Figure 4.4. The oil was changed at an odometer reading of 10,590 miles and aluminum in excess of 25 ppm was detected after it was
6
8
10
12
14
16
18
0 2,000 4,000 6,000 8,000 10,000
Vis
cosi
ty a
t 100
C (c
St)
Oil Age (miles)
0209Baseline
0
5
10
15
20
25
0 2,000 4,000 6,000 8,000 10,000
Oxi
datio
n
Oil Age (miles)
0209Baseline
0
5
10
15
20
0 2,000 4,000 6,000 8,000 10,000
Nitr
atio
n
Oil Age (miles)
0209Baseline
19
driven approximately 1,600 miles. The truck was driven to 15,302 miles and aluminum was measured at nearly 100 ppm. The oil was changed and the level was measured at 50 ppm approximately after 1,400 miles. After another 3,000 miles, at an odometer reading of 18,388 miles, aluminum was measured at nearly 200 ppm and the truck was taken out of service for inspection which revealed an issue with the turbocharger.
Figure 4.4: Wear Metals in Conventional Oil in Class 0209 Trucks
Figure 4.5: Aluminum in Truck 215-6883
0
5
10
15
20
0 2,000 4,000 6,000 8,000 10,000
Alu
min
um (p
pm)
Oil Age (miles)
0209Baseline
0
20
40
60
80
100
120
0 2,000 4,000 6,000 8,000 10,000
Iron
(ppm
)
Oil Age (miles)
0209Baseline
0
5
10
15
20
25
30
35
0 2,000 4,000 6,000 8,000 10,000
Cop
per
(ppm
)
Oil Age (miles)
0209Baseline
0
2
4
6
8
10
12
0 2,000 4,000 6,000 8,000 10,000
Chr
omiu
m (p
pm)
Oil Age (miles)
0209Baseline
0
25
50
75
100
125
150
175
200
10,000 12,000 14,000 16,000 18,000 20,000
Alu
min
um (p
pm)
Odometer (miles)
Oil changed10,590 mi
Oil changed15,302 mi
20
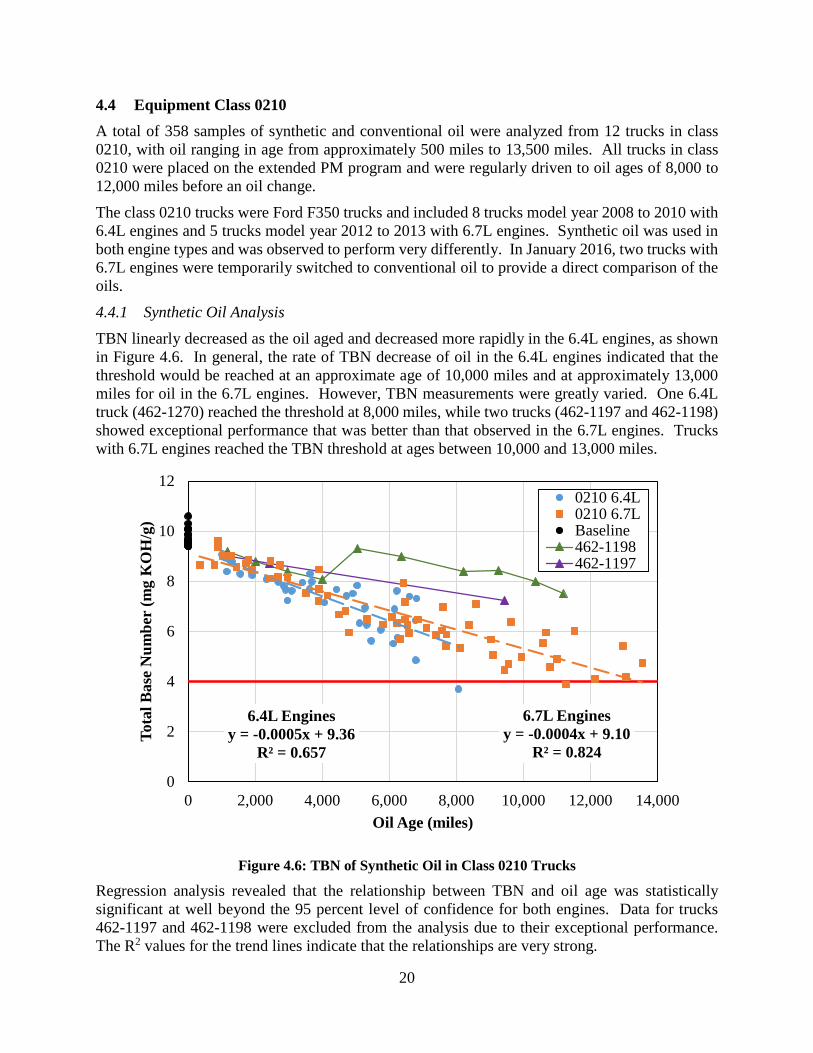
4.4 Equipment Class 0210 A total of 358 samples of synthetic and conventional oil were analyzed from 12 trucks in class 0210, with oil ranging in age from approximately 500 miles to 13,500 miles. All trucks in class 0210 were placed on the extended PM program and were regularly driven to oil ages of 8,000 to 12,000 miles before an oil change.
The class 0210 trucks were Ford F350 trucks and included 8 trucks model year 2008 to 2010 with 6.4L engines and 5 trucks model year 2012 to 2013 with 6.7L engines. Synthetic oil was used in both engine types and was observed to perform very differently. In January 2016, two trucks with 6.7L engines were temporarily switched to conventional oil to provide a direct comparison of the oils.
4.4.1 Synthetic Oil Analysis TBN linearly decreased as the oil aged and decreased more rapidly in the 6.4L engines, as shown in Figure 4.6. In general, the rate of TBN decrease of oil in the 6.4L engines indicated that the threshold would be reached at an approximate age of 10,000 miles and at approximately 13,000 miles for oil in the 6.7L engines. However, TBN measurements were greatly varied. One 6.4L truck (462-1270) reached the threshold at 8,000 miles, while two trucks (462-1197 and 462-1198) showed exceptional performance that was better than that observed in the 6.7L engines. Trucks with 6.7L engines reached the TBN threshold at ages between 10,000 and 13,000 miles.
Figure 4.6: TBN of Synthetic Oil in Class 0210 Trucks
Regression analysis revealed that the relationship between TBN and oil age was statistically significant at well beyond the 95 percent level of confidence for both engines. Data for trucks 462-1197 and 462-1198 were excluded from the analysis due to their exceptional performance. The R2 values for the trend lines indicate that the relationships are very strong.
6.4L Enginesy = -0.0005x + 9.36
R² = 0.657
6.7L Enginesy = -0.0004x + 9.10
R² = 0.824
0
2
4
6
8
10
12
0 2,000 4,000 6,000 8,000 10,000 12,000 14,000
Tota
l Bas
e N
umbe
r (m
g K
OH
/g)
Oil Age (miles)
0210 6.4L0210 6.7LBaseline462-1198462-1197
21
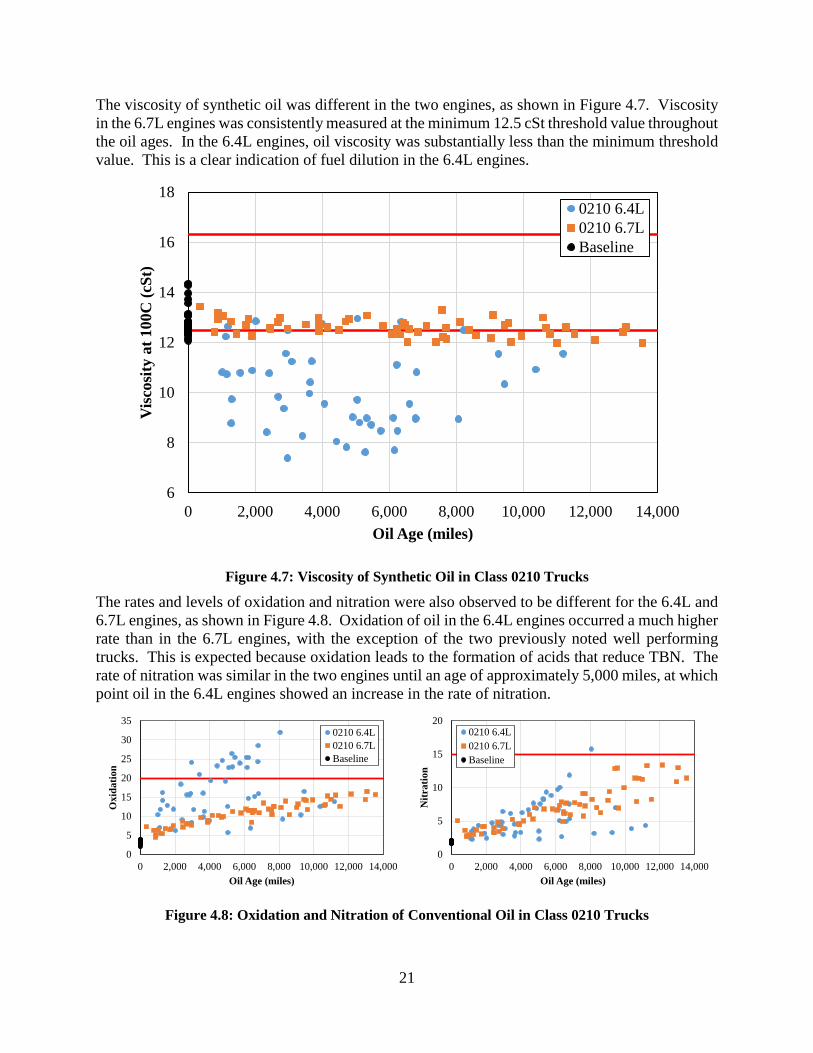
The viscosity of synthetic oil was different in the two engines, as shown in Figure 4.7. Viscosity in the 6.7L engines was consistently measured at the minimum 12.5 cSt threshold value throughout the oil ages. In the 6.4L engines, oil viscosity was substantially less than the minimum threshold value. This is a clear indication of fuel dilution in the 6.4L engines.
Figure 4.7: Viscosity of Synthetic Oil in Class 0210 Trucks
The rates and levels of oxidation and nitration were also observed to be different for the 6.4L and 6.7L engines, as shown in Figure 4.8. Oxidation of oil in the 6.4L engines occurred a much higher rate than in the 6.7L engines, with the exception of the two previously noted well performing trucks. This is expected because oxidation leads to the formation of acids that reduce TBN. The rate of nitration was similar in the two engines until an age of approximately 5,000 miles, at which point oil in the 6.4L engines showed an increase in the rate of nitration.
Figure 4.8: Oxidation and Nitration of Conventional Oil in Class 0210 Trucks
6
8
10
12
14
16
18
0 2,000 4,000 6,000 8,000 10,000 12,000 14,000
Vis
cosi
ty a
t 100
C (c
St)
Oil Age (miles)
0210 6.4L0210 6.7LBaseline
0
5
10
15
20
25
30
35
0 2,000 4,000 6,000 8,000 10,000 12,000 14,000
Oxi
datio
n
Oil Age (miles)
0210 6.4L0210 6.7LBaseline
0
5
10
15
20
0 2,000 4,000 6,000 8,000 10,000 12,000 14,000
Nitr
atio
n
Oil Age (miles)
0210 6.4L0210 6.7LBaseline
22
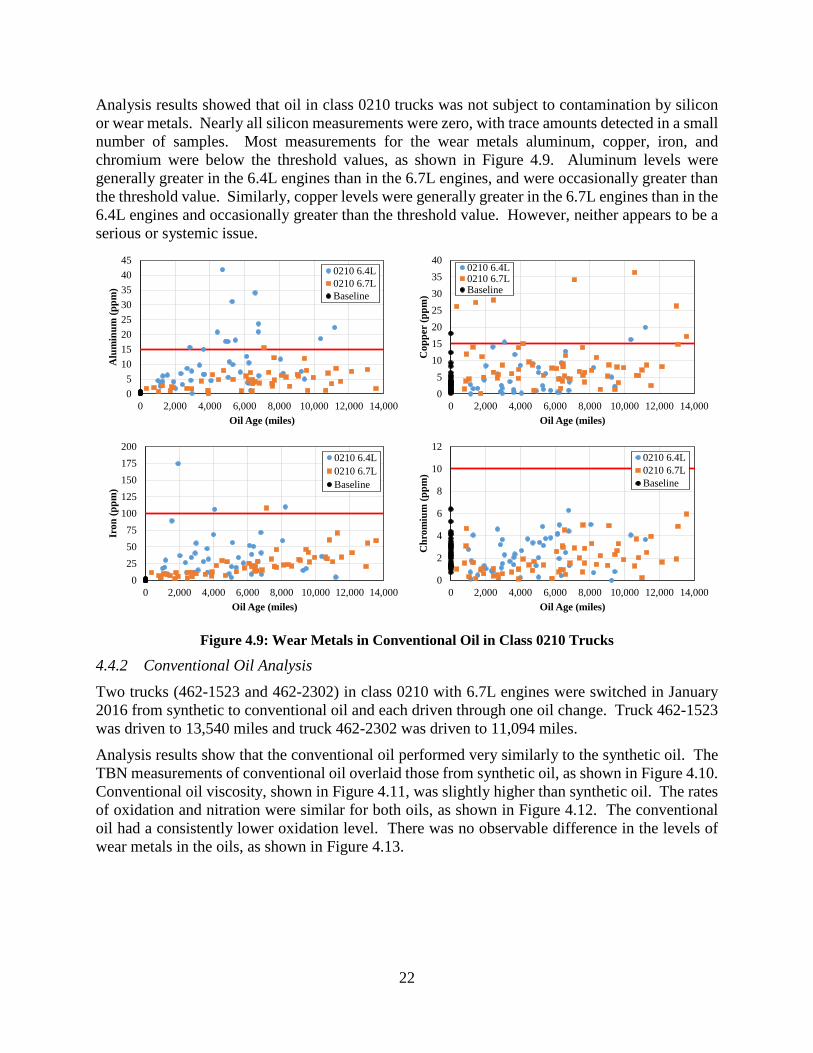
Analysis results showed that oil in class 0210 trucks was not subject to contamination by silicon or wear metals. Nearly all silicon measurements were zero, with trace amounts detected in a small number of samples. Most measurements for the wear metals aluminum, copper, iron, and chromium were below the threshold values, as shown in Figure 4.9. Aluminum levels were generally greater in the 6.4L engines than in the 6.7L engines, and were occasionally greater than the threshold value. Similarly, copper levels were generally greater in the 6.7L engines than in the 6.4L engines and occasionally greater than the threshold value. However, neither appears to be a serious or systemic issue.
Figure 4.9: Wear Metals in Conventional Oil in Class 0210 Trucks
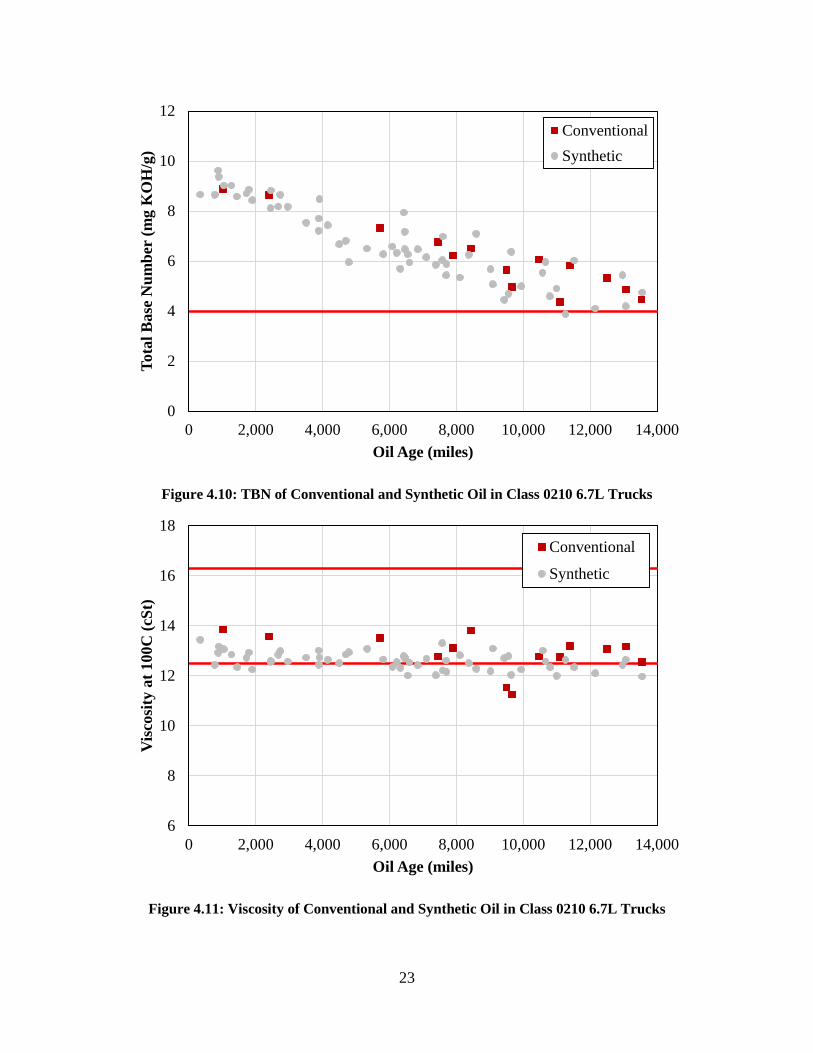
4.4.2 Conventional Oil Analysis Two trucks (462-1523 and 462-2302) in class 0210 with 6.7L engines were switched in January 2016 from synthetic to conventional oil and each driven through one oil change. Truck 462-1523 was driven to 13,540 miles and truck 462-2302 was driven to 11,094 miles.
Analysis results show that the conventional oil performed very similarly to the synthetic oil. The TBN measurements of conventional oil overlaid those from synthetic oil, as shown in Figure 4.10. Conventional oil viscosity, shown in Figure 4.11, was slightly higher than synthetic oil. The rates of oxidation and nitration were similar for both oils, as shown in Figure 4.12. The conventional oil had a consistently lower oxidation level. There was no observable difference in the levels of wear metals in the oils, as shown in Figure 4.13.
05
1015202530354045
0 2,000 4,000 6,000 8,000 10,000 12,000 14,000
Alu
min
um (p
pm)
Oil Age (miles)
0210 6.4L0210 6.7LBaseline
0255075
100125150175200
0 2,000 4,000 6,000 8,000 10,000 12,000 14,000
Iron
(ppm
)
Oil Age (miles)
0210 6.4L0210 6.7LBaseline
05
10152025303540
0 2,000 4,000 6,000 8,000 10,000 12,000 14,000
Cop
per
(ppm
)Oil Age (miles)
0210 6.4L0210 6.7LBaseline
0
2
4
6
8
10
12
0 2,000 4,000 6,000 8,000 10,000 12,000 14,000
Chr
omiu
m (p
pm)
Oil Age (miles)
0210 6.4L0210 6.7LBaseline
23
Figure 4.10: TBN of Conventional and Synthetic Oil in Class 0210 6.7L Trucks
Figure 4.11: Viscosity of Conventional and Synthetic Oil in Class 0210 6.7L Trucks
0
2
4
6
8
10
12
0 2,000 4,000 6,000 8,000 10,000 12,000 14,000
Tota
l Bas
e N
umbe
r (m
g K
OH
/g)
Oil Age (miles)
ConventionalSynthetic
6
8
10
12
14
16
18
0 2,000 4,000 6,000 8,000 10,000 12,000 14,000
Vis
cosi
ty a
t 100
C (c
St)
Oil Age (miles)
Conventional
Synthetic
24
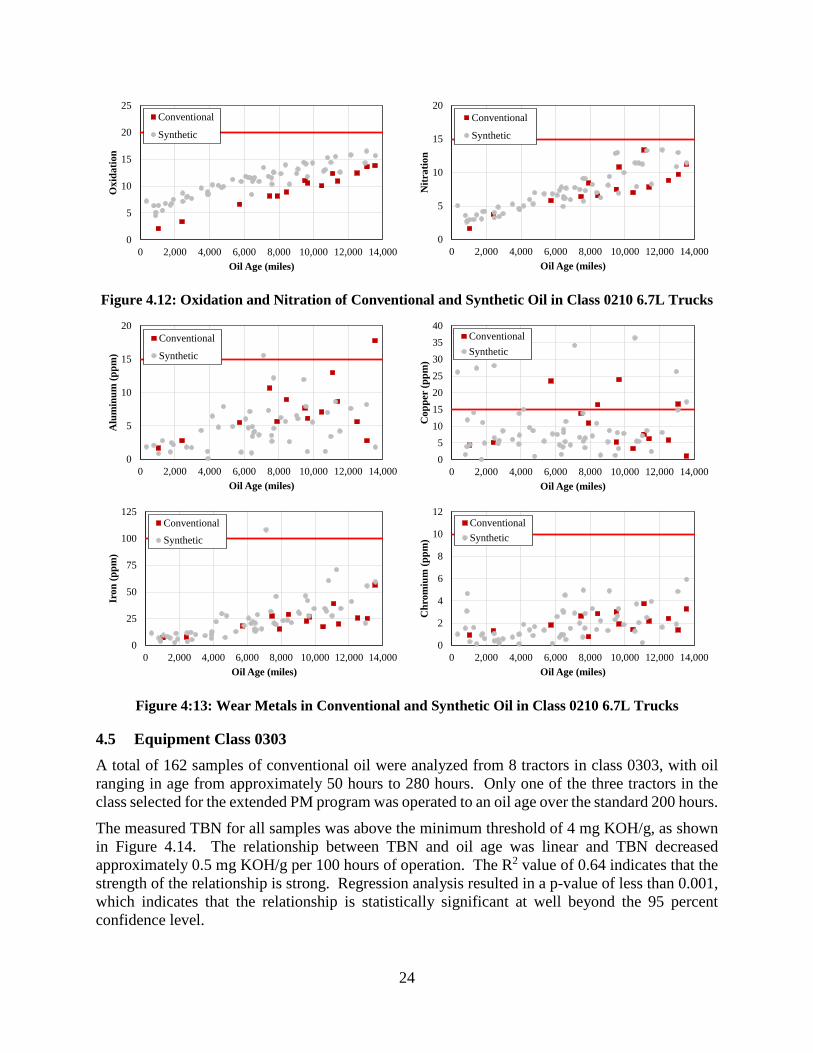
Figure 4.12: Oxidation and Nitration of Conventional and Synthetic Oil in Class 0210 6.7L Trucks
Figure 4:13: Wear Metals in Conventional and Synthetic Oil in Class 0210 6.7L Trucks
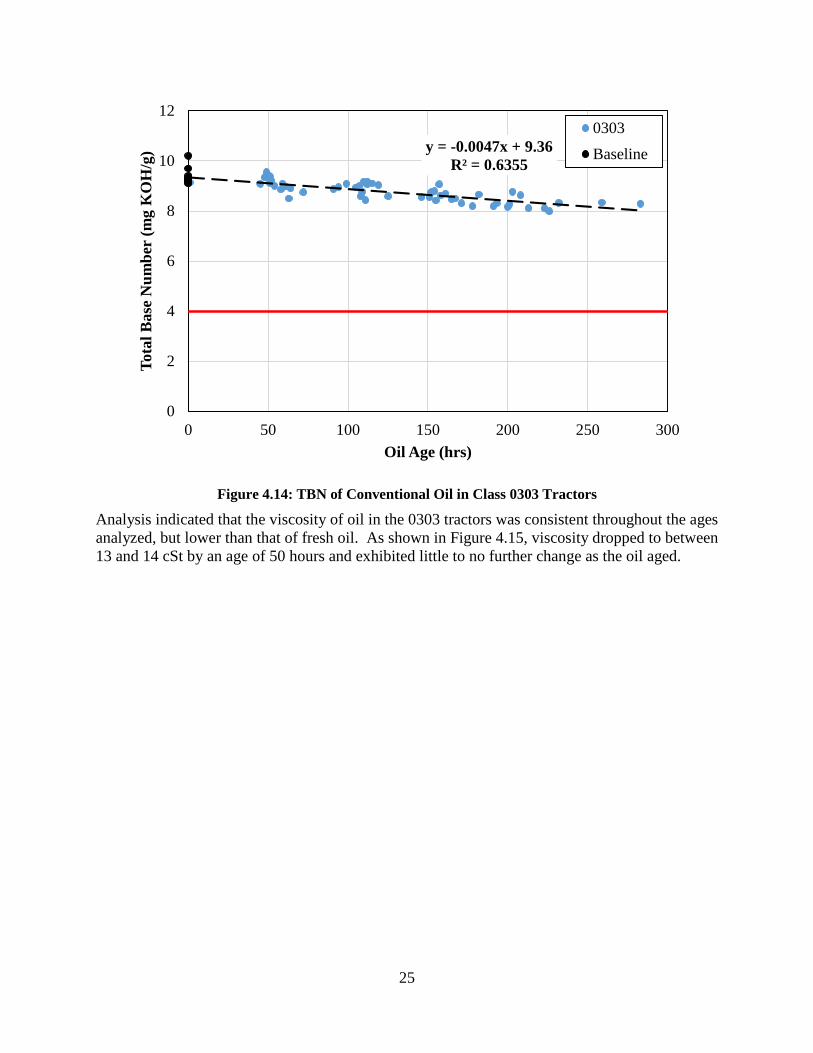
4.5 Equipment Class 0303 A total of 162 samples of conventional oil were analyzed from 8 tractors in class 0303, with oil ranging in age from approximately 50 hours to 280 hours. Only one of the three tractors in the class selected for the extended PM program was operated to an oil age over the standard 200 hours.
The measured TBN for all samples was above the minimum threshold of 4 mg KOH/g, as shown in Figure 4.14. The relationship between TBN and oil age was linear and TBN decreased approximately 0.5 mg KOH/g per 100 hours of operation. The R2 value of 0.64 indicates that the strength of the relationship is strong. Regression analysis resulted in a p-value of less than 0.001, which indicates that the relationship is statistically significant at well beyond the 95 percent confidence level.
0
5
10
15
20
25
0 2,000 4,000 6,000 8,000 10,000 12,000 14,000
Oxi
datio
n
Oil Age (miles)
Conventional
Synthetic
0
5
10
15
20
0 2,000 4,000 6,000 8,000 10,000 12,000 14,000
Nitr
atio
n
Oil Age (miles)
Conventional
Synthetic
0
5
10
15
20
0 2,000 4,000 6,000 8,000 10,000 12,000 14,000
Alu
min
um (p
pm)
Oil Age (miles)
Conventional
Synthetic
0
25
50
75
100
125
0 2,000 4,000 6,000 8,000 10,000 12,000 14,000
Iron
(ppm
)
Oil Age (miles)
Conventional
Synthetic
05
10152025303540
0 2,000 4,000 6,000 8,000 10,000 12,000 14,000
Cop
per
(ppm
)
Oil Age (miles)
ConventionalSynthetic
0
2
4
6
8
10
12
0 2,000 4,000 6,000 8,000 10,000 12,000 14,000
Chr
omiu
m (p
pm)
Oil Age (miles)
ConventionalSynthetic
25
Figure 4.14: TBN of Conventional Oil in Class 0303 Tractors
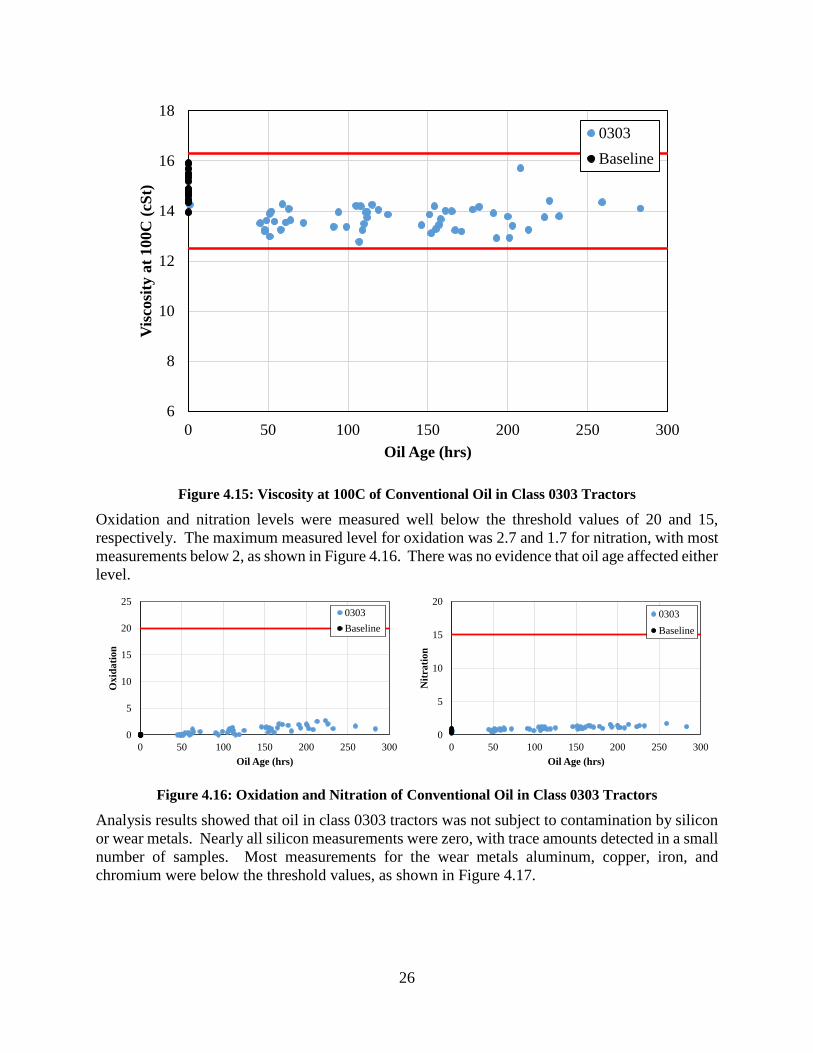
Analysis indicated that the viscosity of oil in the 0303 tractors was consistent throughout the ages analyzed, but lower than that of fresh oil. As shown in Figure 4.15, viscosity dropped to between 13 and 14 cSt by an age of 50 hours and exhibited little to no further change as the oil aged.
y = -0.0047x + 9.36R² = 0.6355
0
2
4
6
8
10
12
0 50 100 150 200 250 300
Tota
l Bas
e N
umbe
r (m
g K
OH
/g)
Oil Age (hrs)
0303Baseline
26
Figure 4.15: Viscosity at 100C of Conventional Oil in Class 0303 Tractors
Oxidation and nitration levels were measured well below the threshold values of 20 and 15, respectively. The maximum measured level for oxidation was 2.7 and 1.7 for nitration, with most measurements below 2, as shown in Figure 4.16. There was no evidence that oil age affected either level.
Figure 4.16: Oxidation and Nitration of Conventional Oil in Class 0303 Tractors
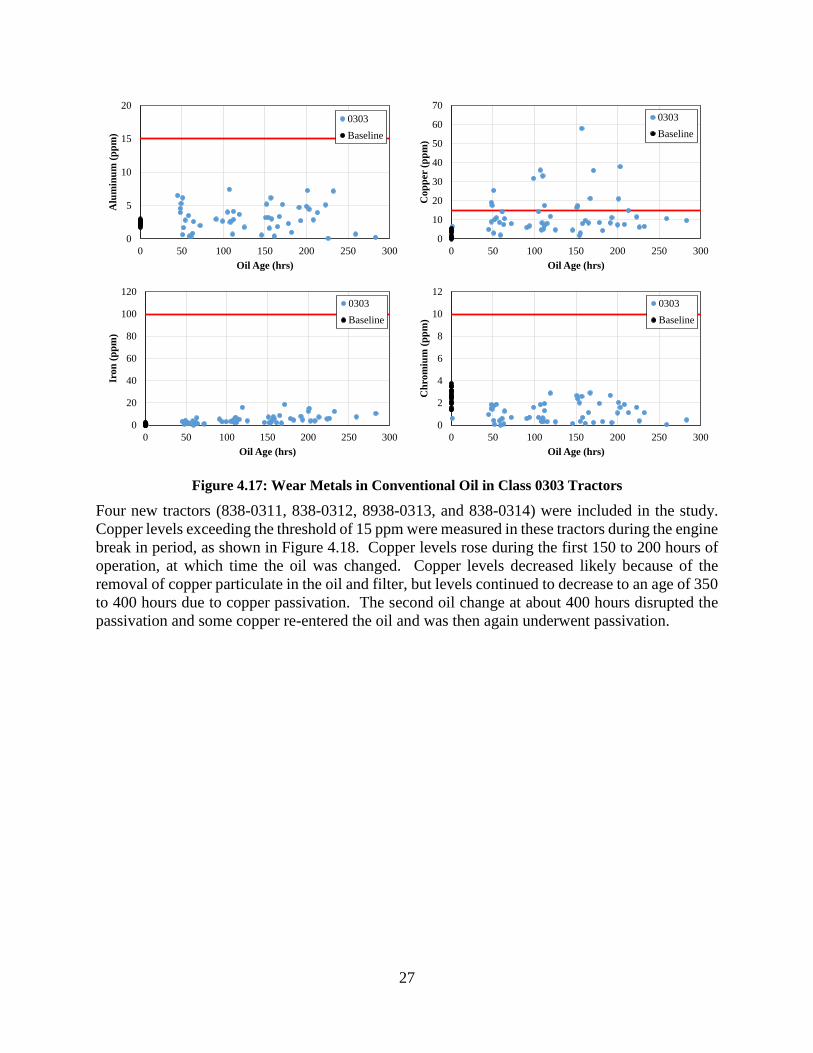
Analysis results showed that oil in class 0303 tractors was not subject to contamination by silicon or wear metals. Nearly all silicon measurements were zero, with trace amounts detected in a small number of samples. Most measurements for the wear metals aluminum, copper, iron, and chromium were below the threshold values, as shown in Figure 4.17.
6
8
10
12
14
16
18
0 50 100 150 200 250 300
Vis
cosi
ty a
t 100
C (c
St)
Oil Age (hrs)
0303Baseline
0
5
10
15
20
25
0 50 100 150 200 250 300
Oxi
datio
n
Oil Age (hrs)
0303Baseline
0
5
10
15
20
0 50 100 150 200 250 300
Nitr
atio
n
Oil Age (hrs)
0303Baseline
27
Figure 4.17: Wear Metals in Conventional Oil in Class 0303 Tractors
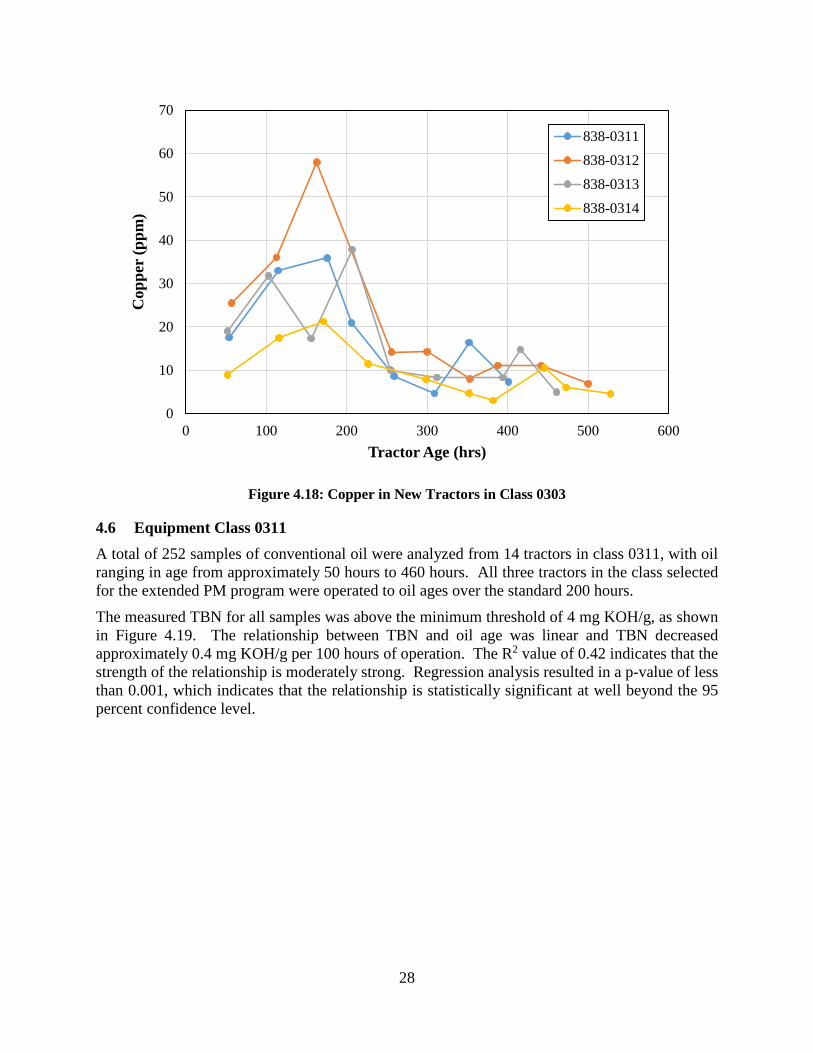
Four new tractors (838-0311, 838-0312, 8938-0313, and 838-0314) were included in the study. Copper levels exceeding the threshold of 15 ppm were measured in these tractors during the engine break in period, as shown in Figure 4.18. Copper levels rose during the first 150 to 200 hours of operation, at which time the oil was changed. Copper levels decreased likely because of the removal of copper particulate in the oil and filter, but levels continued to decrease to an age of 350 to 400 hours due to copper passivation. The second oil change at about 400 hours disrupted the passivation and some copper re-entered the oil and was then again underwent passivation.
0
5
10
15
20
0 50 100 150 200 250 300
Alu
min
um (p
pm)
Oil Age (hrs)
0303Baseline
0
20
40
60
80
100
120
0 50 100 150 200 250 300
Iron
(ppm
)
Oil Age (hrs)
0303Baseline
0
10
20
30
40
50
60
70
0 50 100 150 200 250 300
Cop
per
(ppm
)
Oil Age (hrs)
0303Baseline
0
2
4
6
8
10
12
0 50 100 150 200 250 300C
hrom
ium
(ppm
)
Oil Age (hrs)
0303Baseline
28
Figure 4.18: Copper in New Tractors in Class 0303
4.6 Equipment Class 0311 A total of 252 samples of conventional oil were analyzed from 14 tractors in class 0311, with oil ranging in age from approximately 50 hours to 460 hours. All three tractors in the class selected for the extended PM program were operated to oil ages over the standard 200 hours.
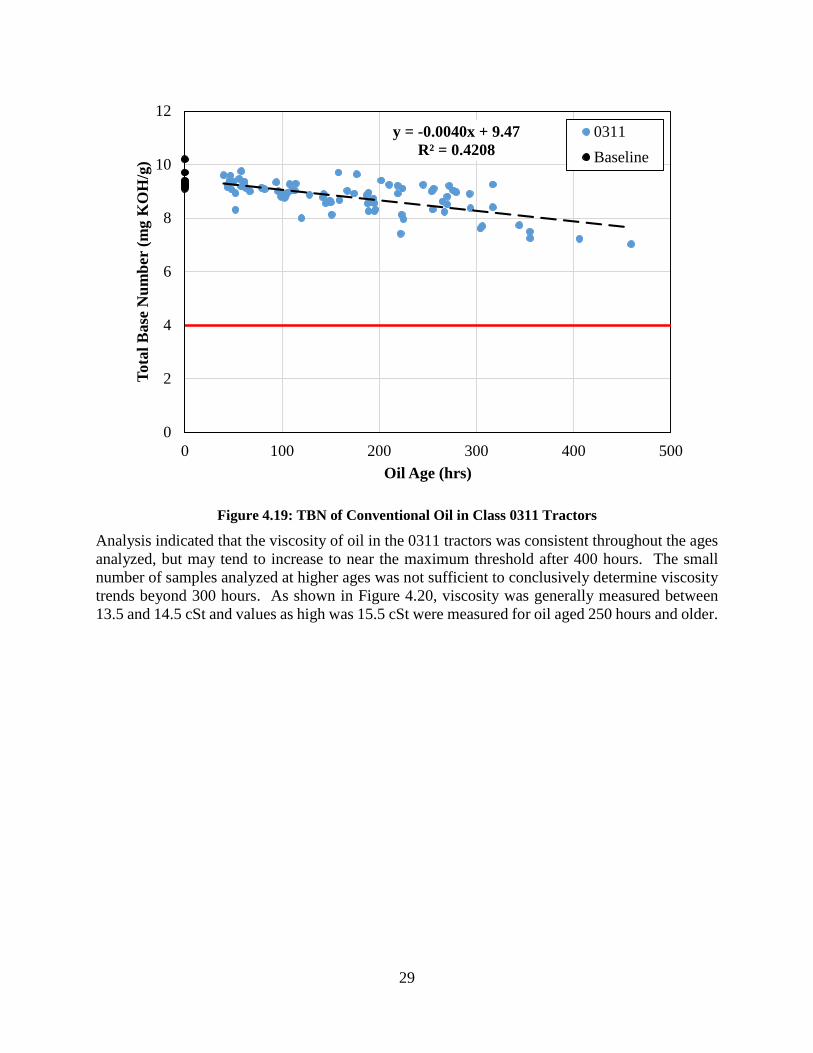
The measured TBN for all samples was above the minimum threshold of 4 mg KOH/g, as shown in Figure 4.19. The relationship between TBN and oil age was linear and TBN decreased approximately 0.4 mg KOH/g per 100 hours of operation. The R2 value of 0.42 indicates that the strength of the relationship is moderately strong. Regression analysis resulted in a p-value of less than 0.001, which indicates that the relationship is statistically significant at well beyond the 95 percent confidence level.
0
10
20
30
40
50
60
70
0 100 200 300 400 500 600
Cop
per
(ppm
)
Tractor Age (hrs)
838-0311838-0312838-0313838-0314
29
Figure 4.19: TBN of Conventional Oil in Class 0311 Tractors
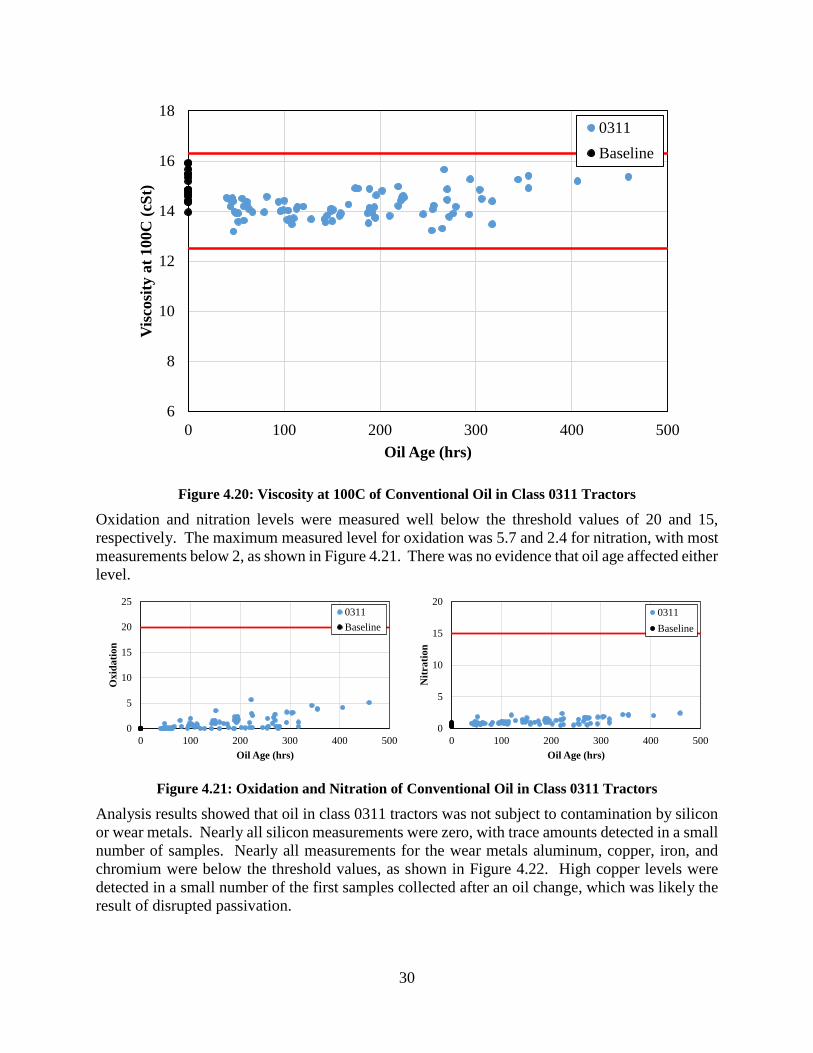
Analysis indicated that the viscosity of oil in the 0311 tractors was consistent throughout the ages analyzed, but may tend to increase to near the maximum threshold after 400 hours. The small number of samples analyzed at higher ages was not sufficient to conclusively determine viscosity trends beyond 300 hours. As shown in Figure 4.20, viscosity was generally measured between 13.5 and 14.5 cSt and values as high was 15.5 cSt were measured for oil aged 250 hours and older.
y = -0.0040x + 9.47R² = 0.4208
0
2
4
6
8
10
12
0 100 200 300 400 500
Tota
l Bas
e N
umbe
r (m
g K
OH
/g)
Oil Age (hrs)
0311Baseline
30
Figure 4.20: Viscosity at 100C of Conventional Oil in Class 0311 Tractors
Oxidation and nitration levels were measured well below the threshold values of 20 and 15, respectively. The maximum measured level for oxidation was 5.7 and 2.4 for nitration, with most measurements below 2, as shown in Figure 4.21. There was no evidence that oil age affected either level.
Figure 4.21: Oxidation and Nitration of Conventional Oil in Class 0311 Tractors
Analysis results showed that oil in class 0311 tractors was not subject to contamination by silicon or wear metals. Nearly all silicon measurements were zero, with trace amounts detected in a small number of samples. Nearly all measurements for the wear metals aluminum, copper, iron, and chromium were below the threshold values, as shown in Figure 4.22. High copper levels were detected in a small number of the first samples collected after an oil change, which was likely the result of disrupted passivation.
6
8
10
12
14
16
18
0 100 200 300 400 500
Vis
cosi
ty a
t 100
C (c
St)
Oil Age (hrs)
0311Baseline
0
5
10
15
20
25
0 100 200 300 400 500
Oxi
datio
n
Oil Age (hrs)
0311Baseline
0
5
10
15
20
0 100 200 300 400 500
Nitr
atio
n
Oil Age (hrs)
0311Baseline
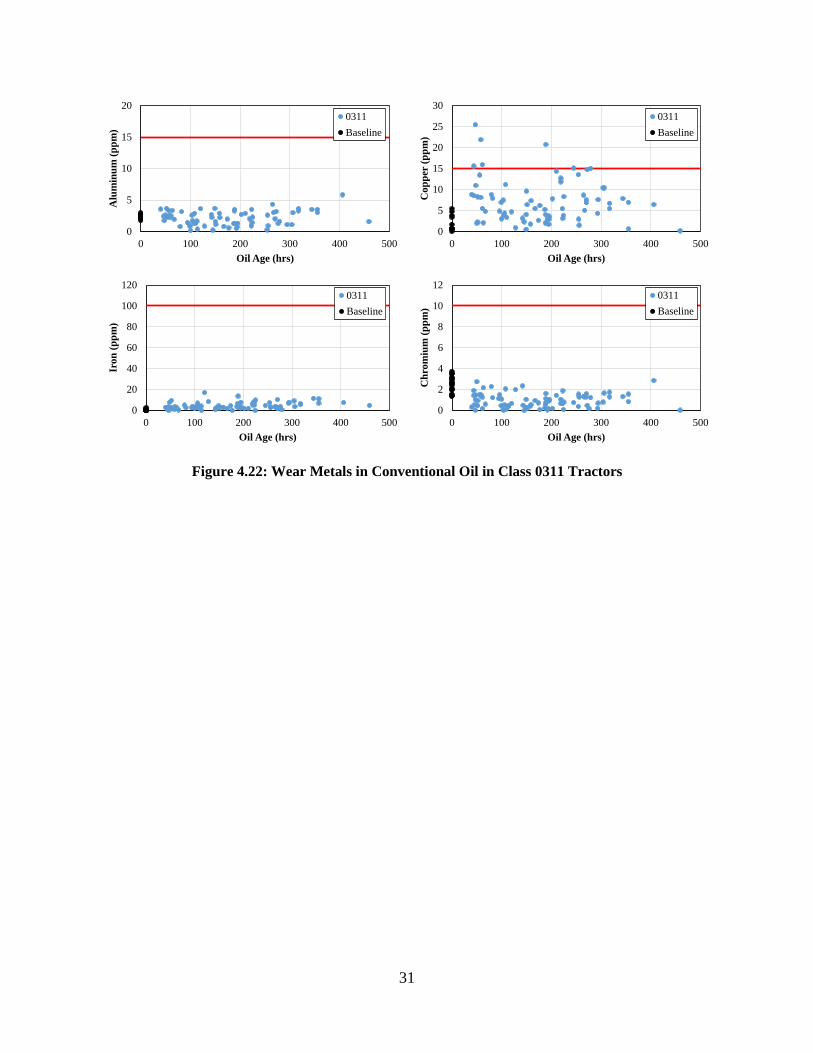
31
Figure 4.22: Wear Metals in Conventional Oil in Class 0311 Tractors
0
5
10
15
20
0 100 200 300 400 500
Alu
min
um (p
pm)
Oil Age (hrs)
0311Baseline
0
20
40
60
80
100
120
0 100 200 300 400 500
Iron
(ppm
)
Oil Age (hrs)
0311Baseline
0
5
10
15
20
25
30
0 100 200 300 400 500
Cop
per
(ppm
)
Oil Age (hrs)
0311Baseline
0
2
4
6
8
10
12
0 100 200 300 400 500C
hrom
ium
(ppm
)Oil Age (hrs)
0311Baseline
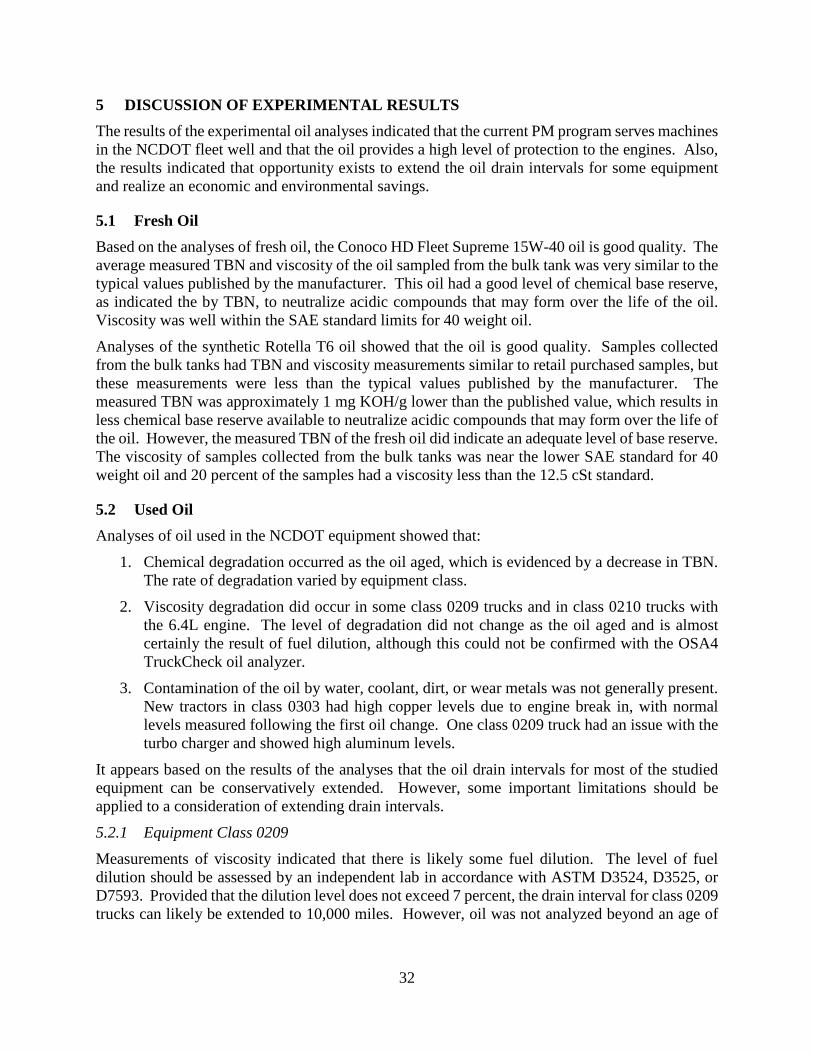
32
5 DISCUSSION OF EXPERIMENTAL RESULTS The results of the experimental oil analyses indicated that the current PM program serves machines in the NCDOT fleet well and that the oil provides a high level of protection to the engines. Also, the results indicated that opportunity exists to extend the oil drain intervals for some equipment and realize an economic and environmental savings.
5.1 Fresh Oil Based on the analyses of fresh oil, the Conoco HD Fleet Supreme 15W-40 oil is good quality. The average measured TBN and viscosity of the oil sampled from the bulk tank was very similar to the typical values published by the manufacturer. This oil had a good level of chemical base reserve, as indicated the by TBN, to neutralize acidic compounds that may form over the life of the oil. Viscosity was well within the SAE standard limits for 40 weight oil.
Analyses of the synthetic Rotella T6 oil showed that the oil is good quality. Samples collected from the bulk tanks had TBN and viscosity measurements similar to retail purchased samples, but these measurements were less than the typical values published by the manufacturer. The measured TBN was approximately 1 mg KOH/g lower than the published value, which results in less chemical base reserve available to neutralize acidic compounds that may form over the life of the oil. However, the measured TBN of the fresh oil did indicate an adequate level of base reserve. The viscosity of samples collected from the bulk tanks was near the lower SAE standard for 40 weight oil and 20 percent of the samples had a viscosity less than the 12.5 cSt standard.
5.2 Used Oil Analyses of oil used in the NCDOT equipment showed that:
1. Chemical degradation occurred as the oil aged, which is evidenced by a decrease in TBN. The rate of degradation varied by equipment class.
2. Viscosity degradation did occur in some class 0209 trucks and in class 0210 trucks with the 6.4L engine. The level of degradation did not change as the oil aged and is almost certainly the result of fuel dilution, although this could not be confirmed with the OSA4 TruckCheck oil analyzer.
3. Contamination of the oil by water, coolant, dirt, or wear metals was not generally present. New tractors in class 0303 had high copper levels due to engine break in, with normal levels measured following the first oil change. One class 0209 truck had an issue with the turbo charger and showed high aluminum levels.
It appears based on the results of the analyses that the oil drain intervals for most of the studied equipment can be conservatively extended. However, some important limitations should be applied to a consideration of extending drain intervals.
5.2.1 Equipment Class 0209 Measurements of viscosity indicated that there is likely some fuel dilution. The level of fuel dilution should be assessed by an independent lab in accordance with ASTM D3524, D3525, or D7593. Provided that the dilution level does not exceed 7 percent, the drain interval for class 0209 trucks can likely be extended to 10,000 miles. However, oil was not analyzed beyond an age of
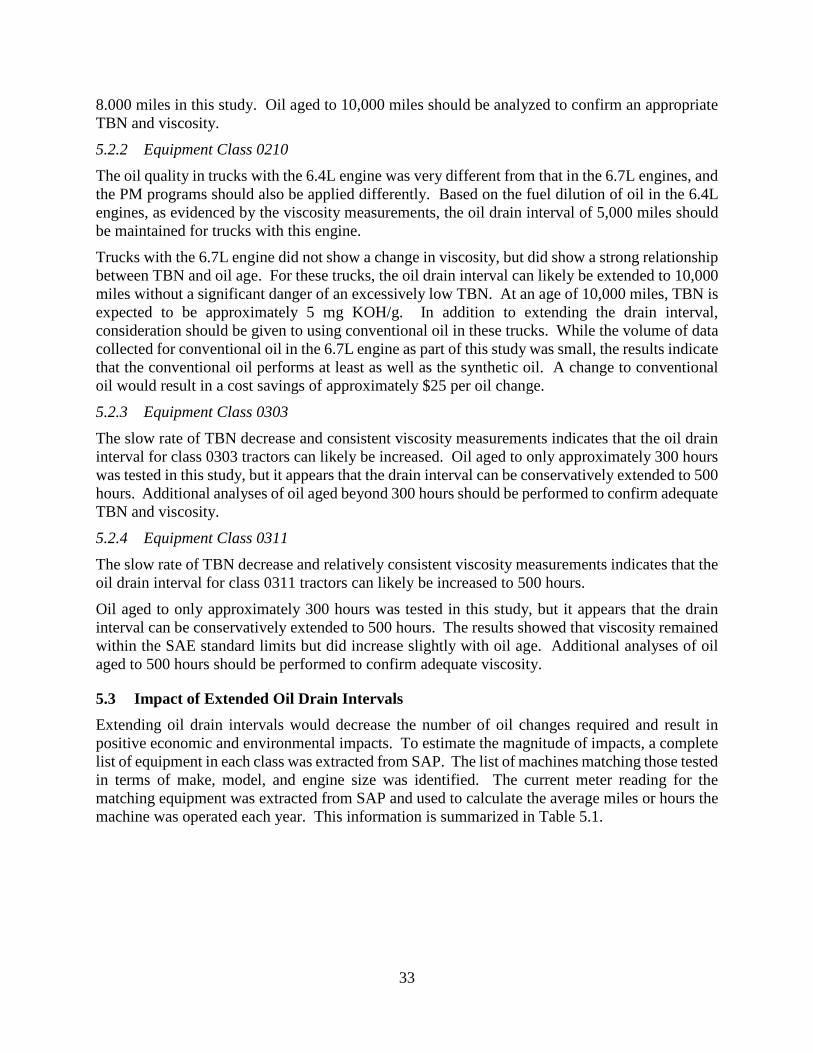
33
8.000 miles in this study. Oil aged to 10,000 miles should be analyzed to confirm an appropriate TBN and viscosity.
5.2.2 Equipment Class 0210 The oil quality in trucks with the 6.4L engine was very different from that in the 6.7L engines, and the PM programs should also be applied differently. Based on the fuel dilution of oil in the 6.4L engines, as evidenced by the viscosity measurements, the oil drain interval of 5,000 miles should be maintained for trucks with this engine.
Trucks with the 6.7L engine did not show a change in viscosity, but did show a strong relationship between TBN and oil age. For these trucks, the oil drain interval can likely be extended to 10,000 miles without a significant danger of an excessively low TBN. At an age of 10,000 miles, TBN is expected to be approximately 5 mg KOH/g. In addition to extending the drain interval, consideration should be given to using conventional oil in these trucks. While the volume of data collected for conventional oil in the 6.7L engine as part of this study was small, the results indicate that the conventional oil performs at least as well as the synthetic oil. A change to conventional oil would result in a cost savings of approximately $25 per oil change.
5.2.3 Equipment Class 0303 The slow rate of TBN decrease and consistent viscosity measurements indicates that the oil drain interval for class 0303 tractors can likely be increased. Oil aged to only approximately 300 hours was tested in this study, but it appears that the drain interval can be conservatively extended to 500 hours. Additional analyses of oil aged beyond 300 hours should be performed to confirm adequate TBN and viscosity.
5.2.4 Equipment Class 0311 The slow rate of TBN decrease and relatively consistent viscosity measurements indicates that the oil drain interval for class 0311 tractors can likely be increased to 500 hours.
Oil aged to only approximately 300 hours was tested in this study, but it appears that the drain interval can be conservatively extended to 500 hours. The results showed that viscosity remained within the SAE standard limits but did increase slightly with oil age. Additional analyses of oil aged to 500 hours should be performed to confirm adequate viscosity.
5.3 Impact of Extended Oil Drain Intervals Extending oil drain intervals would decrease the number of oil changes required and result in positive economic and environmental impacts. To estimate the magnitude of impacts, a complete list of equipment in each class was extracted from SAP. The list of machines matching those tested in terms of make, model, and engine size was identified. The current meter reading for the matching equipment was extracted from SAP and used to calculate the average miles or hours the machine was operated each year. This information is summarized in Table 5.1.
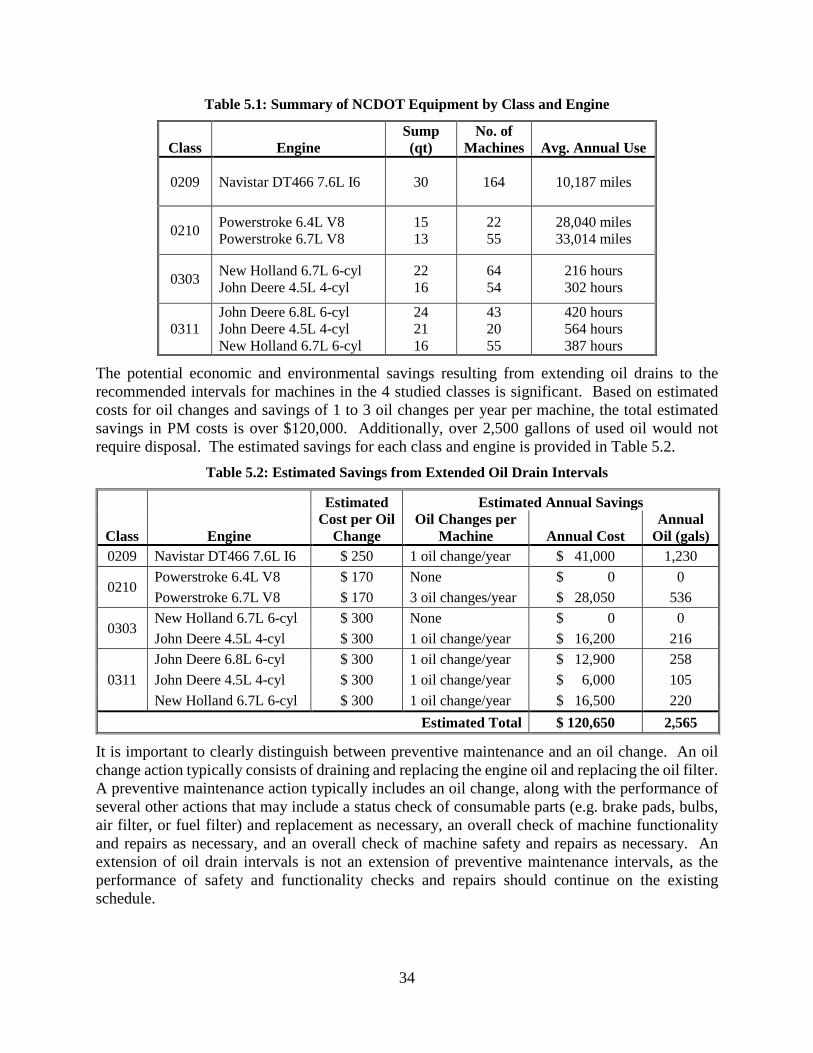
34
Table 5.1: Summary of NCDOT Equipment by Class and Engine
Class Engine Sump (qt)
No. of Machines Avg. Annual Use
0209 Navistar DT466 7.6L I6 30 164 10,187 miles
0210 Powerstroke 6.4L V8 Powerstroke 6.7L V8
15 13
22 55
28,040 miles 33,014 miles
0303 New Holland 6.7L 6-cyl John Deere 4.5L 4-cyl
22 16
64 54
216 hours 302 hours
0311 John Deere 6.8L 6-cyl John Deere 4.5L 4-cyl New Holland 6.7L 6-cyl
24 21 16
43 20 55
420 hours 564 hours 387 hours
The potential economic and environmental savings resulting from extending oil drains to the recommended intervals for machines in the 4 studied classes is significant. Based on estimated costs for oil changes and savings of 1 to 3 oil changes per year per machine, the total estimated savings in PM costs is over $120,000. Additionally, over 2,500 gallons of used oil would not require disposal. The estimated savings for each class and engine is provided in Table 5.2.
Table 5.2: Estimated Savings from Extended Oil Drain Intervals
Class Engine
Estimated Cost per Oil
Change
Estimated Annual Savings Oil Changes per
Machine Annual Cost Annual
Oil (gals) 0209 Navistar DT466 7.6L I6 $ 250 1 oil change/year $ 41,000 1,230
0210 Powerstroke 6.4L V8 $ 170 None $ 0 0 Powerstroke 6.7L V8 $ 170 3 oil changes/year $ 28,050 536
0303 New Holland 6.7L 6-cyl $ 300 None $ 0 0 John Deere 4.5L 4-cyl $ 300 1 oil change/year $ 16,200 216
0311 John Deere 6.8L 6-cyl $ 300 1 oil change/year $ 12,900 258 John Deere 4.5L 4-cyl $ 300 1 oil change/year $ 6,000 105 New Holland 6.7L 6-cyl $ 300 1 oil change/year $ 16,500 220
Estimated Total $ 120,650 2,565
It is important to clearly distinguish between preventive maintenance and an oil change. An oil change action typically consists of draining and replacing the engine oil and replacing the oil filter. A preventive maintenance action typically includes an oil change, along with the performance of several other actions that may include a status check of consumable parts (e.g. brake pads, bulbs, air filter, or fuel filter) and replacement as necessary, an overall check of machine functionality and repairs as necessary, and an overall check of machine safety and repairs as necessary. An extension of oil drain intervals is not an extension of preventive maintenance intervals, as the performance of safety and functionality checks and repairs should continue on the existing schedule.
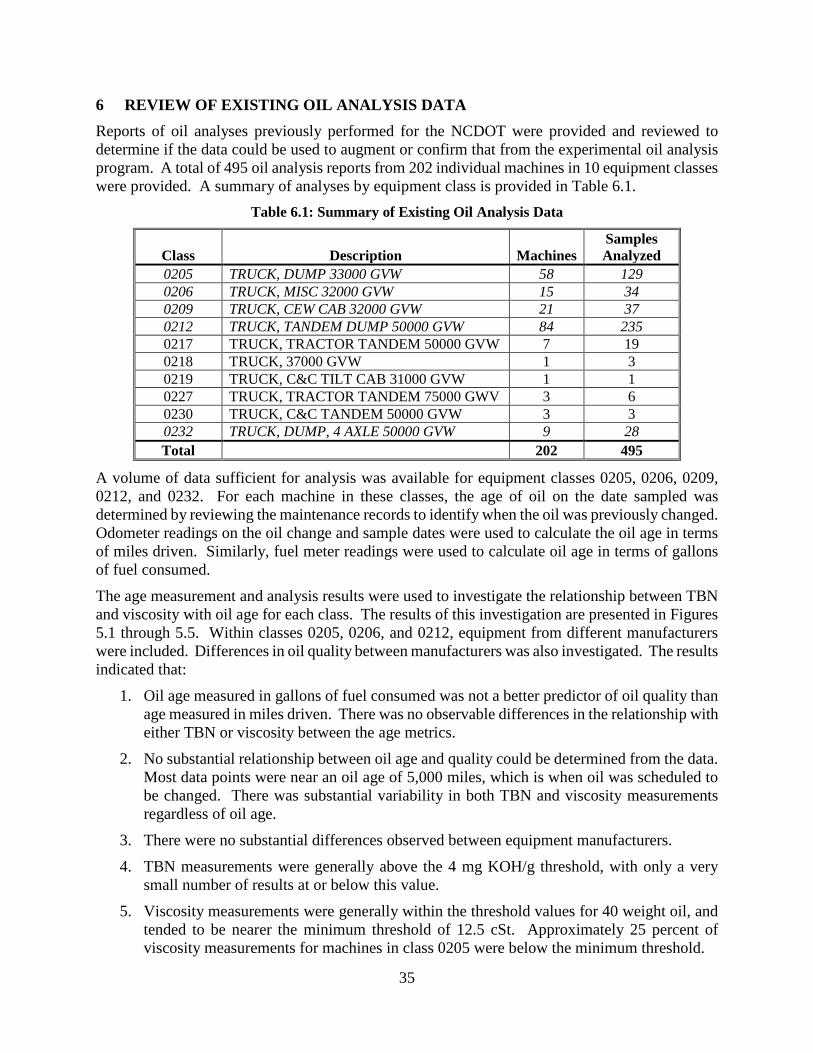
35
6 REVIEW OF EXISTING OIL ANALYSIS DATA Reports of oil analyses previously performed for the NCDOT were provided and reviewed to determine if the data could be used to augment or confirm that from the experimental oil analysis program. A total of 495 oil analysis reports from 202 individual machines in 10 equipment classes were provided. A summary of analyses by equipment class is provided in Table 6.1.
Table 6.1: Summary of Existing Oil Analysis Data
Class Description Machines Samples Analyzed
0205 TRUCK, DUMP 33000 GVW 58 129 0206 TRUCK, MISC 32000 GVW 15 34 0209 TRUCK, CEW CAB 32000 GVW 21 37 0212 TRUCK, TANDEM DUMP 50000 GVW 84 235 0217 TRUCK, TRACTOR TANDEM 50000 GVW 7 19 0218 TRUCK, 37000 GVW 1 3 0219 TRUCK, C&C TILT CAB 31000 GVW 1 1 0227 TRUCK, TRACTOR TANDEM 75000 GWV 3 6 0230 TRUCK, C&C TANDEM 50000 GVW 3 3 0232 TRUCK, DUMP, 4 AXLE 50000 GVW 9 28 Total 202 495
A volume of data sufficient for analysis was available for equipment classes 0205, 0206, 0209, 0212, and 0232. For each machine in these classes, the age of oil on the date sampled was determined by reviewing the maintenance records to identify when the oil was previously changed. Odometer readings on the oil change and sample dates were used to calculate the oil age in terms of miles driven. Similarly, fuel meter readings were used to calculate oil age in terms of gallons of fuel consumed.
The age measurement and analysis results were used to investigate the relationship between TBN and viscosity with oil age for each class. The results of this investigation are presented in Figures 5.1 through 5.5. Within classes 0205, 0206, and 0212, equipment from different manufacturers were included. Differences in oil quality between manufacturers was also investigated. The results indicated that:
1. Oil age measured in gallons of fuel consumed was not a better predictor of oil quality than age measured in miles driven. There was no observable differences in the relationship with either TBN or viscosity between the age metrics.
2. No substantial relationship between oil age and quality could be determined from the data. Most data points were near an oil age of 5,000 miles, which is when oil was scheduled to be changed. There was substantial variability in both TBN and viscosity measurements regardless of oil age.
3. There were no substantial differences observed between equipment manufacturers.
4. TBN measurements were generally above the 4 mg KOH/g threshold, with only a very small number of results at or below this value.
5. Viscosity measurements were generally within the threshold values for 40 weight oil, and tended to be nearer the minimum threshold of 12.5 cSt. Approximately 25 percent of viscosity measurements for machines in class 0205 were below the minimum threshold.
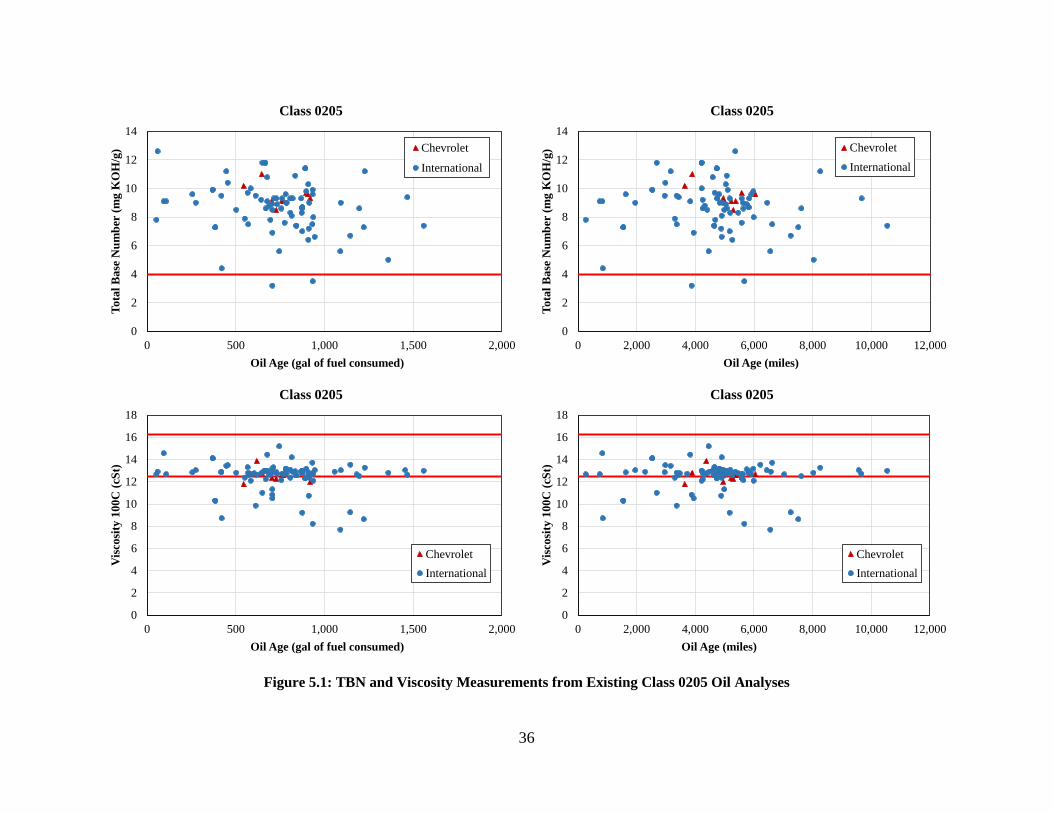
36
Figure 5.1: TBN and Viscosity Measurements from Existing Class 0205 Oil Analyses
0
2
4
6
8
10
12
14
0 500 1,000 1,500 2,000
Tota
l Bas
e N
umbe
r (m
g K
OH
/g)
Oil Age (gal of fuel consumed)
Class 0205
Chevrolet
International
0
2
4
6
8
10
12
14
16
18
0 2,000 4,000 6,000 8,000 10,000 12,000
Vis
cosi
ty 1
00C
(cSt
)
Oil Age (miles)
Class 0205
ChevroletInternational
0
2
4
6
8
10
12
14
16
18
0 500 1,000 1,500 2,000
Vis
cosi
ty 1
00C
(cSt
)
Oil Age (gal of fuel consumed)
Class 0205
ChevroletInternational
0
2
4
6
8
10
12
14
0 2,000 4,000 6,000 8,000 10,000 12,000
Tota
l Bas
e N
umbe
r (m
g K
OH
/g)
Oil Age (miles)
Class 0205
ChevroletInternational
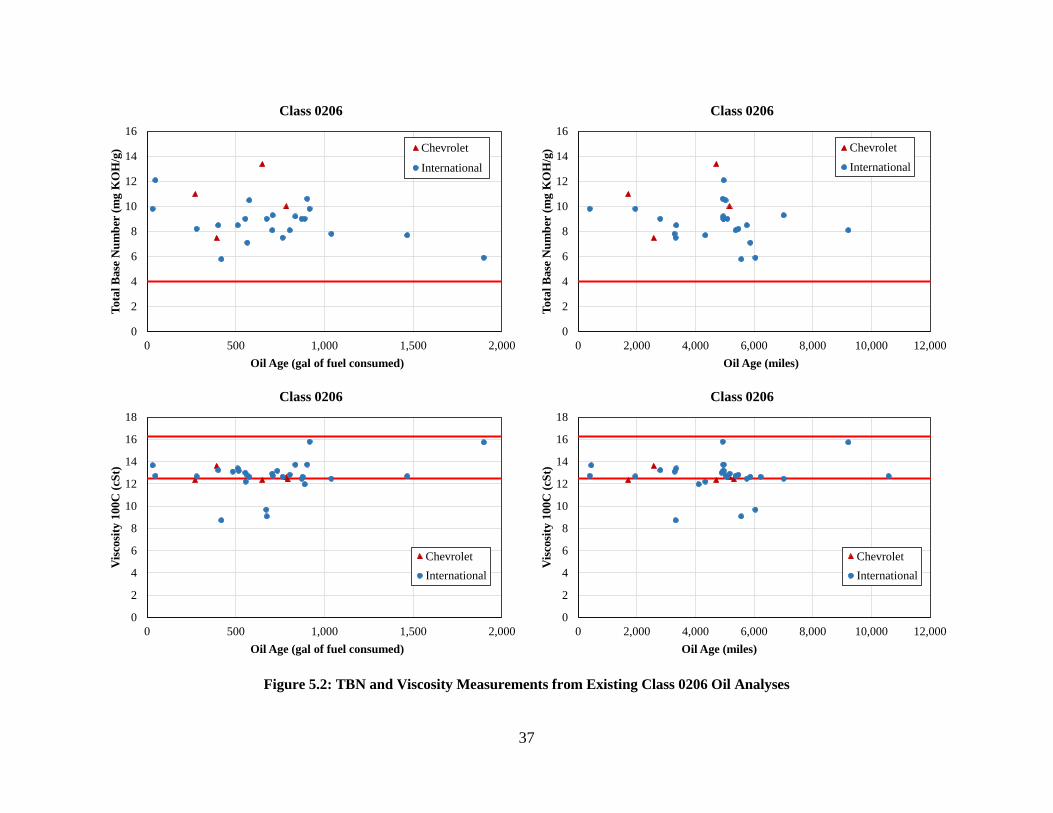
37
Figure 5.2: TBN and Viscosity Measurements from Existing Class 0206 Oil Analyses
0
2
4
6
8
10
12
14
16
18
0 500 1,000 1,500 2,000
Vis
cosi
ty 1
00C
(cSt
)
Oil Age (gal of fuel consumed)
Class 0206
ChevroletInternational
0
2
4
6
8
10
12
14
16
0 500 1,000 1,500 2,000
Tota
l Bas
e N
umbe
r (m
g K
OH
/g)
Oil Age (gal of fuel consumed)
Class 0206
Chevrolet
International
0
2
4
6
8
10
12
14
16
18
0 2,000 4,000 6,000 8,000 10,000 12,000
Vis
cosi
ty 1
00C
(cSt
)
Oil Age (miles)
Class 0206
ChevroletInternational
0
2
4
6
8
10
12
14
16
0 2,000 4,000 6,000 8,000 10,000 12,000
Tota
l Bas
e N
umbe
r (m
g K
OH
/g)
Oil Age (miles)
Class 0206
ChevroletInternational
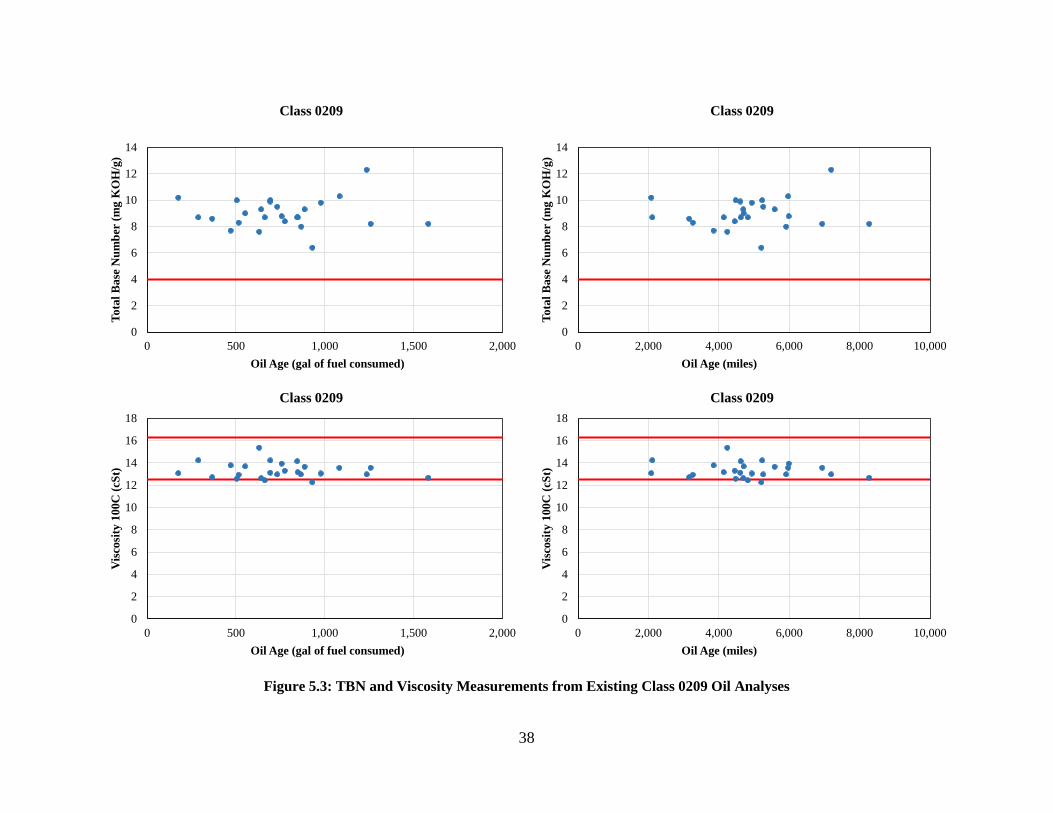
38
Figure 5.3: TBN and Viscosity Measurements from Existing Class 0209 Oil Analyses
0
2
4
6
8
10
12
14
16
18
0 500 1,000 1,500 2,000
Vis
cosi
ty 1
00C
(cSt
)
Oil Age (gal of fuel consumed)
Class 0209
0
2
4
6
8
10
12
14
16
18
0 2,000 4,000 6,000 8,000 10,000
Vis
cosi
ty 1
00C
(cSt
)
Oil Age (miles)
Class 0209
0
2
4
6
8
10
12
14
0 500 1,000 1,500 2,000
Tota
l Bas
e N
umbe
r (m
g K
OH
/g)
Oil Age (gal of fuel consumed)
Class 0209
0
2
4
6
8
10
12
14
0 2,000 4,000 6,000 8,000 10,000
Tota
l Bas
e N
umbe
r (m
g K
OH
/g)
Oil Age (miles)
Class 0209
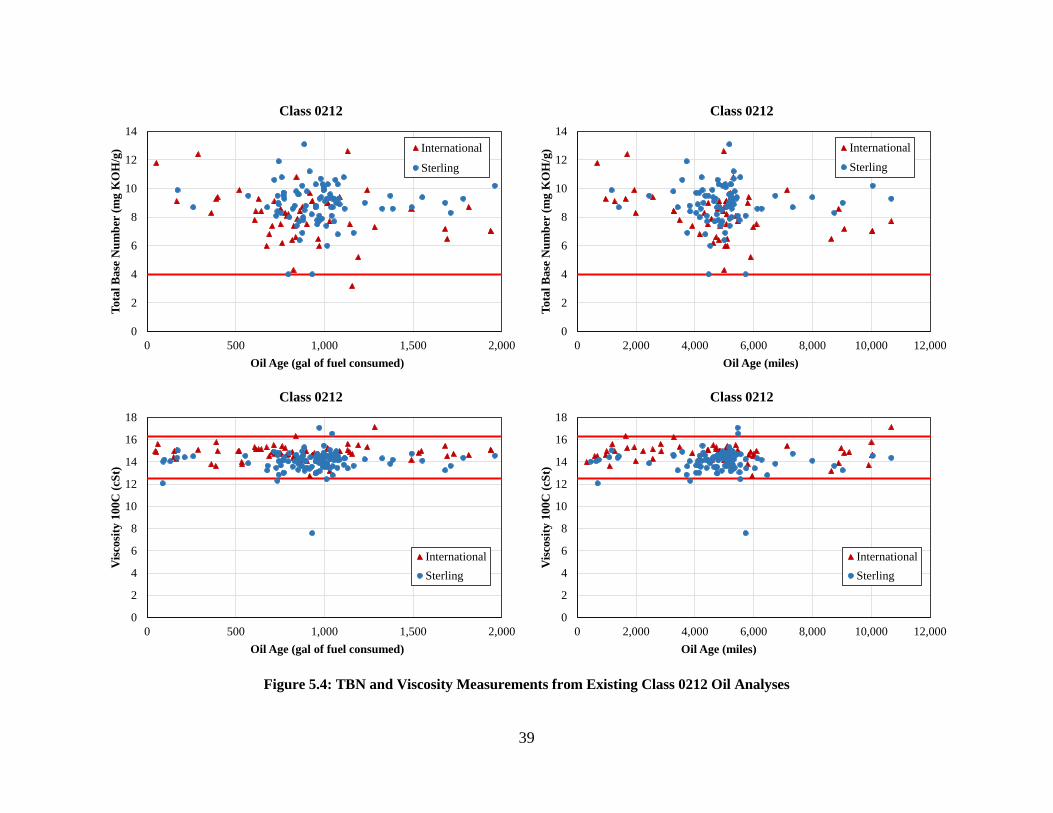
39
Figure 5.4: TBN and Viscosity Measurements from Existing Class 0212 Oil Analyses
0
2
4
6
8
10
12
14
16
18
0 2,000 4,000 6,000 8,000 10,000 12,000
Vis
cosi
ty 1
00C
(cSt
)
Oil Age (miles)
Class 0212
InternationalSterling
0
2
4
6
8
10
12
14
16
18
0 500 1,000 1,500 2,000
Vis
cosi
ty 1
00C
(cSt
)
Oil Age (gal of fuel consumed)
Class 0212
InternationalSterling
0
2
4
6
8
10
12
14
0 500 1,000 1,500 2,000
Tota
l Bas
e N
umbe
r (m
g K
OH
/g)
Oil Age (gal of fuel consumed)
Class 0212
International
Sterling
0
2
4
6
8
10
12
14
0 2,000 4,000 6,000 8,000 10,000 12,000
Tota
l Bas
e N
umbe
r (m
g K
OH
/g)
Oil Age (miles)
Class 0212
InternationalSterling
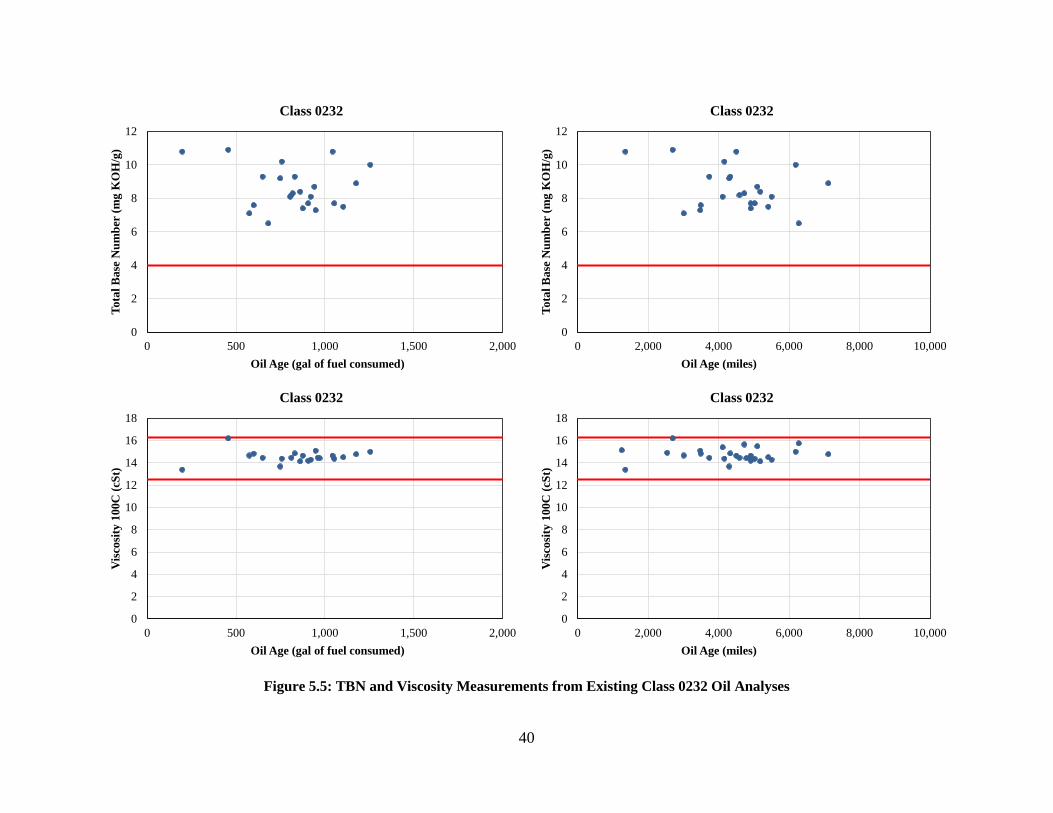
40
Figure 5.5: TBN and Viscosity Measurements from Existing Class 0232 Oil Analyses
0
2
4
6
8
10
12
14
16
18
0 500 1,000 1,500 2,000
Vis
cosi
ty 1
00C
(cSt
)
Oil Age (gal of fuel consumed)
Class 0232
0
2
4
6
8
10
12
14
16
18
0 2,000 4,000 6,000 8,000 10,000
Vis
cosi
ty 1
00C
(cSt
)
Oil Age (miles)
Class 0232
0
2
4
6
8
10
12
0 500 1,000 1,500 2,000
Tota
l Bas
e N
umbe
r (m
g K
OH
/g)
Oil Age (gal of fuel consumed)
Class 0232
0
2
4
6
8
10
12
0 2,000 4,000 6,000 8,000 10,000
Tota
l Bas
e N
umbe
r (m
g K
OH
/g)
Oil Age (miles)
Class 0232
41
7 SUMMARY AND CONCLUSIONS An experimental PM program was established to monitor the quality of engine oil in four NCDOT equipment classes through both regular and extended drain intervals. Samples of fresh oil were collected and analyzed to establish a baseline of oil quality. Used oil samples were periodically collected from the machines as the oil aged. The OSA4 TruckCheck benchtop oil analyzer was used to measure metal levels with atomic emission spectroscopy, physical properties with infrared spectroscopy, and viscosity with a dual temperature viscometer. The results of the analyses provided a basis for understanding and quantifying changes in oil quality as it aged in terms of chemical degradation, viscosity degradation, and contamination. The reports of oil previously analyzed by the NCDOT were reviewed for information that might confirm or augment the experimental results. The following conclusions were drawn from this research:
1. The existing PM program with oil changes scheduled at 5,000 miles or 200 hours serves the NCDOT machines well and provides adequate protection against failure. Oil at these ages had measured TBN values well above the 4 mg KOH/g minimum threshold, viscosity within the SAE standards (with the exception of class 0210 trucks with the 6.4L engine), and no substantial evidence of contamination. The reports of oil analyses previously conducted for NCDOT confirmed good oil quality in equipment classes beyond the four classes in the experimental program.
2. The OSA4 TruckCheck benchtop oil analyzer performed well. Over 1,000 samples were analyzed (950 for this study) with no significant issues experienced. There is the question of why very low metal concentrations are reported at times as negative values, but this does not pose a serious concern. In general, samples required approximately 15 minutes to analyze and the time required for flushing and standardization resulted in the analysis of 3 samples per hour.
3. The Conoco HD Fleet Supreme 15W-40 conventional oil and Rotella T6 5W-40 synthetic oil are both good quality oils and performed well in the tested machines. Analyses of samples of fresh oils showed adequate levels of chemical base reserve to neutralize acidic compounds and viscosity within the SAE standards for 40 weight oil. The synthetic oil had TBN and viscosity measurements lower than the typical values published by the manufacturer, but both were acceptable.
4. The oils do not experience viscosity degradation as a result of the oil aging. Degraded viscosity was observed in used oil aged a little as 1,000 miles from class 0209 trucks and class 0210 trucks with the 6.4L engine, as evidenced by measurements of used oil viscosity lower than that of fresh oil. This is almost certainly the result of fuel dilution, but could not be confirmed with the OSA4 TruckCheck analyzer. The viscosity of oil in the class 0210 trucks with the 6.7L engine and the tractors in classes 0303 and 0311 showed little to no change in viscosity as the oil aged.
5. The oils do experience chemical degradation as the oil ages. TBN values were observed to decrease as oil age increased, and the rate of decrease varied by equipment class and by engine type in the class 0210 trucks. TBN did not decrease with age in the class 0209 trucks. The rate of decrease in the class 0210 trucks was approximately 0.5 mg KOH/g per 1,000 miles in the 6.4L engines and 0.4 mg KOH/g per 1,000 miles in the 6.7L engines.
42
TBN decreased at a rate of approximately 0.5 mg KOH/g per 100 hours in the class 0303 tractors and 0.4 mg KOH/g in the class 0311 tractors.
6. The tested machines were not subject to significant contamination of the oil by water, glycol, soot, dirt, or wear metals. Trace amounts of water, glycol, soot, or silicon were only occasionally detected in the sampled oil. Wear metal production was low in the tested machines, with the exception of copper produced during the engine break in period.
7. The tested conventional oil performed as well as the tested synthetic oil in the class 0210 trucks with 6.7L engines. While the number of conventional oil samples analyzed was small, only positive differences were noted. The viscosity of conventional oil was slightly higher and the oxidation levels were lower than the synthetic oil.
8. There is opportunity to extend oil drain intervals beyond the existing 5,000 miles or 200 hours program without significant danger of unacceptable oil quality. Oil analyzed at the 5,000 miles or 200 hours age were not contaminated, had TBN values indicating sufficient chemical base reserve, and viscosity was measured within the SAE standards (with the exception of oil in the class 0210 trucks with 6.4L engines).
9. The potential benefits to be realized from extending oil drain intervals for machines in the NCDOT fleet that are similar to those tested are substantial. It was conservatively estimated that over $120,000 and 2,500 gallons of oil can be saved annually.
43
8 RECOMMENDATIONS The primary recommendation resulting from this research is to consider extending oil drain intervals for machines in the tested equipment classes with the same engine type and size included in the experimental program. Based on the oil analyses performed, specific recommendations are as follows:
1. Class 0209 trucks – Oil should be sampled for analysis by an independent lab to determine the extent, if any, of fuel dilution in accordance with ASTM D3524, D3235, or D7593. Provided that the dilution level does not exceed 7 percent, consider extending the drain interval for class 0209 trucks to 10,000 miles.
2. Class 0210 trucks with the 6.7L engine – Consider extending the oil drain interval to 10,000 miles.
3. Class 0303 and 0311 tractors – Consider extending the oil drain intervals to 500 hours. Oil should be sampled at 500 hours to confirm that viscosity remains within the SAE standards.
Extending oil drain intervals may impact equipment warranties. It is recommended that any and all PM actions be performed to maintain a valid warranty.
Oil in the class 0210 trucks with the 6.4L engines should be changed on the existing interval of 5,000 miles. Analysis revealed low viscosity oil in these engines that is strongly suspected to be the result of fuel dilution, which inhibits the ability of the oil to provide proper lubrication and promotes the formation of corrosive compounds. It appears that the existing PM schedule provides adequate protection for these engines and should be maintained.
Data regarding the use of conventional oil in the class 0210 trucks with the 6.7L engine was limited to a single oil change in two trucks, but did indicate that the conventional oil performed at least as well as the synthetic oil. This is sufficient to recommend that further research be conducted to determine whether the less expensive conventional oil can be used in these engines.
The annual savings resulting from extending the oil drain intervals for machines in the four equipment classes tested was estimated to be over $120,000 and 2,500 gallons of oil. It is recommended that similar research be conducted on machines in additional equipment classes to investigate further potential savings within the NCDOT fleet.
44
9 REFERENCES AMSOIL (2004). “Technical Service Bulletin.” TSB: MO-2004-07-02.
Balmes, C. (2011). "SynMax Oil Analysis Presentation with Oil Sample Reports." Aeromotive Research and Development Group, Roscoe, IL, < https://www.youtube.com/watch?v=5SFyk7lUjDQ> (July 23, 2015).
Basu, A., A. Berndorfer, C. Buelna, J. Campbell, K. Ismail, Y. Lin, L. Rodriguez, S. Wang (2000). “‘Smart sensing’ of Oil Degradation and Oil Level Measurements in Gasoline Engines.” (No. 2000-01-1366). SAE Technical Paper.
Bergstra, R., W. Givens, W. Maxwell, and W. Richman (1998). “Advanced synthetic passenger vehicle engine oils for extended oil drain performance.” (No. 981444). SAE Technical Paper.
Bernspang, A. and Z. Kali (2011). “Measuring the performance of a preventive maintenance programme for heavy trucks.” M.S. Thesis, Lund University, Sweden.
Caines, A., and R. Haycock (1996). “Automotive Lubricants Reference Book.” Society of Automotive Engineers, SAE R-145, Warrendale, PA.
Conoco HD Fleet Supreme® Engine Oil, ConocoPhillips, http://www.infomine.com/suppliers/PublicDoc/SeaPort/HDFleetSupremeEngineOil.pdf. Accessed July 24, 2015.
Cummins (2007). “Cummins Engine Oil and Oil Analysis Recommendations.” Service Bulletin Number 3810340-06. Cummins, Inc.
Evans, J. (2012). "SOS: Sources of Silicon." Technical Bulletin Issue 53. Wear Check, Westmean, KZN.
Exxon Mobil (2009). "Oil Analysis - The Basics." <http://www.mobilindustrial.com/ind/english/files/tt-the-basics-of-oil-analysis.pdf> (November 9, 2015).
Fitch, J. and D. Troyer (2010). “Oil Analysis Basics.” Noria Corporation, Tulsa, OK.
Fitch, B. (2013). “Anatomy of an Oil Analysis Report”. Machinery Lubrication, 13(6).
Hosie, R. M., and D. A. Lawrence (1979). “Field Experience of Extended Oil Drain Intervals in off-Highway Diesel Engines.” The Zambian Engineer, 23(2), 21-23.
Jetter, S., K. Kelly, M. Ragomo, R. Morrow, D. Nycz, G. Karl, R. Gullett, B. Dussault, B. Butler, and T. Becker (1998). “Extended Oil Drain Performance Capabilities of Diesel Engine Oils.” (No. 982718). SAE Technical Paper Series.
Jun, H., D. Kiritsis, M. Gambera, and P. Xirouchakis (2006). “Predictive algorithm to determine the suitable time to change automotive engine oil.” Computers & Industrial Engineering, 51(4), 671-683.
Kader, M., T. Ramani, J. Johnson, C. Speigelman, J. Zietsman, and T. Jacobs (2014). “Fleet Equipment Performance Measurement Preventive Maintenance Model: Final Report.” No. FHWA/TX-13/0-6626-1. Texas A&M Transportation Institute, College Station, TX.
Kaleli, H., and B. Khorramian (1998). "Used Oil Analysis and Study of Oil Drain Period in Gasoline Engine." (981448). SAE Technical Paper.
45
Keller, J. (2014). "Elements of a Successful Preventive Maintenance (PM) Program." Vehicle Inspections & Maintenance, < https://www.jjkeller.com/learn/preventive-maintenance-program> (2014).
MacAllister Machinery (2014). “Optimizing Oil Change Intervals.” Machine Fluid Analysis, https://www.macallister.com/parts-service/service-solutions/machine-fluid-analysis/optimizing-oil-change-intervals/. Accessed 2014.
Milwaukee (2008). "Fleet Maintenance Manual." 2008 Fleet Maintenance Manual. Dept. of Public Works, Milwaukee, WI.
PennzOil (2014). "What is motor oil?" < http://www.pennzoil.com/en_us/education/know-your-oil/what-is-motor-oil.html#iframe-L2JyYW5kcy9wZW5uem9pbC8wMQ > (Feb 10, 2015).
Shell Rotella® T6 5W-40 (CJ-4) http://www.epc.shell.com/docs/GPCDOC_GTDS_Shell_Rotella_T6_5W-40_(CJ-4)_(en)_TDS.pdf. Accessed July 24, 2015.
Stauffer, F. (2014) "Sampling Overview." Peterson Machinery Co., Fluid Analysis Laboratory.
Tribology (2004). “Oil Analysis User Guide Tribology.” <http://www.agatlabs.com/Brochures/Tribology Brochure Print.pdf> (July 23, 2015).
Troyer, D. (1999). “Get Ready for More Soot in Engine Oil.” Practicing Oil Analysis, 7/1999.
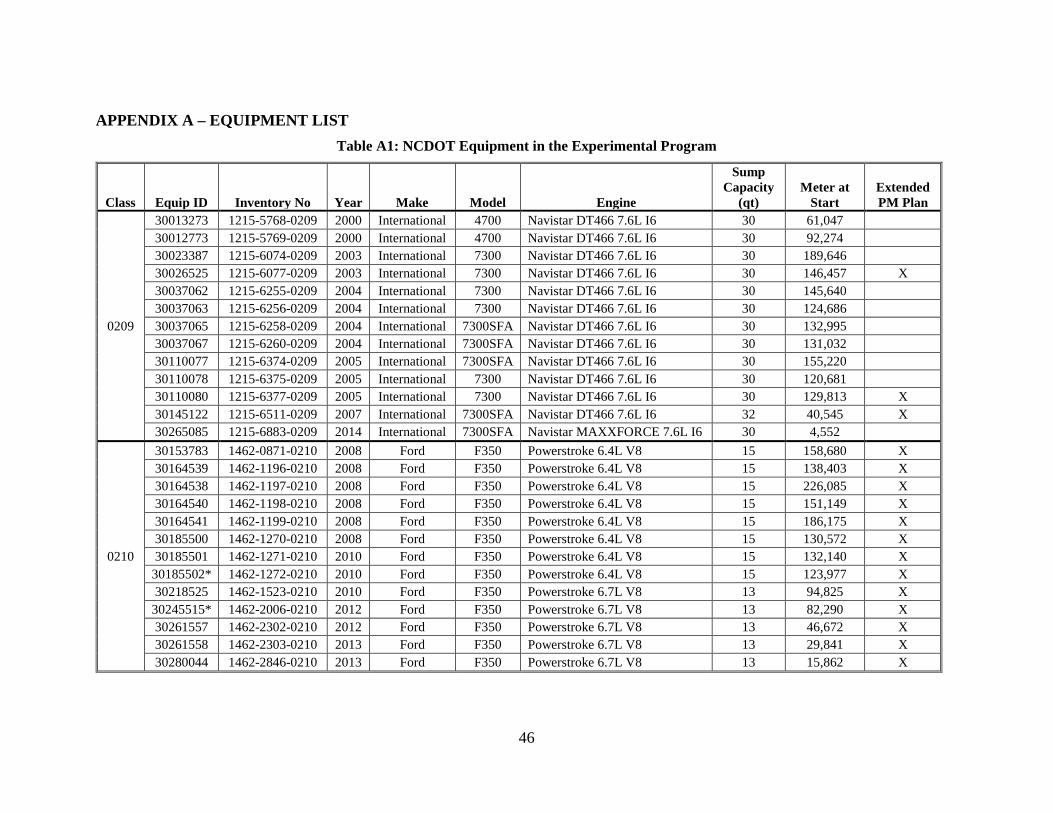
46
APPENDIX A – EQUIPMENT LIST Table A1: NCDOT Equipment in the Experimental Program
Class Equip ID Inventory No Year Make Model Engine
Sump Capacity
(qt) Meter at
Start Extended PM Plan
0209
30013273 1215-5768-0209 2000 International 4700 Navistar DT466 7.6L I6 30 61,047 30012773 1215-5769-0209 2000 International 4700 Navistar DT466 7.6L I6 30 92,274 30023387 1215-6074-0209 2003 International 7300 Navistar DT466 7.6L I6 30 189,646 30026525 1215-6077-0209 2003 International 7300 Navistar DT466 7.6L I6 30 146,457 X 30037062 1215-6255-0209 2004 International 7300 Navistar DT466 7.6L I6 30 145,640 30037063 1215-6256-0209 2004 International 7300 Navistar DT466 7.6L I6 30 124,686 30037065 1215-6258-0209 2004 International 7300SFA Navistar DT466 7.6L I6 30 132,995 30037067 1215-6260-0209 2004 International 7300SFA Navistar DT466 7.6L I6 30 131,032 30110077 1215-6374-0209 2005 International 7300SFA Navistar DT466 7.6L I6 30 155,220 30110078 1215-6375-0209 2005 International 7300 Navistar DT466 7.6L I6 30 120,681 30110080 1215-6377-0209 2005 International 7300 Navistar DT466 7.6L I6 30 129,813 X 30145122 1215-6511-0209 2007 International 7300SFA Navistar DT466 7.6L I6 32 40,545 X 30265085 1215-6883-0209 2014 International 7300SFA Navistar MAXXFORCE 7.6L I6 30 4,552
0210
30153783 1462-0871-0210 2008 Ford F350 Powerstroke 6.4L V8 15 158,680 X 30164539 1462-1196-0210 2008 Ford F350 Powerstroke 6.4L V8 15 138,403 X 30164538 1462-1197-0210 2008 Ford F350 Powerstroke 6.4L V8 15 226,085 X 30164540 1462-1198-0210 2008 Ford F350 Powerstroke 6.4L V8 15 151,149 X 30164541 1462-1199-0210 2008 Ford F350 Powerstroke 6.4L V8 15 186,175 X 30185500 1462-1270-0210 2008 Ford F350 Powerstroke 6.4L V8 15 130,572 X 30185501 1462-1271-0210 2010 Ford F350 Powerstroke 6.4L V8 15 132,140 X
30185502* 1462-1272-0210 2010 Ford F350 Powerstroke 6.4L V8 15 123,977 X 30218525 1462-1523-0210 2010 Ford F350 Powerstroke 6.7L V8 13 94,825 X
30245515* 1462-2006-0210 2012 Ford F350 Powerstroke 6.7L V8 13 82,290 X 30261557 1462-2302-0210 2012 Ford F350 Powerstroke 6.7L V8 13 46,672 X 30261558 1462-2303-0210 2013 Ford F350 Powerstroke 6.7L V8 13 29,841 X 30280044 1462-2846-0210 2013 Ford F350 Powerstroke 6.7L V8 13 15,862 X
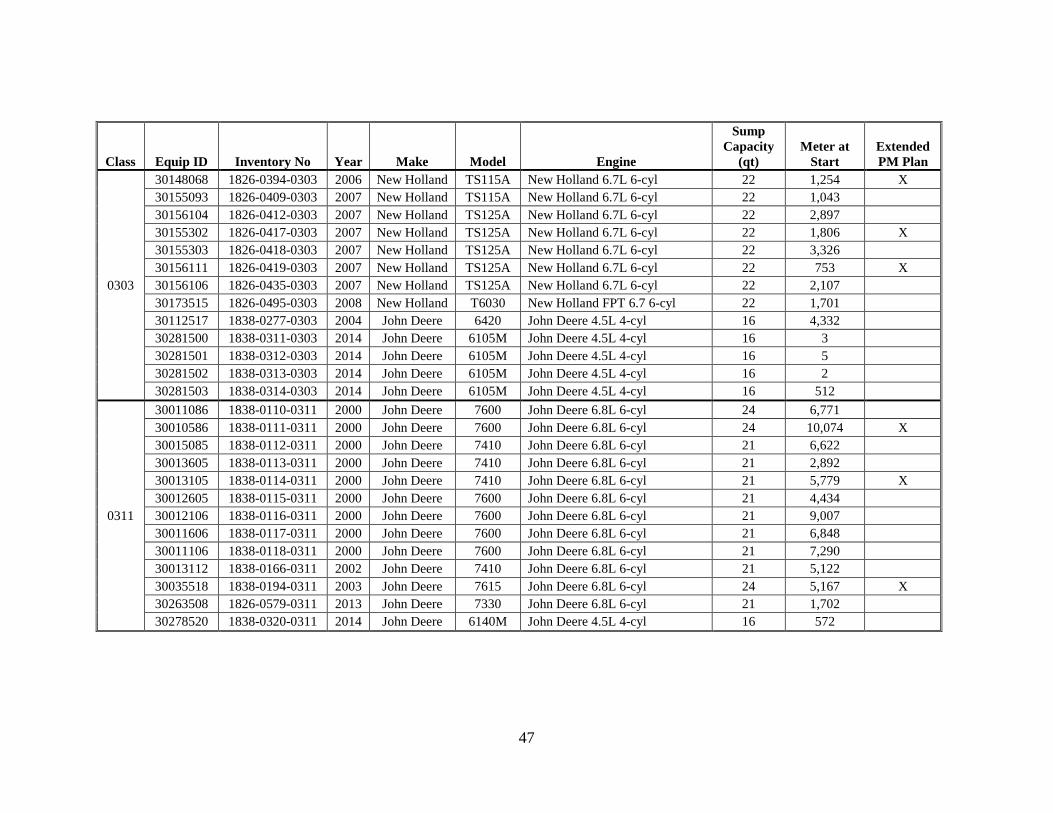
47
Class Equip ID Inventory No Year Make Model Engine
Sump Capacity
(qt) Meter at
Start Extended PM Plan
0303
30148068 1826-0394-0303 2006 New Holland TS115A New Holland 6.7L 6-cyl 22 1,254 X 30155093 1826-0409-0303 2007 New Holland TS115A New Holland 6.7L 6-cyl 22 1,043 30156104 1826-0412-0303 2007 New Holland TS125A New Holland 6.7L 6-cyl 22 2,897 30155302 1826-0417-0303 2007 New Holland TS125A New Holland 6.7L 6-cyl 22 1,806 X 30155303 1826-0418-0303 2007 New Holland TS125A New Holland 6.7L 6-cyl 22 3,326 30156111 1826-0419-0303 2007 New Holland TS125A New Holland 6.7L 6-cyl 22 753 X 30156106 1826-0435-0303 2007 New Holland TS125A New Holland 6.7L 6-cyl 22 2,107 30173515 1826-0495-0303 2008 New Holland T6030 New Holland FPT 6.7 6-cyl 22 1,701 30112517 1838-0277-0303 2004 John Deere 6420 John Deere 4.5L 4-cyl 16 4,332 30281500 1838-0311-0303 2014 John Deere 6105M John Deere 4.5L 4-cyl 16 3 30281501 1838-0312-0303 2014 John Deere 6105M John Deere 4.5L 4-cyl 16 5 30281502 1838-0313-0303 2014 John Deere 6105M John Deere 4.5L 4-cyl 16 2 30281503 1838-0314-0303 2014 John Deere 6105M John Deere 4.5L 4-cyl 16 512
0311
30011086 1838-0110-0311 2000 John Deere 7600 John Deere 6.8L 6-cyl 24 6,771 30010586 1838-0111-0311 2000 John Deere 7600 John Deere 6.8L 6-cyl 24 10,074 X 30015085 1838-0112-0311 2000 John Deere 7410 John Deere 6.8L 6-cyl 21 6,622 30013605 1838-0113-0311 2000 John Deere 7410 John Deere 6.8L 6-cyl 21 2,892 30013105 1838-0114-0311 2000 John Deere 7410 John Deere 6.8L 6-cyl 21 5,779 X 30012605 1838-0115-0311 2000 John Deere 7600 John Deere 6.8L 6-cyl 21 4,434 30012106 1838-0116-0311 2000 John Deere 7600 John Deere 6.8L 6-cyl 21 9,007 30011606 1838-0117-0311 2000 John Deere 7600 John Deere 6.8L 6-cyl 21 6,848 30011106 1838-0118-0311 2000 John Deere 7600 John Deere 6.8L 6-cyl 21 7,290 30013112 1838-0166-0311 2002 John Deere 7410 John Deere 6.8L 6-cyl 21 5,122 30035518 1838-0194-0311 2003 John Deere 7615 John Deere 6.8L 6-cyl 24 5,167 X 30263508 1826-0579-0311 2013 John Deere 7330 John Deere 6.8L 6-cyl 21 1,702 30278520 1838-0320-0311 2014 John Deere 6140M John Deere 4.5L 4-cyl 16 572
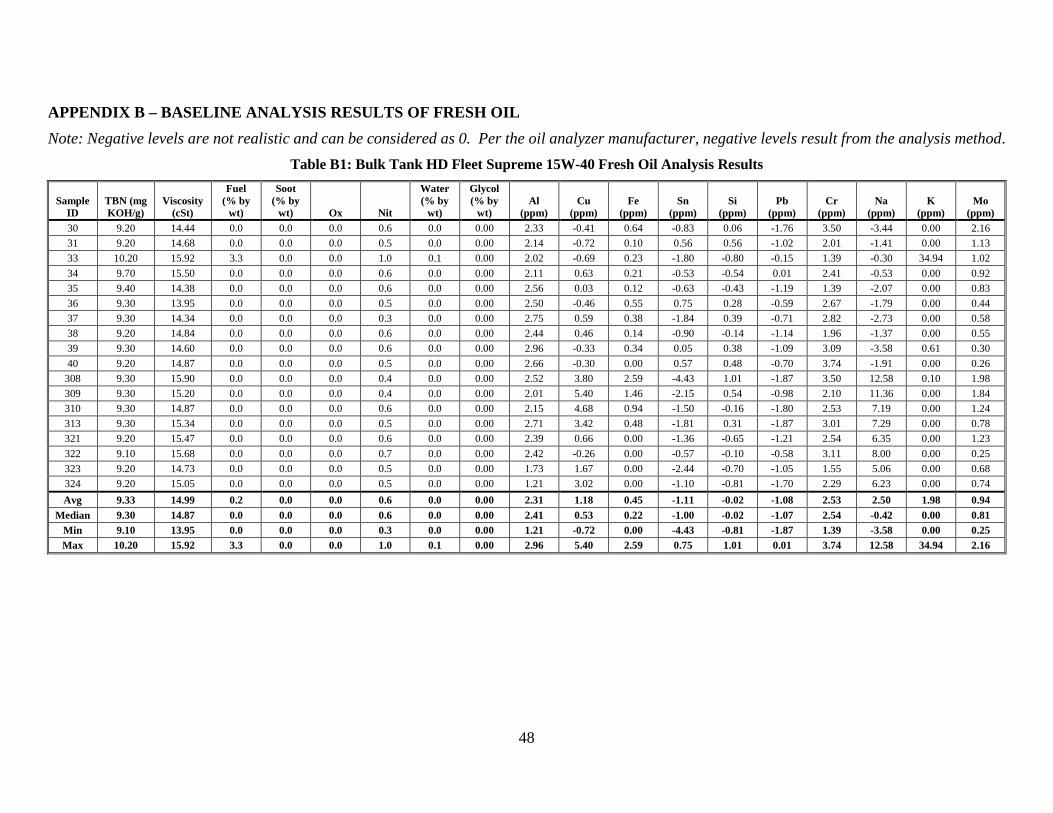
48
APPENDIX B – BASELINE ANALYSIS RESULTS OF FRESH OIL Note: Negative levels are not realistic and can be considered as 0. Per the oil analyzer manufacturer, negative levels result from the analysis method.
Table B1: Bulk Tank HD Fleet Supreme 15W-40 Fresh Oil Analysis Results
Sample ID
TBN (mg KOH/g)
Viscosity (cSt)
Fuel (% by
wt)
Soot (% by
wt) Ox Nit
Water (% by
wt)
Glycol (% by
wt) Al
(ppm) Cu
(ppm) Fe
(ppm) Sn
(ppm) Si
(ppm) Pb
(ppm) Cr
(ppm) Na
(ppm) K
(ppm) Mo
(ppm) 30 9.20 14.44 0.0 0.0 0.0 0.6 0.0 0.00 2.33 -0.41 0.64 -0.83 0.06 -1.76 3.50 -3.44 0.00 2.16 31 9.20 14.68 0.0 0.0 0.0 0.5 0.0 0.00 2.14 -0.72 0.10 0.56 0.56 -1.02 2.01 -1.41 0.00 1.13 33 10.20 15.92 3.3 0.0 0.0 1.0 0.1 0.00 2.02 -0.69 0.23 -1.80 -0.80 -0.15 1.39 -0.30 34.94 1.02 34 9.70 15.50 0.0 0.0 0.0 0.6 0.0 0.00 2.11 0.63 0.21 -0.53 -0.54 0.01 2.41 -0.53 0.00 0.92 35 9.40 14.38 0.0 0.0 0.0 0.6 0.0 0.00 2.56 0.03 0.12 -0.63 -0.43 -1.19 1.39 -2.07 0.00 0.83 36 9.30 13.95 0.0 0.0 0.0 0.5 0.0 0.00 2.50 -0.46 0.55 0.75 0.28 -0.59 2.67 -1.79 0.00 0.44 37 9.30 14.34 0.0 0.0 0.0 0.3 0.0 0.00 2.75 0.59 0.38 -1.84 0.39 -0.71 2.82 -2.73 0.00 0.58 38 9.20 14.84 0.0 0.0 0.0 0.6 0.0 0.00 2.44 0.46 0.14 -0.90 -0.14 -1.14 1.96 -1.37 0.00 0.55 39 9.30 14.60 0.0 0.0 0.0 0.6 0.0 0.00 2.96 -0.33 0.34 0.05 0.38 -1.09 3.09 -3.58 0.61 0.30 40 9.20 14.87 0.0 0.0 0.0 0.5 0.0 0.00 2.66 -0.30 0.00 0.57 0.48 -0.70 3.74 -1.91 0.00 0.26
308 9.30 15.90 0.0 0.0 0.0 0.4 0.0 0.00 2.52 3.80 2.59 -4.43 1.01 -1.87 3.50 12.58 0.10 1.98 309 9.30 15.20 0.0 0.0 0.0 0.4 0.0 0.00 2.01 5.40 1.46 -2.15 0.54 -0.98 2.10 11.36 0.00 1.84 310 9.30 14.87 0.0 0.0 0.0 0.6 0.0 0.00 2.15 4.68 0.94 -1.50 -0.16 -1.80 2.53 7.19 0.00 1.24 313 9.30 15.34 0.0 0.0 0.0 0.5 0.0 0.00 2.71 3.42 0.48 -1.81 0.31 -1.87 3.01 7.29 0.00 0.78 321 9.20 15.47 0.0 0.0 0.0 0.6 0.0 0.00 2.39 0.66 0.00 -1.36 -0.65 -1.21 2.54 6.35 0.00 1.23 322 9.10 15.68 0.0 0.0 0.0 0.7 0.0 0.00 2.42 -0.26 0.00 -0.57 -0.10 -0.58 3.11 8.00 0.00 0.25 323 9.20 14.73 0.0 0.0 0.0 0.5 0.0 0.00 1.73 1.67 0.00 -2.44 -0.70 -1.05 1.55 5.06 0.00 0.68 324 9.20 15.05 0.0 0.0 0.0 0.5 0.0 0.00 1.21 3.02 0.00 -1.10 -0.81 -1.70 2.29 6.23 0.00 0.74 Avg 9.33 14.99 0.2 0.0 0.0 0.6 0.0 0.00 2.31 1.18 0.45 -1.11 -0.02 -1.08 2.53 2.50 1.98 0.94
Median 9.30 14.87 0.0 0.0 0.0 0.6 0.0 0.00 2.41 0.53 0.22 -1.00 -0.02 -1.07 2.54 -0.42 0.00 0.81 Min 9.10 13.95 0.0 0.0 0.0 0.3 0.0 0.00 1.21 -0.72 0.00 -4.43 -0.81 -1.87 1.39 -3.58 0.00 0.25 Max 10.20 15.92 3.3 0.0 0.0 1.0 0.1 0.00 2.96 5.40 2.59 0.75 1.01 0.01 3.74 12.58 34.94 2.16
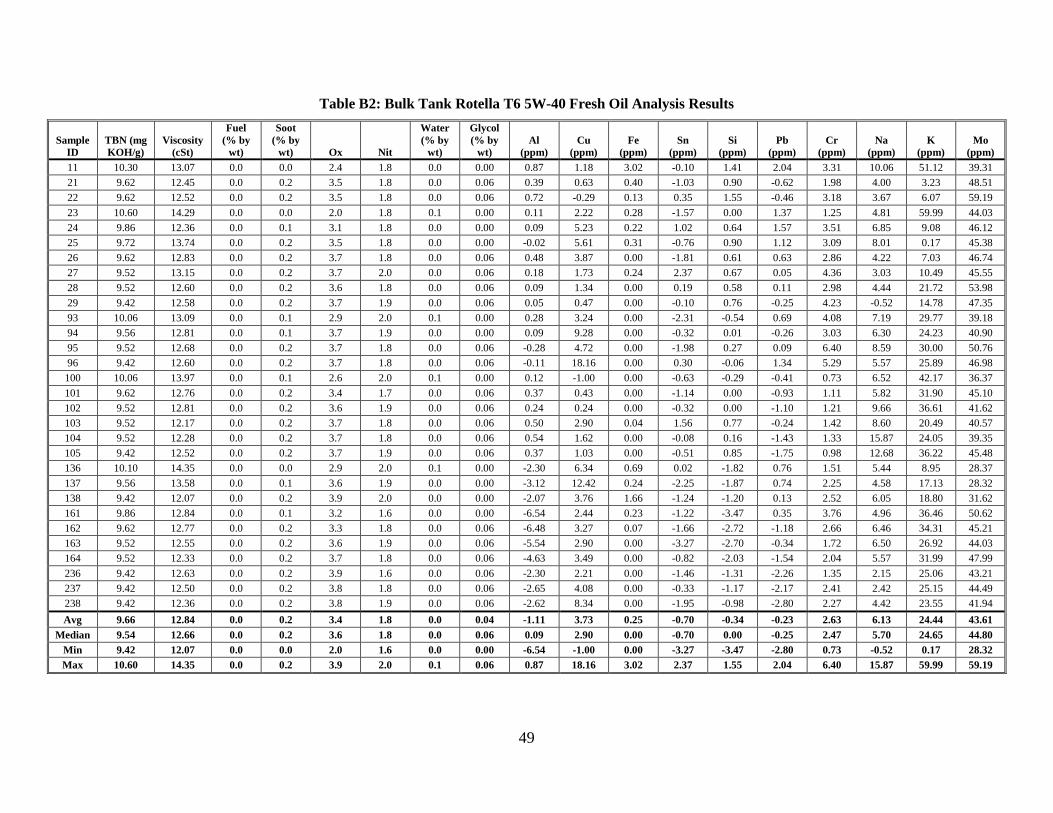
49
Table B2: Bulk Tank Rotella T6 5W-40 Fresh Oil Analysis Results
Sample ID
TBN (mg KOH/g)
Viscosity (cSt)
Fuel (% by
wt)
Soot (% by
wt) Ox Nit
Water (% by
wt)
Glycol (% by
wt) Al
(ppm) Cu
(ppm) Fe
(ppm) Sn
(ppm) Si
(ppm) Pb
(ppm) Cr
(ppm) Na
(ppm) K
(ppm) Mo
(ppm) 11 10.30 13.07 0.0 0.0 2.4 1.8 0.0 0.00 0.87 1.18 3.02 -0.10 1.41 2.04 3.31 10.06 51.12 39.31 21 9.62 12.45 0.0 0.2 3.5 1.8 0.0 0.06 0.39 0.63 0.40 -1.03 0.90 -0.62 1.98 4.00 3.23 48.51 22 9.62 12.52 0.0 0.2 3.5 1.8 0.0 0.06 0.72 -0.29 0.13 0.35 1.55 -0.46 3.18 3.67 6.07 59.19 23 10.60 14.29 0.0 0.0 2.0 1.8 0.1 0.00 0.11 2.22 0.28 -1.57 0.00 1.37 1.25 4.81 59.99 44.03 24 9.86 12.36 0.0 0.1 3.1 1.8 0.0 0.00 0.09 5.23 0.22 1.02 0.64 1.57 3.51 6.85 9.08 46.12 25 9.72 13.74 0.0 0.2 3.5 1.8 0.0 0.00 -0.02 5.61 0.31 -0.76 0.90 1.12 3.09 8.01 0.17 45.38 26 9.62 12.83 0.0 0.2 3.7 1.8 0.0 0.06 0.48 3.87 0.00 -1.81 0.61 0.63 2.86 4.22 7.03 46.74 27 9.52 13.15 0.0 0.2 3.7 2.0 0.0 0.06 0.18 1.73 0.24 2.37 0.67 0.05 4.36 3.03 10.49 45.55 28 9.52 12.60 0.0 0.2 3.6 1.8 0.0 0.06 0.09 1.34 0.00 0.19 0.58 0.11 2.98 4.44 21.72 53.98 29 9.42 12.58 0.0 0.2 3.7 1.9 0.0 0.06 0.05 0.47 0.00 -0.10 0.76 -0.25 4.23 -0.52 14.78 47.35 93 10.06 13.09 0.0 0.1 2.9 2.0 0.1 0.00 0.28 3.24 0.00 -2.31 -0.54 0.69 4.08 7.19 29.77 39.18 94 9.56 12.81 0.0 0.1 3.7 1.9 0.0 0.00 0.09 9.28 0.00 -0.32 0.01 -0.26 3.03 6.30 24.23 40.90 95 9.52 12.68 0.0 0.2 3.7 1.8 0.0 0.06 -0.28 4.72 0.00 -1.98 0.27 0.09 6.40 8.59 30.00 50.76 96 9.42 12.60 0.0 0.2 3.7 1.8 0.0 0.06 -0.11 18.16 0.00 0.30 -0.06 1.34 5.29 5.57 25.89 46.98
100 10.06 13.97 0.0 0.1 2.6 2.0 0.1 0.00 0.12 -1.00 0.00 -0.63 -0.29 -0.41 0.73 6.52 42.17 36.37 101 9.62 12.76 0.0 0.2 3.4 1.7 0.0 0.06 0.37 0.43 0.00 -1.14 0.00 -0.93 1.11 5.82 31.90 45.10 102 9.52 12.81 0.0 0.2 3.6 1.9 0.0 0.06 0.24 0.24 0.00 -0.32 0.00 -1.10 1.21 9.66 36.61 41.62 103 9.52 12.17 0.0 0.2 3.7 1.8 0.0 0.06 0.50 2.90 0.04 1.56 0.77 -0.24 1.42 8.60 20.49 40.57 104 9.52 12.28 0.0 0.2 3.7 1.8 0.0 0.06 0.54 1.62 0.00 -0.08 0.16 -1.43 1.33 15.87 24.05 39.35 105 9.42 12.52 0.0 0.2 3.7 1.9 0.0 0.06 0.37 1.03 0.00 -0.51 0.85 -1.75 0.98 12.68 36.22 45.48 136 10.10 14.35 0.0 0.0 2.9 2.0 0.1 0.00 -2.30 6.34 0.69 0.02 -1.82 0.76 1.51 5.44 8.95 28.37 137 9.56 13.58 0.0 0.1 3.6 1.9 0.0 0.00 -3.12 12.42 0.24 -2.25 -1.87 0.74 2.25 4.58 17.13 28.32 138 9.42 12.07 0.0 0.2 3.9 2.0 0.0 0.00 -2.07 3.76 1.66 -1.24 -1.20 0.13 2.52 6.05 18.80 31.62 161 9.86 12.84 0.0 0.1 3.2 1.6 0.0 0.00 -6.54 2.44 0.23 -1.22 -3.47 0.35 3.76 4.96 36.46 50.62 162 9.62 12.77 0.0 0.2 3.3 1.8 0.0 0.06 -6.48 3.27 0.07 -1.66 -2.72 -1.18 2.66 6.46 34.31 45.21 163 9.52 12.55 0.0 0.2 3.6 1.9 0.0 0.06 -5.54 2.90 0.00 -3.27 -2.70 -0.34 1.72 6.50 26.92 44.03 164 9.52 12.33 0.0 0.2 3.7 1.8 0.0 0.06 -4.63 3.49 0.00 -0.82 -2.03 -1.54 2.04 5.57 31.99 47.99 236 9.42 12.63 0.0 0.2 3.9 1.6 0.0 0.06 -2.30 2.21 0.00 -1.46 -1.31 -2.26 1.35 2.15 25.06 43.21 237 9.42 12.50 0.0 0.2 3.8 1.8 0.0 0.06 -2.65 4.08 0.00 -0.33 -1.17 -2.17 2.41 2.42 25.15 44.49 238 9.42 12.36 0.0 0.2 3.8 1.9 0.0 0.06 -2.62 8.34 0.00 -1.95 -0.98 -2.80 2.27 4.42 23.55 41.94 Avg 9.66 12.84 0.0 0.2 3.4 1.8 0.0 0.04 -1.11 3.73 0.25 -0.70 -0.34 -0.23 2.63 6.13 24.44 43.61
Median 9.54 12.66 0.0 0.2 3.6 1.8 0.0 0.06 0.09 2.90 0.00 -0.70 0.00 -0.25 2.47 5.70 24.65 44.80 Min 9.42 12.07 0.0 0.0 2.0 1.6 0.0 0.00 -6.54 -1.00 0.00 -3.27 -3.47 -2.80 0.73 -0.52 0.17 28.32 Max 10.60 14.35 0.0 0.2 3.9 2.0 0.1 0.06 0.87 18.16 3.02 2.37 1.55 2.04 6.40 15.87 59.99 59.19
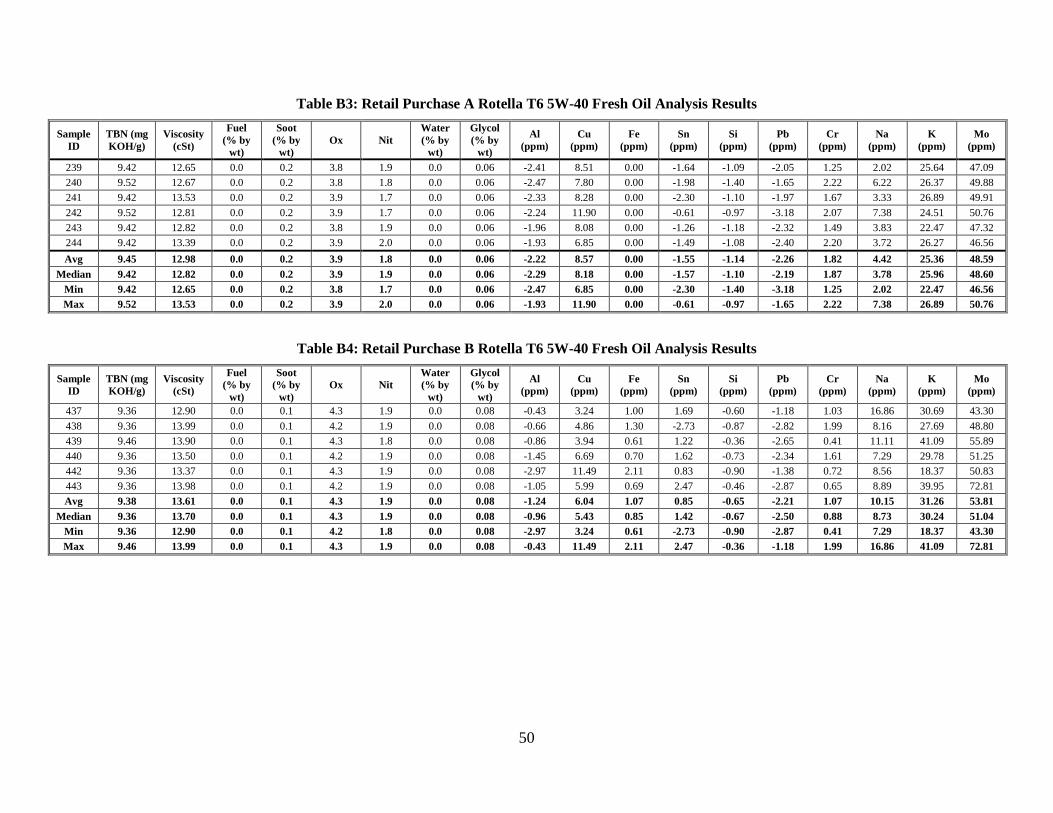
50
Table B3: Retail Purchase A Rotella T6 5W-40 Fresh Oil Analysis Results
Sample ID
TBN (mg KOH/g)
Viscosity (cSt)
Fuel (% by
wt)
Soot (% by
wt) Ox Nit
Water (% by
wt)
Glycol (% by
wt)
Al (ppm)
Cu (ppm)
Fe (ppm)
Sn (ppm)
Si (ppm)
Pb (ppm)
Cr (ppm)
Na (ppm)
K (ppm)
Mo (ppm)
239 9.42 12.65 0.0 0.2 3.8 1.9 0.0 0.06 -2.41 8.51 0.00 -1.64 -1.09 -2.05 1.25 2.02 25.64 47.09 240 9.52 12.67 0.0 0.2 3.8 1.8 0.0 0.06 -2.47 7.80 0.00 -1.98 -1.40 -1.65 2.22 6.22 26.37 49.88 241 9.42 13.53 0.0 0.2 3.9 1.7 0.0 0.06 -2.33 8.28 0.00 -2.30 -1.10 -1.97 1.67 3.33 26.89 49.91 242 9.52 12.81 0.0 0.2 3.9 1.7 0.0 0.06 -2.24 11.90 0.00 -0.61 -0.97 -3.18 2.07 7.38 24.51 50.76 243 9.42 12.82 0.0 0.2 3.8 1.9 0.0 0.06 -1.96 8.08 0.00 -1.26 -1.18 -2.32 1.49 3.83 22.47 47.32 244 9.42 13.39 0.0 0.2 3.9 2.0 0.0 0.06 -1.93 6.85 0.00 -1.49 -1.08 -2.40 2.20 3.72 26.27 46.56 Avg 9.45 12.98 0.0 0.2 3.9 1.8 0.0 0.06 -2.22 8.57 0.00 -1.55 -1.14 -2.26 1.82 4.42 25.36 48.59
Median 9.42 12.82 0.0 0.2 3.9 1.9 0.0 0.06 -2.29 8.18 0.00 -1.57 -1.10 -2.19 1.87 3.78 25.96 48.60 Min 9.42 12.65 0.0 0.2 3.8 1.7 0.0 0.06 -2.47 6.85 0.00 -2.30 -1.40 -3.18 1.25 2.02 22.47 46.56 Max 9.52 13.53 0.0 0.2 3.9 2.0 0.0 0.06 -1.93 11.90 0.00 -0.61 -0.97 -1.65 2.22 7.38 26.89 50.76
Table B4: Retail Purchase B Rotella T6 5W-40 Fresh Oil Analysis Results
Sample ID
TBN (mg KOH/g)
Viscosity (cSt)
Fuel (% by
wt)
Soot (% by
wt) Ox Nit
Water (% by
wt)
Glycol (% by
wt)
Al (ppm)
Cu (ppm)
Fe (ppm)
Sn (ppm)
Si (ppm)
Pb (ppm)
Cr (ppm)
Na (ppm)
K (ppm)
Mo (ppm)
437 9.36 12.90 0.0 0.1 4.3 1.9 0.0 0.08 -0.43 3.24 1.00 1.69 -0.60 -1.18 1.03 16.86 30.69 43.30 438 9.36 13.99 0.0 0.1 4.2 1.9 0.0 0.08 -0.66 4.86 1.30 -2.73 -0.87 -2.82 1.99 8.16 27.69 48.80 439 9.46 13.90 0.0 0.1 4.3 1.8 0.0 0.08 -0.86 3.94 0.61 1.22 -0.36 -2.65 0.41 11.11 41.09 55.89 440 9.36 13.50 0.0 0.1 4.2 1.9 0.0 0.08 -1.45 6.69 0.70 1.62 -0.73 -2.34 1.61 7.29 29.78 51.25 442 9.36 13.37 0.0 0.1 4.3 1.9 0.0 0.08 -2.97 11.49 2.11 0.83 -0.90 -1.38 0.72 8.56 18.37 50.83 443 9.36 13.98 0.0 0.1 4.2 1.9 0.0 0.08 -1.05 5.99 0.69 2.47 -0.46 -2.87 0.65 8.89 39.95 72.81 Avg 9.38 13.61 0.0 0.1 4.3 1.9 0.0 0.08 -1.24 6.04 1.07 0.85 -0.65 -2.21 1.07 10.15 31.26 53.81
Median 9.36 13.70 0.0 0.1 4.3 1.9 0.0 0.08 -0.96 5.43 0.85 1.42 -0.67 -2.50 0.88 8.73 30.24 51.04 Min 9.36 12.90 0.0 0.1 4.2 1.8 0.0 0.08 -2.97 3.24 0.61 -2.73 -0.90 -2.87 0.41 7.29 18.37 43.30 Max 9.46 13.99 0.0 0.1 4.3 1.9 0.0 0.08 -0.43 11.49 2.11 2.47 -0.36 -1.18 1.99 16.86 41.09 72.81