NCDOT GUIDE ON
54
Kittelson & Associates, Inc., ITRE at NCSU 1 March 2019 NCDOT GUIDE ON AUTOMATED TRAFFIC SIGNAL PERFORMANCE MEASURES March 2019 Prepared by: Alison Tanaka, P.E. Bastian Schroeder, Ph.D, P.E. Lake Trask, Ph.D. Thomas Chase
Transcript of NCDOT GUIDE ON

Kittelson & Associates, Inc., ITRE at NCSU 1 March 2019
NCDOT GUIDE ON
AUTOMATED TRAFFIC SIGNAL PERFORMANCE
MEASURES
March 2019
Prepared by: Alison Tanaka, P.E.
Bastian Schroeder, Ph.D, P.E. Lake Trask, Ph.D.
Thomas Chase

Kittelson & Associates, Inc., ITRE at NCSU 2 March 2019
TABLE OF CONTENTS 1 | Why Use ATSPMs? .................................................................................................................................................. 6
1.1. Proactive Management Approach ..................................................................................................................... 6
1.2. Comprehensive Information .................................................................................................................................. 6
1.3. Data-Driven Decisions ............................................................................................................................................. 6
1.4. More-Efficient Maintenance .................................................................................................................................. 7
2 | Who Will Be Impacted? ......................................................................................................................................... 8
2.1. Traffic Signal Timing Engineers and Technicians ................................................................................................ 8
2.2. Managers .................................................................................................................................................................. 8
2.3. Policy-Makers ............................................................................................................................................................ 8
2.4. Other Agency Groups ............................................................................................................................................ 8
2.5. Public.......................................................................................................................................................................... 8
3 | What Equipment is Required? ............................................................................................................................... 9
3.1. Communication ....................................................................................................................................................... 9
3.2. Detection ................................................................................................................................................................ 10
4 | How are ATSPMs Produced? ............................................................................................................................... 11
5 | What are the ATSPM System Options? ............................................................................................................... 12
5.1. Data Logger ........................................................................................................................................................... 12
5.2. Data Storage .......................................................................................................................................................... 12
5.3. Database Software ............................................................................................................................................... 13
5.4. ATSPM Software...................................................................................................................................................... 13
5.5. Costs and Benefits ................................................................................................................................................. 13
6 | Where Will ATSPMs Be Implemented? ............................................................................................................... 16
Appendix A | ATSPM Descriptions ........................................................................................................................... 17
Appendix B | Detection Options .............................................................................................................................. 37
Appendix C | ATSPM Resources .............................................................................................................................. 44
Appendix D | NCDOT Pilot Sites ............................................................................................................................... 46

Kittelson & Associates, Inc., ITRE at NCSU 3 March 2019
LIST OF EXHIBITS Exhibit 3-1. Communication Cost Per Intersection ........................................................................................................ 9
Exhibit 3-2. Detection Cost Per Intersection ................................................................................................................. 10
Exhibit 4-1. ATSPM System Components ....................................................................................................................... 11
Exhibit 5-1. ATSPM System Options ................................................................................................................................. 12
Exhibit 5-2. Implementation Costs (25 Intersections)* ................................................................................................. 14
Exhibit 5-3. Annual Subscription Costs (25 Intersections)* .......................................................................................... 14
Exhibit 5-4. Life Cycle Costs (25 Intersections)* ............................................................................................................ 14
Exhibit 5-5. ATSPM System Reports and Features (as of 5/16/18*) ............................................................................ 15
Exhibit 6-1. High-Priority Location Characteristics and Data Sources ...................................................................... 16

Kittelson & Associates, Inc., ITRE at NCSU 4 March 2019
LIST OF APPENDIX EXHIBITS Exhibit A-1. NCDOT ATSPM Priority Recommendations .............................................................................................. 18
Exhibit A-2. Example Purdue Phase Termination Report (NC50: Benson Road/SR2728: Rand Road) ............... 20
Exhibit A-3. Example Split Monitor Report (NC50: Benson Road/SR2728: Rand Road) ........................................ 21
Exhibit A-4. Example Pedestrian Delay Report (Source: Utah DOT) ......................................................................... 22
Exhibit A-5. Example Preemption Details Report (Source: Utah DOT) ..................................................................... 23
Exhibit A-6. Example Purdue Coordination Diagram Report (NC50: Benson Road/SR1010: Ten Ten Road) .... 24
Exhibit A-7. Example Purdue Coordination Diagram Reports Before and After an Offset Adjustment ............ 25
Exhibit A-8. Example Purdue Link Pivot Adjustments Table (Source: Utah DOT) .................................................... 26
Exhibit A-9. Example Purdue Link Pivot Approach Link Comparison (Source: Utah DOT) ................................... 27
Exhibit A-10. Example Turning Movement Counts Report (US17: Market Street/SR2734: Marsh Oaks Drive) ... 28
Exhibit A-11. Example Turning Movements Counts Data Table (US17: Market Street/SR2734: Marsh Oaks Drive) ................................................................................................................................................................................... 29
Exhibit A-12. Example Purdue Split Failure Report (NC50: Benson Road/SR2728: Rand Road) .......................... 30
Exhibit A-13. Example Approach Volume Report (US17: Market Street/SR2734: Marsh Oaks Drive) ................. 31
Exhibit A-14. Example Approach Volume Data Table (US17: Market Street/SR2734: Marsh Oaks Drive) ......... 32
Exhibit A-15. Example Approach Delay Report (US17: Market Street/Commercial Drive) .................................. 33
Exhibit A-16. Example Arrivals on Red Report (US17: Market Street/SR1402: Porters Neck Road) ...................... 34
Exhibit A-17. Example Approach Speed Report (Source: Utah DOT) ...................................................................... 35
Exhibit A-18. Example Yellow and Red Actuations Report (Source: Utah DOT) .................................................... 36
Exhibit B-1. Detection Requirements.............................................................................................................................. 37
Exhibit B-2. Detection Configuration A: No Additional Detection ........................................................................... 38
Exhibit B-3. Detection Configuration B: Stop Bar Detection ...................................................................................... 39
Exhibit B-4. Detection Configuration C: Stop Bar & Advance Detection ............................................................... 40
Exhibit B-5. Detection Configuration D: All Detection ................................................................................................ 41
Exhibit B-6. Detection Configuration E: Minor Stop Bar & Major Advance (Lane-by-Lane) (Current NCDOT Typical Detection Layout) ................................................................................................................................ 42
Exhibit B-7. Detection Configuration F: Minor Stop Bar & Major Advance (Lane Groups) .................................. 43
Exhibit D-1. NCDOT ATSPM Pilot Sites ............................................................................................................................. 46
Exhibit D-2. US 401: Map of Pilot Site .............................................................................................................................. 46
Exhibit D-3. US 401: Northeast-bound Flow Rates ........................................................................................................ 47

Kittelson & Associates, Inc., ITRE at NCSU 5 March 2019
Exhibit D-4. US 401: Southwest-bound Flow Rates ....................................................................................................... 47
Exhibit D-5. NC 55: Map of Pilot Site ............................................................................................................................... 48
Exhibit D-6. NC 55: Purdue Phase Termination Report ................................................................................................ 49
Exhibit D-7. NC 55: Turning Movement Count Report ................................................................................................ 49
Exhibit D-8. NC 50: Map of Pilot Site ............................................................................................................................... 50
Exhibit D-9. NC 50: Purdue Split Failure Report Before Coordination (and Increased Split) ................................ 51
Exhibit D-10. NC 50: Purdue Split Failure Report After Coordination (and Increased Split) ................................. 51
Exhibit D-11. US 17: Map of Pilot Site .............................................................................................................................. 52
Exhibit D-12. US 17: Purdue Coordination Diagram Before Coordination .............................................................. 53
Exhibit D-13. US 17: Purdue Coordination Diagram After Coordination ................................................................. 53

Kittelson & Associates, Inc., ITRE at NCSU 6 March 2019
1 | Why Use ATSPMs? Automated Traffic Signal Performance Measures (ATSPMs) are an important part of building Smart Communities. ATSPMs and the underlying high-resolution data will enhance NCDOT practice in three key ways by helping staff make proactive, well-informed, data-driven decisions for the traffic signal system. NCDOT already has access to some signal performance measures through existing central systems. This data includes information that is similar to some of the ATSPMs, but high-resolution data allows traffic engineers and technicians to review all intersection events (i.e. signal state and roadway user arrivals) on a cycle-by-cycle basis. The database of intersection events can be filtered and summarized in numerous, customized ways that result in more-efficient review of signal timing.
1.1. PROACTIVE MANAGEMENT APPROACH Identify issues before public service requests are received. NCDOT can use automated alerts to identify malfunctioning equipment and operational issues (i.e. long delays and poor progression quality). If a monitoring program is established and alerts are checked regularly (e.g., using WatchDog emails), work orders and signal timing adjustments can be completed before members of the public call to report issues.
Measure performance instead of predicting it. Traffic signal timing engineers often spend a considerable amount of time calibrating models to existing conditions before evaluating signal timing adjustments. ATSPMs allow NCDOT to quickly and continuously measure the impact of signal timing changes, reducing the need to develop a model to represent existing conditions.
1.2. COMPREHENSIVE INFORMATION Evaluate performance trends. Traffic signal timing engineers traditionally collect data over several days for retiming projects. ATSPMs are collected continuously at 1/10-second resolution, which allows an agency to compare current conditions to historical data. NCDOT can track operational and maintenance trends over time without manual data-collection efforts.
Prepare for connected vehicles. Current detection provides static vehicle location information, but connected vehicles will be able to report trajectories. Developing a system for collecting, processing, and evaluating high-resolution data will help NCDOT prepare for an even larger dataset produced by connected vehicles.
1.3. DATA-DRIVEN DECISIONS Make better-informed signal timing adjustments. Instead of basing signal timing off a single day of data, traffic signal timing engineers will have weeks or months of trends that can inform parameter adjustments.
Distribute resources more effectively. Signal retiming and infrastructure upgrades are often made based on a pre-determined schedule (e.g., every three years), which may not address the most-critical intersections. ATSPMs can be used to identify “hot spots” where measures exceed allowable thresholds, ensuring that resources are spent where they can have the most impact.

Kittelson & Associates, Inc., ITRE at NCSU 7 March 2019
Quantify progress. ATSPMs can be used to produce dashboard reports for decision-makers and the public that go beyond traditional travel time metrics. NCDOT should compare performance measures to established targets as a foundation for the arterial management system and to show progress made through traffic signal system investments.
1.4. MORE-EFFICIENT MAINTENANCE Identify high-priority locations. ATSPMs are calculated using high-resolution data that is made up of standard enumerations. This allows the same performance measures to be developed across a traffic signal system or across multiple systems throughout the state. This can help NCDOT identify high-priority locations for operations and maintenance activities.
Spend less time troubleshooting. ATSPMs can be used to pinpoint malfunctioning equipment to reduce the time technicians spend troubleshooting in the field, including nights and weekends.

Kittelson & Associates, Inc., ITRE at NCSU 8 March 2019
2 | Who Will Be Impacted? ATSPMs will impact traffic signal timing engineers and technicians most directly (both internal staff and consultants), but the information can also change how decisions are made at the management level and ultimately influences how the system operates for the traveling public. This section describes how ATSPMs will change day-to-day activities for different stakeholders. Refer to Appendix A for detailed ATSPM descriptions and example applications.
2.1. TRAFFIC SIGNAL TIMING ENGINEERS AND TECHNICIANS Traffic signal timing adjustments. Traffic signal timing engineers will use ATSPMs instead of predicitve
models to determine signal timing changes. Equipment repairs. Technicians will use the granular information from ATSPMs to pinpoint issues
without spending significant time troubleshooting in the field. Before-and-after studies. Instead of collecting data for “before” and “after” periods, traffic signal
timing engineers and technicians will review ATSPMs continuously to assess signal timing adjustments and equipment repairs.
2.2. MANAGERS Monitoring program. Managers will establish a routine process for checking automated alerts, so
that staff screen issues, write work orders, and make signal timing adjustments before receiving public service calls.
Prioritizing projects. Managers will use ATSPMs to prioritize project locations for both signal retiming and equipment repairs. Instead of completing operations and maintenance activities on a set schedule, the most-critical locations will be identified and addressed.
2.3. POLICY-MAKERS Cost/benefit information. Policy-makers will use cost/benefit information developed using ATSPMs
to evaluate current investments. Programming future investments. Policy-makers will track ATSPMs over time to inform future
investments.
2.4. OTHER AGENCY GROUPS Collaboration with IT staff. IT staff will work closely with the traffic signal group for network
connections and data management. Information for planners, economic developers, and designers. Planners and economic developers
will have access to ongoing volume reports, and designers will be able to use maintenance-related information to inform designs.
2.5. PUBLIC Improved safety. The public will experience improved safety resulting from adjustments to reduce
red-light-running and congestion-related crashes. Reduced congestion. The public will experience reduced delay at signalized intersections. Improved reliability. The public will experience improved progression quality on coordinated
corridors.

Kittelson & Associates, Inc., ITRE at NCSU 9 March 2019
3 | What Equipment is Required? There are equipment requirements that depend on the ATSPM system that is selected, but some equipment is needed regardless of the type of system. Communication between field devices and the central office is required for automated data collection and scalable performance-based management. Detection is not required for every signal performance measure, but is necessary for tracking roadway user presence and for producing comprehensive operations information. Costs will vary significantly depending on the existing equipment that is installed and the desired features of the system.
3.1. COMMUNICATION Communication is required to automate the data-collection process and develop a scalable performance-based management program. Per intersection cost estimates shown in Exhibit 3-1 were developed assuming the closest intersection (¼-mile spacing) was connected. If there is no connection from the closest intersection to a central location, it can be added via cellular communication, which has equipment costs for modems and switches as well as monthly subscription costs that will vary by provider.
Fiber. Fiber provides reliable communication between field devices and the central office. While this low-latency interconnect will be useful for ATSPMs, it may ultimately be selected to support other systems (e.g., monitoring cameras or adaptive traffic signal control). This type of interconnect requires fiber-optic cable, conduit, junction boxes, splice enclosures, fiber distribution units, switches, communication panels, and staff time (or consultants) to prepare design plans.
Wireless Radio. Wireless options are often installed at intersections that are separated from an existing hardwired interconnect backbone. Particularly if there are clear lines of sight, wireless interconnect can be a cost-effective option for connecting field devices to the central office. This type of interconnect requires radios, cable, switches, communication panels, and staff time (or consultants) to prepare design plans.
Raspberry Pi. This is a device that can be programmed with ATSPM software to collect high-resolution data from the traffic signal controller and store it until it can be manually retrieved. While this type of “communication” does not automate the data-collection process, it does provide an interim, low-cost option for collecting high-resolution data. This option requires the Raspberry Pi device as well as staff time (or consultants) to program the ATSPM software, install the device in the field, and download the data during periodic field visits.
Exhibit 3-1. Communication Cost Per Intersection
Note: Cost estimates assume ¼-mile spacing between intersections. Includes 20% contingency.
$85,000
$11,000 $2,000
$0$10,000$20,000$30,000$40,000$50,000$60,000$70,000$80,000$90,000
$100,000
Option 1: Fiber Option 2: Wireless Radio Option 3: Raspberry Pi

Kittelson & Associates, Inc., ITRE at NCSU 10 March 2019
3.2. DETECTION Detection is required to collect roadway user presence information. Some signal performance measures can be reported without detection, but most require some detection. Appendix B contains a summary of detection options and associated measures, including the typical NCDOT detection layout. Cost estimates shown in Exhibit 3-2 were developed assuming a five-lane cross section on the major street and three-lane cross section on the minor street.
Radar. This above-ground technology allows detection zones to be programmed flexibly. For certain performance measures (i.e. turning movement counts), the ability to detect vehicles lane-by-lane is critical. If NCDOT moves to using the SDLC port, radar detection would allow more detection zones to be programmed through a cabinet interface unit that operates outside the detector rack, which would result in fewer cabinet-space limitations. This type of detection requires advance radar units, stop bar radar units, cable, conduit, junction boxes, cabinet hardware, and staff time (or consultants) to prepare design plans.
Loops. This in-pavement option is common throughout North Carolina. The number of detection zones that can be installed is often limited because of available cabinet space; loops may need to be connected in series across lanes in order to have enough detector channels for the entire intersection. This type of detection requires advance loops, stop bar loops, cable, conduit, junction boxes, detector cards, and staff time (or consultants) to prepare design plans.
Standard Loop Layout Existing. The typical NCDOT detection layout can be used to produce some signal performance measures (see Appendix B). But consideration should be given to adding stop bar presence detection on the major street for a complete picture of the intersection. The cost estimate in Exhibit 3-2 includes the addition of lane-by-lane stop bar detection on the major street.
No Loops Existing. If no detection is present, the typical NCDOT detection layout is recommended and consideration should be given to lane-by-lane stop bar presence detection in all lanes (major street and minor street). The cost estimate in Exhibit 3-2 includes lane-by-lane stop bar detection in all lanes (major street and minor street) and lane-by-lane advance detection on the major street.
Video. This above-ground technology typically uses cabinet hardware that fits into the detector rack; however, the modules support more detector channels than a traditional detector card. For certain performance measures (i.e. turning movement counts), the ability to program lane-by-lane detection zones is critical. This type of detection requires video detection cameras, cable, conduit, junction boxes, cabinet hardware, and staff time (or consultants) to prepare design plans.
Exhibit 3-2. Detection Cost Per Intersection
Note: Cost estimates assume a five-lane cross section on the major street and a three-lane cross section on the minor street. Includes 20% contingency.
$74,000
$28,000
$82,000
$69,000
$0$10,000$20,000$30,000$40,000$50,000$60,000$70,000$80,000$90,000
$100,000
Option 1: Radar Option 2a: Loops (StandardExisting)
Option 2b: Loops (NoneExisting)
Option 3: Video

Kittelson & Associates, Inc., ITRE at NCSU 11 March 2019
4 | How are ATSPMs Produced? The ATSPM process is illustrated in Exhibit 4-1 with data being transformed from logs to reports to information to decisions. High-resolution data is collected by a data logger at each signalized intersection. The unprocessed data is sent to a central location where it is stored. Database software is used to normalize the unprocessed data. ATSPM software is used to calculate ATSPMs and produce visual reports for staff and public
consumption.
Exhibit 4-1. ATSPM System Components
Data Logger. Data loggers are used to log and store high-resolution data at a signalized intersection until it is transferred to a central location. Additional information is available in Section 5.1.
Data Storage. ATSPM systems require data storage at a central location. The open source code option requires NCDOT to purchase storage, while the vendor solutions include cloud-based storage. Data storage can be physical equipment at the central office or a cloud-based solution. Additional information is available in Section 5.2.
Database Software. High-resolution data is stored in an unprocessed format. While vendors will convert and store the data as part of their ATSPM system, the open source code requires NCDOT to procure database software to store high-resolution data that has been converted into a standard format. Additional information is available in Section 5.3.
ATSPM Software. ATSPM software uses data stored in the database to calculate various metrics and produce reports that can be viewed through a website or desktop application. While ATSPM systems require different equipment (as referenced above), they are also differentiated by software capabilities. Additional information is available in Section 5.4.

Kittelson & Associates, Inc., ITRE at NCSU 12 March 2019
5 | What are the ATSPM System Options? While other ATSPM systems exist, there were four options evaluated for NCDOT (summarized in Exhibit 5-1). Any installation of hardware and/or software will need to follow the NCDOT approval process. Open Source Code Econolite Centracs® SPM Trafficware SPM Cloud Miovision TrafficLink
Exhibit 5-1. ATSPM System Options Component Open Source Code Econolite Trafficware Miovision
Data Logger Any Linux-Based Controller
Econolite Linux-Based Controller
Trafficware Linux-Based Controller
Miovision SmartLink or Any Linux-Based
Controller
Data Storage Server or Cloud-Based
Included (Cloud-Based)
Included (Cloud-Based)
Included (Cloud-Based)
Database Software SQL Server Included Included Included ATSPM Software Open Source Code Centracs® SPM SPM Cloud TrafficLink
5.1. DATA LOGGER Controller with High-Resolution-Data Logger. Modern traffic signal controllers are capable of logging 1/10-second-resolution data required for ATSPMs. Most controller vendors produce an ATC controller that has a data-logging feature. Alternatively, 2070 controllers can often be converted through a 1C CPU module. This type of data logger requires the controller (or 1C CPU module) as well as staff time (or a consultant) to program the signal timing in the new firmware, bench test, and install the controller in the field. As of writing, the pilot site intersections (see Appendix D) are the only locations with ATC controllers capable of logging high-resolution data. In order to obtain high-resolution data, controller upgrades (or external hardware) will be required. NCDOT plans to install ATC controllers with high-resolution-data loggers for all future projects (unless another version is specifically required).
External Hardware. There are several vendors that produce hardware that can be used external to the traffic signal controller to log high-resolution data. Without a connection to the traffic signal controller, there are some events that will not be logged (e.g., termination types), but external hardware can record inputs (e.g., detector actuations) and outputs (e.g., displays) using other cabinet components. This type of data logger requires the cabinet hardware and typically time for the vendor to configure and install it in the field.
5.2. DATA STORAGE NCDOT Server. This equipment can store the unprocessed high-resolution data, database software, and ATSPM software. This type of data storage requires a server with the appropriate processing power, memory, and disk configuration plus staff time (or a consultant) to install it at the central office. Coordination with IT staff will be critical for integration into the network.
Cloud. If an agency does not want to maintain physical equipment at the central office, they can subscribe to a cloud-based solution where a private entity hosts the server(s). Vendors typically use a cloud-based solution to provide access to data. Cloud-based solutions require IT coordination for firewall access.

Kittelson & Associates, Inc., ITRE at NCSU 13 March 2019
5.3. DATABASE SOFTWARE SQL Server. There are several types of database software available. SQL Server is a popular option for use with the open source code. There is a free version of this database software, but it has limited applications because of size constraints (10 GB or approximately 1,000 intersection-days). The professional versions of this database software vary in price based on the number of users who will access the program. NCDOT has an existing license for the Enterprise version, which should accommodate addition of ATSPM data, and can help offset initial cost for ATSPM software (particularly the open source code).
5.4. ATSPM SOFTWARE Open Source Code. This software is free through the web-based FHWA Open Source Application Data Portal (OSADP) and can process data from any Linux-based controller. It does require staff time (or a consultant) to install the software, configure intersections, verify that data is being collected and processed correctly, and troubleshoot issues.
Econolite Centracs® SPM. This software is subscription-based (with an initial setup fee) and requires an Econolite Linux-based controller. The per-intersection cost decreases at 100 intersections.
Trafficware SPM Cloud. This software is subscription-based (with an initial setup fee) and requires a Trafficware Linux-based controller. The per-intersection cost decreases at 101 intersections.
Miovision TrafficLink. This software is subscription-based (with an initial setup fee) and can process data from any Linux-based controller. Alternatively, Miovision manufactures SmartLink, which is a piece of hardware external to the traffic signal controller (with built-in cellular communication). It can be used alongside non-Linux-based controllers, but will not record every event in that case (e.g., termination types).
5.5. COSTS AND BENEFITS Costs. Because of the difference in implementation costs and annual subscription fees, the cost to deploy an ATSPM system is different the first year compared to subsequent years. Exhibit 5-3 compares implementation costs and Exhibit 5-4 compares annual subscription costs for the ATSPM systems when applied to 25 intersections. Exhibit 5-5 compares total costs on a yearly basis over the course of 10 years. Implementation costs include hardware and software (i.e. data loggers, data storage, database software, and ATSPM software) as well as installation and configuration time. Subsequent costs include annual maintenance and periodic upgrades.
Benefits. Exhibit 5-5 summarizes available reports and features (although whether they can be produced will depend on the detection that is installed). This evaluation was conducted as of 5/16/18. All ATSPM systems will continue to evolve, so updates will be needed as new information becomes available. Report categories were selected for inclusivity of all vendor options, but additional information about common ATSPMs is available in Appendix A.
General benefit/cost observations include:
ATSPM solutions with higher costs generally have additional reports and features available. The open source code is more expensive to deploy than the vendor options. However, the vendor
options have recurring annual subscription fees, so life cycle costs should be considered. The open source code provides flexibility to customize signal performance measures, but also
requires NCDOT to maintain the system (typically necessitating close coordination with IT staff). The open source code and Miovision solutions can process data from any Linux-based controller,
while the Econolite and Trafficware solutions require their own Linux-based controllers.

Kittelson & Associates, Inc., ITRE at NCSU 14 March 2019
Exhibit 5-2. Implementation Costs (25 Intersections)*
Exhibit 5-3. Annual Subscription Costs (25 Intersections)*
Exhibit 5-4. Life Cycle Costs (25 Intersections)*
* Note: Cost estimates for all options assume NCDOT needs to procure data loggers. The open source code cost estimate assumes NCDOT needs to procure data storage hardware and database software. Includes 20% contingency.
$183,000 $166,000
$152,000 $126,000
$0
$25,000
$50,000
$75,000
$100,000
$125,000
$150,000
$175,000
$200,000
$225,000
$250,000
Open Source Code Econolite Trafficware Miovision
HardwareSoftware
$0 $11,000 $8,000
$30,000
$0
$25,000
$50,000
$75,000
$100,000
$125,000
$150,000
$175,000
$200,000
$225,000
$250,000
Open Source Code Econolite Trafficware Miovision
$0
$50,000
$100,000
$150,000
$200,000
$250,000
$300,000
$350,000
$400,000
$450,000
0 2 4 6 8 10Number of Years
Open Source Code Econolite Trafficware Miovision

Kittelson & Associates, Inc., ITRE at NCSU 15 March 2019
Exhibit 5-5. ATSPM System Reports and Features (as of 5/16/18*)
Report/Feature Open Source Econolite Trafficware Miovision Phase Termination Metric(s) ● ● ● ◐ (1)
Progression Quality Metric(s) ● ● ● ●
Split Failure Metric(s) ● ◐ (2) ◐ (2) ●
Delay Metric(s) ● ● ● ●
Volume Metric(s) ● ● ● ●
Yellow and Red Actuations Metric(s) ● ○ ● ○
Pedestrian Metric(s) ● ● ● ●
Preemption Metric(s) ● ● ● ◐ (3)
Speed / Travel Time Metric(s) ◐ (4) ○ ○ ●
Chart Customizations (e.g., Axis Min/Max, Data Filters)
● ◐ (5) ● ●
Query Multiple Days on a Single Chart ● ◐ (6) ○ ●
Filter Data by Day of the Week ◐ (7) ◐ (8) ○ ●
Historical Data Comparison ○ ◐ (9) ○ ◐ (10)
Query Multiple Intersections on a Single Chart
○ ○ ○ ◐ (11)
Dashboard Metric(s) for Multiple Intersections (Corridor / Network)
○ ● ○ ●
Summary Tables ◐ (12) ● ○ ●
Highlight "Hot Spots" ○ ● ○ ●
Programmable Alerts ● ● ○ ●
Optimization Features (e.g., Cycle Length, Split, Offset)
◐ (13) ● ○ ●
Process Data from Different Vendors ● ○ ○ ●
No External Hardware Required ● ● ● ● (14)
Integrate with Non-Linux-Based Controllers (ATC or 2070 with 1C CPU)
○ ○ ○ ●
Access to Raw High-Resolution Data ● ◐ (15) ◐ (15) ●
Ability to Customize Reports ● ○ ○ ○
Guidance Documentation ● ● ○ ●
Legend ● Available ◐ Partially Available ○ Not Available * Note: Reports and features are under development for all ATSPM systems. Evaluation reflects available reports and features as of 5/16/18. (1) Phase duration information available. Phase termination type not available (i.e. max out, force off, gap out, skip). (2) Green and red occupancy information available. Split failures not identified based on occupancy threshold. (3) Preempt alert monitoring available. No preemption details available. (4) Speed metric available only for Wavetronix radar detection. (5) Ability to zoom in and out of charts. No available axis settings or data filters. (6) Ability to overlay data from multiple days for some metrics (i.e. phase termination, progression quality, delay, volume, pedestrian) in comparison charts. Not available for all metrics. (7) Link pivot arrivals on green can be filtered by day of the week. Not available for all metrics. (8) Ability to filter data by day of the week for some metrics (i.e. phase termination, progression quality, delay, volume, pedestrian) in comparison charts. Not available for all metrics. (9) Ability to overlay data from two date ranges for some metrics (i.e. phase termination, progression quality, delay, volume, pedestrian) in comparison charts. Not available for all metrics. (10) Ability to add historical data to some charts (i.e. delay, volume, pedestrian, speed / travel time). Not available for all metrics. (11) Multiple charts can be displayed together for progression quality and travel time / speed metrics. Additionally, all metrics can be viewed on the same reporting canvas. (12) Summary tables available for turning movement counts and link pivot arrivals on green. (13) Link pivot available for offset optimization. (14) Software-only solution available. External hardware provides travel time data, cellular communication, and ability to collect high-resolution data if there is a non-Linux-based controller. (15) Raw high-resolution data available, but must be requested from vendor.

Kittelson & Associates, Inc., ITRE at NCSU 16 March 2019
6 | Where Will ATSPMs Be Implemented? NCDOT should use data and input from the Signal Retiming Prioritization Process to select intersections for ATSPM deployment. Three tiers are proposed for categorizing intersections: Tier I: High Priority – High-priority location recommended for permanent and full-scale
ATSPM deployment. If not already installed, the location should be upgraded with reliable, low-latency communication (i.e. fiber), stop bar detection on all approaches, and advance detection on the coordinated approaches.
Tier II: Medium Priority – Medium-priority location that may benefit from a temporary ATSPM evaluation. While the location may not warrant a permanent installation, NCDOT may want to evaluate ATSPMs before/after signal retiming or during special events using a low-cost option (i.e. Raspberry Pi data logger with open source code installed).
Tier III: Low Priority – Low-priority location not recommended for ATSPM deployment. The location may require significant investment to connect to a communications network or the benefits of ATSPMs may be marginal because the intersection is performing below saturation levels.
Intersections that meet five (5) or more of the characteristics listed in Exhibit 6-1 should be prioritized for Tier I ATSPM deployment. Intersections with three (3) to five (5) characteristics should be considered for Tier II deployments.
The NCDOT Signal Retiming Prioritization Process website contains the data required to evaluate several of the characteristics. Information about existing equipment and planned projects will need to be acquired from other sources such as NCDOT staff.
Exhibit 6-1. High-Priority Location Characteristics and Data Sources
High-Priority Intersection Characteristics Data Source
Prioritization Framework Other Source Existing equipment that meets ATSPM needs Planned construction projects that can incorporate equipment required for ATSPMs
High travel times (relative to travel times at the speed limit)
Low travel time reliability (relative to other corridors) High exposure (volumes and/or volume-to-capacity1) Low safety (high crashes and/or crash frequency) Planned retiming projects that will otherwise use traditional methods
1 ATSPMs are most applicable at intersections with high volume-to-capacity ratios, approaching capacity. Severely congested corridors (i.e. demand higher than capacity) may not benefit from re-timing alone to relieve congestion.

Kittelson & Associates, Inc., ITRE at NCSU 17 March 2019
Appendix A | ATSPM DescriptionsThis appendix provides an overview of 13 ATSPMs that can be produced from high-resolution data. While the ATSPMs in this section are from the open source code option, similar reports are available in most of the vendor options. These metrics can be used to:
Determine whether traffic signal equipment is functioning.
Determine if signal timing is serving intersection demand effectively.
Inform adjustments to the signal equipment.
Inform adjustments to the signal operations.
Identify problems quickly.
Exhibit A-1 summarizes whether these ATSPMs are high-priority and/or available with the typical NCDOT detection layout. Each of the metrics has been evaluated based on how well it could potentially serve the needs of NCDOT.
GREEN denotes metrics that align with NCDOT objectives and are available with NCDOT typical detection.
YELLOW denotes metrics that align with NCDOT objectives but will likely require some additional equipment for full funcationality.
RED denotes metrics that may not be as informative for NCDOT objectives or will likely require extensive equipment additions.
Different metrics can be produced based on available hardware and software, but ATSPMs all require that traffic signal events (e.g., signal states and vehicle actuations) be recorded using standard event codes and that those logs be downloaded to a central database.
FOR MORE IN-DEPTH INFORMATION ON ATSPMS
Performance Measures for Traffic Signal Systems: An Outcome-Oriented Approach This Purdue University report, produced as part of the Pooled Fund Study TPF-5(258), summarizes research on signal performance measures and presents a methodology for using them to evaluate the performance of a signal system. The report contains information on infrastructure requirements as well as performance measures capable of reporting capacity, progression, multimodal operations, maintenance, and travel time.
Integrating Traffic Signal Performance Measures into Agency Business Processes This Purdue University report, also produced as part of the Pooled Fund Study TPF-5(258), summarizes requirements for collecting and processing high-resolution data as well as example uses for signal performance measures related to communication and detector system health, quality of local control, and quality of progression.
Automated Traffic Signal Performance Measures Component Details & Automated Traffic Signal Performance Measures Reporting Details The Georgia Department of Transportation (GDOT) produced three guidance documents to accompany the Utah Department of Transportation (UDOT) ATSPM website. Automated Traffic Signal Performance Measures Component Details describes the website components and how to configure reports to display various features. Automated Traffic Signal Performance Measures Reporting Details provides details about report requirements and how to interpret the reports.

Kittelson & Associates, Inc., ITRE at NCSU 18 March 2019
Exhibit A-1. NCDOT ATSPM Priority Recommendations
ATSPM Recommended
Priority
Available with Typical NCDOT
Detection Layout 1 Notes Purdue Phase Termination Split Monitor Pedestrian Delay Preemption Details Purdue Coordination Diagram
Purdue Link Pivot Report is useful for corridor-level assessment.
Turning Movement Counts Some Limitations
Report is useful for reviewing detection by channel, and no additional detection is required for that feature. The most-accurate detection for Turning Movement Counts will be past the stop bar.
Purdue Split Failure Some Limitations
Can use report for assessing left-turn and side-street split failures with NCDOT typical detection.1 Installation of stop bar presence detection likely required on the major street for full split failure information.
Approach Volume Report provides similar information to Turning Movement Counts.
Approach Delay
Arrivals on Red Report provides similar information to Purdue Coordination Diagrams and Purdue Link Pivot.
Approach Speed Open source code requires Wavetronix advance radar detection capable of measuring speeds.
Yellow and Red Actuations Requires count detection in the intersection or at the stop bar with speed restrictions.
1 NCDOT typical detection includes stop-bar presence detection on the minor street and in the left-turn lanes and advance detection on the major street (see Appendix B).

Kittelson & Associates, Inc., ITRE at NCSU 19 March 2019
A.1. PURDUE PHASE TERMINATION Purdue Phase Termination reports how phases terminated each cycle during a specified time period (see example in Exhibit A-2). Phase termination types include:
Gap out – when the signal controller terminates the phase because the minimum time has been served, there was a conflicting call, and the vehicle extension timer has expired. If a phase gaps out, it may indicate the phase has available capacity or the need to investigate alternative reasons (such as a large volume of trucks or passage settings).
Max out – when there is sufficient traffic to extend the phase to its maximum time. If a phase maxes out, it may indicate the phase is at or over capacity or the need to investigate alternative reasons (such as a broken detector holding a constant call).
Force off – when there is sufficient traffic to extend the phase to its force-off point. This is similar to a max out but occurs when the controller is timing a coordinated plan. If a phase forces off, it indicates the phase is at or over capacity. Note that coordinated phases are typically coded as forcing off every cycle.
Skip – when a phase does not time because there was no call. Pedestrian activity – which indicates the termination point for pedestrian phases.
This metric provides the same type of phase termination information available through the TransLink32 split monitor report. ATSPMs build on current central system capabilities, and the underlying database of high-resolution data allows for additional custom reports and alerts to be programmed.
No additional detection is necessary to produce a Purdue Phase Termination report beyond the detection that is currently being used to operate the traffic signal, and detection information does not need to be programmed into the system for this report to be generated. The report is most useful for intersections that have detection, but it can be used to confirm operations at pre-timed intersections as well.
NCDOT would benefit from using this measure because it summarizes operations for all phases at an intersection. Purdue Phase Termination reports can be applied in the following ways:
Estimating if there is available capacity at the intersection. Identifying detector failures causing phases to max out during low-volume periods. Verifying whether signal timing parameters (e.g., recalls) have been programmed correctly. Assessing actuated phases (e.g., frequency of actuated pedestrian phases).

Kittelson & Associates, Inc., ITRE at NCSU 20 March 2019
Exhibit A-2. Example Purdue Phase Termination Report (NC50: Benson Road/SR2728: Rand Road)

Kittelson & Associates, Inc., ITRE at NCSU 21 March 2019
A.2. SPLIT MONITOR Split Monitor reports phase termination information (similar to Purdue Phase Termination) but combines it with information on split duration (in seconds) and programmed splits. While the Purdue Phase Termination report displays all phases on a single chart, the Split Monitor report separates phases into individual charts, so that more detail can be provided (see example in Exhibit A-3). Purdue Phase Termination and Split Monitor can be used together to assess traffic signal operations. For example, a practitioner can use a Purdue Phase Termination report to identify phases with available capacity (i.e. mostly gap outs during a particular time period), and then investigate how much available capacity those phases have using a Split Monitor report. Because the Split Monitor report shows phase durations compared to programmed splits, it is possible to assess not only how often a phase gaps out versus maxes out/forces off, but also how much time it may actually need.
No special configuration is needed to produce a Split Monitor report. Like Purdue Phase Termination, detection information does not need to be programmed. While unique detection is not required to produce this report, Split Monitor is most useful for actuated intersections.
Split Monitor can be used by NCDOT in a similar manner as Purdue Phase Termination and is useful because of its capability to provide in-depth information about each phase. Split Monitor reports can be applied in the following ways:
Estimating available and required green time by phase. Verifying whether signal timing parameters (e.g., splits) have been programmed correctly.
Exhibit A-3. Example Split Monitor Report (NC50: Benson Road/SR2728: Rand Road)

Kittelson & Associates, Inc., ITRE at NCSU 22 March 2019
A.3. PEDESTRIAN DELAY Pedestrian Delay shows how long a pedestrian must wait to receive a Walk indication after pushing the button; this information is summarized by phase for every cycle during a specified time period (see example in Exhibit A-4). While Pedestrian Delay does not show the number of pedestrians at an intersection, it does indicate how often pedestrians are requesting service. This report can also be used to identify if a pedestrian push button is malfunctioning. For example, if a pedestrian phase is timing even during low-volume periods (e.g., late at night), it may be an indication that there is a broken push button.
In order to generate the Pedestrian Delay chart, an intersection needs to have pedestrian push buttons for one or more movements. However, detection information does not have to be programmed into the system for the report to be generated.
This metric would be useful to NCDOT at intersections with high pedestrian activity. The number of intersections with high pedestrian activity may be limited, but no additional programming is required to access this report. Pedestrian Delay reports can be applied in the following ways:
Identifying intersections and/or phases with high pedestrian delay. Identifying push button failures causing pedestrian phases to time every cycle during low-volume
periods. Evaluating if pedestrian-specific treatments result in reduced delay.
Exhibit A-4. Example Pedestrian Delay Report (Source: Utah DOT)

Kittelson & Associates, Inc., ITRE at NCSU 23 March 2019
A.4. PREEMPTION DETAILS Some signals are configured so certain vehicles (e.g., emergency vehicles and trains) can preempt normal operations. For emergency vehicles, the signal often transitions quickly to give them a green indication, and for trains, the signal is programmed to clear the tracks of vehicles and prevent a new queue from forming. A Preemption Details report will include information on the following (see example in Exhibit A-5):
Preemption request times for all preempts. Preemption service times for all preempts. Preemption details for each preempt, including information about time to service, dwell time, and
when the preempt request terminated.
To obtain the Preemption Details report, an intersection must be set up for preemption, but no special configuration is required to generate the reports.
NCDOT would benefit from the ability to determine how often intersections are being preempted and if preemption settings are resulting in efficient operations. The number of intersections with preemption may be limited, but no additional programming is required to access this report. Preemption Details can be applied in the following ways:
Identifying intersections and/or phases with a high number of preemption events. Identifying intersections and/or phases with preemption events causing high delay for other
roadway users.
Exhibit A-5. Example Preemption Details Report (Source: Utah DOT)
Kittelson & Associates, Inc., ITRE at NCSU 24 March 2019
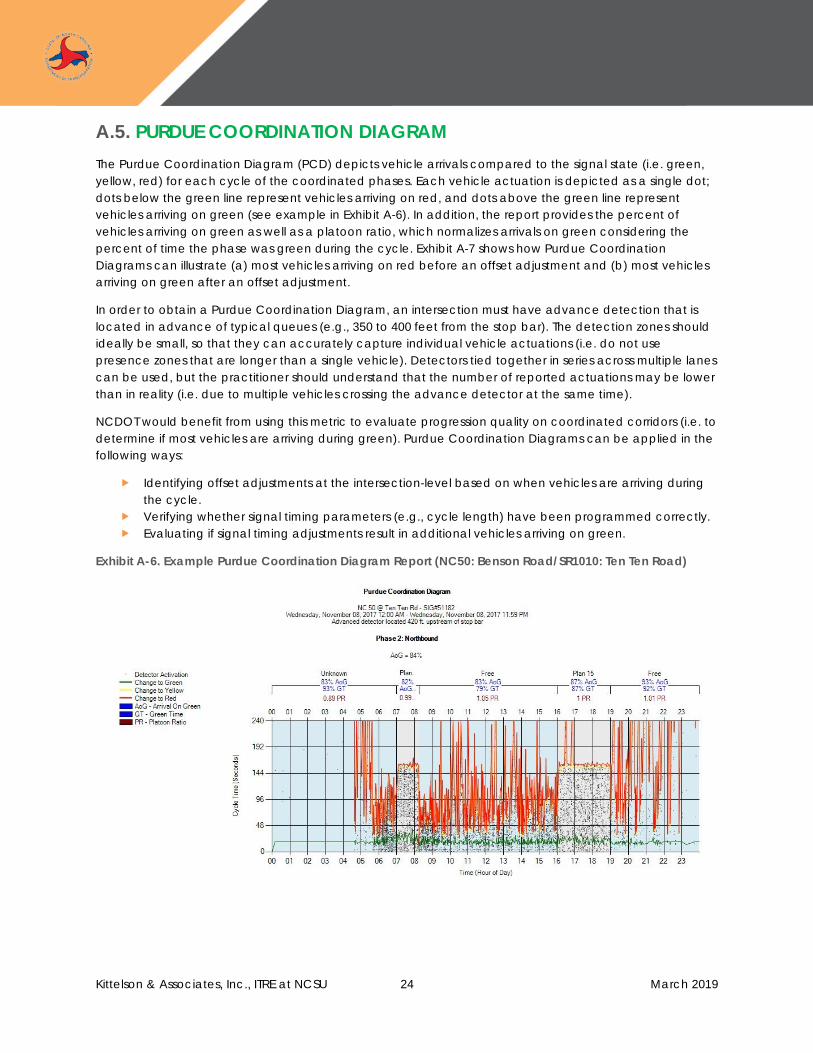
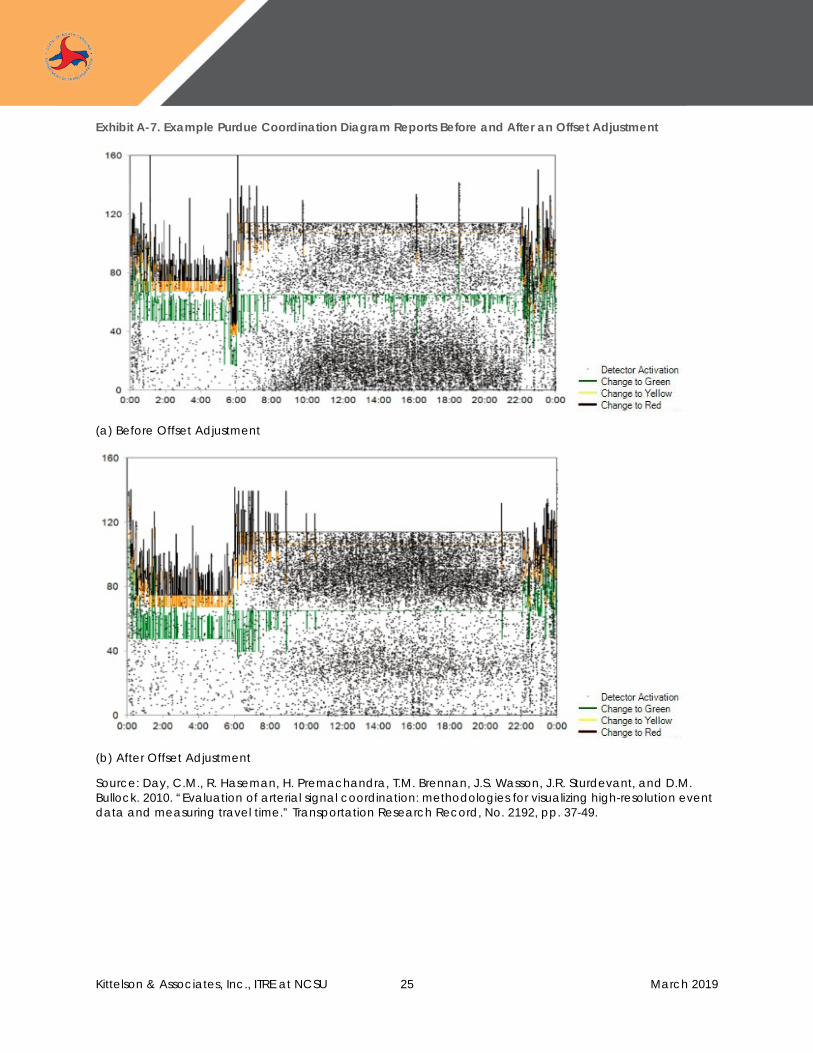
A.5. PURDUE COORDINATION DIAGRAM The Purdue Coordination Diagram (PCD) depicts vehicle arrivals compared to the signal state (i.e. green, yellow, red) for each cycle of the coordinated phases. Each vehicle actuation is depicted as a single dot; dots below the green line represent vehicles arriving on red, and dots above the green line represent vehicles arriving on green (see example in Exhibit A-6). In addition, the report provides the percent of vehicles arriving on green as well as a platoon ratio, which normalizes arrivals on green considering the percent of time the phase was green during the cycle. Exhibit A-7 shows how Purdue Coordination Diagrams can illustrate (a) most vehicles arriving on red before an offset adjustment and (b) most vehicles arriving on green after an offset adjustment.
In order to obtain a Purdue Coordination Diagram, an intersection must have advance detection that is located in advance of typical queues (e.g., 350 to 400 feet from the stop bar). The detection zones should ideally be small, so that they can accurately capture individual vehicle actuations (i.e. do not use presence zones that are longer than a single vehicle). Detectors tied together in series across multiple lanes can be used, but the practitioner should understand that the number of reported actuations may be lower than in reality (i.e. due to multiple vehicles crossing the advance detector at the same time).
NCDOT would benefit from using this metric to evaluate progression quality on coordinated corridors (i.e. to determine if most vehicles are arriving during green). Purdue Coordination Diagrams can be applied in the following ways:
Identifying offset adjustments at the intersection-level based on when vehicles are arriving during the cycle.
Verifying whether signal timing parameters (e.g., cycle length) have been programmed correctly. Evaluating if signal timing adjustments result in additional vehicles arriving on green.
Exhibit A-6. Example Purdue Coordination Diagram Report (NC50: Benson Road/SR1010: Ten Ten Road)
Kittelson & Associates, Inc., ITRE at NCSU 25 March 2019
Exhibit A-7. Example Purdue Coordination Diagram Reports Before and After an Offset Adjustment
(a) Before Offset Adjustment
(b) After Offset Adjustment
Source: Day, C.M., R. Haseman, H. Premachandra, T.M. Brennan, J.S. Wasson, J.R. Sturdevant, and D.M. Bullock. 2010. “Evaluation of arterial signal coordination: methodologies for visualizing high-resolution event data and measuring travel time.” Transportation Research Record, No. 2192, pp. 37-49.

Kittelson & Associates, Inc., ITRE at NCSU 26 March 2019
A.6. PURDUE LINK PIVOT Purdue Link Pivot is unique among the other metrics because it evaluates multiple signals along a coordinated corridor, rather than providing data on individual signal performance. This analysis methodology attempts to optimize offsets using predicted arrivals on green. The report not only recommends offset adjustments using the categories below (see example in Exhibit A-8) but also compares existing arrivals on green to predicted arrivals on green with the offset adjustments (see example in Exhibit A-9). The example shows results for three intersections along a corridor, but all coordinated intersections along a corridor should be included in the analysis.
Link Delta. Change in offset calculated for individual intersection to maximize arrivals on green. Edit Link Delta. Option to change the recommended offset adjustment based on local knowledge. Offset (+ to Offset). Ultimate change in offset calculated based on Link Delta and adjusting for the
relationship between intersections. Existing Offset. Option to type in the existing offset value so that a new offset value can be
calculated. New Offset. Resulting new offset based on recommended offset change and existing offset value.
In order to generate Purdue Link Pivot, consecutive traffic signals need to be equipped with advance vehicle detection (similar to other metrics like the Purdue Coordination Diagram). Link Pivot Routes must also be programmed, with signalized intersections placed in the correct order, so that upstream and downstream links can be identified for each intersection. Once a Route has been programmed and selected for analysis, a practitioner must also select the analysis time period (e.g., days of the week, times of day) and enter the associated cycle length (in seconds). If desired, a bias can be assigned to one direction, so that the arrivals on green in that direction are favored when identifying offset adjustments.
NCDOT typically uses advance detection on the major street, so Purdue Link Pivot is a worthwhile metric to evaluate. The ability to assess vehicle progression along an entire coordinated corridor can help identify offset adjustments but can also be used to quickly identify specific intersections to evaluate further using more detailed metrics at the intersection level (e.g., Purdue Coordination Diagrams). Purdue Link Pivot reports can be applied in the following ways:
Identifying offset adjustments at the corridor-level based on arrivals on green. Evaluating if signal timing adjustments result in additional vehicles arriving on green.
Exhibit A-8. Example Purdue Link Pivot Adjustments Table (Source: Utah DOT)

Kittelson & Associates, Inc., ITRE at NCSU 27 March 2019
Exhibit A-9. Example Purdue Link Pivot Approach Link Comparison (Source: Utah DOT)

Kittelson & Associates, Inc., ITRE at NCSU 28 March 2019
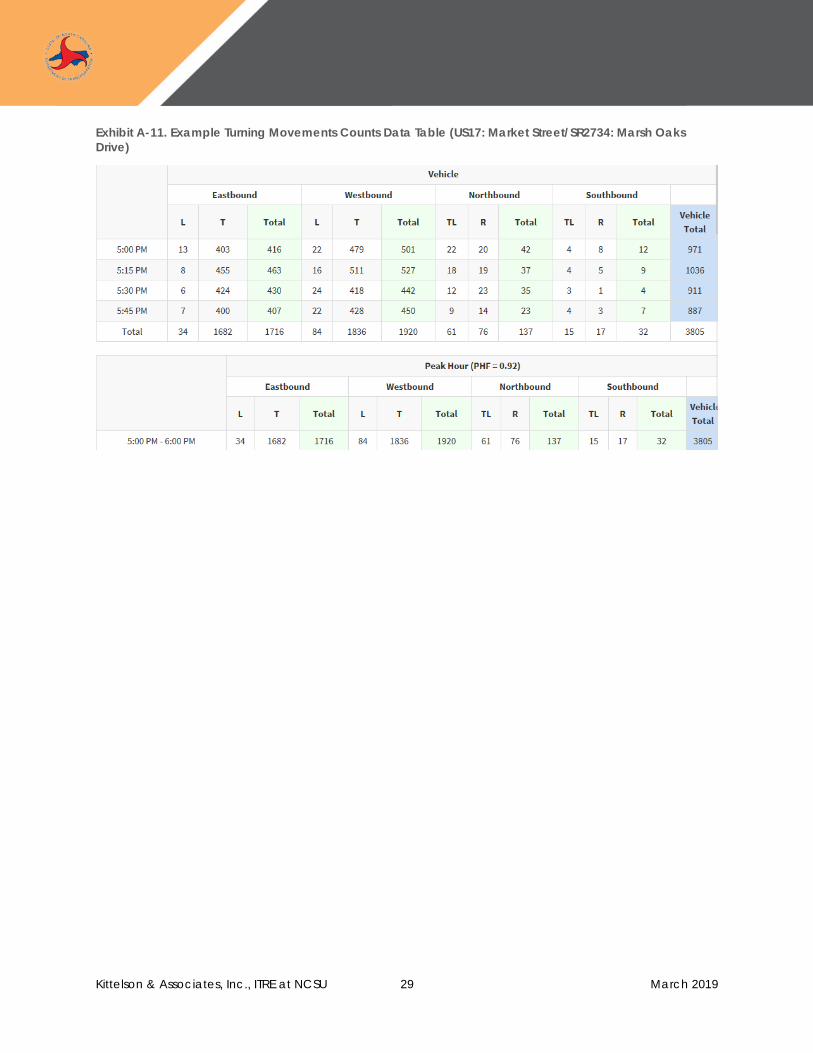
A.7. TURNING MOVEMENT COUNTS Turning Movement Counts report vehicle volumes by lane, as well as a sum of volumes for each lane group (e.g., left-turn, thru, or right-turn) (see example in Exhibit A-10). If bicycle detection exists, it can be reported separately from vehicle detection. The volumes can be put in different time interval bins (commonly 15 minutes), and a data table can be produced that reports volumes by the designated time interval (see example in Exhibit A-11).
Lane-by-lane detection is required to produce accurate volume profiles, but these reports can also be used to assess detector actuations being received on each detector channel. This can be helpful for pinpointing detector malfunctions. If accurate turning movement counts are desired, the detection zones should be small and capable of accurately detecting individual vehicles. The most-accurate detection zones will be placed past the stop bar so that vehicles do not queue over them, which is beyond the current NCDOT typical detection layout.
NCDOT may not have lane-by-lane detection available at most intersections but can benefit from using this report to assess detector health. Turning Movement Counts can be applied in the following ways:
Identifying detector failures by detector channel. Estimating if there is available capacity by phase.
Exhibit A-10. Example Turning Movement Counts Report (US17: Market Street/SR2734: Marsh Oaks Drive)
Kittelson & Associates, Inc., ITRE at NCSU 29 March 2019
Exhibit A-11. Example Turning Movements Counts Data Table (US17: Market Street/SR2734: Marsh Oaks Drive)

Kittelson & Associates, Inc., ITRE at NCSU 30 March 2019
A.8. PURDUE SPLIT FAILURE Purdue Split Failure reports how often vehicles are left unserved at the end of a phase, which correlates heavily to delay experienced by drivers (see example in Exhibit A-12). This chart displays Green Occupancy Ratios (GORs) and Red Occupancy Ratios (RORs), which report the percentage of a phase when a stop bar detector was occupied during the green interval and the first few seconds of red (commonly defined as the first five seconds of red), respectively. When both of these values are above 80%, a split failure is recorded, indicating that there were unserved vehicles at the end of the phase (i.e. vehicles were likely unable to make it through the intersection during a single phase).
In order to provide this metric, an intersection must have presence detection at the stop bar. It is ideal to have stop bar detection in all lanes, but most agencies only place stop bar detection on side streets and in left-turn lanes. With stop bar detection in all lanes, a practitioner can identify if there are phases that have a higher percentage of split failures than others and also if it is possible to adjust green times. If only some of the phases have stop bar detectors, it will be more difficult to determine which phases have green time to spare. However, an agency can supplement with other reports (e.g., Purdue Phase Termination) to estimate available capacity. Note that if stop bar detectors are tied together (i.e. report to a single channel), occupancy may be overestimated.
The Purdue Split Failure metric could be useful to NCDOT because of its ability to track whether the distribution of green time matches vehicle demand. This metric will be most accurate at intersections with lane-by-lane stop bar presence detection on all approaches, but in most scenarios, the typical NCDOT detection schemes (Detection Configurations E and F in Section 4) will still produce split failure information that NCDOT can use to compare demand. Purdue Split Failure reports can be applied in the following ways:
Estimating available and required green time by phase. Identifying intersections, phases, and/or times of day experiencing split failures. Evaluating if signal timing adjustments result in fewer split failures.
Exhibit A-12. Example Purdue Split Failure Report (NC50: Benson Road/SR2728: Rand Road)

Kittelson & Associates, Inc., ITRE at NCSU 31 March 2019
A.9. APPROACH VOLUME Approach Volume displays vehicle volumes for each direction of travel (see example in Exhibit A-13), binned into specified time intervals (commonly 15 minutes). A chart is created for each direction pair (e.g., north/south, east/west) and each type of detection (i.e. advance and stop bar). A table of planning-level metrics is also produced using volumes from the specified time period, including peak hour factors, D values, and K values (see example in Exhibit A-14).
This metric provides the same type of volume information available through the TransLink32 detector data report. ATSPMs build on current central system capabilities, and the underlying database of high-resolution data allows for additional custom reports and alerts to be programmed.
This metric requires count detection, either at the stop bar or in advance of the intersection. Detection zones should be small and lane-by-lane for the most accurate counts. Although, larger detection zones or detection zones tied together in series (i.e. multiple detection zones reporting to a single channel) can be used if a practitioner is only interested in determining general peaking characteristics.
Similar to Turning Movement Counts, this chart will require more extensive detection than available at most intersections for accurate volumes. This chart will also have a limited impact on signal system decisions, but NCDOT could use it for planning efforts if available. Approach Volume reports can be applied in the following ways:
Identifying intersections with high vehicle volumes. Evaluating time-of-day plans. Estimating if there is available capacity at the intersection.
Exhibit A-13. Example Approach Volume Report (US17: Market Street/SR2734: Marsh Oaks Drive)

Kittelson & Associates, Inc., ITRE at NCSU 32 March 2019
Exhibit A-14. Example Approach Volume Data Table (US17: Market Street/SR2734: Marsh Oaks Drive)

Kittelson & Associates, Inc., ITRE at NCSU 33 March 2019
A.10. APPROACH DELAY Approach Delay reports how long vehicles must wait to receive a green indication (see example in Exhibit A-15). Similar to Pedestrian Delay, this metric is a simplified approach to estimating delay. It reports the total delay and average delay per vehicle for each phase, calculated as the amount of time between vehicle actuations (converted to arrival time at the stop bar) and when that phase receives a green indication. This delay metric does not consider start-up lost time, deceleration, or standing queues.
Approach Delay requires advance vehicle detection that is located in advance of typical queues (e.g., 350 to 400 feet from the stop bar). The detection zones should ideally be small, so that they can accurately capture individual vehicle actuations (i.e. do not use presence zones that are longer than a single vehicle). Detectors tied together in series across multiple lanes can be used, but the practitioner should understand that the number of reported actuations may be lower than in reality (i.e. due to multiple vehicles crossing the advance detector at the same time).
While Approach Delay may provide a useful metric for comparing to planning studies that utilize delay data, it is not a metric that will necessarily be used to make adjustments at a traffic signal. The simplified calculation has limitations on how well it reflects the driver experience. Approach Delay reports can be applied in the following ways:
Identifying intersections with high vehicle delay. Evaluating if signal timing adjustments result in reduced delay for before/after studies.
Exhibit A-15. Example Approach Delay Report (US17: Market Street/Commercial Drive)
Kittelson & Associates, Inc., ITRE at NCSU 34 March 2019
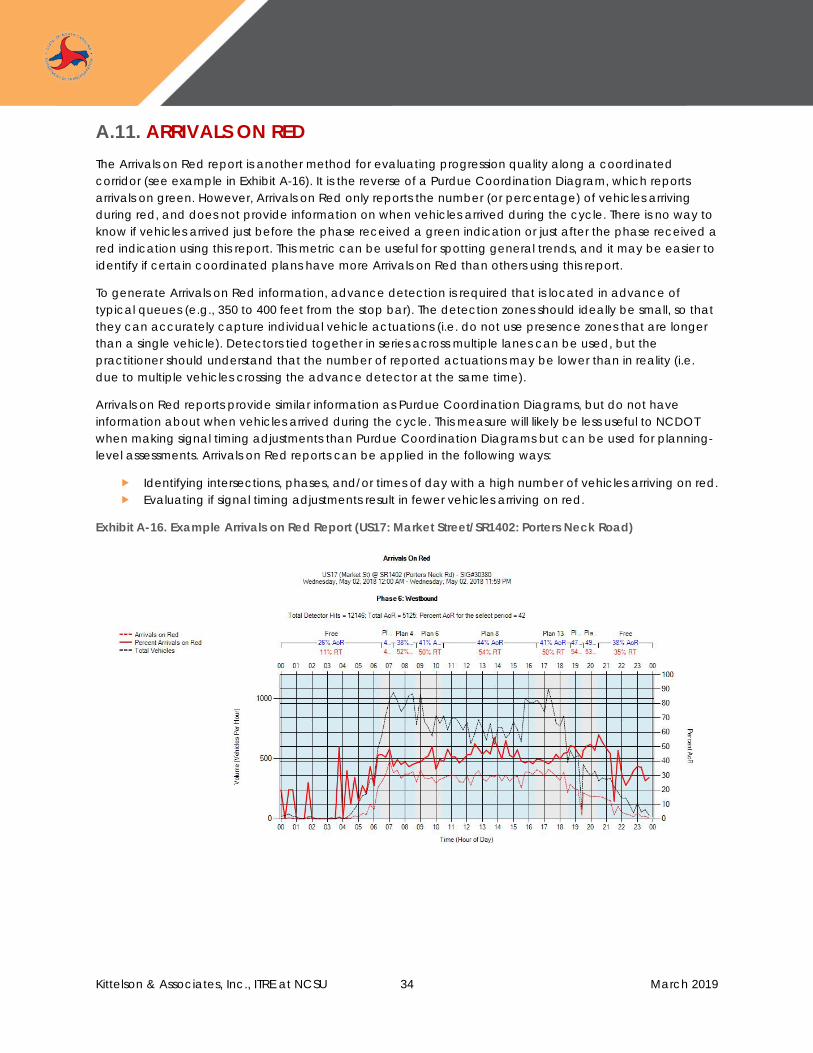
A.11. ARRIVALS ON RED The Arrivals on Red report is another method for evaluating progression quality along a coordinated corridor (see example in Exhibit A-16). It is the reverse of a Purdue Coordination Diagram, which reports arrivals on green. However, Arrivals on Red only reports the number (or percentage) of vehicles arriving during red, and does not provide information on when vehicles arrived during the cycle. There is no way to know if vehicles arrived just before the phase received a green indication or just after the phase received a red indication using this report. This metric can be useful for spotting general trends, and it may be easier to identify if certain coordinated plans have more Arrivals on Red than others using this report.
To generate Arrivals on Red information, advance detection is required that is located in advance of typical queues (e.g., 350 to 400 feet from the stop bar). The detection zones should ideally be small, so that they can accurately capture individual vehicle actuations (i.e. do not use presence zones that are longer than a single vehicle). Detectors tied together in series across multiple lanes can be used, but the practitioner should understand that the number of reported actuations may be lower than in reality (i.e. due to multiple vehicles crossing the advance detector at the same time).
Arrivals on Red reports provide similar information as Purdue Coordination Diagrams, but do not have information about when vehicles arrived during the cycle. This measure will likely be less useful to NCDOT when making signal timing adjustments than Purdue Coordination Diagrams but can be used for planning-level assessments. Arrivals on Red reports can be applied in the following ways:
Identifying intersections, phases, and/or times of day with a high number of vehicles arriving on red. Evaluating if signal timing adjustments result in fewer vehicles arriving on red.
Exhibit A-16. Example Arrivals on Red Report (US17: Market Street/SR1402: Porters Neck Road)

Kittelson & Associates, Inc., ITRE at NCSU 35 March 2019
A.12. APPROACH SPEED Approach Speed reports the posted speed limit, average speeds, and 85th-percentile speeds (see example in Exhibit A-17). This metric is useful for assessing if there are times of day when speeds change significantly and can be used as a proxy for travel time.
If using the open source code at this time, Approach Speed is only available using a Wavetronix Advance radar detector, which is capable of measuring vehicle speeds. Note that some vendors have external hardware options that collect probe data (i.e. through Bluetooth or WiFi) to calculate speeds and travel times.
Because of the required hardware, NCDOT will likely not benefit greatly from this metric. If there are locations with Wavetronix Advance radar detectors already installed, this metric can be used to assess overall corridor operations and can be helpful in before-and-after studies. Approach speed reports can be applied in the following ways:
Identifying intersections, phases, and/or times of day with high/low speeds. Adjusting signal timing parameters calculated using an assumed speed.
Exhibit A-17. Example Approach Speed Report (Source: Utah DOT)

Kittelson & Associates, Inc., ITRE at NCSU 36 March 2019
A.13. YELLOW AND RED ACTUATIONS Yellow and Red Actuations reports when vehicles enter an intersection during the yellow and red
intervals (see example in Exhibit A-18Evaluating if signal timing adjustments result in fewer vehicles running the red light.
Exhibit A-18). This metric is useful for determining if an intersection is experiencing a high number of red-light-running violations (i.e. vehicles entering the intersection on red) or severe violations (i.e. vehicles entering the intersection after the all-red interval).
This metric requires detection that can detect when vehicles enter the intersection. This can be accomplished through detection zones that are placed past the stop bar, or through detection zones at the stop bar with speed restrictions (i.e. that are capable of filtering vehicle actuations below a certain speed to identify vehicles that are stopping versus entering the intersection). The detection zones should be small enough to detect individual vehicle actuations.
NCDOT would benefit from using this metric at intersections that have higher crash rates or where red-light-running violations are a documented concern. However, there is a significant amount of unique detection required to track this metric. Yellow and Red Actuations reports can be applied in the following ways:
Identifying intersections and/or phases with high numbers of red-light-running vehicles and/or severe violations.
Evaluating if signal timing adjustments result in fewer vehicles running the red light.
Exhibit A-18. Example Yellow and Red Actuations Report (Source: Utah DOT)

Kittelson & Associates, Inc., ITRE at NCSU 37 March 2019
Appendix B | Detection Options Many ATSPMs compare vehicle arrivals to the signal state (i.e. green, yellow, red), so detector locations and sizes are a critical consideration in the deployment of ATSPMs. Exhibit B-1 summarizes detection requirements for each ATSPM described in Appendix A.
Exhibit B-2 through Exhibit B-5 illustrate common detection configurations and the resulting ATSPMs:
Detection Configuration A: No Additional Detection Detection Configuration B: Stop Bar Detection Detection Configuration C: Stop Bar & Advance Detection Detection Configuration D: All Detection
Exhibit B-6 and Exhibit B-7 illustrate the typical NCDOT detection layout with lane-by-lane detection and lane group detection, respectively. While lane-by-lane detection will provide more accurate vehicle actuations and occupancies and is preferred for all ATSPMs, lane group detection can still generate useful ATSPM reports. The NCDOT typical detector configuration has:
Stop bar presence detection on the minor street and in the left-turn lanes Advance detection on the major street
For best ATSPM results, it is recommended that NCDOT add stop bar presence detection in the major street through lanes.
Exhibit B-1. Detection Requirements
ATSPM
No Additional Detection Advance
Stop Bar Presence
Stop Bar Count Speed
Purdue Phase Termination Split Monitor Pedestrian Delay Preemption Details Purdue Coordination Diagram
Purdue Link Pivot
Turning Movement Counts
Purdue Split Failure
Approach Volume Approach Delay Arrivals on Red Approach Speed
Yellow and Red Actuations

Kittelson & Associates, Inc., ITRE at NCSU 38 March 2019
Exhibit B-2. Detection Configuration A: No Additional Detection

Kittelson & Associates, Inc., ITRE at NCSU 39 March 2019
Exhibit B-3. Detection Configuration B: Stop Bar Detection

Kittelson & Associates, Inc., ITRE at NCSU 40 March 2019
Exhibit B-4. Detection Configuration C: Stop Bar & Advance Detection

Kittelson & Associates, Inc., ITRE at NCSU 41 March 2019
Exhibit B-5. Detection Configuration D: All Detection

Kittelson & Associates, Inc., ITRE at NCSU 42 March 2019
Exhibit B-6. Detection Configuration E: Minor Stop Bar & Major Advance (Lane-by-Lane) (Current NCDOT Typical Detection Layout)

Kittelson & Associates, Inc., ITRE at NCSU 43 March 2019
Exhibit B-7. Detection Configuration F: Minor Stop Bar & Major Advance (Lane Groups)
Kittelson & Associates, Inc., ITRE at NCSU 44 March 2019
Appendix C | ATSPM Resources C.1. EARLY ADOPTERS ATSPMs have been in development for many years. The Indiana Department of Transportation (INDOT) was instrumental during the early days of signal performance measures, and their research resulted in the “de-facto” standard used for high-resolution data. This standard is used across traffic signal controller vendors, ensuring that all controllers are logging events using the same codes in the same structure.
Indiana Traffic Signal Hi Resolution Data Logger Enumerations http://docs.lib.purdue.edu/cgi/viewcontent.cgi?article=1002&context=jtrpdata
Between 2014 and 2016, INDOT led a Pooled Fund Study sponsored by ten state DOTs and the City of Chicago. This study resulted in the development of two complementary reports that summarize detailed information about signal performance measures, equipment requirements, and examples.
Performance Measures for Traffic Signal Systems: An Outcome-Oriented Approach http://dx.doi.org/10.5703/1288284315333 Integrating Traffic Signal Performance Measures into Agency Business Processes http://dx.doi.org/10.5703/1288284316063
C.2. UDOT OPEN SOURCE CODE
The Utah Department of Transportation (UDOT) utilized this previous research when developing their own open source system for downloading high-resolution data and producing visual reports of signal performance measures. Their system was eventually deployed statewide, and the visualizations serve as the basis for many ATSPM systems being developed today.
UDOT Automated Traffic Signal Performance Measures Website http://udottraffic.utah.gov/atspm/
While UDOT had always made their source code available to interested agencies, the source code was eventually uploaded to a website sponsored by the Federal Highway Administration (FHWA), making it readily available to agencies across the country. UDOT continues to coordinate monthly meetings with developers to refine the source code and periodically uploads new versions to the FHWA website.
FHWA Open Source Application Data Portal (OSADP) https://www.itsforge.net/index.php/community/explore-applications#/30/133

Kittelson & Associates, Inc., ITRE at NCSU 45 March 2019
C.3. NATIONAL IMPLEMENTATION FHWA is promoting ATSPMs as part of the fourth round of the Every Day Counts program (EDC-4), which is meant to identify and rapidly deploy proven but underutilized innovations. According to FHWA, “approximately 26 transportation agencies at both state and local levels are currently involved in implementing ATSPMs. The AASHTO Innovation Initiative led by the Utah DOT has resulted in early implementation of the technology in 12 states and a community of peers ready to share implementation experience.”
FHWA Every Day Counts https://www.fhwa.dot.gov/innovation/everydaycounts/edc_4/atspm.cfm AASHTO Innovation Initiative http://aii.transportation.org/Pages/AutomatedTrafficSignalPerformanceMeasures.aspx
There is also an NCHRP project currently being completed that will produce a guidance document about using signal performance measures as part of signal system management. The guidance will synthesize information about available performance measures and provide information to help an agency deploy them – leading the agency through system needs, configuration, verification, and validation.
NCHRP Project 03-122: Performance-Based Management of Traffic Signals http://apps.trb.org/cmsfeed/TRBNetProjectDisplay.asp?ProjectID=3985

Kittelson & Associates, Inc., ITRE at NCSU 46 March 2019
Appendix D | NCDOT Pilot Sites To explore the use of ATSPMs in North Carolina, four pilot sites were selected by NCDOT to test various combinations of data logging, ATSPM systems, and communication hardware. The four pilot sites are summarized in Exhibit D-1, followed by a description of each location. A variety of reports are available based on the ATSPM system (as discussed in Section 5 | What are the ATSPM System Options?), but only one example ATSPM is highlighted for each pilot site.
Exhibit D-1. NCDOT ATSPM Pilot Sites Location Controller Vendor ATSPM System Firmware Communication
US 401: Garner South Econolite Centracs® SPM ASC/3 LINUX Yes NC 55: Broad Street Trafficware SPM Cloud Trafficware Yes NC 50: Benson Road Econolite Open Source Code ASC/3 LINUX No (Raspberry Pi) US 17: Market Street Econolite Open Source Code ASC/3 LINUX No (Raspberry Pi)
D.1. US 401: GARNER SOUTH There were three intersections included in the US 401: Garner South pilot site (as shown in Exhibit D-2). These intersections have Econolite controllers with interconnect to a central office, allowing the Econolite Centracs® SPM system to be tested.
Exhibit D-2. US 401: Map of Pilot Site

Kittelson & Associates, Inc., ITRE at NCSU 47 March 2019
Exhibit D-3 and Exhibit D-4 summarize 24-hour flow rates for the northeast-bound and southwest-bound movements at the US 401 and Old McCullers Road / Donny Brook Road intersection, respectively. Flow rates were determined using advance detection on Phase 2 (northeast-bound direction) and Phase 6 (southwest-bound direction). The resulting volume profiles are useful for traffic signal timing engineers when evaluating time-of-day plans, but the flow rate information can also be used by planners when evaluating volume-to-capacity ratios and validating models.
A traffic signal timing engineer can use Exhibit D-3 and Exhibit D-4 to validate the duration of coordinated plans and prioritize the progression direction. The volume profiles indicate US 401: Garner South is a commuter corridor with heavy northeast-bound volumes in the morning (towards Raleigh) and heavy southwest-bound volumes in the afternoon (away from Raleigh). The morning peak is from approximately 6:00 a.m. to 9:00 a.m., and the afternoon peak is from approximately 4:00 p.m. to 7:00 p.m. Coordination plans should prioritize the northeast-bound direction during the morning peak and the southwest-bound direction during the afternoon peak.
Exhibit D-3. US 401: Northeast-bound Flow Rates
Exhibit D-4. US 401: Southwest-bound Flow Rates

Kittelson & Associates, Inc., ITRE at NCSU 48 March 2019
D.2. NC 55: BROAD STREET There were five intersections included in the NC 55: Broad Street pilot site (as shown in Exhibit D-5). These intersections have Trafficware controllers with interconnect to a central office, allowing the Trafficware SPM Cloud system to be tested.
Exhibit D-5. NC 55: Map of Pilot Site
Exhibit D-6 is a Purdue Phase Termination report that illustrates gap outs, max outs, force offs, and pedestrian phase activity at the NC 55 and James Slaughter Road intersection for one day. Phases 1,2, 6, and 8 are shown operating at this signalized intersection. As expected, Phases 2 and 6 are shown forcing off during the coordinated plans, but the phases gap out most of the day. Between 5:30 p.m. and 8:00 p.m., however, Phase 1 consistently experiences max-outs every cycle.
The Turning Movement Count report for the associated southbound left-turn movement is shown in Exhibit D-7. The reported volumes between 5:30 p.m. and 8:00 p.m. dip to zero, indicating a potential detection issue. If the southbound left-turn detection is malfunctioning, it would cause a constant call on Phase 1 resulting in max-outs every cycle. At 8:00 p.m., the southbound left-turn volumes return to normal. These reports indicate that the southbound left-turn detection should be monitored; if the issue persists, a work order should be issued to check for problems with the southbound left-turn detection.

Kittelson & Associates, Inc., ITRE at NCSU 49 March 2019
Exhibit D-6. NC 55: Purdue Phase Termination Report
Exhibit D-7. NC 55: Turning Movement Count Report

Kittelson & Associates, Inc., ITRE at NCSU 50 March 2019
D.3. NC 50: BENSON ROAD There were three intersections included in the NC 50: Benson Road pilot site (as shown in Exhibit D-8). These intersections have Econolite controllers and no interconnect to a central office. High-resolution data was collected using Raspberry Pi units and manually transferred to the Open Source Code system.
Exhibit D-8. NC 50: Map of Pilot Site
Exhibit D-9 and Exhibit D-10 are Purdue Split Failure reports for Phase 4 at the NC 50 and Rand Road intersection (which controls the eastbound left-turn movement) for one day before and after deployment of coordination along the NC 50 corridor, respectively. Split failures are reported for cycles with high occupancy ratios on the stop bar detection during green and the first five seconds of red. These high occupancy ratios indicate when there are likely vehicles that were not served during a single cycle.
Before the corridor was coordinated, there was a high number of split failures occurring during the morning peak (as shown in Exhibit D-9). The coordination plan increased the green time allocated to Phase 4. After the coordination plan was deployed, the number of split failures occurring during the morning peak decreased (as shown in Exhibit D-10). Traffic signal timing engineers can use these reports to validate that the increased green time resulted in fewer split failures. If there was still a high number of split failures during the morning peak, a traffic signal timing engineer might consider increasing the green time even more.

Kittelson & Associates, Inc., ITRE at NCSU 51 March 2019
Exhibit D-9. NC 50: Purdue Split Failure Report Before Coordination (and Increased Split)
Exhibit D-10. NC 50: Purdue Split Failure Report After Coordination (and Increased Split)

Kittelson & Associates, Inc., ITRE at NCSU 52 March 2019
D.4. US 17: MARKET STREET There were three intersections included in the US 17: Market Street pilot site (as shown in Exhibit D-11). These intersections have Econolite controllers and no interconnect to a central office. High-resolution data was collected using Raspberry Pi units and manually transferred to the Open Source Code system.
Exhibit D-11. US 17: Map of Pilot Site
Exhibit D-12 and Exhibit D-13 are Purdue Coordination Diagrams for Phase 2 at the US 17 and Porters Neck Road intersection (which controls the eastbound through movement) for one day before and after deployment of coordination along the US 17 corridor, respectively. Purdue Coordination Diagrams visualize when vehicles arrive during the cycle – on green, yellow, or red.
Before the corridor was coordinated, 59% of vehicles arrived on green (as shown in Exhibit D-12). After coordination was implemented, arrivals on green increased to 66% overall, with 70-74% of vehicles arriving on green during the afternoon peak (as shown in Exhibit D-13). Traffic signal timing engineers can use these reports to validate that coordination improved platooning and progression along US 17.
Traffic signal timing engineers can also use these reports to verify that the correct cycle lengths are timing during different times of day. Before the corridor was coordinated, the cycle length (represented by the

Kittelson & Associates, Inc., ITRE at NCSU 53 March 2019
red line) varied as the intersection was running free. After the corridor was coordinated, cycle lengths remained consistent and transitioned only at the end of each coordination plan.
Exhibit D-12. US 17: Purdue Coordination Diagram Before Coordination
Exhibit D-13. US 17: Purdue Coordination Diagram After Coordination

Kittelson & Associates, Inc., ITRE at NCSU 54 March 2019