Presenting the Socioeconomic Benefits of Coast Community College District Orange Coast College Costa...
22
Presenting the Socioeconomic Benefits of CoastCommunity College District Orange Coast College Costa Mesa, CA
-
Upload
adrian-merritt -
Category
Documents
-
view
214 -
download
1
Transcript of Presenting the Socioeconomic Benefits of Coast Community College District Orange Coast College Costa...

Presenting the Socioeconomic Benefits of
Coast Community College District
Orange Coast College Costa Mesa, CA

About the District
Governed by locally elected Board of Trustees
Three colleges Orange Coast College (Costa Mesa)
Golden West College (Huntington Beach)
Coastline Community College (District-wide) 60,000 students
300 degree and certificate programs offered

Economic Region

Economic Region

About the Study
• District, along with other OC CC’s, commissioned a study of the socioeconomic benefits of our colleges on our local region
• The Economic Contribution of the Orange County Community College Districts by CCbenefits, Inc. (affiliated with AACC)
• Economic impact model subjected to peer review and field-tested on over 500 different community colleges in US & Canada

Beginning with the Regional Analysis

District Operations Spending
District Operations: CCCD creates regional income through the earnings of its faculty and staff, as well as through its own operating and capital
expenditures.
Total Effect: After adjusting for tax payment effects, we can say
that CCCD operations annually contribute $74.9 million to regional
income in the local region.

Past-Student Productivity Effects
Direct Effect: Past students contribute an estimated $2.4 billion
worth of added income per year to the regional economy after leaving
CCCD.
Indirect Effect: The estimated multiplier effect of past student
productivity in other industries increases income by yet another $386.1 million.

Total Income in District Service Area
The defined economic region generated a total of $112.2 billion
in labor and non-labor income in FY 2004.
Of this, CCCD operations spending and past student productivity effects
accounted for $2.9 billion, or 2.6% of all regional income.

Investment Analysis
Continuing with the

Investment Analysis Component
The return to taxpayers for their support
• Broad taxpayer perspective • Narrow taxpayer perspective
The student benefits due to higher earnings
What we measured:
A broad collection of external social benefits
• Medical savings• Crime savings• Welfare and unemployment savings

This figure shows the present value of increased future earnings as a direct result of the students’ education.
This figure shows the present value of increased future earnings as a direct result of the students’ education.Student costs consist of the tuition paid by the students and, most
importantly, the opportunity cost of time (earnings foregone).
Student costs consist of the tuition paid by the students and, most importantly, the opportunity cost of time (earnings foregone).
Student Benefits
Higher earnings = $2.4 billion
Student costs = $492.1 million

Benefit/Cost Ratio: The ratio of benefits over costs. A 1.5 ratio, for example, means that every dollar invested will return a cumulative
$1.50 to the investor over the time period analyzed.
Criterion for feasibility: The B/C ratio must be greater
than or equal to 1.
Benefit/Cost Ratio: 5.0
Student Benefits
Higher earnings = $2.4 billion
Student costs = $492.1 million

Rate of Return: the average earning power of the money
used over the life of the investment. A 15% rate of return, for example, means that the revenues collected
over time will equal the costs, plus generate a 15% return.
Criterion for feasibility: the rate of return must exceed the returns from alternative uses
of the same money.
Rate of Return: 17.1%
Benefit/Cost Ratio: 5.0
Student Benefits
Higher earnings = $2.4 billion
Student costs = $492.1 million

Payback Period: This is the length of time needed from
the beginning of the investment before the
cumulative future revenues return all of the investments
made.
Payback Period: 8.3 yrs
Rate of Return: 17.1%
Benefit/Cost Ratio: 5.0
Student Benefits
Higher earnings = $2.4 billion
Student costs = $492.1 million

Student Benefits
Some Key Findings Achieving an Associate Degree from CCCD will increase earnings to $40,438
per year, or 35.3% more than the average high school graduate.
An Associate Degree graduate will earn $378,500 more than someone with a
high school diploma or GED over his or her future career.
Lifetime earnings will increase $4.95 for every dollar invested (tuition, fees, books, and foregone earnings).

Social Benefits
The medical, crime and welfare/unemployment savings are avoided costs, i.e., the reduced burdens on employers and
taxpayers. These external social benefits are generated annually as the education level of the workforce increases.
The medical, crime and welfare/unemployment savings are avoided costs, i.e., the reduced burdens on employers and
taxpayers. These external social benefits are generated annually as the education level of the workforce increases.
$7.3 million
$7.0 million
$3.2 million
$17.6 million
Aggregate
.
Medical Savings
Crime Savings
Total
Welfare/Unemployment Savings

The broad perspective: State taxpayers invest, but
beneficiaries are widely dispersed (students, business
community, society). We count all of the benefits
regardless of to whom they accrue.
Return to Taxpayers
Taxpayers Costs = State Appropriations + Property Taxes
Taxpayer Benefits = Higher Earnings + Social Benefits
Broad Taxpayer Perspective
Benefit/Cost Ratio: 17.3
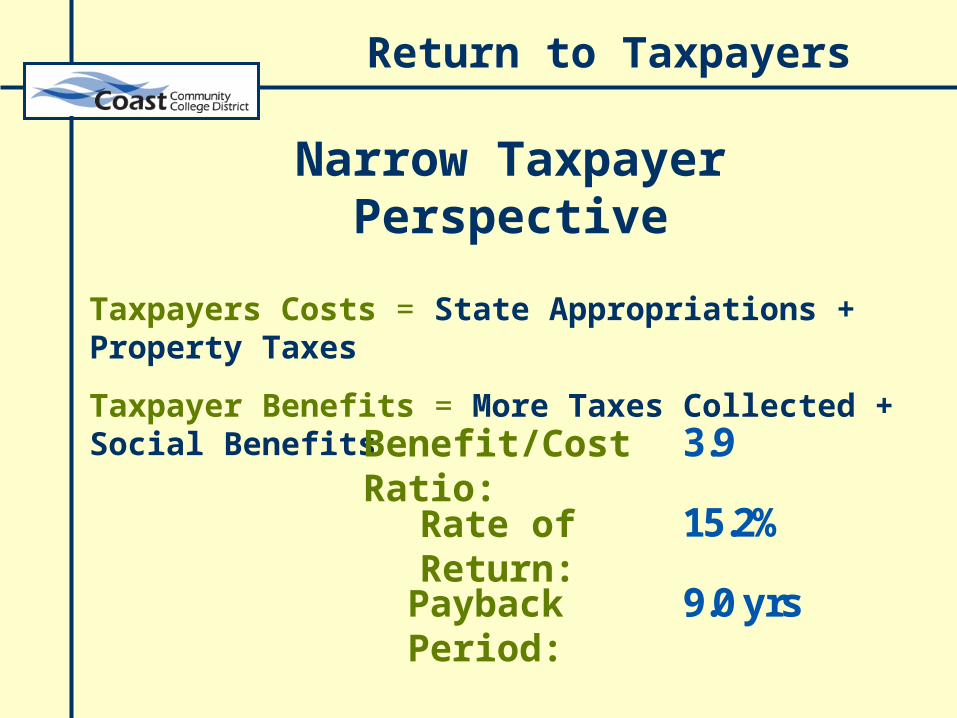
Return to Taxpayers
Taxpayers Costs = State Appropriations + Property Taxes
Taxpayer Benefits = More Taxes Collected + Social Benefits
Narrow Taxpayer Perspective
Payback Period:
Rate of Return:
Benefit/Cost Ratio: 3.9
15.2%
9.0 yrs

What does all this mean?

To Summarize…
IT PAY$ BACK:
IT PAY$ TO LEARN:
IT PAY$ TO INVEST:
The CCCD regional economy is measurably stronger
Taxpayers in the State of California are measurably better off
The CCCD students are measurably better off
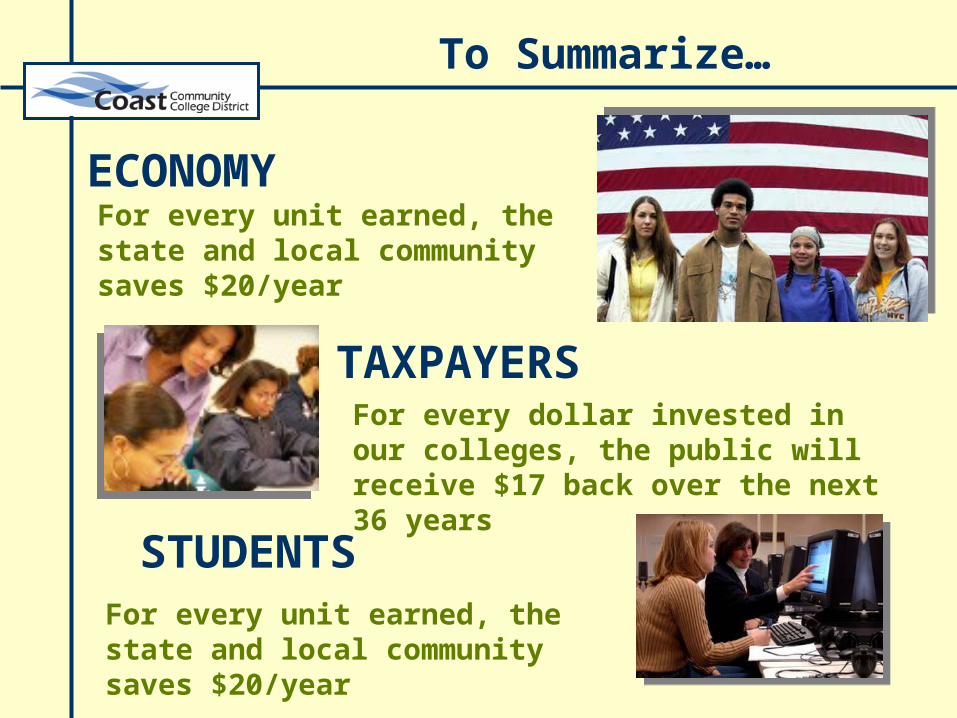
To Summarize…
ECONOMY
STUDENTS
TAXPAYERSFor every dollar invested in our colleges, the public will receive $17 back over the next 36 years
For every unit earned, the state and local community saves $20/year
For every unit earned, the state and local community saves $20/year


![HCAS HBK 2019[1] - Coast Mountain College · Coast Mountain College ! Admission’and’Program’Requirements’ ’ ’ AdmissionRequirements:’ • English11or’ equivalent’](https://static.fdocuments.in/doc/165x107/6011fae74d90b133a829dfc1/hcas-hbk-20191-coast-mountain-college-coast-mountain-college-admissionaandaprogramarequirementsa.jpg)